
ABSTRACT
Here we report a case of an 11-year-old girl with an inoperable tumor in the optic chiasm/hypothalamus, who experienced several tumor progressions despite three lines of chemotherapy treatment. Routine clinical examination classified the tumor as a BRAF-negative pilocytic astrocytoma. Copy-number variation profiling of fresh frozen tumor material identified two duplications in 9q21.32–33 leading to breakpoints within the GKAP1 and NTRK2 genes. RT-PCR Sanger sequencing revealed a GKAP1-NTRK2 exon 10–16 in-frame fusion, generating a putative fusion protein of 658 amino acids with a retained tyrosine kinase (TK) domain. Functional analysis by transient transfection of HEK293 cells showed the GKAP1-NTRK2 fusion protein to be activated through phosphorylation of the TK domain (Tyr705). Subsequently, downstream mediators of the MAPK- and PI3K-signaling pathways were upregulated in GKAP1-NTRK2 cells compared to NTRK2 wild-type; phosphorylated (p)ERK (3.6-fold), pAKT (1.8- fold), and pS6 ribosomal protein (1.4-fold). Following these findings, the patient was enrolled in a clinical trial and treated with the specific TRK-inhibitor larotrectinib, resulting in the arrest of tumor growth. The patient’s condition is currently stable and the quality of life has improved significantly. Our findings highlight the value of comprehensive clinical molecular screening of BRAF-negative pediatric low-grade gliomas, to reveal rare fusions serving as targets for precision therapy.
Introduction
Tumors of the brain and central nervous system (CNS) are the most common solid tumors in children between the ages of 0–14,Citation1 and are currently the leading cause of death from cancer in this age group in the USA.Citation2 When the World Health Organization (WHO) updated their classification of brain tumors in 2016, several genetic parameters were also included to facilitate accurate diagnosis and treatment regimen.Citation3 Low-grade glioma (LGG), classified as grade I and II by WHO, is the most frequent (accounting for around 30–40%) of brain tumors in children.Citation1,Citation2 Pilocytic astrocytoma (PA), grade I, represents approximately 25% of pediatric brain tumors in this age group.Citation2 Other pediatric LGG (pLGG) includes ganglioglioma, diffuse astrocytoma, dysembryoplastic neuroepithelial tumor and subependymal giant cell astrocytoma.Citation2,Citation4 Glioma is a very heterogeneous group of tumors which can be challenging to diagnose by histopathological examination alone.Citation5 However, in conjunction with the advancement of genomic techniques and an increased understanding of molecular biology, these tumors can be more accurately diagnosed and treated.Citation4,Citation6 pLGG is usually managed by complete surgical resection, but this is not always feasible for deep seated or highly infiltrative tumors, e.g. optic glioma, where radical surgical resection are associated with high risk for morbidity.Citation7,Citation8 To date, progressive residual disease from pLGG is treated with adjuvant chemotherapy or radiation, which may cause long-lasting morbidity and permanent psychosocial and physical dysfunction and, particularly for radiation, result in increased mortality.Citation9,Citation10
Gene fusions resulting from chromosomal rearrangements are common, accounting for around 60% of pLGG. The most prevalent gene fusion is KIAA1549-BRAF, frequently arising through focal gain of a 2Mb region in 7q34,Citation11,Citation12 which comprise 30–40% of pLGG and is significantly enriched in PA.Citation4 Rearrangements involving other fusion partners with BRAF have been reported in rare cases (around 2%).Citation13–17 Also, 40% of pLGG are driven by point-mutations where BRAFV600E is the most prevalent, followed by mutations in FGFR1.Citation4 Furthermore, children with certain predisposition syndromes, i.e. neurofibromatosis 1 and tuberous sclerosis, have an increased risk for development of specific types of LGG.Citation18–20 Mutations within the mitogen activated protein kinase (MAPK) pathway is generally found to be mutually exclusive (i.e. a single genetic event within the canonical pathway) in pLGG cases, and is therefore proposed as the common denominator leading to increased cell growth and proliferation in these tumors types.Citation4,Citation16,Citation21
Among fusion-driven pLGG, around 30% are BRAF-negative though involving other tyrosine kinases e.g. FGFR1, FGFR2, NTRK1/2/3, ROS1, ALK, MYB, and MYBL1.Citation4,Citation16,Citation17,Citation22 Gene fusions involving neurotrophic tyrosine receptor kinase (NTRK) genes have been identified in various histological subtypes of pLGG, although at very low frequencies, and include all three paralogs; NTRK1,Citation23 NTRK2,Citation16,Citation17,Citation24,Citation25 and NTRK3.Citation17,Citation26 Fusion gene rearrangements are reported as the most common mechanisms of oncogenic activation of tropomyosin receptor kinases (TRKs) in cancer,Citation27 and are predicted to drive tumorigenesis via aberrant dimerization and/or autophosphorylation of the kinase domain, resulting in constitutive downstream ligand-independent activation of the RAS/MAPK and PI3K/AKT/mTOR pathways.Citation28,Citation29 Clinical trials, embracing glioma in children are underway, evaluating targeted therapies for these pathways.Citation30,Citation31 The growing consensus is that molecular analyses must be embedded in the tumor classification, and that the genetic information is increasingly essential for appropriate targeted therapy for each patient.Citation32
The objective of this study was to characterize the molecular alterations driving the pathogenesis in a pediatric patient with an inoperable tumor who had experienced multiple tumor progressions and several lines of chemotherapy treatments without complete remission. The aim was to identify any genetic aberrations that could dictate precision-based treatment using currently available clinical methods.
Materials and methods
Clinical routine analysis
Hematoxylin and eosin staining of FFPE tumor sections were performed for routine pathological examination and assessment of tumor cell morphology. BRAF-status (mutations and fusion genes) was assessed by Ion AmpliSeq Colon and Lung Cancer Research Panel v2 and IonS5XL sequencing (Thermo Fisher Scientific, Waltham, MA, USA), and interphase fluorescent in situ hybridization (FISH) with a dual color BRAF Break Apart Probe (Empire Genomics, Buffalo, NY, USA).
DNA and RNA extraction and cDNA synthesis
Fresh frozen tumor tissue (estimated 8 mg) was homogenized on TissueLyser LT (Qiagen, Hilden, Germany) at 30 Hz for 40s, and DNA was extracted with Qiagen DNeasy Blood & Tissue Kit (Qiagen) according to manufacturer’s instruction. The DNA was eluted in 20 µL low EDTA TE-buffer and DNA concentration (89 ng/µL) and quality (A260/A280 ratio was 1.96), was measured on a Lunatic spectrophotometer (Unchained Labs, Pleasanton, CA, USA). RNA was extracted from approximately 5 mg fresh frozen tumor tissue with SV Total RNA Isolation System (Promega, Madison, Wisconsin, USA) according to manufacturer’s instructions. Prior to extraction, the tissue was homogenized as described above, and the total-RNA was eluted in 20 µL nuclease free water. RNA concentration (2.54 ng/μL) was measured using DeNovix DS-11 Spectrophotometer (DeNovix, Wilmington, DE, USA), and RNA integrity (RIN = 2.0) was measured by Agilent 2200 TapeStation System (Agilent Technologies Inc., Santa Clara, CA, USA) using RNA ScreenTape Assay as per manufacturer’s instruction. cDNA synthesis was performed using 45.72 ng total-RNA with High-Capacity RNA-to-cDNA kit (Applied Biosystems, Waltham, Massachusetts, USA), run in a 40 µL reaction volume according to manufacturer’s instruction.
Microarray – copy number variation
Copy number variation (CNV) profiling was performed with high-density Affymetrix CytoScan HD single nucleotide polymorphism (SNP) arrays (Affymetrix, Santa Clara, CA, USA) comprising more than 2.6 million markers throughout the genome. Briefly, total genomic DNA (250 ng) was digested (NspI), ligated, PCR amplified, fragmented with DNase I, labeled with biotin and hybridized to a CytoScan HD array for 16–18 hrs. The hybridized probes were washed using the GeneChipTM Fluidics Station 450, and marked with streptavidin-phycoerythrin. The arrays were scanned using a confocal laser scanner, GeneChip Scanner 3000 7 G (Affymetrix), and data was processed by the AGCC scan control software (to convert .DAT raw data files into .CEL files). Next, CEL files were analyzed and converted to CYCHP result files by Single Sample Analysis and Normal Diploid Analysis in the Chromosome Analysis Suit (ChAS) version 3.2 software (Thermo Fisher Scientific). The calling threshold of CNVs was set to the following: segment filter settings ≥100 kb with marker count ≥25, and CNV results were exported as text (Supplementary Table S1).
Reverse transcriptase PCR (RT-PCR)
Primers targeting the GKAP1-NTRK2 exon 10–16 fusion gene and NTRK2 wild type (wt) gene were designed from human genome reference transcripts NM_025211.3 (GKAP1) and NM_006180.4 (NTRK2) using ExonPrimer (https://ihg.helmholtz-muenchen.de/ihg/ExonPrimer.html) which is based on Primer3 (Supplementary Table S2). Primers were ordered from Life Technologies (Carlsbad, CA, USA). RT-PCR of the GKAP1-NTRK2 fusion fragment was performed using ExpandTM High Fidelity PCR system (Roche, Basel, Switzerland) according to the following: 5.6 µL of ExpandTM High Fidelity buffer 10x, 5.6 µL of 2 mM dNTPs, 4.2 µL of 10 pmol/µL forward and reverse primer, respectively, 30.5 µL of deionized water, 0.1 µL of ExpandTM High Fidelity enzyme (3.5 U/µL), and 4 µL cDNA into a total reaction volume of 55 µL. The NTRK2 wild type (wt) fragment was amplified using 3 µL cDNA in a total reaction volume of 22 µL with MyTaqTM DNA polymerase reagents (Bioline, Meridian BioScience, London, United Kingdom) according to manufacturer’s instructions. The PCR reactions were run in Veriti 96 Well Thermal Cycler (Applied Biosystems, Thermo Fisher Scientific) with the following temperature settings: 95°C 2 min, touchdown 65°-55°C 30s x20 cycles with a -0.5°C ramp rate per cycle and a final x15 cycles at 55°C 30s followed by 7 min at 72°C. Due to a very small original tumor sample, and hence low RNA concentration, an additional “nested PCR” was performed on the initial PCR product (8 µL) using the same PCR reagents, concentrations, and settings as described above. The PCR products (5 µL of the nested fusion PCR-product and 2 µL of the wt PCR-product) were run on an E-gel® EX 2% agarose using an E-gel® iBase Power system (Invitrogen, Thermo Fisher Scientific) with a 1kb ladder. The bands were visualized by SYBR Gold, and the gel was photographed with Alpha Imager Mini and analyzed in Alpha Manager v.3.2.2, 2011 (Alpha Innotech Corporation, San Leandro, CA, USA).
Sanger sequencing
The RT-PCR product was cleaned up with illustra ExoProStar 1-step (Thermo Fisher Scientific) according to manufacturer’s instructions. Sequencing reaction was performed in a total volume of 10 µL using the BigDye Terminator v3.1 Cycle Sequencing Kit (Applied Biosystems, Thermo Fisher Scientific) according to manufacturer’s instructions. Next, the sequencing product was precipitated in a 1:25 ratio of 3 M NaAc (pH 5,2) and 95% ethanol, then cleaned with 70% ethanol, and finally denatured in 13 µL HighDiTM formamide (Applied Biosystems, Thermo Fisher Scientific). The capillary electrophoresis was performed on an ABI 3500 Genetic Analyzer instrument with POP7 polymer (Applied Biosystems, Thermo Fisher Scientific), and sequence results were analyzed in Sequencing Analysis v.6.0 software (Thermo Fisher Scientific).
Fluorescent in situ hybridization – FISH
Interphase NTRK2 break apart FISH analysis was performed on formalin fixed paraffin embedded (FFPE) tissue sections (4 μm). Paraffin sections were pretreated in line with procedures recommended by Abbott, Vysis (Vysis Inc., Downers Grove, IL, USA), hybridized with a ZytoLight® SPEC NTRK2 Dual Color Break Apart Probe localizing to 9q21.32-q21.33 (ZytoVision GmbH, Bremerhaven, Germany), counterstained with 4ʹ, 6ʹ, -diamidino-2ʹ-phenylindole dihydrochloride (DAPI), and photographed using a Zeiss Axioplan 2 Imaging fluorescence microscope. One hundred interphase nuclei were counted by two independent reviewers (x50 nuclei each). The interpretation of intact (wt/normal), and split signals (fusion gene) were based on accepted international guidelines from the European Cytogeneticists Association.Citation33
Transient transfection and western blot
Human embryonic kidney cells (HEK293) were obtained from ATCC Cell Line Collection (Manassas, VA, USA). The cell line was maintained in DMEM supplemented with 10% FBS, 1% L-Glutamine, 1% HEPES solution and 1% sodium pyruvate. Cells were maintained at 37°C with 5% CO2. Three different constructs were generated using the pCMV6-Myc-DDK vector; pCMV6-NTRK2-Myc-DDK (NTRK2WT), pCMV6-GKAP1-NTRK2-Myc-DDK (GKAP1-NTRK2 fusion) and pCMV6-Myc-DDK (empty vector). The wild-type NTRK2 (NM_006180, 838 aa, #RC221794) and pCMV6 empty vector (#PS10000) constructs were ordered from Origene (Origene, Rockville, MD, USA). Vector construct for the GKAP1-NTRK2 exon 10–16 fusion (658 aa) was synthesized, subcloned and sequenced by Invitrogen GeneArt, Thermo Fisher Scientific. HEK293 cells were transfected in 6 well plates (1 × 10⁵ cells/well) with 4 µg of DNA complexed with 10 µL of Lipofectamine 2000 according to the Lipofectamine 2000 reagent transfection protocol (Invitrogen, Thermo Fisher Scientific).
After 48 hours from transfection, the cells were harvested, pelleted and protein was extracted by aspirating the media and incubating on ice for 5 minutes then adding ice cold RIPA buffer (Thermo Fisher Scientific, 89901). Protein lysates (50 µg/sample) were loaded onto Mini-PROTEAN® TGX™ 8–16% gradient gels (BioRad Laboratories, Hercules, CA, USA), protein was blotted onto LF-PVDF membrane (8 minutes, 25 V and 2.5 A) using a Trans-Blot® Turbo™ Transfer System (BioRad). Blots were subsequently blocked for 1 hour (hr) at room temperature (RT) in Superblock™ T20 (TBS) blocking buffer as per the manufacturer’s recommendations. Blots were run as two separate gels per experiment and probed overnight at 4 degrees with primary antibodies diluted in PBST (0.1% Tween-20 in PBS) as follows: gel A: Phospho-p44/42 MAPK (Erk1/2) (Thr202/Tyr204) (D13.14.4E) XP® (#4370, 1:1000, Cell Signaling, Danvers, MA, USA) (44 and 42 kDa), DDK tag (FLAG) (FG4R, 1:1000, Invitrogen), and hFAB Rhodamine anti-GAPDH (12004168, 1:2500, BioRad, Hercules, CA, USA) (37 kDa), gel B: p44/42 MAPK (Erk1/2) 137F5 (#4695, 1:1000, Cell Signaling) (44 and 42 kDa), p-Akt1/2/3 (Ser473 Akt1, Ser474 Akt2, Ser472 Akt3) (C-11) (sc-514032, 1:500, Santa Cruz Biotechnology, Dallas, TX, USA) (52 kDa) and Akt-1 (B-1) (sc-5298, 1:1000, Santa Cruz Biotechnology) (52 kDa), gel C: phospho-TrkB (Tyr705) Rabbit Polyclonal Ab (#PA5-38077, 1:1000, Invitrogen), S6 Ribosomal Protein (54D2) Mouse mAb (#2317, 1:1000, Cell Signaling Technology) (32 kDa), Phospho-S6 Ribosomal Protein (Ser235/236) (D57.2.2E) XP® Rabbit mAb (#4858, 1:2000, Cell Signaling Technology) (32 kDa) and anti-GAPDH (see gel A). After incubation with the primary antibodies the membranes were washed 3 × 10 minutes in TBST 0.1% (0.1% Tween-20 in tris-buffered saline). Secondary antibodies; Starbright B700 goat anti-rabbit (12004161, 1:5000, BioRad) and goat anti-mouse Alexa790 (A11357, 1:5000, Invitrogen) were incubated for 1 hr at RT. Transient transfection and Western blot analyses were performed in quadruplicates (i.e. as four independent experiments). Image detection was performed on ChemiDoc MP (BioRad) and band intensity was quantified using Image lab™ (version 6.0, BioRad). To adjust for the protein loading from the four different experiments and three gels (A-C), fluorescent band intensities in each sample were normalized against the intensity of total loaded protein from stain-free gel images. GAPDH was also included to visualize loading evenness in gel A and C. The ratio of normalized band intensities for phosphorylated proteins; pERK, pAKT, pS6, and pTRKB, relative to the normalized band intensities of total ERK, total AKT, total S6 and DDK protein quantities, respectively, were calculated for each sample. Finally, fold changes of ratios were calculated relative to the mean of NTRK2WT (Supplementary Table S3).
Statistical analysis
Normalized Western blot data were presented as a scatter plot of four independent experiments as data points with the mean thereof. Fold change differences were analyzed by Ordinary one-way ANOVA test followed by Dunnett´s multiple comparison test. Calculated significance; *p < .05, **p < .01, ***p < .001. All analyses were conducted using GraphPad Prism version 8.4.3 for Windows, (GraphPad Software, www.graphpad.com).
Immunohistochemistry – IHC
Tumor and non-neoplastic FFPE brain tissue sections (4 μm) were mounted on positively charged slides and dried in an oven at 56°-60°C for 1 hr. Deparaffinization, rehydration and antigen target retrieval were performed with Dako PT100 Link instrument using EnVision FLEX+, High pH (Link) reagents (both from Agilent), according to manufacturer’s instructions. Endogenous peroxidases were blocked by EnVision FLEX Peroxidase-Blocking Reagent (Dako) for 5 min incubation at RT. Thereafter, Dako Autostainer (Agilent) was used with an incubation of 60 min at RT with antibodies Phospho-p44/42 MAPK (Erk1/2) (Thr202/Tyr204) (D13.14.4E) XP® monoclonal rabbit antibody (pERK) (#4370, 1:1000, Cell Signaling) and phosphorylated-AKT (pAKT) monoclonal mouse antibody p-Akt1/2/3 (Ser473 Akt1, Ser474 Akt2, Ser472 Akt3) (C-11) (sc-514,032, 1:100, Santa Cruz Biotechnology). Tumor tissue with omitted primary antibody was used as negative control. Next, the slides were incubated at RT for 15 min with FLEX+Rabbit (LINKER) (Dako K8009) for pERK slides and FLEX+Mouse (LINKER) (Dako K8021) for pAKT slides, followed by a 20 min incubation with FLEX/HRP (Dako K8002) at RT. Diaminobenzidine (DAB) + Chromogen and Mayer’s Hematoxylin from the EnVision FLEX kit, was used for staining according to manufacturer’s instruction. The IHC slides were analyzed in a Nikon ECLIPSE E1000 light microscope, scanned at x400 magnification (10X ocular lens and a 40X objective lens), photographed with Jenoptik ProgRes C7 camera and digitalized with a NanoZoomer S210 (Hamamatsu Photonics, Hamamatsu City, Japan).
Clinical trial
The patient was enrolled in the phase I/II clinical trial LOXO-TRK-15003/Bayer No. BAY 2757556/20290 for pediatric patients (https://clinicaltrials.gov/ct2/show/NCT02637687), also called SCOUT, titled “A Phase 1/2 Study of the Oral TRK Inhibitor LOXO-101 in Pediatric Patients With Advanced Solid or Primary Central Nervous System Tumors”. The study is approved by Institutional Review Boards at all institutions that enroll patients and eligible patients provide written informed consent to participate. The study is conducted in accordance with the Declaration of Helsinki and Good Clinical Practice. Patients are treated with larotrectinib (Vitravki, BAY2757556) orally in continuous 28-day cycles. Phase I is to determine dose level safety, tumor response and pharmacokinetics in children. Phase II is to determine how well and how long different cancers respond to larotrectinib. This is a non-randomized interventional clinical trial with parallel assignment and open label. The estimated enrollment is 174 participants. The start date was December 16, 2015 and estimated completion date is September 26, 2026.
Results
Case presentation
A now 11-year-old girl was diagnosed at 1 year of age with a suprasellar tumor engaging the right optic nerve, optic chiasm and hypothalamus. The diagnosis of optic pathway glioma was based on the MRI-findings, and no tumor biopsy was performed initially (). After a period of observation, chemotherapy was initiated in November 2009, due to the suspicion of visual deterioration. The patient was included in the SIOP LGG 2004 randomized trial and was treated with vincristine, carboplatin and etoposide. After an allergic reaction, carboplatin was substituted with cisplatin/cyclophosphamide according to the study protocol. Primary chemotherapy was completed after 18 months, in May 2011, with a treatment response assessed as “stable disease”. After 6 months without therapy the tumor progressed, and a second-line of chemotherapy (weekly i.v. vinblastine for 12 months) was given. A period of stable disease followed, for about four years without therapy, before the tumor progressed again. A third treatment regime with weekly vinblastine was initiated. Due to continued tumor progression, vinblastine was substituted for irinotecan and bevacizumab after about 8 months. Despite this, tumor progression continued, causing further visual deterioration. Chemotherapy was suspended, and in July 2018 surgery was performed with the aim to partially debulk the tumor and to get diagnostic material for pathology assessment including BRAF-status (). Over the following 6 months no further therapy was given. The tumor progressed once again, this time causing hydrocephalus (due to tumor expansion into the third ventricle), necessitating surgical treatment with a ventriculoperitoneal (VP)-shunt and endoscopic septostomy. The need for additional treatment was indicated, and the choices considered were conventional chemotherapy, focal radiotherapy, or targeted therapy, given that a suitable biological target could be identified.
Figure 1. MR images and histology. (a) T2 weighted MR images in sagittal (left) and axial planes (right), just before initiation of first chemotherapy treatment (October 2009). Arrows are pointing at the tumor. Blue lines indicate the position of the corresponding plane. (b) MR image April 2018, 3 months before surgery. (c) [I] Hematoxylin and eosin staining of tumor sections demonstrate a biphasic pattern with compact (+) and dominating loose (*) areas. Tumor cells are well differentiated and have astrocytic morphology. In compact areas elongated bipolar cells with fine terminal processes (arrows) are seen. In loose areas stellate cells are common (arrowhead). [II] GFAP immunostaining was strong, and [III] Ki-67 proliferation labeling index was low (1.2–2.4%). Scale bar represents 100 µm
![Figure 1. MR images and histology. (a) T2 weighted MR images in sagittal (left) and axial planes (right), just before initiation of first chemotherapy treatment (October 2009). Arrows are pointing at the tumor. Blue lines indicate the position of the corresponding plane. (b) MR image April 2018, 3 months before surgery. (c) [I] Hematoxylin and eosin staining of tumor sections demonstrate a biphasic pattern with compact (+) and dominating loose (*) areas. Tumor cells are well differentiated and have astrocytic morphology. In compact areas elongated bipolar cells with fine terminal processes (arrows) are seen. In loose areas stellate cells are common (arrowhead). [II] GFAP immunostaining was strong, and [III] Ki-67 proliferation labeling index was low (1.2–2.4%). Scale bar represents 100 µm](/cms/asset/ab14bf55-c38b-40fa-bd17-0c8bced378c4/kcbt_a_1899573_f0001_oc.jpg)
Histologic examination showed an astrocytic tumor with low to moderate cellularity consisting of loosely packed elongated tumor cells with regular round or oval nuclei and fine processes. Microcysts contained material that showed discreet positivity in PAS-staining, and some small degenerative calcifications were present. Rosenthal fibers or eosinophilic granular bodies, as is classical for pilocytic astrocytoma, could not be seen. Necrosis or multinucleated cells were not present and mitoses were very few. Immunohistochemistry staining revealed strong positivity for GFAP, and Ki-67/MIB-1 proliferation index was 1.2–2.4% (). The histopathological examination classified the tumor as a pilocytic astrocytoma, WHO grade I. Routine clinical molecular analysis revealed the tumor to be negative for BRAF-fusion and BRAF V600E mutation.
Molecular analyses
Copy number variation (CNV) profiling, performed by SNP-microarray, using DNA from fresh frozen tumor material, revealed two adjacent gains in chr. 9q21.32–33; one 0.90Mb (chr.9:86.37–87.27Mb), and one 1.09Mb (chr.9:87.45–88.54Mb; ). These two gains lead to segmental breakpoints within two genes; GKAP1 and NTRK2 (). In addition, three smaller losses were detected; 129kb (9p21.1), 100kb (16p13.13), 122kb (19p12), but none of these lead to any breakpoints within genes (Supplementary Table S1). Reverse transcription PCR (RT-PCR) targeting the putative GKAP1-NTRK2 fusion generated a PCR-product length of 235bp (; Supplementary Table S2). Further characterization by Sanger sequencing, showed a fusion junction between GKAP1 exon 10 , and NTRK2 exon 16 (). These breakpoints lead to an in-frame fusion transcript of 1977bp (from the ATG start to the TAG stop codon), and a putative fusion protein of 658 amino acids, with GKAP1 coil-coil domains in the N-terminal and a retained tyrosine kinase domain from TRKB in the C-terminal (). The fusion gene was verified in FFPE tumor tissue sections by interphase FISH using break apart probes for NTRK2 (). Tumor cells showed a split signal pattern; two merged green/red (5ʹ/3ʹ) signals representing the two wildtype NTRK2 alleles, and one additional red (3ʹ) signal originating from the NTRK2-fusion gene (:II–III). The tumor tissue section also comprised a few normal cells displaying the wild-type NTRK2 pattern (two merged red/green signals; :I).
Figure 2. Microarray results. (a) Whole genome microarray profile (weighted log2) from CytoScanHD analysis in ChAS showing gains (red arrow) in chr. 9q and three smaller losses (blue arrow) in chr. 9, 16 and 19 (for details see Supplementary Table S1). (b) Smooth signal image of chr. 9 showing the two peaks of the gains. (c) Copy number state of chromosome region 9q21.32–33 leading to breakpoints within the GKAP1 and NTRK2 genes. (d) Schematic representation of genes located within the two gained regions, and estimated breakpoint positions in GRCh37/Hg19 according to the calling in ChAS
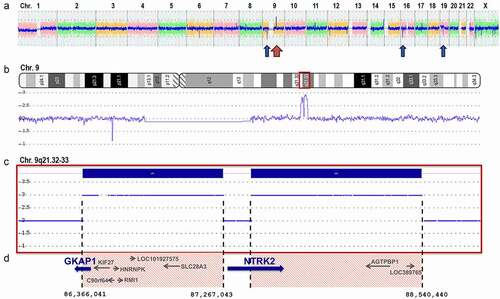
Figure 3. Sanger sequencing of the GKAP1-NTRK2 fusion transcript. (a) Picture of agarose gel with 1kb ladder showing the GKAP1-NTRK2 fusion gene fragment of 235 bp from the nested PCR (lane 1), the NTRK2 wt fragment of 251bp (lane 3), and non-template controls (NTC) for each PCR-reaction (lane 2 and 4). (b) Sanger sequence showing the fusion junction between GKAP1 exon 10 at position c.904 (NM_025211.3) and NTRK2 exon 16 at position c.1445 (NM_006180.4). Nucleotides and translation into amino acids is shown underneath the electropherogram. The junction generates an in-frame fusion transcript with a new serine amino acid at the breakpoint. (c) Illustration of the putative breakpoints in TRKB and GKAP1 proteins. The native TRKB protein (NP_006171.2, 838 amino acids (aa)) consists of 5 domains and 2 repeats; LRRNT (aa 32–61), LRR1 repeat (aa 92–113), LRR2 repeat (aa 116–137), LRRCT (148–196), Ig-like C2-type 1 (aa 197–282), Ig-like C2-type 2 (aa 295–365), and a tyrosine kinase (TyrKinase) domain (aa 538–807) in the C-terminal end (top illustration). The native GKAP1 protein (NP_079487.2, 366 aa) consists of three coiled-coil domains (aa 47–77, 128–160, and 243–353; middle illustration). The breakpoint position in GKAP1 (aa 301) and in TRKB (aa 357) is marked by a vertical dotted line. The GKAP1:TRKB putative fusion protein is 658 aa long and contains two coiled-coil domains from GKAP1 joined to the TyrKinase domain of NTRK2 (bottom illustration). Domains and positions are according to NextProt (http://www.nextprot.org)
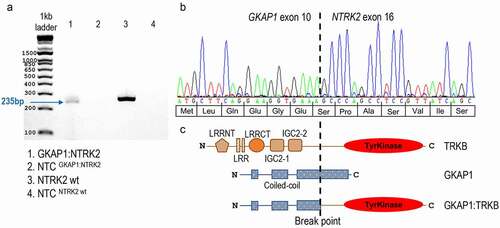
Figure 4. Interphase FISH break apart probe analysis of NTRK2 fusion. (a) Schematic representation of the ZytoLight® SPEC NTRK2 Dual Color Break Apart Probe (not to scale), consisting of a 720 kb 5ʹ green probe (g.86,569,621–87,287,312, ending in intron 4 NM_006180.4, hg19) and a 535 kb 3ʹ red probe (g.87,589,037– 88,124,082, starting in intron 19) in 9q21. (b) One normal fusion-negative cell [I] showing two wild type NTRK2 alleles displayed as two adjacent green (5ʹ)/red (3ʹ) signals (or merged yellow signal). One GKAP1-NTRK2 fusion-positive tumor cell [II] showing the split pattern; one normal NTRK2 allele with green/red (yellow) signal, as well as one 3ʹ NTRK2 split allele with red/green/red signal. Three GKAP1-NTRK2 fusion-positive tumor cells [III] showing the split pattern. All pictures are displayed as three panels; Merged (left), ZyOrange red channel (middle) and ZyGreen green channel (right). Tissue sections were counterstained with DAPI (blue nucleus staining). Original magnification x63
![Figure 4. Interphase FISH break apart probe analysis of NTRK2 fusion. (a) Schematic representation of the ZytoLight® SPEC NTRK2 Dual Color Break Apart Probe (not to scale), consisting of a 720 kb 5ʹ green probe (g.86,569,621–87,287,312, ending in intron 4 NM_006180.4, hg19) and a 535 kb 3ʹ red probe (g.87,589,037– 88,124,082, starting in intron 19) in 9q21. (b) One normal fusion-negative cell [I] showing two wild type NTRK2 alleles displayed as two adjacent green (5ʹ)/red (3ʹ) signals (or merged yellow signal). One GKAP1-NTRK2 fusion-positive tumor cell [II] showing the split pattern; one normal NTRK2 allele with green/red (yellow) signal, as well as one 3ʹ NTRK2 split allele with red/green/red signal. Three GKAP1-NTRK2 fusion-positive tumor cells [III] showing the split pattern. All pictures are displayed as three panels; Merged (left), ZyOrange red channel (middle) and ZyGreen green channel (right). Tissue sections were counterstained with DAPI (blue nucleus staining). Original magnification x63](/cms/asset/ddf1faf4-753a-4c85-8cde-8c68bf86bab4/kcbt_a_1899573_f0004_oc.jpg)
Functional analyses
The biological effect of the GKAP1-NTRK2-fusion was investigated in-vitro by Western blot (WB) analysis, and in primary tumor sections by immunohistochemistry (IHC). cDNA constructs of the GKAP1-NTRK2 fusion, NTRK2 wild type (NTRK2WT), and empty pCMV6-Myc-DDK vector were transiently transfected into HEK293 cells. Expression of the constructs was confirmed by four independent WB experiments with antibodies targeting DDK, detecting the GKAP1-TRKB-DDK protein at 60–75 kDa and the wild-type TRKB-DDK at 120 kDa (). TRKB tyrosine kinase activity was measured with antibodies targeting the phosphorylation site Tyr705, and could only be visually detected in the GKAP1-NTRK2 fusion positive constructs (as three bands in the 60–75 kDa range; ). The DDK bands corresponding to the GKAP1-NTRK2 fusion matched the size of phosphorylated TRKB bands. Calculating the phosphorylated TRKB (pTRKB) to DDK ratio (at 60 kDa for fusion and at 120 kDa for wild-type constructs) showed an approximately 2.8-fold higher activation of the kinase domain in the fusion protein (Supplementary table S3). Activation of the oncogenic MAPK and PI3K-pathways was determined by analysis of downstream effectors; phosphorylated Thr202/Tyr204 in ERK1/2 (pERK) for MAPK activation, phosphorylated AKT-Ser473 (pAKT), a key substrate of mTORC2 in the PI3K pathway, and phosphorylation of the downstream ribosomal protein S6 (pS6), positively regulated by PI3K/mTORC1 and MAPK/ERK.Citation28,Citation29 WB analysis showed a significant 3.6-fold upregulation of pERK/total ERK, a 1.8-fold upregulation of pAKT/total AKT, and a 1.4-fold upregulation of pS6/total S6 in the GKAP1-NTRK2 fusion gene constructs as compared to the NTRK2WT gene constructs (; Supplementary table S3). Moreover, the activation of the MAPK- and PI3K-pathways was confirmed in primary tumor FFPE sections from the current case by IHC of pERK and pAKT. Tumor cells displayed a very strong nuclear and to a lesser extent cytoplasmic pERK staining, as compared to a non-neoplastic brain control tissue. Also, the pAKT staining was strong in the nucleus of tumor cells, and some cells displayed additional perinuclear staining ().
Figure 5. Functional analysis with Western blot and IHC. (a) Western Blot imaging [I] of HEK293 transiently transfected constructs; empty vector (pCMV6-Myc-DDK; Vector), wild type (pCMV6-NTRK2-Myc-DDK; NTRK2WT) and fusion gene (pCMV6-GKAP1-NTRK2-Myc-DDK; GKAP1-NTRK2), probed with antibodies against DDK (TRKB-DDK at 120 kDa, and GKAP1-TRKB-DDK at 60–75 kDa), phosphorylated TRKB-Tyr705 (pTRKB; 120 kDa and 60–75 kDa), phosphorylated AKT1/2/3-Ser473/Ser474/Ser472 (pAKT; 52 kDa), total AKT (AKT; 52 kDa), phosphorylated ERK1/2-Thr202/Tyr204 (pERK; 44/42 kDa), total ERK1/2 (ERK; 44/42 kDa), phosphorylated ribosomal protein S6-Ser235/236 (pS6; 32 kDa), S6 ribosomal protein (S6; 32 kDa), and GAPDH (37 kDa). Blot shows representative band(s) from one out of four independent experiments. Scatter plot [II] show pERK/ERK, pAKT/AKT, and pS6/S6 protein quantity from four experiments calculated as fold change (FC) compared to the mean of NTRK2WT (empty vector = gray, wild type NTRK2WT = black, GKAP1-NTRK2 = red). Significance was determined using an Ordinary one-way ANOVA followed by Dunnett´s multiple comparisons test. *p < .05, **p < .01, ***p < .001, ns = not significant. (b) Immunohistochemistry (IHC) of FFPE sections from brain tissue with pERK and pAKT antibody. Brain tumor tissue from the GKAP1-NTRK2 fusion-positive case (left panel) show strong immunopositivity for pERK and pAKT in tumor cells, as compared to non-neoplastic brain parenchyma showing low or negative staining (right panel). Positive/Negative controls (middle panel); a PA case with confirmed KIAA1549-BRAF fusionCitation13 (upper panel), and a normal urothelial tissue (lower panel), show positive pERK and pAKT staining respectively. Negative control (with omitted primary antibody) shows negative staining in both control cases. Original magnification x400. Scale bar represents 50 µm
![Figure 5. Functional analysis with Western blot and IHC. (a) Western Blot imaging [I] of HEK293 transiently transfected constructs; empty vector (pCMV6-Myc-DDK; Vector), wild type (pCMV6-NTRK2-Myc-DDK; NTRK2WT) and fusion gene (pCMV6-GKAP1-NTRK2-Myc-DDK; GKAP1-NTRK2), probed with antibodies against DDK (TRKB-DDK at 120 kDa, and GKAP1-TRKB-DDK at 60–75 kDa), phosphorylated TRKB-Tyr705 (pTRKB; 120 kDa and 60–75 kDa), phosphorylated AKT1/2/3-Ser473/Ser474/Ser472 (pAKT; 52 kDa), total AKT (AKT; 52 kDa), phosphorylated ERK1/2-Thr202/Tyr204 (pERK; 44/42 kDa), total ERK1/2 (ERK; 44/42 kDa), phosphorylated ribosomal protein S6-Ser235/236 (pS6; 32 kDa), S6 ribosomal protein (S6; 32 kDa), and GAPDH (37 kDa). Blot shows representative band(s) from one out of four independent experiments. Scatter plot [II] show pERK/ERK, pAKT/AKT, and pS6/S6 protein quantity from four experiments calculated as fold change (FC) compared to the mean of NTRK2WT (empty vector = gray, wild type NTRK2WT = black, GKAP1-NTRK2 = red). Significance was determined using an Ordinary one-way ANOVA followed by Dunnett´s multiple comparisons test. *p < .05, **p < .01, ***p < .001, ns = not significant. (b) Immunohistochemistry (IHC) of FFPE sections from brain tissue with pERK and pAKT antibody. Brain tumor tissue from the GKAP1-NTRK2 fusion-positive case (left panel) show strong immunopositivity for pERK and pAKT in tumor cells, as compared to non-neoplastic brain parenchyma showing low or negative staining (right panel). Positive/Negative controls (middle panel); a PA case with confirmed KIAA1549-BRAF fusionCitation13 (upper panel), and a normal urothelial tissue (lower panel), show positive pERK and pAKT staining respectively. Negative control (with omitted primary antibody) shows negative staining in both control cases. Original magnification x400. Scale bar represents 50 µm](/cms/asset/1d94aaae-9510-4383-9268-dd97c60baf76/kcbt_a_1899573_f0005_oc.jpg)
Clinical outcome and therapeutic response
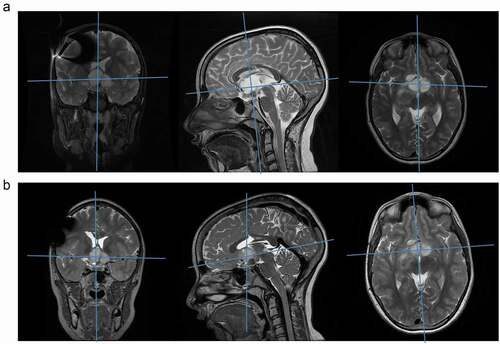
Based on the molecular findings and medical history of the patient, the HOPE/ITCC phase I/II clinical trial unit at Karolinska University Hospital, Stockholm, presented the case to the medical advisors of the SCOUT-TRK-15003/Bayer No. BAY 2757556/20290 phase I/II clinical trial for pediatric patients (https://clinicaltrials.gov/ct2/show/NCT02637687). The study includes children with advanced primary CNS – or solid tumors harboring a fusion involving NTRK1, NTRK2 or NTRK3. The patient was found to be eligible for the study and oral treatment with 100 mg larotrectinib twice daily, was initiated in February 2019. Treatment response was determined by radiology review according the Response Assessment in Neuro-Oncology (RANO) criteria in line with the protocol. The patient tolerated the larotrectinib very well and went back to school shortly after the commencement of treatment. Also, her vision improved, but it could not be determined whether this was due to larotrectinib or placement of the VP-shunt. The tumor evaluation with MRI of the brain showed a slight reduction in tumor size and a disappearance of initial contrast enhancement, i.e. stable disease (). At the latest follow up, 14 months after initiation of larotrectinib, there were no signs of impairment of growth or cognitive development.
Figure 6. MRI before and after larotrectinib treatment. (a) MR images just before initiation of larotrectinib (February 2019). T2 weighted MR images in (from left to right) coronal, sagittal and axial planes. Blue lines indicate the positions of the other planes, with the main tumor bulk at the intersection. (b) MR images at the most recent follow up, after 14 months of larotrectinib treatment (April 2020). T2 weighted MR images in (from left to right) coronal, sagittal and axial planes. Blue lines indicate the positions of the other planes, with the main tumor bulk at the intersection, showing stable disease (slight size reduction and disappearance of contrast enhancement)
Discussion
We report of an 11-year-old girl with a low-grade glioma within the optic chiasm/hypothalamus, having had multiple episodes of tumor progressions since her first diagnosis at 1 year of age. The identification of a GKAP1-NTRK2 fusion oncogene led to treatment with larotrectinib, resulting in stable disease for over 14 months and without side effects. In the light of previous recurrent progressions despite three lines of chemotherapy, this result should be considered most satisfactory, especially since the quality of life has substantially improved, for both patient and family.
The NTRK2 gene, encoding TRKB, is a transmembrane protein and a member of the tropomyosin receptor kinase (TRK) family (TRKA, B and C). TRK receptors are expressed in human neuronal tissue and play an essential role in the physiology, development and function of the nervous system. Ligand binding of brain-derived neurotrophic factor (BDNF) to the TRKB receptor results in homodimerization and auto-phosphorylation of the intercellular tyrosine kinase domain that consequently activates several oncogenic pathways, e.g. MAPK/ERK-, PI3K/AKT-, PCL1-γ and GTPases-signaling cascades, leading to proliferation, cell survival, migration, synapse development and plasticity.Citation34–36 The fusion partner of NTRK2 in the current case, GKAP1, encodes the G Kinase-Anchoring Protein 1, which function remains largely unknown. It has been reported to play a role in germ cell development through phosphorylation of Golgi-associated proteins,Citation37 and might also play a role in tumorigenesis.Citation38 The GKAP1 protein consists of three coiled-coil domains, and two of them were retained in the GKAP1-NTRK2 fusion discovered in this study.
Gene fusions involving NTRK genes lead to transcription of chimeric TRK proteins with constitutively activated, or overexpressed, kinase function, conferring their oncogenic potential. Previously reported NTRK2 fusions in low-grade glioma include AFAP1-NTRK2,Citation24 NACC2-NTRK2, QKI-NTRK2,Citation16 KANK1-NTRK2,Citation39 BRC-NTRK2Citation40 and PML-NTRK2.Citation35 Reviewing the literature, we found GKAP1-NTRK2 fusions listed in two recent screening studies; one in a pLGG tumor harboring a exon 9–15 fusion junction,Citation41 and another in an adult glioblastoma multiforme patient with the same exon 10–16 fusion junction as the one detected in this study.Citation42 However, no details about the disease course for these patients were provided. These two screening studies also concluded that gliomas have a relatively high number of NTRK fusions (up to 2%) compared to the overall frequency in other common solid cancers, and the NTRK2 isoform was seemingly more frequent in glioma tumor types, specifically in pediatric cases.Citation41,Citation42 Other studies have shown that NTRK fusions are more frequent in high-grade compared to low-grade pediatric glioma.Citation22,Citation43 The mechanism through which the fusion partner contributes to continuous activation of the tyrosine kinase (TK) domain remains rather unexplored. However, it has been noted that a predominant proportion of upstream fusion partners contain oligomerization domains, such as coiled-coil domains, zinc finger domains or WD repeats, that are thought to contribute to activation via dimerization and/or autophosphorylation of the kinase domain.Citation44–46 The fusion partner may also alter the expression of the TK domain and/or change the subcellular localization of the fusion product, exemplified by the FGFR–TACC3 fusion protein where TACC3 is responsible for the localization to the mitotic spindle poles.Citation47 In the current study, we show that the GKAP1-NTRK2 fusion gets activated through phosphorylation of the TK domain (Tyr705), leading to downstream endogenous activation of the MAPK and PI3K pathways. Hence, GKAP1 contribute to constitutive activation of the TK domain from TRKB in the absence of ligand, and probably dictates the location of the membrane-disconnected fusion protein to a different cellular compartment.
There are several tyrosine kinase inhibitors (TKIs) with varying degrees of activity and specificity against TRK-driven cancers.Citation48 Currently, larotrectinib is the most specific TRK inhibitor and was also approved by the FDA in 2018.Citation49 It is a selective ATP-competitive inhibitor of all three TRK kinases; TRKA, TRKB and TRKC.Citation50 To date, three trials have been reported with larotrectinib treatment; a phase I trial in adults (NCT02122913), a phase II trial involving adults and adolescents (NAVIGATE, NCT02576431), and the phase I/II trial for pediatric patients (SCOUT, NCT02637687) in which the current patient is included.Citation49,Citation51 Of note, while most patients included in these trials were treated for metastatic disease, several patients with locally advanced disease also responded. This suggests the potential utility of larotrectinib as neoadjuvant treatment, prior to surgery in children with TRK fusion-driven cancer,Citation52 and might be an optimal alternative to the conventional chemotherapy and radiotherapy that unfavorably affect the growth and development of children. Also, the ongoing larotrectinib trials will gather more data of long-term toxicity and the chances of when to successfully stop treatment. In the SCOUT trial, there is an option to stop treatment after two years, with the possibility to reintroduce larotrectinib in case of renewed progression or relapse.
In contrast to solid tumors in adults, which are predominantly driven by point-mutations, the majority of pediatric tumors are characterized by CNVs and structural rearrangements that result in gene fusions.Citation22,Citation53 Moreover, gene rearrangements in low-grade glioma are predominantly caused by copy-number gains and losses,Citation13,Citation16,Citation17,Citation54 making high-resolution SNP microarray an excellent tool to identify break points underlying gene fusions in a clinical setting.Citation53,Citation55,Citation56 The vast majority of fusion genes can also be detected by conventional FISH using break apart probes, and this method is indicative for a fusion gene irrespective of whether it is caused by a balanced or unbalanced rearrangement, and not dependent on prior knowledge of the fusion partner.Citation13 Nevertheless, the interpretation of FISH results can sometimes be difficult since FISH probes are relatively large (500-700 kb), and rearrangements can be complex and/or involve genes that are located closely to each other. The current FISH break apart analysis for NTRK2 was slightly challenging since GKAP1 and NTRK2 are located only 180 kb apart in 9q21.32–33. Indeed, the interphase FISH showed a clear additional 3ʹ signal located in close proximity to one of the merged wild-type signals, but also showed an enlarged green signal since the 5ʹ probe is also spanning the GKAP1 gene. The FISH pattern is therefore suggestive for an incorporation of the duplicated and fused segment in close proximity to the GKAP1 gene on chromosome 9. There are several pros and cons of different fusion gene detection strategies, and the hit-rate of finding the oncogenic fusion with the selected method depend on the nature of the specific rearrangement, and the quality of available tumor material. Since the vast majority of pLGG tumors harbor one single oncogenic driver which is often targetable, we suggest broader molecular screening methods to be used in clinical diagnostics for BRAF negative pLGG cases. Molecular testing decision algorithms for pLGG have been published, covering the most common genetic aberrations as well as the more uncommon.Citation57 While waiting for whole genome sequencing (WGS) to enter cancer diagnostics in clinical routine, we recommend such an algorithm to also include more rare aberrations in LGG e.g. ALK/ROS1/NTRK1/2/3 fusions, where targeted treatments are increasingly available.
Although the overall prevalence is relatively low, NTRK fusions occur in a wide range of neoplasms in adults and children.Citation58,Citation59 Due to the FDA approval and high response rate of TRK targeted therapy, recommendations for screening all pediatric tumors have been provided.Citation59,Citation60 The development of targeted therapies for oncogene-driven cancers has historically been histology-specific, and resulted in the approval of TKIs for single cancer types. New basket trials, in which patients are treated on the basis of gene abnormalities regardless of tumor type are ongoing and resulted in first approvals.Citation61 This together with early identification of oncogenic fusion genes in clinical diagnostics will strongly impact precision medicine for children with brain tumors.
Conclusion
We discovered a rare GKAP1-NTRK2 fusion gene in a pediatric low-grade glioma activating the MAPK and PI3K proliferation pathways. This led to precision treatment of the patient with larotrectinib resulting in tumor growth arrest. This report highlights the importance of molecular diagnostics as early as possible, preferably at primary diagnosis, or when standard treatment fails. Also, it emphasizes the importance of comprehensive clinical molecular screening for targetable fusions, as therapeutic agents for oncogenic pathways are expected to become increasingly available for children with brain tumors.
Authors’ contributions
Frida Abel and Magnus Sabel initiated the study. Frida Abel supervised the study. Lily Deland and Frida Abel drafted the manuscript. Magnus Sabel provided the clinical information, MRI images and informed consent from the patient. Lily Deland performed the microarray analysis, RT-PCR and Sanger sequencing. Simon Keane performed the in vitro transfections and Western blot experiments, supervised by Katarina Ejeskär. Thomas Olsson Bontell and Henrik Fagman analyzed and interpreted the histopathological and immunohistochemistry tumor sections. Helene Sjögren performed the FISH experiments. Magnus Tisell provided tumor samples and MRI images from surgery. Ingrid Øra and Esther De La Cuesta provided information regarding the larotrectinib clinical study. Jonas Nilsson supervised the immunohistochemistry experiments. All authors read and approved the manuscript.
Data Availability
The data that support the findings of this study are available from the corresponding author upon reasonable request.
Ethics approval and consent to participate
The patient and her parents provided written informed consent for the publication of this study and the Medical Ethics Committee of the Sahlgrenska University Hospital, Gothenburg, Sweden, approved the study.
Supplemental Material
Download Zip (19.5 KB)Acknowledgments
We would like to thank Carina Karlsson at the Sahlgrenska Cancer Center, University of Gothenburg, Sweden, for performing immunohistochemical experiments. The copy number variation microarray was performed at the clinical routine laboratory at Department of Clinical Genetics and Genomics, Sahlgrenska University Hospital, Gothenburg, Sweden.
Disclosure statement
The clinical study in which the patient was included was funded by Bayer Healthcare Pharmaceuticals and Loxo Oncology, a wholly owned subsidiary of Eli Lilly and Company.
Supplementary Material
Supplemental data for this article can be accessed on the publisher’s website.
Additional information
Funding
References
- Lannering B, Sandström PE, Holm S, Lundgren J, Pfeifer S, Samuelsson U. Classification, incidence and survival analyses of children with CNS tumours diagnosed in Sweden 1984-2005. Acta Paediatr. 2009;98(10):1620–1627. doi:10.1111/j.1651-2227.2009.01417.x.
- Ostrom QT, Cioffi G, Gittleman H, Patil N, Waite K, Kruchko C. CBTRUS statistical report: primary brain and other central nervous system tumors diagnosed in the United States in 2012-2016. Neuro Oncol. 2019;21(Suppl Supplement_5):v1–v100. doi:10.1093/neuonc/noz150.
- Louis DN, Perry A, Reifenberger G, Von Deimling A, Figarella-Branger D, Cavenee WK. The 2016 World Health Organization classification of tumors of the central nervous system: a summary. Acta Neuropathol. 2016;131(6):803–820. doi:10.1007/s00401-016-1545-1.
- Ryall S, Zapotocky M, Fukuoka K, Nobre L, Guerreiro Stucklin A, Bennett J. Integrated molecular and clinical analysis of 1,000 pediatric low-grade gliomas. Cancer Cell. 2020;37(4):569–83.e5. doi:10.1016/j.ccell.2020.03.011.
- Van Den Bent MJ. Interobserver variation of the histopathological diagnosis in clinical trials on glioma: a clinician’s perspective. Acta Neuropathol. 2010;120(3):297–304. doi:10.1007/s00401-010-0725-7.
- Pollack IF, Agnihotri S, Broniscer A. Childhood brain tumors: current management, biological insights, and future directions. J Neurosurg Pediatr. 2019;23(3):261–273. doi:10.3171/2018.10.PEDS18377.
- Wisoff JH, Sanford RA, Heier LA, Sposto R, Burger PC, Yates AJ. Primary neurosurgery for pediatric low-grade gliomas: a prospective multi-institutional study from the children’s oncology group. Neurosurgery. 2011;68(6):1548–1554. discussion 54–5. doi:10.1227/NEU.0b013e318214a66e.
- Farazdaghi MK, Katowitz WR, Avery RA. Current treatment of optic nerve gliomas. Curr Opin Ophthalmol. 2019;30(5):356–363. doi:10.1097/ICU.0000000000000587.
- Krishnatry R, Zhukova N, Guerreiro Stucklin AS, Pole JD, Mistry M, Fried I. Clinical and treatment factors determining long-term outcomes for adult survivors of childhood low-grade glioma: a population-based study. Cancer. 2016;122(8):1261–1269. doi:10.1002/cncr.29907.
- Merchant TE, Conklin HM, Wu S, Lustig RH, Xiong X. Late effects of conformal radiation therapy for pediatric patients with low-grade glioma: prospective evaluation of cognitive, endocrine, and hearing deficits. J Clin Oncol. 2009;27(22):3691–3697. doi:10.1200/JCO.2008.21.2738.
- Jones DT, Kocialkowski S, Liu L, Pearson DM, Bäcklund LM, Ichimura K. Tandem duplication producing a novel oncogenic BRAF fusion gene defines the majority of pilocytic astrocytomas. Cancer Res. 2008;68(21):8673–8677. doi:10.1158/0008-5472.CAN-08-2097.
- Pfister S, Janzarik WG, Remke M, Ernst A, Werft W, Becker N. BRAF gene duplication constitutes a mechanism of MAPK pathway activation in low-grade astrocytomas. J Clin Invest. 2008;118(5):1739–1749. doi:10.1172/JCI33656.
- Tomic TT, Olausson J, Wilzen A, Sabel M, Truve K, Sjogren H. A new GTF2I-BRAF fusion mediating MAPK pathway activation in pilocytic astrocytoma. PLoS One. 2017;12(4):e0175638. doi:10.1371/journal.pone.0175638.
- Helgager J, Lidov HG, Mahadevan NR, Kieran MW, Ligon KL, Alexandrescu S. A novel GIT2-BRAF fusion in pilocytic astrocytoma. Diagn Pathol. 2017;12(1):82. doi:10.1186/s13000-017-0669-5.
- Cin H, Meyer C, Herr R, Janzarik WG, Lambert S, Jones DT. Oncogenic FAM131B-BRAF fusion resulting from 7q34 deletion comprises an alternative mechanism of MAPK pathway activation in pilocytic astrocytoma. Acta Neuropathol. 2011;121(6):763–774. doi:10.1007/s00401-011-0817-z.
- Jones DT, Hutter B, Jager N, Korshunov A, Kool M, Warnatz HJ. Recurrent somatic alterations of FGFR1 and NTRK2 in pilocytic astrocytoma. Nat Genet. 2013;45(8):927–932. doi:10.1038/ng.2682.
- Zhang J, Wu G, Miller CP, Tatevossian RG, Dalton JD, Tang B. Whole-genome sequencing identifies genetic alterations in pediatric low-grade gliomas. Nat Genet. 2013;45(6):602–612.
- Seminog OO, Goldacre MJ. Risk of benign tumours of nervous system, and of malignant neoplasms, in people with neurofibromatosis: population-based record-linkage study. Br J Cancer. 2013;108(1):193–198. doi:10.1038/bjc.2012.535.
- Uusitalo E, Rantanen M, Kallionpää RA, Pöyhönen M, Leppävirta J, Ylä-Outinen H. Distinctive cancer associations in patients with neurofibromatosis type 1. J Clin Oncol. 2016;34(17):1978–1986. doi:10.1200/JCO.2015.65.3576.
- Bongaarts A, Van Scheppingen J, Korotkov A, Mijnsbergen C, Anink JJ, Jansen FE. The coding and non-coding transcriptional landscape of subependymal giant cell astrocytomas. Brain. 2020;143(1):131–149. doi:10.1093/brain/awz370.
- Jones DT, Gronych J, Lichter P, Witt O, Pfister SM. MAPK pathway activation in pilocytic astrocytoma. Cell Mol Life Sci. 2012;69(11):1799–1811. doi:10.1007/s00018-011-0898-9.
- Guerreiro Stucklin AS, Ryall S, Fukuoka K, Zapotocky M, Lassaletta A, Li C. Alterations in ALK/ROS1/NTRK/MET drive a group of infantile hemispheric gliomas. Nat Commun. 2019;10(1):4343. doi:10.1038/s41467-019-12187-5.
- Pehlivan KC, Malicki DM, Levy ML, Crawford JR. TPM3-NTRK1 fusion in a pleomorphic xanthoastrocytoma presenting with haemorrhage in a child. BMJ Case Rep. 2020;13(3). doi:10.1136/bcr-2020-234347.
- Mobark NA, Alharbi M, Alhabeeb L, AlMubarak L, Alaljelaify R, AlSaeed M. Clinical management and genomic profiling of pediatric low-grade gliomas in Saudi Arabia. PLoS One. 2020;15(1):e0228356. doi:10.1371/journal.pone.0228356.
- Qaddoumi I, Orisme W, Wen J, Santiago T, Gupta K, Dalton JD. Genetic alterations in uncommon low-grade neuroepithelial tumors: BRAF, FGFR1, and MYB mutations occur at high frequency and align with morphology. Acta Neuropathol. 2016;131(6):833–845. doi:10.1007/s00401-016-1539-z.
- Torre M, Jessop N, Hornick JL, Alexandrescu S. Expanding the spectrum of pediatric NTRK-rearranged fibroblastic tumors to the central nervous system: a case report with RBPMS-NTRK3 fusion. Neuropathology. 2018;38(6):624–630. doi:10.1111/neup.12513.
- Vaishnavi A, Le AT, Doebele RC. TRKing down an old oncogene in a new era of targeted therapy. Cancer Discov. 2015;5(1):25–34. doi:10.1158/2159-8290.CD-14-0765.
- Mendoza MC, Er EE, Blenis J. The Ras-ERK and PI3K-mTOR pathways: cross-talk and compensation. Trends Biochem Sci. 2011;36(6):320–328. doi:10.1016/j.tibs.2011.03.006.
- Vadlakonda L, Dash A, Pasupuleti M, Anil Kumar K, Reddanna P. The paradox of Akt-mTOR interactions. Front Oncol. 2013;3:165. doi:10.3389/fonc.2013.00165.
- Tateishi K, Nakamura T, Yamamoto T. Molecular genetics and therapeutic targets of pediatric low-grade gliomas. Brain Tumor Pathol. 2019;36(2):74–83. doi:10.1007/s10014-019-00340-3.
- Khotskaya YB, Holla VR, Farago AF, Mills Shaw KR, Meric-Bernstam F, Hong DS. Targeting TRK family proteins in cancer. Pharmacol Ther. 2017;173:58–66. doi:10.1016/j.pharmthera.2017.02.006.
- Packer RJ, Pfister S, Bouffet E, Avery R, Bandopadhayay P, Bornhorst M. Pediatric low-grade gliomas: implications of the biologic era. Neuro Oncol. 2017;19(6):750–761. doi:10.1093/neuonc/now209.
- Hastings R, Howell R, Bricarelli F D, Kristoffersson U, Cavani S. FISH on histological sections of solid tumors: E.C.A. Recommendations. E.C.A European Cytogeneticists Association Newsletter 29. 2012 Jan. [accessed 2020 Nov 2] https://www.e-c-a.eu/en/GUIDELINES.html
- Chetty R. Neurotrophic tropomyosin or tyrosine receptor kinase (NTRK) genes. J Clin Pathol. 2019;72(3):187–190. doi:10.1136/jclinpath-2018-205672.
- Pattwell SS, Konnick EQ, Liu YJ, Yoda RA, Sekhar LN, Cimino PJ. Neurotrophic receptor tyrosine kinase 2 (NTRK2) alterations in low-grade gliomas: report of a novel gene fusion partner in a pilocytic astrocytoma and review of the literature. Case Rep Pathol. 2020;2020:5903863. doi:10.1155/2020/5903863.
- Kowianski P, Lietzau G, Czuba E, Waskow M, Steliga A, Morys J. BDNF: a key factor with multipotent impact on brain signaling and synaptic plasticity. Cell Mol Neurobiol. 2018;38(3):579–593. doi:10.1007/s10571-017-0510-4.
- Yuasa K, Omori K, Yanaka N. Binding and phosphorylation of a novel male germ cell-specific cGMP-dependent protein kinase-anchoring protein by cGMP-dependent protein kinase Ialpha. J Biol Chem. 2000;275(7):4897–4905. doi:10.1074/jbc.275.7.4897.
- Donner I, Katainen R, Tanskanen T, Kaasinen E, Aavikko M, Ovaska K. Candidate susceptibility variants for esophageal squamous cell carcinoma. Genes Chromosomes Cancer. 2017;56(6):453–459. doi:10.1002/gcc.22448.
- Lopez GY, Perry A, Harding B, Li M, Santi M. CDKN2A/B loss is associated with anaplastic transformation in a case of NTRK2 fusion-positive pilocytic astrocytoma. Neuropathol Appl Neurobiol. 2019;45(2):174–178. doi:10.1111/nan.12503.
- Jones KA, Bossler AD, Bellizzi AM, Snow AN. BCR-NTRK2 fusion in a low-grade glioma with distinctive morphology and unexpected aggressive behavior. Cold Spring Harb Mol Case Stud. 2019;5(2). doi:10.1101/mcs.a003855.
- Torre M, Vasudevaraja V, Serrano J, Delorenzo M, Malinowski S, Pages M. Molecular and clinicopathologic features of gliomas harboring NTRK fusions. Acta Neuropathologica Communications. 2020;8(1):1–14. doi:10.1186/s40478-020-00980-z.
- Gatalica Z, Xiu J, Swensen J, Vranic S. Molecular characterization of cancers with NTRK gene fusions. Mod Pathol. 2019;32(1):147–153. doi:10.1038/s41379-018-0118-3.
- Wu G, Diaz AK, Paugh BS, Rankin SL, Ju B, Li Y. The genomic landscape of diffuse intrinsic pontine glioma and pediatric non-brainstem high-grade glioma. Nat Genet. 2014;46(5):444–450.
- Coulier F, Martin-Zanca D, Ernst M, Barbacid M. Mechanism of activation of the human trk oncogene. Mol Cell Biol. 1989;9(1):15–23. doi:10.1128/MCB.9.1.15.
- Schram AM, Chang MT, Jonsson P, Drilon A. Fusions in solid tumours: diagnostic strategies, targeted therapy, and acquired resistance. Nat Rev Clin Oncol. 2017;14(12):735–748. doi:10.1038/nrclinonc.2017.127.
- Huang YZ, McNamara JO. Mutual regulation of src family kinases and the neurotrophin receptor TrkB. J Biol Chem. 2010;285(11):8207–8217. doi:10.1074/jbc.M109.091041.
- Singh D, Chan JM, Zoppoli P, Niola F, Sullivan R, Castano A. Transforming fusions of FGFR and TACC genes in human glioblastoma. Science. 2012;337(6099):1231–1235. doi:10.1126/science.1220834.
- Cocco E, Scaltriti M, Drilon A. NTRK fusion-positive cancers and TRK inhibitor therapy. Nat Rev Clin Oncol. 2018;15(12):731–747. doi:10.1038/s41571-018-0113-0.
- Scott LJ. Larotrectinib: first global approval. Drugs. 2019;79(2):201–206. doi:10.1007/s40265-018-1044-x.
- Federman N, McDermott R. Larotrectinib, a highly selective tropomyosin receptor kinase (TRK) inhibitor for the treatment of TRK fusion cancer. Expert Rev Clin Pharmacol. 2019;12(10):931–939. doi:10.1080/17512433.2019.1661775.
- Laetsch TW, DuBois SG, Mascarenhas L, Turpin B, Federman N, Albert CM. Larotrectinib for paediatric solid tumours harbouring NTRK gene fusions: phase 1 results from a multicentre, open-label, phase 1/2 study. Lancet Oncol. 2018;19(5):705–714. doi:10.1016/S1470-2045(18)30119-0.
- DuBois SG, Laetsch TW, Federman N, Turpin BK, Albert CM, Nagasubramanian R. The use of neoadjuvant larotrectinib in the management of children with locally advanced TRK fusion sarcomas. Cancer. 2018;124(21):4241–4247. doi:10.1002/cncr.31701.
- Busse TM, Roth JJ, Wilmoth D, Wainwright L, Tooke L, Biegel JA. Copy number alterations determined by single nucleotide polymorphism array testing in the clinical laboratory are indicative of gene fusions in pediatric cancer patients. Genes Chromosomes Cancer. 2017;56(10):730–749. doi:10.1002/gcc.22477.
- Sievert AJ, Jackson EM, Gai X, Hakonarson H, Judkins AR, Resnick AC. Duplication of 7q34 in pediatric low-grade astrocytomas detected by high-density single-nucleotide polymorphism-based genotype arrays results in a novel BRAF fusion gene. Brain Pathol. 2009;19(3):449–458. doi:10.1111/j.1750-3639.2008.00225.x.
- Roth JJ, Santi M, Rorke-Adams LB, Harding BN, Busse TM, Tooke LS. Diagnostic application of high resolution single nucleotide polymorphism array analysis for children with brain tumors. Cancer Genet. 2014;207(4):111–123. doi:10.1016/j.cancergen.2014.03.002.
- Dougherty MJ, Tooke LS, Sullivan LM, Hakonarson H, Wainwright LM, Biegel JA. Clinical utilization of high-resolution single nucleotide polymorphism based oligonucleotide arrays in diagnostic studies of pediatric patients with solid tumors. Cancer Genet. 2012;205(1–2):42–54. doi:10.1016/j.cancergen.2012.01.014.
- Ryall S, Tabori U, Hawkins C. Pediatric low-grade glioma in the era of molecular diagnostics. Acta Neuropathol Commun. 2020;8(1):30.
- Hsiao SJ, Zehir A, Sireci AN, Aisner DL. Detection of tumor NTRK gene fusions to identify patients who may benefit from tyrosine kinase (TRK) inhibitor therapy. J Mol Diagn. 2019;21(4):553–571. doi:10.1016/j.jmoldx.2019.03.008.
- Albert CM, Davis JL, Federman N, Casanova M, Laetsch TW. TRK fusion cancers in children: a clinical review and recommendations for screening. J Clin Oncol. 2019;37(6):513–524. doi:10.1200/JCO.18.00573.
- Solomon JP, Benayed R, Hechtman JF, Ladanyi M. Identifying patients with NTRK fusion cancer. Ann Oncol. 2019;30(Suppl_8):viii16–viii22. doi:10.1093/annonc/mdz384.
- Yoshihara K, Wang Q, Torres-Garcia W, Zheng S, Vegesna R, Kim H. The landscape and therapeutic relevance of cancer-associated transcript fusions. Oncogene. 2015;34(37):4845–4854. doi:10.1038/onc.2014.406.