
ABSTRACT
Background
The function of long non-coding RNA (lncRNA) MALAT1 in regulating triple-negative breast cancer (TNBC) stemness and tumorigenesis was investigated.
Methods
Sphere formation and colony formation assays coupled with flow cytometry were employed to evaluate the percentage of CD44high/CD44low cells, and ALDH+ cells were performed to evaluate the stemness. Bisulfite sequencing PCR (BSP) was employed to detect the methylation level of MALAT1. Tumor xenograft experiment was performed to evaluate tumorigenesis in vivo. Finally, dual-luciferase reporter and RIP assays were employed to verify the binding relationship between MALAT1 and miR-137.
Results
Our results revealed that MALAT1 and BCL11A were highly expressed in TNBC, while miR-137 and DNMT1 were lowly expressed. Our results proved that MALAT1 positively regulated BCL11A expression through targeting miR-137. Functional experiments revealed that MALAT1 inhibited DNMT1 expression through acting on the miR-137/BCL11A pathway to enhance TNBC stemness and tumorigenesis. We also found that high MALAT1 expression in TNBC was related to the DNMT1-mediated hypomethylation of MALAT1. As expected, DNMT1 overexpression could remarkably inhibit TNBC stemness and tumorigenesis, which was eliminated by MALAT1 overexpression.
Conclusion
MALAT1 downregulated DNMT1 by miR-137/BCL11A pathway to enhance TNBC stemness and tumorigenesis; meanwhile, DNMT1/MALAT1 formed a positive feedback loop to continuously promote TNBC malignant behaviors.
1. Introduction
Breast cancer (BC) is the leading cause of cancer-associated mortality in women.Citation1 Triple-negative breast cancer (TNBC) refers to BC which is negative for estrogen, progesterone, and human epidermal growth factor receptor, with the characteristics of easy recurrence, metastasis and high mortality.Citation2–4 There is currently a lack of effective treatments for TNBC. Cancer stem cells (CSCs) are a small part of tumor cells with unlimited self-renewal ability, unlimited proliferation ability, ability to produce heterogeneous tumor cells and stronger migration and invasion capabilities.Citation5 The proportion of CSCs in TNBC is significantly higher than that of other subtypes, and much evidence has revealed that breast CSCs (BCSCs) are the main factor for the poor prognosis of TNBC.Citation6 Therefore, inhibition of tumor cell stemness has the potential to become an important approach for TNBC treatment.
Long non-coding RNA (lncRNA) refers to a noncoding single-stranded RNA longer than 200 nucleotides (nts).Citation7,Citation8 As widely reported, that lncRNAs dysregulation is closely related to TNBC cancer stemness. As proof, Wang et al. demonstrated that lncRNA THOR promoted the stem cell-like traits of TNBC by activating the β-catenin signaling.Citation9 Besides, lncRNA HLA-F-AS1 was reported to enhance stemness characteristics in TNBC.Citation10 LncRNA metastasis-associated lung adenocarcinoma transcription 1 (MALAT1) is identified as an oncogene in many human malignancies including TNBC.Citation11,Citation12 Specifically, MALAT1 expression was correlated with the prognosis of TNBC patients.Citation13 In addition, Zuo et al. revealed that MALAT1 could promote proliferation and invasion in TNBC through targeting miR-129-5p.Citation14 All the above evidence reveals that MALAT1 is a risk factor affecting TNBC progression; however, the role of MALAT1 in regulating cancer stemness in TNBC is still unknown. MicroRNAs (miRNAs) refer to non-coding single-stranded RNAs with a length of approximately 22 nts.Citation15 It has been widely confirmed that miRNA dysregulation is the main reason to promote the stem cell-like traits of TNBC. As proof, Yang et al. demonstrated that miR-155 promoted TNBC cell stemness through suppressing TSPAN5.Citation16 MiR-137 is identified as a tumor suppressor in different types of cancer.Citation17,Citation18 MiR-137 was also reported to be markedly downregulated in plasma of TNBC patients compared to normal controls, and its overexpression could suppress malignant behavior of MDA-MB-231 cells.Citation19 Therefore, it is suggested that miR-137 may act as an accessible biomarker for TNBC. However, the molecular mechanism of miR-137 in regulating TNBC cell stemness needs to be further probed. Herein, we found that there might be a direct relationship between MALAT1 and miR-137 through the prediction of the bioinformatics software (Targetscan, https://www.targetscan.org/vert_71/), suggesting that MALAT1 may achieve its biological function in regulating TNBC cell stemness through sponging miR-137.
B-Cell CLL/Lymphoma 11A (BCL11A), as a zinc-finger transcription factor, is proved to act as a key role in hemoglobin switching.Citation20 More importantly, BCL11A has also been reported as an oncogene of B-cell malignancies,Citation21,Citation22 but there have been few reports of BCL11A involved in solid tumors such as TNBC until recent years. As described, BCL11A was remarkably upregulated in TNBC, and its silencing could inhibit TNBC progression.Citation23 Interestingly, our previous study revealed that miR-137 could inhibit TNBC stemness through perturbing BCL11A-DNA methyltransferase 1 (DNMT1) interaction.Citation24 DNMT1 is responsible for DNA methylation of tumor-related genes.Citation25 As reported, DNMT1 is essential for maintaining TNBC stemness.Citation26 These evidences thus lead us to speculate that MALAT1 elevates BCL11A expression by absorbing miR-137, therefore promoting the formation of an active complex between BCL11A and DNMT1, and ultimately enhancing cancer stemness of TNBC. On the other hand, as previously reported, the high expression of MALAT1 in cancer depended on the reduction of methylation in its promoter region.Citation27 Considering that DNMT1 is a DNA methyltransferase, we have reason to believe that DNMT1 could regulate the expression of MALAT1 through methylation in TNBC, forming a malignant positive feedback loop, which has never been reported before.
Herein, we hypothesized that MALAT1 likely acted as an oncogene of TNBC, which could elevate BCL11A expression by absorbing miR-137, therefore promoting the formation of an active complex between BCL11A and DNMT1, and ultimately enhancing cancer stemness of TNBC. At the same time, free DNMT1 was bound by BCL11A, making the MALAT1 promoter region hypomethylated and the further increase in MALAT1 expression, which formed a malignant positive feedback loop.
2. Materials and methods
2.1. Clinical samples collection
A cohort of 48 BC tumor tissues composed of 26 non-TNBC tumor tissues and 22 TNBC tumor tissues as well as paired adjacent normal tissues were collected post-operatively from BC patients in the Xiangya Hospital of Central South University. The BC patients were clearly diagnosed and were not treated. This study was passed the review of Ethics Committee of the Xiangya Hospital of Central South University (Ethics approval No: 202003048), and all participants signed informed consent.
2.2. Cell culture and treatment
Human BC cells (MDA-MB-231, Hs578T, T47D, SKBR3, BT474, BT549, and MCF-7) and human breast epithelial cells (MCF‐10A) were obtained from ATCC (Manassas, Virginia, USA). All cells were cultured in DMEM (Gibco, Carlsbad, CA, USA) mixed with 10% FBS (Gibco) in with 5% CO2 at 37°C. Cells were treated with 20 µM CpG methyltransferase (M.SssI) (Thermo Fisher Scientific, Waltham, MA, USA) or 40 µM M.SssI for 24 h.
2.3. Cell transfection
The overexpression plasmid of DNMT1 (oe-DNMT1), the overexpression plasmid of MALAT1 (oe-MALAT1), the overexpression plasmid of DNMT1 (oe-DNMT1), the small interfering RNA of DNMT1 (si-DNMT1), the small interfering RNA of DNMT3A (si-DNMT3A), the small interfering RNA of DNMT3B (si-DNMT3B), the short hairpin RNA of MALAT1 (sh-MALAT1), and mimics/inhibitor of miR-137 and their negative controls were all obtained from GenePharma Co., Ltd (Shanghai, China), and transfected into cells with Lipofectamine™ 3000 (Invitrogen, CA, USA).
2.4. Bisulfite sequencing PCR (BSP)
DNA was isolated with the DNA isolation kit (QIAGEN, Valencia, CA, USA). Then genomic DNAs were treated with sodium bisulfite using the Bisulite kit (QIAGEN), then Bisulfite-sequencing analysis was performed with ABI3730XL sequencing machine.
2.5. Methylation specific PCR (MSP)
The cells were treated with sodium bisulfite. The MSP reaction system with a total volume of 20 μL consisted of 2 μL of template, 200 nmol/L each primer, 1× PCR buffer, 4 mmol/L MgCl2, 200 mmol/L dNTP and 1 U of Hot Star Taq DNA polymerase (Takara, Tokyo, Japan). The number of PCR cycles was adjusted to 40 cycles so that the amplification was within the linear range. The PCR conditions were ‘hot started’ at 95°C for 15 min, followed by 40 cycles of 94°C for 30 s, 51°C for 30 s, 72°C for 1 min, and with a final extension cycle of 72°C for 10 min. The products of MSP were analyzed by agarose gel electrophoresis containing ethidium bromide (EB).
2.6. Identification and isolation of CSCs by using flow cytometry
Cells were resuspended in PBS and stained with anti-CD24-FITC and anti-CD44-PE antibodies (eBioscience, San Diego, CA, USA) for 20 min. Samples were immediately analyzed using flow cytometry (BD Biosciences, San Diego, CA, USA). For CSCs isolation, cells were sorted on a flow cytometer (BD Biosciences).
2.7. Aldefluor assay
Cells were incubated with Aldefluor assay buffer containing ALDH substrate (5 μL, Stem Cell Technologies, Vancouver, BC, Canada) for 30 min at 37°C and immediately analyzed by flow cytometry. As a negative control, cells were subjected to 50 mmol/L diethylaminobenzaldehyde (DEAB) (Sigma-Aldrich, St Louis, MO, USA).
2.8. Colony formation assay
BC cells (1 × 10.Citation5/well or 3 × 10.Citation5/well) were seeded on six-well plates and stained with 0.1% crystal violet for 10 min (Sigma-Aldrich), and the colonies formed were counted manually.
2.9. Sphere formation assay
BC cells (2 × 10.Citation3/well or 6 × 10.Citation3/well) were cultured in DMEM‐F12 (Gibco) containing 10 μg/L bFGF, 20 μg/L EGF, and 2% B27 in ultra‐low adhesion plates (Corning, NY, USA). Spheres larger than 100 μm were counted with an inverted microscope (Nikon, Tokyo, Japan) after 2 weeks.
2.10. Dual-luciferase reporter assay
The fragment of human MALAT1 was amplified by PCR. Site-directed mutagenesis was performed using a site-directed mutagenesis kit (Stratagene, La Jolla, CA, USA). Wild type (WT) and mutant (mut) reporter plasmids of MALAT1 sequences were cloned into PGL3 vector (GenePharma). Then, cells were co-transfected with MALAT1-wt or MALAT1-mut plasmids and miR-137 mimics or mimics NC o by Lipofectamine™ 3000 (Invitrogen). The Luciferase activity was analyzed by a dual-luciferase reporter assay system (Promega, Madison, WI, USA).
2.11. Real-time quantitative polymerase chain reaction (RT-qPCR)
Total RNA was extracted with TRIzol (Beyotime, Shanghai, China). For mRNA and miRNA, the cDNA was synthesized by the HiFiScript cDNA synthesis kit (Life Technologies, CA, USA) and cDNA synthesis kit (Sangon, Shanghai, China), respectively. Then, SYBR (Thermo Fisher Scientific) was employed for RT-qPCR assay. GAPDH and U6 were used as the reference genes for mRNA and miRNA, respectively. Data were analyzed with 2−ΔΔCT method. The primers used in the study were listed as follows (5’-3’):
MALAT1 (F): TGCGAGTTGTTCTCCGTCTA
MALAT1 (R): TATCTGCGGTTTCCTCAAGC
miR-137 (F): ACACTCCAGCTGGGTTATTGCTTAAGAATAC
miR-137 (R): TGGTGTCGTGGAGTCG
BCL11A (F): ATGCGAGCTGTGCAACTATG
BCL11A (R): CAACACTCGATCACTGTGCC
DNMT1 (F): CCGACTACATCAAAGGCAGC
DNMT1 (R): AGGTTGATGTCTGCGTGGTA
CD44 (F): CTGCCGCTTTGCAGGTGTA
CD44 (R): CATTGTGGGCAAGGTGCTATT
ALDH (F): CACCTCGCTGGAGTACGGA
ALDH (R): CCATTCACATAGTGGCCCAAG
U6 (F): CGCTTCGGCAGCACATATAC
U6 (R): AAATATGGAACGCTTCACGA
GAPDH (F): TCAAGAAGGTGGTGAAGCAGG
GAPDH (R): TCAAAGGTGGAGGAGTGGGT
2.12. Western blot
Total proteins were extracted by using RIPA (Thermo Fisher Scientific), which were then transferred to a polyvinylidene fluoride (PVDF) membrane (Millipore, Temecula, MA, USA). The membranes were subsequently incubated overnight with antibodies against BCL11A (Abcam, Cambridge, MA, UK; 1:1000, ab19489), DNMT1 (Abcam, 1:1000, ab188453), CD44 (Abcam, 1:1000, ab189524), ALDH (Abcam, 1:1000, ab133306) and β-actin antibodies (Abcam, 1:1000, ab8226). After washed with PBST, membranes were then incubated with the corresponding secondary antibody (Abcam, 1:10000, ab7090) for 60 min. Protein bands were analyzed by an ECL detection kit (Beyotime).
2.13. Tumor xenograft in vivo
All BALB/c nude mice were purchased from SJA Laboratory Animal Co., Ltd (Hunan, China) (5 mice per group). A 0.2 mL of cell suspension containing different numbers of cells transfected with the corresponding vector was injected subcutaneously into the back of each mouse. The tumor volumes were calculated as follows: V = LW.Citation2/2. The animal studies were approved by Central South University (Ethics approval No: 2020sydw0097).
2.14. Immunohistochemistry (IHC)
The tumor tissues were fixed, decalcified, embedded in paraffin, and cut to a thickness of 4 μm. Following deparaffinization and antigen retrieval, sections were blocked and incubated with antibodies against Ki67 (Abcam, 1:200, ab15580), BCL11A (Abcam, 1:200, ab191401) and DNMT1 (Abcam, 1:200, ab188453) antibodies overnight followed by incubation with an appropriate secondary antibody (Abcam, 1:500, ab150077) for 1 h. The sections were stained with diaminobenzidine (DAB) and then counterstained with hematoxylin, dehydrated, and mounted. Then, the sections were observed with a microscope (Nikon).
2.15. RNA Immunoprecipitation (RIP)
Cells were lysed with a complete RIP lysis buffer (Millipore, MA, USA). Cell extract was then incubated with IgG (Abcam, 1:50, ab172730) and Ago2 (Abcam, 1:50, ab186733) antibody at 4°C overnight. RNA was purified from the complex. cDNA was synthesized and used for RT-qPCR assay. The fold enrichment of MALAT1 and miR-137 was analyzed as described by the manufacturer.
2.16. Data analysis
SPSS 19.0 (IBM, Armonk, NY, USA) software package was applied for statistical data analysis, and the measurement data were expressed as means ± standard deviation (SD). Between-group differences and multi-group comparisons were determined using Student’s t-test and one-way analysis of variance (ANOVA), respectively. P < .05 was considered to represent a significant difference. All the tests conducted in this work were repeated at least three times.
3. Results
3.1. MALAT1 and BCL11A expressions markedly increased in TNBC tissues and cells, while miR-137 and DNMT1 were significantly downregulated
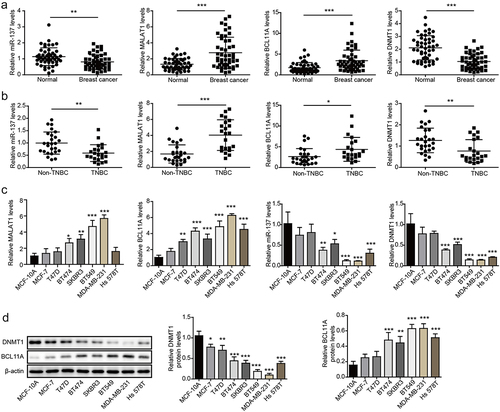
As displayed in , MALAT1 and BCL11A were significantly upregulated in BC tissues compared with those in the paired adjacent normal tissues, while miR-137 and DNMT1 were markedly downregulated. The expressions of these molecules in non-TNBC tumor tissues and TNBC tissues were subsequently examined, and the results showed MALAT1 and BCL11A expressions were significantly higher in TNBC tissues in comparison with that in non-TNBC tumor tissues, while miR-137 and DNMT1 were lowly expressed in TNBC tissues (). In addition, it was observed that MALAT1 and BCL11A were upregulated, while miR-137 and DNMT1 were downregulated in BC cells compared with MCF-10A cells, and we found that these differential expressions were the most obvious in TNBC cells (MDA-MB-231 and BT549), and the least obvious in MCF-7 and T47D (). As expected, decreased DNMT1 and increased BCL11A level were also observed in BC cells through Western blot (). Moreover, the prognostic values of these genes were also evaluated using Kaplan – Meier plotter database, and the results revealed that higher MALAT1 (Fig. S1A) and BCL11A (Fig. S1B) expressions were associated with poor survival and poor prognosis, while higher DNMT1 (Fig. S1C) and miR-137 (Fig. S1D) expressions were associated with high survival rate.In conclusion, MALAT1 and BCL11A were markedly upregulated in TNBC, while miR-137 and DNMT1 were significantly downregulated.
Figure 1. MALAT1 and BCL11A were markedly increased in TNBC tissues and cells, while miR-137 and DNMT1 were significantly downregulated. (a) MALAT1, miR-137, BCL11A and DNMT1 expressions in BC tissues and paired adjacent normal tissues were assessed using RT-qPCR (n = 48). (b) MALAT1, miR-137, BCL11A and DNMT1 expressions in non-TNBC tumor tissues (n = 26) and TNBC tissues (n = 22) were examined using RT-qPCR. (c) MALAT1, miR-137, BCL11A and DNMT1 expressions in human BC cells (MDA-MB-231, Hs578T, T47D, SKBR3, BT474, BT549 and MCF-7) and MCF‐10A cells were analyzed using RT-qPCR. (d) Western blot was employed to analyze BCL11A and DNMT1 levels in BC cells and MCF‐10A cells. The measurement data were presented as mean ± SD. All of the tests in this study were conducted for three times. *P < 0.05, ** P < 0.01, ***P < 0.001.
3.2. The high MALAT1 expression in TNBC was related to the hypomethylation of its promoter region
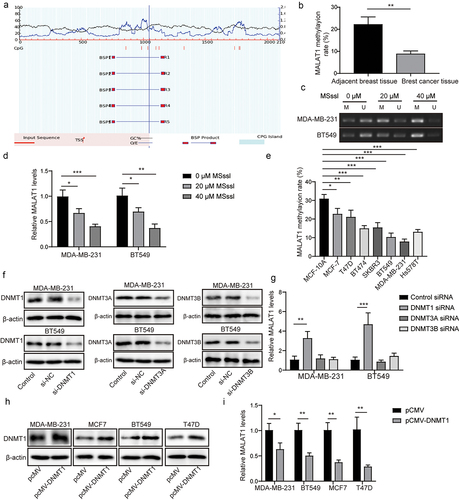
As previously reported, DNA methylation contributed to MALAT1 expression in lung cancer.Citation27 Herein, we aimed to probe whether the high MALAT1 expression in TNBC was dependent on the methylation. As displayed in , we found that CpG islands were located within 2 kb of the MALAT1 promoter by using Methprimer2 prediction (http://www.urogene.org/methprimer/index.html). Results of BSP displayed that the methylation level of MALAT1 in BC tissues was lower than that in adjacent tissues (). To analyze the methylation in regulation of MALAT1, we evaluated the effect of CpG methyltransferase (M.SssI) on MALAT1 methylation level and MALAT1 expression in TNBC cells. We found that M.SssI treatment resulted in increased MALAT1 methylation level () and decreased MALAT1 expression () in MDA-MB-231 and BT549 cells in a concentration-dependent manner. Additionally, the methylation level of MALAT1 in BC cells was lower than that in MCF-10A cells, and we found that the methylation level of MALAT1 in MDA-MB-231 and BT549 cells was the lowest among all BC cell lines (). Considering that DNMT1 was lowly expressed in TNBC, we speculated that the low methylation level of MALAT1 and the high MALAT1 expression in TNBC resulted from the low DNMT1 expression. It was observed that DNMT1/3A/3B protein levels in MDA-MB-231 and BT549 cells were significantly reduced by si-DNMT1/3A/3B transfection, suggesting that the transfection was successful (). As revealed in , MALAT1 expression was significantly increased following si-DNMT1 transfection, while MALAT1 expression did not change after si-DNMT3A/B transfection. Meanwhile, DNMT1 overexpression was induced in MDA-MB-231, BT549, MCF-7, and T47D cells by transfecting pCMV-DNMT1 into cells, and we found that the DNMT1 protein level in BC cells was markedly increased by pCMV-DNMT1 transfection (). Furthermore, MALAT1 expression in BC cells was significantly inhibited by DNMT1 overexpression (). All results suggested that the high MALAT1 expression in TNBC was related to the hypomethylation of MALAT1 promoter region, which was attributed to the low level of DNMT1.
Figure 2. The high MALAT1 expression in TNBC was related to the hypomethylation of its promoter region. (a) Methprimer2 (http://www.urogene.org/methprimer/index.html) was employed to predict the location of CpG islands in the MALAT1 promoter, and the schematic representation was presented. (b) the methylation level of MALAT1 in BC tissues and adjacent tissues were determined using BSP. MALAT1 methylation level (c) and MALAT1 expression (d) in MDA-MB-231 and BT549 cells after M.SssI (20 µM, 40 µM) treatment were evaluated by MSP and RT-qPCR, respectively. (e) BSP was employed to detect the methylation level of MALAT1 in BC cells and MCF‐10A cells. MDA-MB-231 and BT549 cells were transfected with si-NC, si-DNMT1, si-DNMT3A or si-DNMT3B, and DNMT1/3A/3B protein levels (f) and MALAT1 expression (g) were assessed using western blot and RT-qPCR, respectively. DNMT1 protein level (H) and MALAT1 expression (i) in MDA-MB-231, BT549, MCF-7 and T47D cells after pCMV or pcmv-DNMT1 transfection were assessed by western blot and RT-qPCR, respectively. The measurement data were presented as mean ± SD. All of the tests in this study were conducted for three times. *P < 0.05, ** P < 0.01, ***P < 0.001.
3.3. MALAT1 silencing inhibited the stemness of TNBC cells, and MALAT1 overexpression promoted the stemness of TNBC cells
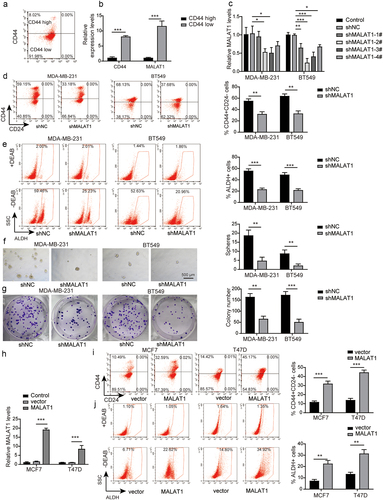
As well known, CD44+ is generally an accepted marker of BCSCs, we first successfully sorted the top 10% cell subsets with CD44 high expression and CD44 low expression by flow cytometry (). We found that MALAT1 was highly expressed in the subgroups with CD44 high expression, while it was lowly expressed in the subgroups with CD44 low expression (), suggesting that MALAT1 affected the stemness of TNBC. To further probe the role of MALAT1 in regulating the stemness of TNBC, MDA-MB-231 and BT-549 cells with the highest MALAT1 expression among all BC cells were transfected with sh-NC, sh-MALAT1–1, sh-MALAT1–2, sh-MALAT1–3, or sh-MALAT1–4, and the result of RT-qPCR displayed that MALAT1 expression in MDA-MB-231 and BT-549 cells was significantly inhibited by sh-MALAT1 transfection. The knockdown effect of sh-MALAT1–2 was the most obvious among all shRNAs, so we chose sh-MALAT1–2 for the following experiments (referred to as sh-MALAT1) (). Increased ALDH activity is also confirmed as hallmark of BCSCs.Citation28 Functional experiments subsequently revealed that the percentage of CD44+CD24− cells was decreased following MALAT1 knockdown, as well as the percentage of ALDH+ cells (). In addition, sh-MALAT1 transfection resulted in the reduced sphere formation capacity () and colony formation capacity (). We also transfected oe-NC or oe-MALAT1 into MCF-7 and T47D cells with the lowest MALAT1 expression among all BC cells, and the results from RT-qPCR revealed that MALAT1 expression was significantly elevated by oe-MALAT1 (), suggesting that the transfection was successful. As expected, the percentage of CD44+CD24− cells () and the percentage of ALDH+ cells () were significantly elevated after MALAT1 overexpression. Taken together, MALAT1 silencing inhibited the stemness of TNBC cells, while MALAT1 overexpression presented the opposite effects.
Figure 3. MALAT1 silencing inhibited the stemness of TNBC cells, and MALAT1 overexpression promoted the stemness. (a) the CD44high or CD44low subpopulations of MDA-MB-231 cells were isolated by flow cytometry sorting. (b) MALAT1 expression in CD44high or CD44low subpopulations was evaluated by RT-qPCR. (c) MDA-MB-231 and BT-549 cells were transfected with sh-NC, sh-MALAT1–1, sh-MALAT1–2, sh-MALAT1–3 or sh-MALAT1–4, and MALAT1 expression was analyzed by RT-qPCR. MDA-MB-231 and BT-549 cells were transfected with sh-NC or sh-MALAT1. (d) Flow cytometry was employed to assess the percentages of CD44+CD24− cells. (e) the percentages of ALDH+ cells were evaluated using ALDEFLUOR assay. (f) the sphere formation capacity was detected by sphere formation assay. (g) Colony formation assay was performed to determine colony formation capacity. MCF-7 and T47D cells were transfected with oe-NC or oe-MALAT1. (h) MALAT1 expression was analyzed by RT-qPCR. (i) Flow cytometry was employed to assess the percentages of CD44+CD24− cells. (j) the percentages of ALDH+ cells were evaluated using ALDEFLUOR assay. The measurement data were presented as mean ± SD. All of the tests in this study were conducted for three times. *P < 0.05, ** P < 0.01, ***P < 0.001.
3.4. MALAT1 knockdown inhibited tumor formation in vivo, while MALAT1 overexpression promoted tumor formation
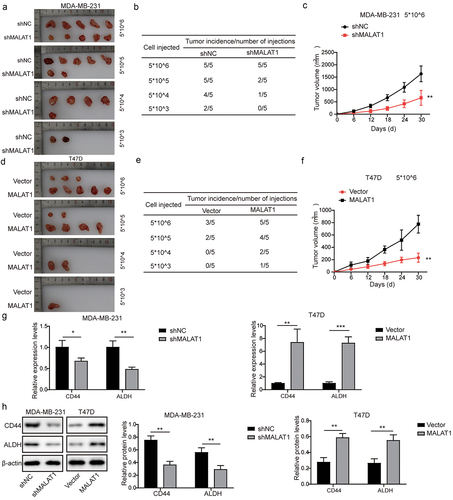
It has been widely described that tumor-initiating ability is another criterion for CSCs properties.Citation29 In order to explore the function of MALAT1 in regulation of tumor formation of TNBC, different concentrations (5 × 10Citation6, 5 × 10Citation5, 5 × 10Citation4, and 5 × 10.Citation3 of MDA-MB-231 cells transfected with sh-MALAT1 or sh-NC were subcutaneously injected in nude mice. As demonstrated in , MDA-MB-231 cells with sh-MALAT1 transfection presented a striking decrease in tumor-forming with comparison to MDA-MB-231 cells with sh-NC transfection. Additionally, MALAT1 knockdown could remarkably suppress tumor growth (). In contrast, MALAT1-overexpressing T47D cells displayed increased tumorigenicity along with faster growth and formed larger tumors than control cells (). Furthermore, as displayed in , tumors formed by MDA-MB-231 cells with sh-MALAT1 transfection showed significantly reduced CD44 and ALDH1 expressions, whereas tumors formed by MALAT1-overexpressing cells presented elevated CD44 and ALDH1 expressions. In total, MALAT1 promoted TNBC tumorigenicity in vivo.
Figure 4. MALAT1 knockdown inhibited tumor formation in vivo , while MALAT1 overexpression promoted tumor formation. (a) the CD44high or CD44low subpopulations of MDA-MB-231 cells were isolated by flow cytometry sorting. (b) MALAT1 expression in CD44high or CD44low subpopulations was evaluated by RT-qPCR. (c) MDA-MB-231 and BT-549 cells were transfected with sh-NC, sh-MALAT1–1, sh-MALAT1–2, sh-MALAT1–3 or sh-MALAT1–4, and MALAT1 expression was analyzed by RT-qPCR. MDA-MB-231 and BT-549 cells were transfected with sh-NC or sh-MALAT1. (d) Flow cytometry was employed to assess the percentages of CD44+CD24− cells. (e) the percentages of ALDH+ cells were evaluated using ALDEFLUOR assay. (f) the sphere formation capacity was detected by sphere formation assay. (g) Colony formation assay was performed to determine colony formation capacity. MCF-7 and T47D cells were transfected with oe-NC or oe-MALAT1. (h) MALAT1 expression was analyzed by RT-qPCR. (i) Flow cytometry was employed to assess the percentages of CD44+CD24− cells. (j) the percentages of ALDH+ cells were evaluated using ALDEFLUOR assay. The measurement data were presented as mean ± SD. All of the tests in this study were conducted for three times. *P < 0.05, **P < 0.01, ***P < 0.001.
3.5. MALAT1 elevated BCL11A expression through targeting miR-137
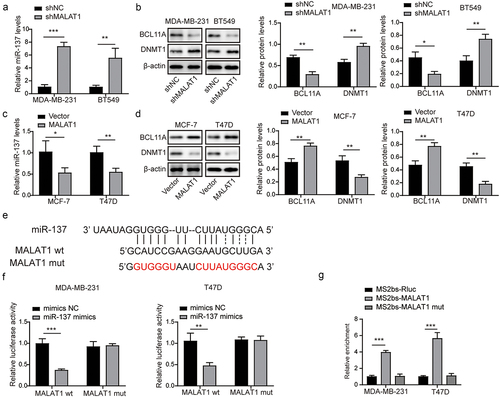
Next, we aimed to probe the relationship between MALAT1, miR-137, and BCL11A in TNBC. As displayed in , miR-137 expression in MDA-MB-231 and BT-549 cells was remarkably increased by MALAT1 silencing, whereas miR-137 expression in MCF-7 and T47D cells was inhibited by MALAT1 overexpression. In addition, we found that sh-MALAT1 transfection resulted in reduced BCL11A level and elevated DNMT1 level in MDA-MB-231 and BT-549 cells (), while MALAT1 overexpression led to increased BCL11A level and decreased DNMT1 level in MCF-7 and T47D cells (). By using bioinformatics database (Targetscan), it was observed that MALAT1 had a binding site to miR-137 (). Our results further revealed that MALAT1 could directly bind to miR-137 (). In summary, MALAT1 could positively regulate BCL11A expression through targeting miR-137.
Figure 5. MALAT1 facilitated BCL11A expression through targeting miR-137. (a) miR-137 expression in MDA-MB-231 and BT-549 cells after sh-NC or sh-MALAT1 transfection was analyzed using RT-qPCR. (b) miR-137 expression in MCF-7 and T47D cells after oe-NC or oe-MALAT1 transfection was examined using RT-qPCR. (c) BCL11A and DNMT1 levels in MDA-MB-231 and BT-549 cells after sh-NC or sh-MALAT1 transfection were examined using western blot. (d) Western blot was performed to evaluate BCL11A and DNMT1 levels in MCF-7 and T47D cells after oe-NC or oe-MALAT1 transfection. (e) Bioinformatics database (Targetscan, https://www.targetscan.org/vert_71/) was employed to predict the binding site between MALAT1 and miR-137. (f-g) Dual-luciferase reporter assay and RIP assay were performed to verify the binding relationship between MALAT1 and miR-137. The measurement data were presented as mean ± SD. All of the tests in this study were conducted for three times. *P < 0.05, **P < 0.01, ***P < 0.001.
3.6. MALAT1 reduced DNMT1 expression through miR-137/BCL11A pathway to promote the stemness and tumor formation of TNBC
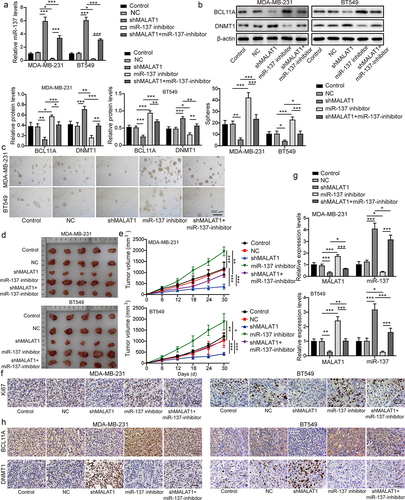
To confirm the potential role of the MALAT1/miR-137/BCL11A in regulating the stemness and tumor formation of TNBC, MDA-MB-231 and BT549 cells were classified into the control group, the NC group, the sh-MALAT1 group, the miR-137 inhibitor group, and the sh-MALAT1 + miR-137 inhibitor group. First, we observed that MALAT1 knockdown resulted in increased miR-137 and DNMT1 expressions and reduced BCL11A expression in MDA-MB-231 and BT549 cells, while miR-137 inhibition presented the opposite effects (). And miR-137 inhibition could eliminate the regulatory effects of MALAT1 knockdown on miR-137, BCL11A, and DNMT1 expressions (). In addition, MALAT1 silencing remarkably suppressed the sphere formation capacity, whereas miR-137 inhibition promoted the sphere formation capacity and reversed by co‐transfection with sh-MALAT1 and miR-137 inhibitor (). Then, MDA-MB-231 and BT549 cells in each group were subcutaneously injected into nude mice. As shown in , MALAT1-knockdowning MDA-MB-231 and BT549 cells displayed formed smaller tumors than control cells as well as the reduced level of proliferation marker (Ki67), whereas miR-137-inhibiting MDA-MB-231 and BT549 cells displayed opposite effects, which was reversed by MDA-MB-231 and BT549 cells co-transfected with sh-MALAT1 and miR-137 inhibitor (). Finally, tumors formed by MDA-MB-231 and BT549 cells with sh-MALAT1 transfection displayed that increased miR-137 and DNMT1 expressions, and decreased BCL11A expression, whereas tumors formed by miR-137-knockdowning cells presented reduced miR-137 and DNMT1 expressions, and elevated MALAT1 and BCL11A expression (). Besides, MALAT1, miR-137, DNMT1, and BCL11A expressions in tumors formed by MDA-MB-231 and BT549 cells with sh-MALAT1 were reversed by sh-MALAT1 and miR-137 inhibitor co-transfection (). In conclusion, MALAT1 reduced DNMT1 expression through miR-137/BCL11A pathway to promote the stemness and tumor formation of TNBC.
Figure 6. MALAT1 reduced DNMT1 expression through miR-137/BCL11A pathway to promote the stemness and tumor formation of TNBC. MDA-MB-231 and BT549 cells were classified into the control group, the NC group, the sh-MALAT1 group, the miR-137 inhibitor group and the sh-MALAT1 + miR-137 inhibitor group. (a) miR-137 expression in MDA-MB-231 and BT549 cells was assessed by RT-qPCR. (b) Western blot was conducted to evaluate BCL11A and DNMT1 levels in MDA-MB-231 and BT549 cells. (c) the sphere formation capacity of in MDA-MB-231 and BT549 cells was detected by sphere formation assay. MDA-MB-231 and BT549 cells in each group were subcutaneously injected in nude mice n = 3. (d) Tumors were collected and photographed. (e) the tumor volume was calculated. (f) Ki67 level in tumors was evaluated by IHC (scale bar = 100 µm). (g) MALAT1 and miR-137 expressions in tumors were detected by RT-qPCR. (h) IHC was conducted to evaluate BCL11A and DNMT1 levels in tumors (scale bar = 100 µm). The measurement data were presented as mean ± SD. All of the tests in this study were conducted for three times. *P < 0.05, **P < 0.01, ***P < 0.001.
3.7. MALAT1-DNMT1 feedback axis regulated the stemness and tumor formation of TNBC
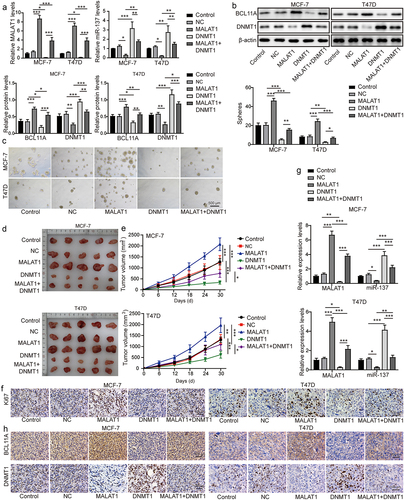
To probe the function of DNMT1 on MALAT1-mediated promotion of TNBC stemness and tumor formation, MCF-7 and T47D cells were classified into the control group, the NC group, the oe-MALAT1 group, the oe-DNMT1 group, and the oe-MALAT1 + oe-DNMT1 group. As revealed in , DNMT1 overexpression resulted in increased miR-137 and DNMT1 expressions and reduced MALAT1 and BCL11A expressions in MCF-7 and T47D cells, while MALAT1 overexpression presented the opposite effects. The MALAT1 overexpression abolished the regulatory effects of DNMT1 overexpression on MALAT1, miR-137, BCL11A, and DNMT1 expressions (). In addition, DNMT1 overexpression remarkably suppressed the sphere formation capacity of MCF-7 and T47D cells, whereas MALAT1 overexpression could enhance the sphere formation capacity (), which was abolished by co‐transfection with oe-MALAT1 and oe-DNMT1 (). Then, MCF-7 and T47D cells in each group were subcutaneously injected into nude mice. We found that DNMT1 overexpression could suppress mice tumor growth, whereas MALAT1 overexpression remarkably promoted mice tumor growth (). It was also observed that MALAT1 overexpression could eliminate the inhibitory effect of DNMT1 overexpression on tumor growth (). Finally, DNMT1 overexpression led to increased miR-137 and DNMT1, and reduced Ki-67, MALAT1, and BCL11A expressions in tumors, while MALAT1 overexpression showed the opposite effects; and MALAT1 overexpression could abolish the regulatory effects of DNMT1 overexpression on Ki-67, miR-137, DNMT1, MALAT1, and BCL11A in tumors (). In conclusion, MALAT1-DNMT1 feedback axis could regulate the stemness and tumor formation of TNBC.
Figure 7. MALAT1-DNMT1 feedback axis regulated the stemness and tumor formation of TNBC. MCF-7 and T47D cells were classified into the control group, the NC group, the oe-MALAT1 group, the oe-DNMT1 group and the oe-MALAT1 + oe-DNMT1 group. (a) MALAT1 and miR-137 expressions in MCF-7 and T47D cells were assessed by RT-qPCR. (b) Western blot was employed to examine BCL11A and DNMT1 levels MCF-7 and T47D cells. (c) the sphere formation capacity of MCF-7 and T47D cells was detected by sphere formation assay. MCF-7 and T47D cells in each group were subcutaneously injected in nude mice n = 3. (d) Tumors were collected and photographed. (e) the tumor volume was calculated. (f) Ki67 level in tumors was evaluated by IHC (scale bar = 100 µm). (g) MALAT1 and miR-137 expressions in tumors were detected by RT-qPCR. (h) IHC was conducted to evaluate BCL11A and DNMT1 levels in tumors (scale bar = 100 µm). The measurement data were presented as mean ± SD. All of the tests in this study were conducted for three times. *P < 0.05, **P < 0.01, ***P < 0.001.
4. Discussion
CSCs are cells that have unlimited self-renewal ability and can cause multi‐lineage differentiation of malignant tumor cells.Citation30 CSCs may explain a variety of cancer phenomena including chemical radiation resistance, metastasis, and drug resistance, thereby contributing to the recurrence of cancer.Citation31 It has been widely reported that the proportion of CSCs in TNBC is significantly higher than that of other subtypes.Citation32 Much evidence has displayed that lncRNA has a huge regulatory effect on the stemness of TNBC. For instance, Wang et al. revealed that lncRNA THOR could promote the stem cell-like traits of TNBC through activating the β-catenin signaling.Citation9 Herein, we found that a novel lncRNA could promote TNBC stemness and tumorigenesis. Specifically, lncRNA MALAT1 and DNMT1 could form a feedback loop to promote TNBC stemness and tumorigenesis.
LncRNA MALAT1 participates in regulating the stemness of many types of cancer. For example, Xiao et al.’s study revealed that MALAT1 enhanced the stemness of gastric cancer cells through targeting SOX2.Citation33 In addition, MALAT1 silencing was reported to suppress cancer stem cell properties in hepatic carcinoma.Citation34 However, the role of MALAT1 in regulating the stemness of TNBC remains unclear. Herein, it was observed that MALAT1 expression was markedly increased in BC cells and tissues, especially in TNBC cells and tissues. And, by using Kaplan – Meier plotter database, it turned out that higher MALAT1 was associated with TNBC patients’ poor survival and poor prognosis. In addition, MALAT1 silencing inhibited cell proliferation, the sphere formation capacity, and the expressions of stem cell markers in TNBC cells, while MALAT1 overexpression presented the opposite effects. Furthermore, MALAT1 knockdown could suppress tumor formation in vivo, while MALAT1 overexpression promoted tumor formation. Our results suggest that MALAT1 acted as a key regulator in TNBC stemness and tumorigenesis, which was never reported.
The competing endogenous RNA (ceRNA) hypothesis is supported by numerous studies, which is described as a novel RNA regulation mechanism.Citation35 Here we found that MALAT1 acted as a sponge for miR-137. Prior to this study, miR-137 has been proved to be a negative regulator of oncogenesis.Citation36 Regarding BC, Cheng et al. revealed that miR-137 repressed BC cell stemness by targeting FSTL1.Citation37 More importantly, our previous study confirmed that miR-137 suppressed cancer stemness and tumor development in TNBC.Citation24 However, little is known about the role of MALAT1/miR-137 axis in regulating TNBC cell stemness. Herein, our results revealed that MALAT1 directly bound to miR-137. MiR-137 was markedly downregulated in BC cells and tissues, especially in TNBC cells and tissues. The higher miR-137 expression was associated with high survival rate. Additionally, miR-137 expression in BC cells was promoted by MALAT1 silencing. Above all, we came to the conclusion that MALAT1 inhibited miR-137 expression by sponging miR-137. Having identified the direct relationship between MALAT1 and miR-137, we assumed that MALAT1 might regulate TNBC cell stemness via its negative regulatory effects on miR-137. Function assays displayed that miR-137 inhibition abolished the inhibitory effects of MALAT1 silencing on TNBC stemness and tumorigenesis. In summary, MALAT1 promoted TNBC stemness and tumorigenesis via directly interacting with miR-137.
BCL11A is a transcription factor, and its important function in solid tumors has received increasing attention recently.Citation38 Herein, our results revealed that BCL11A expression was remarkably increased in TNBC tissues and cells, which was totally consistent with the previous study.Citation39 In addition, BCL11A expression was associated with poor survival and poor prognosis. Our results also confirmed that MALAT1 targeted miR-137 to positively regulate BCL11A expression in TNBC. Our previous study revealed that BCL11A could form an active complex with DNMT1, which was essential for maintaining TNBC stemness.Citation24 DNMT1 is an important DNA methyltransferase and is considered a potential therapeutic target in cancer.Citation40 Herein, it was observed that DNMT1 expression was significantly reduced in TNBC, and higher DNMT1 expression was associated with high survival rate. More importantly, we confirmed that MALAT1 reduced DNMT1 expression through miR-137/BCL11A pathway to promote the stemness and tumor formation of TNBC. Specifically, MALAT1 bound to miR-137 to increase the expression of BCL11A, and BCL11A formed an active complex with DNMT1, which enhanced TNBC stemness and tumorigenesis; meanwhile, free DNMT1 was neutralized by the combination of a large amount of BCL11A. In the current, we observed that the methylation level of MALAT1 was markedly reduced in BC tissues and cells. As previously reported, the MALAT1 expression depends on methylation.Citation27 Herein, we also confirmed that the high MALAT1 expression in TNBC was related to the hypomethylation of its promoter region. Considering that DNMT1 is an important DNA methyltransferase, and it functions in regulating cancer progression by modulating the methylation of tumor-related genes,Citation41 we speculated that the high MALAT1 expression in TNBC was related to the low-expressed DNMT1 mediated the hypomethylation of MALAT1 promoter region. Our results displayed that MALAT1 expression in TNBC cells was markedly elevated by DNMT1 silencing, and MALAT1 expression was suppressed by DNMT1 overexpression. In addition, DNMT1 overexpression could remarkably inhibit TNBC stemness and tumorigenesis, which was eliminated by MALAT1 overexpression. Therefore, we came to the conclusion that free DNMT1 was bound by BCL11A, making the MALAT1 promoter region hypomethylated and the further increase in MALAT1 expression, which formed a malignant positive feedback loop to continuously enhance TNBC stemness.
Our research clarified the mechanism of MALAT1, miR-137, BCL11A, and DNMT1 to regulate TNBC stemness and tumorigenesis. LncRNA MALAT1 reduced DNMT1 expression through miR-137/BCL11A pathway to promote the stemness and tumor formation of TNBC. Meanwhile, DNMT1/MALAT1 formed a positive feedback loop to continuously promote TNBC malignant behaviors. Our work revealed that targeting these molecules might be a potential therapeutic strategy for TNBC.
Availability of data and material
All data generated or analyzed during this study are included in this published article
Abbreviations
Triple-negative breast cancer, TNBC; Cancer stem cells CSCs; Breast cancer stem cells BCSCs; Long non-coding RNA lncRNA; MicroRNA miR; Breast cancer BC; Metastasis-associated lung adenocarcinoma transcription 1 MALAT1; B-Cell CLL/Lymphoma 11A (CL11A; DNA methyltransferase 1 DNMT1; Diethylaminobenzaldehyde DEAB; Immunohistochemistry IHC; RNA Immunoprecipitation RIP; Real-time quantitative polymerase chain reaction RT-qPCR; Standard deviation SD; Analysis of variance ANOVA
Ethics approval and consent to participate
A cohort of 48 BC tumor tissues composed of 26 non-TNBC tumor tissues and 22 TNBC tumor tissues as well as paired adjacent normal tissues were collected post-operatively from BC patients in the Xiangya Hospital of Central South University. The BC patients were clearly diagnosed and were not treated. This study was passed the review of Ethics Committee of the Xiangya Hospital of Central South University (Ethics approval No: 202003048), and all participants signed informed consent. The animal studies were approved by Central South University (Ethics approval No: 2020sydw0097).
Supplemental Material
Download TIFF Image (978.9 KB)Supplemental Material
Download MS Word (12.1 KB)Acknowledgments
We would like to express our sincere gratitude to the reviewers for their constructive comments.
Disclosure statement
All authors agree with the presented findings, have contributed to the work, and declare no conflict of interest.
Supplementary material
Supplemental data for this article can be accessed online at https://doi.org/10.1080/15384047.2023.2235768
Additional information
Funding
Notes on contributors
Yu Hu
Hu Yu, graduated from Xiangya Hospital of Central South University in 2014 with a doctor's degree, worked in the Breast Department of Xiangya Hospital of Central South University, with a research direction of breast cancer.
Yuqiong He
Yuqiong He, graduated from Shandong University with a bachelor's degree in 2018, trained as a surgical resident in Xiangya Hospital of Central South University from August 1, 2018 to July 31, 2021, and now works in Cardiovascular Surgery Department of the Second Affiliated Hospital of Hainan Medical University.
Na Luo
Na Luo, graduated from Peking Union Medical College in 2012 with an eight year clinical doctor's degree. She works in the Breast Department of Xiangya Hospital with a research direction of breast cancer.
Xin Li
Xin Li, graduated from Xiangya Medical College of Central South University in 2014 with a doctor's degree. She works in Xiangya Hospital of Central South University with a research direction of breast cancer.
Lei Guo
Lei Guo, graduated from Xiangya Hospital of Central South University in 2009 with a doctor's degree. He works in breast surgery in Xiangya Hospital of Central South University with a research direction of breast cancer.
Kejing Zhang
Kejing Zhang, graduated from Xiangya Hospital of Central South University in 2012 with a doctor's degree, worked in breast surgery of Xiangya Hospital of Central South University, and his research direction is precision treatment of triple negative breast cancer.
References
- Siegel RL, Miller KD, Jemal A. Cancer statistics, 2020. A Cancer J Clin. 2020;70(1):7–14. doi:10.3322/caac.21590.
- Han Y, Xie W, Song DG, Powell DJ Jr. Control of triple-negative breast cancer using ex vivo self-enriched, costimulated NKG2D CAR T cells. J Hematol Oncol. 2018;11(1):92. doi:10.1186/s13045-018-0635-z.
- Luo N, Zhang K, Li X, Hu Y. ZEB1 induced-upregulation of long noncoding RNA ZEB1-AS1 facilitates the progression of triple negative breast cancer by binding with ELAVL1 to maintain the stability of ZEB1 mRNA. J Cell Biochem. 2020;121(10):4176–4187. doi:10.1002/jcb.29572.
- Mahamodhossen YA, Liu W, Rong-Rong Z. Triple-negative breast cancer: new perspectives for novel therapies. Med Oncol. 2013;30(3):653. doi:10.1007/s12032-013-0653-1.
- Zhao J. Cancer stem cells and chemoresistance: The smartest survives the raid. Pharmacology & Therapeutics. 2016;160:145–158. doi:10.1016/j.pharmthera.2016.02.008.
- Zheng L, Xiang C, Li X, Guo Q, Gao L, Ni H, Xia Y, Xi T. STARD13-correlated ceRNA network-directed inhibition on YAP/TAZ activity suppresses stemness of breast cancer via co-regulating Hippo and Rho-GTPase/F-actin signaling. J Hematol Oncol. 2018;11(1):72. doi:10.1186/s13045-018-0613-5.
- Iyer MK, Niknafs YS, Malik R, Singhal U, Sahu A, Hosono Y, Barrette TR, Prensner JR, Evans JR, Zhao S, et al. The landscape of long noncoding RNAs in the human transcriptome. Nat Genet. 2015;47(3):199–208. doi:10.1038/ng.3192.
- Liu ZZ, Tian YF, Wu H, Ouyang SY, Kuang WL. LncRNA H19 promotes glioma angiogenesis through miR-138/HIF-1α/VEGF axis. Neoplasma. 2020;67(1):111–118. doi:10.4149/neo_2019_190121N61.
- Wang B, Ye Q, Zou C. Long non-coding RNA THOR enhances the stem cell-like traits of triple-negative breast cancer cells through activating β-catenin signaling. Med Sci Monit. 2020;26:e923507. doi:10.12659/MSM.923507.
- Wu D, Jia H, Zhang Z, Li S. STAT3-induced HLA-F-AS1 promotes cell proliferation and stemness characteristics in triple negative breast cancer cells by upregulating TRABD. Bioorg Chem. 2021;109:104722. doi:10.1016/j.bioorg.2021.104722.
- Xiping Z, Bo C, Shifeng Y, Feijiang Y, Hongjian Y, Qihui C, Binbin T. Roles of MALAT1 in development and migration of triple negative and Her-2 positive breast cancer. Oncotarget. 2018;9(2):2255–2267. doi:10.18632/oncotarget.23370.
- Wu Q, Meng WY, Jie Y, Zhao H. LncRNA MALAT1 induces colon cancer development by regulating miR-129-5p/HMGB1 axis. J Cell Physiol. 2018;233(9):6750–6757. doi:10.1002/jcp.26383.
- Ou X, Gao G, Bazhabayi M, Zhang K, Liu F, Xiao X. MALAT1 and BACH1 are prognostic biomarkers for triple-negative breast cancer. J Cancer Res Ther. 2019;15(7):1597–1602. doi:10.4103/jcrt.JCRT_282_19.
- Zuo Y, Li Y, Zhou Z, Ma M, Fu K. Long non-coding RNA MALAT1 promotes proliferation and invasion via targeting miR-129-5p in triple-negative breast cancer. Biomed Pharmacother. 2017;95:922–928. doi:10.1016/j.biopha.2017.09.005.
- Bartel DP. MicroRNAs: genomics, biogenesis, mechanism, and function. Cell. 2004;116(2):281–297. doi:10.1016/S0092-8674(04)00045-5.
- Yang LW, Wu XJ, Liang Y, Ye GQ, Che YC, Wu XZ, Zhu XJ, Fan HL, Fan XP, Xu JF. MiR-155 increases stemness and decitabine resistance in triple-negative breast cancer cells by inhibiting TSPAN5. Mol Carcinog. 2020;59(4):447–461. doi:10.1002/mc.23167.
- Ding F, Zhang S, Gao S, Shang J, Li Y, Cui N, Zhao Q. MiR-137 functions as a tumor suppressor in pancreatic cancer by targeting MRGBP. J Cell Biochem. 2018;119(6):4799–4807. doi:10.1002/jcb.26676.
- Zhang W, Chen JH, Shan T, Aguilera-Barrantes I, Wang LS, Huang TH, Rader JS, Sheng X, Huang YW. MiR-137 is a tumor suppressor in endometrial cancer and is repressed by DNA hypermethylation. Lab Invest. 2018;98(11):1397–1407. doi:10.1038/s41374-018-0092-x.
- Lee SJ, Jeong JH, Kang SH, Kang J, Kim EA, Lee J, Jung JH, Park HY, Chae YS. MicroRNA-137 inhibits cancer progression by targeting Del-1 in triple-negative breast cancer cells. Int J Mol Sci. 2019;20(24):6162. doi:10.3390/ijms20246162.
- Bauer DE, Orkin SH. Hemoglobin switching’s surprise: the versatile transcription factor BCL11A is a master repressor of fetal hemoglobin. Curr Opin Genet Dev. 2015;33:62–70. doi:10.1016/j.gde.2015.08.001.
- Nakamura T, Yamazaki Y, Saiki Y, Moriyama M, Largaespada DA, Jenkins NA, Copeland NG. Evi9 encodes a novel zinc finger protein that physically interacts with BCL6, a known human B-cell proto-oncogene product. Mol Cell Biol. 2000;20(9):3178–3186. doi:10.1128/MCB.20.9.3178-3186.2000.
- Satterwhite E, Sonoki T, Willis TG, Harder L, Nowak R, Arriola EL, Liu H, Price HP, Gesk S, Steinemann D, et al. The BCL11 gene family: involvement of BCL11A in lymphoid malignancies. Blood. 2001;98(12):3413–3420. doi:10.1182/blood.V98.12.3413.
- Khaled WT, Choon Lee S, Stingl J, Chen X, Raza Ali H, Rueda OM, Hadi F, Wang J, Yu Y, Chin SF, et al. BCL11A is a triple-negative breast cancer gene with critical functions in stem and progenitor cells. Nat Commun. 2015;6(1):5987. doi:10.1038/ncomms6987.
- Chen F, Luo N, Hu Y, Li X, Zhang K. MiR-137 suppresses triple-negative breast cancer stemness and tumorigenesis by perturbing BCL11A-DNMT1 interaction. Cell Physiol Biochem. 2018;47(5):2147–2158. doi:10.1159/000491526.
- Samowitz WS, Ogino S. DNA methylation in breast and colorectal cancers. Mod Pathol. 2008;21(8):1054. author reply 1054-5. doi:10.1038/modpathol.2008.18.
- Pathania R, Ramachandran S, Elangovan S, Padia R, Yang P, Cinghu S, Veeranan-Karmegam R, Arjunan P, Gnana-Prakasam JP, Sadanand F. Sadanand F and others. DNMT1 is essential for mammary and cancer stem cell maintenance and tumorigenesis. Nat Commun. 2015;6(1):6910. doi:10.1038/ncomms7910.
- Guo F, Guo L, Li Y, Zhou Q, Li Z. 2015. MALAT1 is an oncogenic long non-coding RNA associated with tumor invasion in non-small cell lung cancer regulated by DNA methylation. Int J Clin Exp Pathol. 8(12):15903–15910.
- Ginestier C, Hur MH, Charafe-Jauffret E, Monville F, Dutcher J, Brown M, Jacquemier J, Viens P, Kleer CG, Liu S, et al. ALDH1 is a marker of normal and malignant human mammary stem cells and a predictor of poor clinical outcome. Cell Stem Cell. 2007;1(5):555–567. doi:10.1016/j.stem.2007.08.014.
- Tominaga K, Shimamura T, Kimura N, Murayama T, Matsubara D, Kanauchi H, Niida A, Shimizu S, Nishioka K, Tsuji EI, et al. Addiction to the IGF2-ID1-IGF2 circuit for maintenance of the breast cancer stem-like cells. Oncogene. 2017;36(9):1276–1286. doi:10.1038/onc.2016.293.
- Kobayashi N, Navarro-Alvarez N, Soto-Gutierrez A, Kawamoto H, Kondo Y, Yamatsuji T, Shirakawa Y, Naomoto Y, Tanaka N. Cancer stem cell research: current situation and problems. Cell Transplant. 2008;17(1–2):19–25. doi:10.3727/000000008783906982.
- Islam F, Qiao B, Smith RA, Gopalan V, Lam AK. Cancer stem cell: fundamental experimental pathological concepts and updates. Exp Mol Pathol. 2015;98(2):184–191. doi:10.1016/j.yexmp.2015.02.002.
- Bei Y, Cheng N, Chen T, Shu Y, Yang Y, Yang N, Zhou X, Liu B, Wei J, Liu Q, et al. CDK5 inhibition abrogates TNBC stem-cell property and enhances anti-PD-1 therapy. Adv Sci. 2020;7(22):2001417. doi:10.1002/advs.202001417.
- Xiao Y, Pan J, Geng Q, Wang G. LncRNA MALAT1 increases the stemness of gastric cancer cells via enhancing SOX2 mRNA stability. FEBS Open Bio. 2019;9(7):1212–1222. doi:10.1002/2211-5463.12649.
- He B, Peng F, Li W, Jiang Y. Interaction of lncRNA-MALAT1 and miR-124 regulates HBx-induced cancer stem cell properties in HepG2 through PI3K/Akt signaling. J Cell Biochem. 2019;120(3):2908–2918. doi:10.1002/jcb.26823.
- Peng WX, Koirala P, Mo YY. LncRNA-mediated regulation of cell signaling in cancer. Oncogene. 2017;36(41):5661–5667. doi:10.1038/onc.2017.184.
- Zhao Y, Li Y, Lou G, Zhao L, Xu Z, Zhang Y, He F, Vanacker J-M. MiR-137 targets estrogen-related receptor alpha and impairs the proliferative and migratory capacity of breast cancer cells. PLoS One. 2012;7(6):e39102. doi:10.1371/journal.pone.0039102.
- Cheng S, Huang Y, Lou C, He Y, Zhang Y, Zhang Q. FSTL1 enhances chemoresistance and maintains stemness in breast cancer cells via integrin β3/Wnt signaling under miR-137 regulation. Cancer Biol Ther. 2019;20(3):328–337. doi:10.1080/15384047.2018.1529101.
- Seachrist DD, Hannigan MM, Ingles NN, Webb BM, Weber-Bonk KL, Yu P, Bebek G, Singh S, Sizemore ST, Varadan V, et al. The transcriptional repressor BCL11A promotes breast cancer metastasis. J Biol Chem. 2020;295(33):11707–11719. doi:10.1074/jbc.RA120.014018.
- Wang X, Xu Y, Xu K, Chen Y, Xiao X, Guan X. BCL11A confers cell invasion and migration in androgen receptor-positive triple-negative breast cancer. Oncol Lett. 2020;19(4):2916–2924. doi:10.3892/ol.2020.11383.
- Wong KK. DNMT1 as a therapeutic target in pancreatic cancer: mechanisms and clinical implications. Cell Oncol (Dordr). 2020;43(5):779–792. doi:10.1007/s13402-020-00526-4.
- Liu H, Song Y, Qiu H, Liu Y, Luo K, Yi Y, Jiang G, Lu M, Zhang Z, Yin J, et al. Downregulation of FOXO3a by DNMT1 promotes breast cancer stem cell properties and tumorigenesis. Cell Death Differ. 2020;27(3):966–983. doi:10.1038/s41418-019-0389-3.