
ABSTRACT
Metabolic reprogramming plays a critical role in hepatocarcinogenesis. However, the mechanisms regulating metabolic reprogramming in primary liver cancer (PLC) are unknown. Differentially expressed miRNAs between PLC and normal tissues were identified using bioinformatic analysis. RT-qPCR was used to determine miR-10b-5p and SCL38A2 expression levels. IHC, WB, and TUNEL assays were used to assess the proliferation and apoptosis of the tissues. The proliferation, migration, invasion, and apoptosis of PLC cells were determined using the CCK-8 assay, Transwell assay, and flow cytometry. The interaction between miR-10b-5p and SLC38A2 was determined using dual-luciferase reporter assay. A PLC xenograft model in BALB/c nude mice was established, and tumorigenicity and SLC38A2 expression were estimated. Finally, liquid chromatography – mass spectrometry (LC-MS) untargeted metabolomics was used to analyze the metabolic profiles of xenograft PLC tissues in nude mice. miR-10b-5p was a key molecule in the regulation of PLC. Compared with para-carcinoma tissues, miR-10b-5p expression was increased in tumor tissues. miR-10b-5p facilitated proliferation, migration, and invasion of PLC cells. Mechanistically, miR-10b-5p targeted SLC38A2 to promote PLC tumor growth. Additionally, miR-10b-5p altered the metabolic features of PLC in vivo. Overexpression of miR-10b-5p resulted in remarkably higher amounts of lumichrome, folic acid, octanoylcarnitine, and Beta-Nicotinamide adenine dinucleotide, but lower levels of 2-methylpropanal, glycyl-leucine, and 2-hydroxycaproic acid. miR-10b-5p facilitates the metabolic reprogramming of PLC by targeting SLC38A2, which ultimately boosts the proliferation, migration, and invasion of PLC cells. Therefore, miR-10b-5p and SLC38A2 are potential targets for PLC diagnosis and treatment.
1. Introduction
Primary liver cancer (PLC), the seventh most prevalent cancer, is the second leading cause of cancer-related mortality globally.Citation1 PLC includes hepatocellular carcinoma (HCC), intrahepatic cholangiocarcinoma (ICC), and other types of liver cancer, accounting for approximately 80%, 15%, and 5%, respectively.Citation2 Due to the limited accuracy of biomarkers for early diagnosis and prognosis, the majority of PLCs are found at an advanced stage and lack effective therapeutic options, resulting in a high death rate.Citation3 The liver is an essential metabolic regulator in the body, coordinating toxin removal; regulating glucose, lipid, and amino acid metabolism; and sustaining metabolic homeostasis.Citation4 By modifying metabolic patterns, tumor cells adapt to the microenvironment of hypoxia and nutrient deprivation and proliferate rapidly. This biological process is known as metabolic reprogramming, and is regarded as an important hallmark of cancers.Citation5 Currently, no effective therapeutic strategies for PLC metabolism are available in the clinic.Citation6 Therefore, elucidating the mechanisms of PLC metabolic reprogramming and identifying reliable targets is of great significance for the diagnosis and treatment of PLC.
MicroRNAs (miRNAs) are single-stranded non-coding RNAs that downregulate target gene expression by binding to their 3’ untranslated regions (UTRs) but do not change their nucleotide sequences.Citation7 Extensive studies have revealed that miRNAs are altered during PLC initiation and development, and play critical roles in tumor promotion or suppression.Citation8 Accumulating data have revealed that miRNAs influence tumor progression by regulating metabolic reprogramming. Yan et al. found that breast cancer cells delivered miR-105 into cancer-associated fibroblasts (CAFs) via exosomes and activated MYC signaling, boosting glucose and glutamine metabolism, as well as degradation of metabolic wastes in CAFs, ultimately fueling nearby tumor cells.Citation9 Yin et al. showed that miR-181b inhibited tumor growth by suppressing glucose uptake in glioblastoma cells, which was achieved by targeting specificity protein 1 (SP1).Citation10 miR-185, which is under-expressed in osteosarcoma cells, inhibits the expression of the rate-limiting enzyme glycolytic hexokinase 2 (HK2) and glucose metabolism, leading to proliferative and migrative repression in osteosarcoma cells.Citation11 Hence, identifying miRNAs associated with metabolic reprogramming in PLC is of great importance, which may assist in the early diagnosis and treatment of PLC.
In the current study, we first identified the highly expressed miR-10b-5p in PLC using public databases and clinical samples. We investigated the regulatory functions of miR-10b-5p in tumor biological features and metabolic reprogramming of PLC in vitro and in vivo. We further dissected the mechanism by which miR-10b-5p regulates PLC development, hoping that our findings may provide new targets for PLC.
2. Results
2.1. Analysis of differentially expressed miRnas between PLC tissues and normal tissues
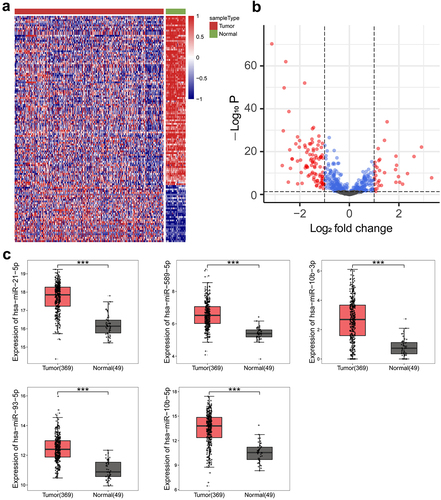
To explore the potential miRNAs that regulate the metabolic reprogramming of PLC, we performed bioinformatics analysis to compare the miRNA profiles in PLC and normal tissues using the TCGA-LIHC database, which contains 369 PLC tissue samples and 49 normal tissue samples. The differentially expressed miRNAs between PLC and normal tissues were shown in the cluster heat map () and the volcano map (). Compared to normal tissues, miR-21-5p, miR-589-5p, miR-10b-3p, miR-93-5p, and miR-10b-5p were significantly increased in PLC tissues (). The expression of miRNAs was presented as log2(TPM +1). The fold increases in miR-21-5p, miR-589-5p, miR-10b-3p, miR-93-5p, and miR-10b-5p expression in PLC tissues compared to normal tissues were 2.93, 2.57, 9.72, 2.92, and 10.14, respectively. Therefore, miR-10b-5p, with the highest degree of upregulation, was selected for further investigation.
Figure 1. Analysis of differentially expressed miRnas between PLC tissues and normal tissues. (a) Clustering heat maps of miRnas in tissues. (b) Volcano plots of miRnas in tissues. (c) Boxplots of miR-21-5p, miR-589-5p, miR-10b-3p, miR-93-5p, and miR-10b-5p expressions in tissues. ***p < .001.
2.2. miR-10b-5p is increased in tumor tissues of PLC patients
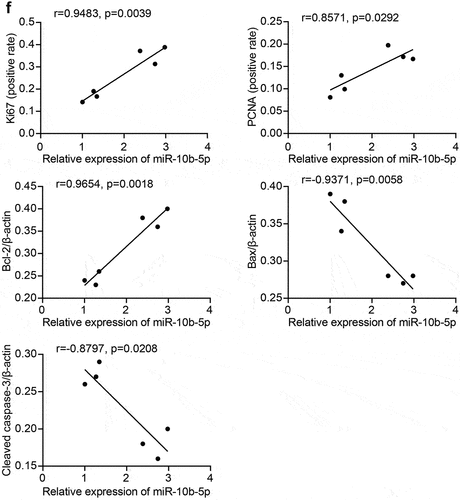
Next, we collected clinical samples from patients with PLC and assessed miR-10b-5p expression in the tumor tissues. As shown in , miR-10b-5p levels in PLC tissues were remarkably higher than those in para-carcinoma tissues. We further assessed the proliferation and apoptosis of PLC and adjacent normal tissues. Compared with para-carcinoma tissues, PLC tissues showed markedly higher Ki67 positive cells and proliferating cell nuclear antigen (PCNA) positive cells (), indicating enhanced proliferation in tumor tissues. In addition, proapoptotic Bax and Cleaved caspase 3 expression was remarkably decreased in PLC tissues compared to para-carcinoma tissues, whereas the levels of anti-apoptotic Bcl-2 displayed the opposite pattern (). The reduced apoptosis rate in PLC tissues was further verified using TUNEL staining (). Furthermore, the expression of miR-10b-5p was positively correlated with Ki-67, PCNA, and Bcl-2 expression, but negatively correlated with Bax and Cleaved caspase 3 expressions in PLC tissues ().
Figure 2. miR-10b-5p is increased in tumor tissues of PLC patients. (a) RT-qPCR analysis of miR-10b-5p expression in tissues. (b) Quantification of Ki67 positive and PCNA positive cells in tissues. (c) IHC staining for Ki67 and PCNA expressions in tissues. (d) WB analysis of bcl-2, Bax, and cleaved caspase 3 in tissues. The band intensity was assessed (right). (e) TUNEL staining and apoptosis rate in tissues. (f) The correlation between relative expression of miR-10b-5p with ki-67, PCNA, bcl-2, Bax, and cleaved caspase 3 levels in PLC tissues was analyzed by Pearson correlation test. *p < .05.
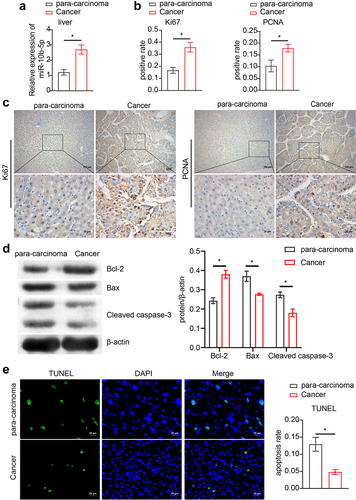
Figure 2. (Continued).
2.3. miR-10b-5p promotes the proliferation, migration, and invasion of PLC cells
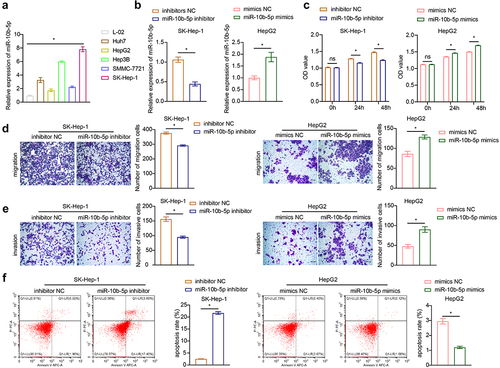
Having identified that miR-10b-5p levels and proliferation were both enhanced in PLC tissues, we next determined whether miR-10b-5p directly modulated the tumor biology of PLC. We selected normal human liver cells (L-02) and human PLC cells (Huh7, HepG2, Hep3B, SMMC-7721, SK-Hep-1) for detection. As detected by reverse-transcription quantitative PCR (RT-qPCR), Huh7, HepG2, Hep3B, SMMC-7721, and SK-Hep-1 cells exhibited notably higher miR-10b-5p expression levels than L-02 cells (). Since miR-10b-5p levels were the highest in SK-Hep-1 cells and the lowest in HepG2 cells among all PLC cell lines, in the following experiments, miR-10b-5p expression was downregulated or upregulated in SK-Hep-1 and HepG2 cells, respectively. First, the transfection efficiency of miR-10b-5p inhibitors and mimics was validated in SK-Hep-1 and HepG2 cells, respectively (). Subsequently, Cell counting kit-8 (CCK-8) assay revealed that SK-Hep-1 cell proliferation was suppressed by miR-10b-5p knockdown, whereas miR-10b-5p overexpression facilitated HepG2 cell proliferation (). Furthermore, miR-10b-5p downregulation repressed the migration and invasion of SK-Hep-1 cells, while miR-10b-5p upregulation boosted the migration and invasion of HepG2 cells, as determined by the transwell assay ()). In addition, after transfection with miR-10b-5p inhibitors, the apoptosis rate in SK-Hep-1 cells was markedly increased, whereas the apoptosis rate of HepG2 cells showed the opposite tendency upon miR-10b-5p mimic transfection (). SK-Hep-1 and HepG2 cells were also treated with the apoptosis inducer staurosporine (STS). As shown in Supplementary Figure S1, STS significantly promoted apoptosis in SK-Hep-1 and HepG2 cells. miR-10b-5p knockdown further increased the apoptosis rate of SK-Hep-1 cells, whereas miR-10b-5p overexpression partially abrogated apoptosis induced by STS in HepG2 cells. These data demonstrate that miR-10b-5p promotes the proliferation, migration, and invasion of PLC cells.
Figure 3. miR-10b-5p facilitates the proliferation, migration, and invasion of PLC cells. (a) RT-qPCR analysis of miR-10b-5p expression in normal human liver cells (L-02) and human PLC cells (Huh7, HepG2, Hep3B, SMMC-7721, SK-Hep-1). (b) RT-qPCR analysis of miR-10b-5p expression in SK-Hep-1 cells transfected with inhibitors NC or miR-10b-5p inhibitors (left), and in HepG2 cells transfected with mimics NC or miR-10b-5p mimics (right). (c) CCK-8 assay, (d) Transwell migration assay, (e) Transwell invasion assay, and (f) flow cytometric analysis of SK-Hep-1 cells (left) and HepG2 cells (right). *p < .05; ns, no significant difference.
2.4. miR-10b-5p facilitates the proliferation, migration, and invasion of PLC cells through SLC38A2 downregulation
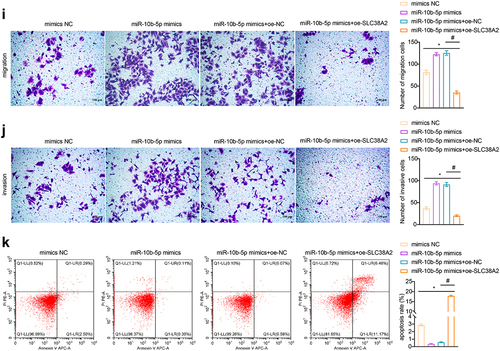
To clarify how miR-10b-5p regulate PLC cell functions, we used the TargetScan database (http://www.targetscan.org), miRDB database (http://www.mirdb.org/miRDB/index.html), Diana mirror database (http://diana.imis.athena-innovation.gr/DianaTools), and miRanda database (http://www.ebi.ac.uk/enright-srv/microcosiTi/htdo/targets) to predict the target genes of miR-10b-5p. We identified 162 overlapping target mRNAs between the four databases (). SLC38A2 was found to have binding sites with miR-10b-5p (ΔG binding: 87.91, ). Based on the TCGA-LIHC database, SLC38A2 was found to be decreased in PLC tissues compared to that in normal tissues using bioinformatical analysis (). Next, we proved that miR-10b-5p upregulation remarkably suppressed luciferase activity in HEK-293A cells expressing wild-type (wt) SLC38A2 3’ UTR reporters, while mutations in the miR-10b-5p targeting regions of the SLC38A2 3’ UTR ablated this effect, validating the direct binding between miR-10b-5p and SLC38A2 (). Subsequently, we detected SLC38A2 expression in the collected clinical samples and found that SLC38A2 levels were downregulated in PLC tissues compared to those in para-carcinoma tissues (). Additionally, miR-10b-5p overexpression inhibited SLC38A2 synthesis in HepG2 cells (), further verifying the inhibitory effect of miR-10b-5p on SLC38A2. Additionally, miR-10b-5p mimics dramatically boosted the proliferation (), migration (), invasion (), and impeded apoptosis () of HepG2 cells, whereas SLC38A2 overexpression abrogated these effects ()). These data prove that miR-10b-5p directly represses SLC38A2 to facilitate the proliferation, invasion, and migration of PLC cells.
Figure 4. miR-10b-5p facilitates the proliferation, migration, and invasion of PLC cells through SLC38A2 downregulation. (a) The target mRnas of miR-10b-5p. (b) Sequences of the predicted binding sites between miR-10b-5p and the 3′-UTR of SLC38A2 gene. (c) Boxplots of SLC38A2 expression in tissues. (d) Dual-luciferase reporter assay was conducted to identify direct interaction between miR-10b-5p and SLC38A2 mRNA. (E) RT-qPCR analysis of SLC38A2 expression in tissues. (f) RT-qPCR analysis of miR-10b-5p (left) and SLC38A2 (right) expression in HepG2 cells transfected with mimics NC, miR-10b-5p mimics, oe-NC, or oe-SLC38A2. (g) WB analysis of SLC38A2 protein levels in HepG2 cells. The band intensity was assessed (right). (h) CCK-8 assay of HepG2 cells. (i) Transwell migration assay of HepG2 cells. (j) Transwell invasion assay of HepG2 cells. (k) Flow cytometric analysis of apoptosis in HepG2 cells. *p < .05, ***p < .001; ns, no significant difference; #p < .05.
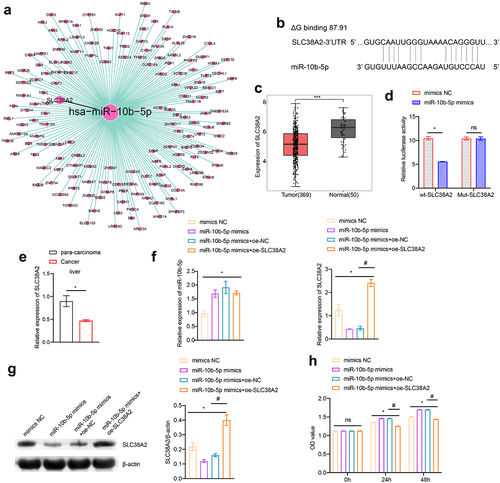
Figure 4. (Continued).
2.5. miR-10b-5p promotes PLC tumor growth in vivo
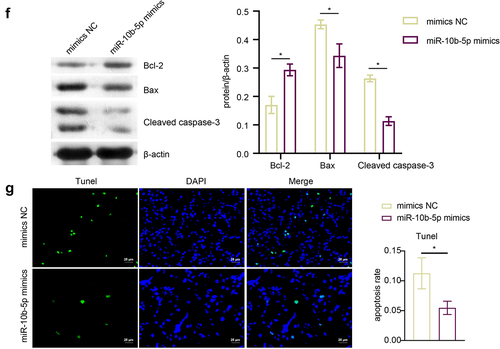
To determine the effect of miR-10b-5p on tumorigenicity of PLC in vivo, a PLC cell xenograft model was constructed in BALB/c nude mice. We previously tried to use HepG2 cells, which have the lowest miR-10b-5p level, for the nude mice PLC xenograft experiment, but HepG2 cells failed to grow in nude mice under our experimental system. Therefore, we chose SMMC-7721 cells with the second lowest miR-10b-5p expression level to construct the xenograft model. The tumors formed by miR-10b-5p-overexpressing SMMC-7721 cells were much larger and heavier than those in the mimic NC group ()). As detected by RT-qPCR and Western blot (WB), miR-10b-5p mimics increased miR-10b-5p expression () but decreased SLC38A2 expression ()) in xenograft tumors. In addition, miR-10b-5p overexpression enhanced Ki67 positive and PCNA positive cells (), increased anti-apoptotic Bcl-2 levels (), and repressed pro-apoptotic Bax and Cleaved caspase 3 levels () and the apoptosis rate () in xenograft tissues. These data suggest that miR-10b-5p promotes PLC tumor growth in vivo.
Figure 5. miR-10b-5p promotes PLC tumor growth in vivo. (A) nude mice grafted with SMMC-7721 cells transfected with mimics NC or miR-10b-5p mimics and the tumor sizes are shown. (B) The tumor growth curve, tumor volumes, and tumor weights of nude mice. (C) RT-qPCR analysis of miR-10b-5p (upper right) and SLC38A2 (bottom left) expression in tumor tissues. (D) WB analysis of SLC38A2 protein levels in tumor tissues. The band intensity was assessed (right). (E) IHC staining for Ki67 and PCNA expressions in tissues. (F) WB analysis of bcl-2, Bax, and cleaved caspase 3 in tumor tissues. The band intensity was assessed (right). (G) TUNEL staining and apoptosis rate in tumor tissues. *p < .05.
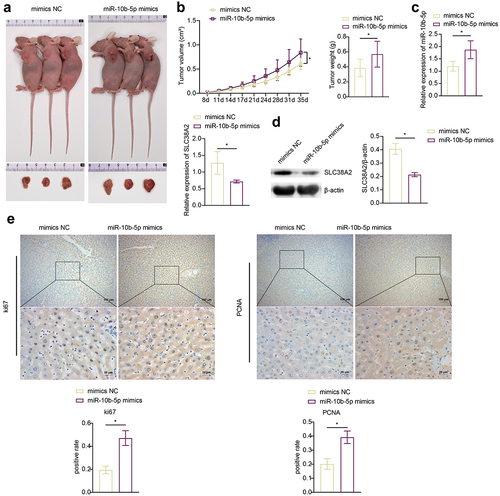
Figure 5. (Continued).
2.6. miR-10b-5p modulates the metabolic profiles of PLC tissues
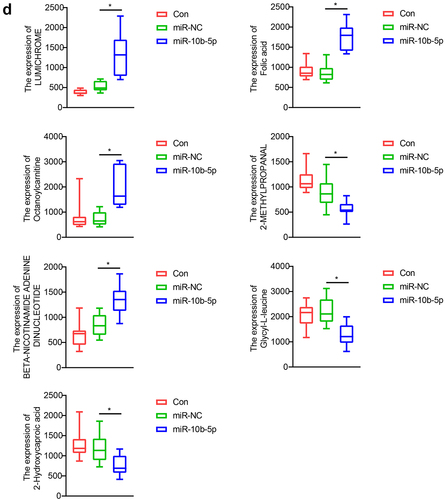
Finally, we performed Liquid chromatography – mass spectrometry (LC-MS) untargeted metabolomics to detect how miR-10b-5p influenced the metabolic reprogramming of PLC. Nude mice were grafted with SMMC-7721 cells, SMMC-7721 cells transfected with NC mimics, or miR-10b-5p mimics. Principal component analysis (PCA) () and partial least squares-discriminate analysis (PLS-DA) () indicated that the metabolic profiles in tumors differed between the control, NC mimics, and miR-10b-5p mimic groups. The heat map visually showed distinct tumor metabolites between the different groups (). Additionally, the boxplots show changes in key differential metabolites. Compared with the control and mimics NC groups, tumors overexpressing miR-10b-5p synthesized remarkably higher amounts of lumichrome, folic acid, octanoylcarnitine, and Beta-Nicotinamide adenine dinucleotide, but lower levels of 2-methylpropanal, glycyl-leucine, and 2-hydroxycaproic acid (). Functional prediction of metabolites revealed significant enrichment in steroid biosynthesis, one-carbon pool by folate, and aminoacyl-tRNA biosynthesis pathways (Supplementary Figure S2). These data implied that miR-10b-5p altered the metabolic features of PLC tissues.
Figure 6. miR-10b-5p modulates the metabolic profiles of tumor tissues. (a) PCA scores plot for different groups. (b) PLS-DA scores plot for different groups. (c) The heat map of the metabolic features in the tumor tissues of different groups. (d) Boxplots of several key differential metabolites expression. *p < .05.
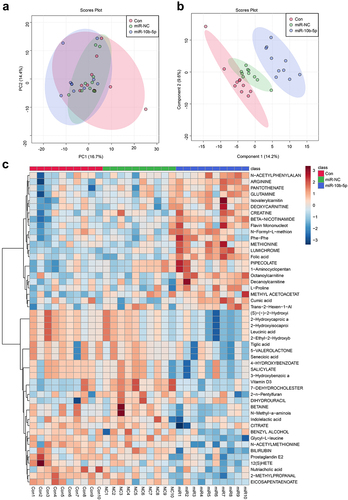
Figure 6. (Continued).
3. Discussion
As negative regulators of target genes, miRNAs play indispensable roles in the initiation and development of PLC.Citation8 Recent studies have revealed that miR-10b-5p exerts important functions in various tumors.Citation12 miR-10b-5p was markedly upregulated in gastric cancer (GC) tissues of GC patients and was positively correlated with poor prognosis in GC patients. Mechanistically, miR-10b-5p facilitates GC cell proliferation by targeting phosphatase and tensin homolog (PTEN) and activates cancer-associated fibroblasts by targeting Kruppel-like factor 11 (KLF11).Citation13 miR-10b-5p is also increased in triple-negative breast cancer (TNBC)Citation14 and contributes to the progression and metastasis of breast cancer (BC).Citation15,Citation16 LINC00324 and LncPDCD4-AS1, which are long non-coding RNAs, sponged miR-10b-5p to inhibit BC tumorigenicity, further demonstrating the oncogenic effects of miR-10b-5p.Citation14,Citation17 In addition, miR-10b-5p is notably upregulated in gliomas and directly boosted gliomagenesis.Citation18 Consistent with these studies, we revealed that miR-10b-5p expression was notably enhanced in tumor tissues compared to para-cancerous tissues using public databases as well as clinical sample analysis. Next, we confirmed by in vitro experiments that miR-10b-5p suppresses apoptosis and promotes the proliferation, invasion, and migration of PLC cells, indicating that miR-10b-5p might emerge as a promising biomarker for PLC.
SLC38A2, also called sodium-coupled neutral amino acid transporter 2 (SNAT2), is an important member of system A amino acid transporters and an essential neutral amino acid transporter in cells, mainly transferring glutamine into the cytoplasm.Citation19 Glutamine is a non-essential amino acid that can be synthesized by glutamine synthetase to meet these requirements. However, the robust growth of tumor cells demands a large amount of energy, and the intermediate metabolite glutamine, an important substrate for tumor cell metabolism, is consumed in large amounts. Thus, tumor cells must continuously absorb glutamine from the surrounding microenvironment to meet their needs for increased proliferation.Citation20 As a result, to increase intracellular glutamine content, tumor cells often express SLC38A2.Citation21 SLC38A2 is related to poor prognosis in BC,Citation22,Citation23 pancreatic cancerCitation24 and GC.Citation25 Hypoxia induces an increase in SLC38A2, thus promoting resistance to anti-hormone therapy in breast cancer.Citation22 SLC38A2 knockdown decreases intracellular glutamine concentration, inhibits oxidative stress, and increases the growth of breast cancer cells.Citation23 Overexpression of SLC38A2 significantly increases intracellular glutamine content in gastric cancer cells, which in turn promoted tumor stemness.Citation25 In addition, Parker et al. found that pancreatic ductal adenocarcinoma (PDAC) cells could facilitate alanine uptake by overexpressing SLC38A2, and the knockdown of SLC38A2 led to PDAC cell growth impairment.Citation24 However, our data indicated that SLC38A2 expression was decreased in PLC cells and tumor tissues. SLC38A2 overexpression promoted apoptosis and inhibited the proliferation, invasion, and migration of PLC cells, which contradicted the results of previous studies. We speculated that PLC cells might undergo other compensatory effects following inhibition of SLC38A2 expression by miR-10b-5p, such as upregulation of other amino acid transporters, such as SLC38A1, which ultimately boost PLC cell growth. In addition, Gjymishka et al. also found that the transcriptional activity of SLC38A2 was inhibited in HepG2 cells,Citation26 indicating a different regulatory mechanism of SLC38A2 in PLC cells from other tumor cells.
In contrast to normal cells, glucose metabolism in tumor cells is converted from the oxidative phosphorylation pathway to the glycolytic pathway, along with increased uptake and synthesis of lipids and amino acids. Such shifts in metabolic patterns are known as metabolic reprogramming and promote tumorigenesis and metastasis.Citation27 Recent studies have highlighted the crucial role of miRNAs in reprogramming PLC metabolism. miR-199a,Citation28 miR-122,Citation29 and miR-202Citation30 inhibit the proliferation of PLC cells by suppressing glycolysis. Mechanistically, miR-199a/miR-122 and miR-202 rearranged the glycolytic metabolic pattern of PLC cells by targeting pyruvate kinase M2 (PKM2)Citation28,Citation29 and hexokinase 2 (HK2),Citation30 which are key rate-limiting enzymes of glycolysis. miR-449 targets sirtuin 1 (SIRT1) and sterol regulatory element binding protein-1c (SREBP-1c) to inhibit adipogenesis and cholesterogenesis, eventually inducing proliferative repression of PLC cells.Citation31 The amino acid metabolism is regulated by miRNAs. miR-485-3p, miR-664, and miR-495 inhibit methionine adenosyltransferase 1A (MAT1A), a crucial enzyme synthesizing S-adenosine methionine.Citation32 Knockdown of miR-485-3p, miR-664, and miR-495 restricted growth and enhanced apoptosis of PLC cells.Citation32 Our data implied that miR-10b-5p modulated the metabolic profiles of PLC in tumor tissues. miR-10b-5p upregulated lumichrome, folic acid, octanoylcarnitine, and dinucleotide, while downregulating 2-methylpropanal, glycyl-leucine, and 2-hydroxycaproic acid in PLC tissues. SLC38A2, an amino acid transporter (AAT), was inhibited by miR-10b-5p in PLC, which may be the mechanism by which miR-10b-5p modulates PLC metabolic reprogramming.
Upregulation of AAT (SLC7A5/LAT1, SLC38A2/SNAT2 and SLC1A5/ASCT2) in most KRAS-mutated colorectal cancer (CRC) cells and its association with increased amino acid uptake, such as glutamine and leucine.Citation33 The regulation of SLC38A2 occurs at both the transcriptional and translational levels and is influenced by direct interactions with ions and proteins.Citation34 Additionally, functional predictions of metabolites have shown that the steroid biosynthesis, one-carbon pool by folate, and aminoacyl-tRNA biosynthesis pathways are enriched. However, it remains uncertain whether SLC38A2 interacts with metabolites in these pathways, an area worth further exploration in future research.
Collectively, our results demonstrated that miR-10b-5p promotes metabolic reprogramming by targeting SLC38A2, leading to enhanced proliferation, invasion, and migration of PLC cells. Therefore, miR-10b-5p and SLC38A2 may be promising targets for the diagnosis and treatment of PLC.
4. Materials and methods
4.1. Bioinformatics analysis
Transcriptome data from TCGA-LIHC were obtained from The Cancer Genome Atlas (TCGA) database (https://portal.gdc.cancer.gov/). TCGA-LIHC analysis included 49 normal tissue samples and 369 PLC tissue samples. Analysis of differentially expressed miRNAs or mRNAs from TCGA data was performed using the R-language “multiMiR” or “limma” package with the criteria |logFC|>1 and p < .05.
4.2. Clinical sample collection
Six pairs of PLC tissues (cancer) and matched para-carcinoma normal tissues (para-carcinoma) were collected from the Hunan Cancer Hospital. This study was approved by the Medical Ethics Committee of Hunan Cancer Hospital (KYJJ-2020-049) and informed consent was obtained from all participants.
4.3. Cell culture and treatment
The human normal liver cell line (L-02) and liver cancer cell lines (Huh7, HepG2, Hep3B, SMMC-7721, and SK-Hep-1) were purchased from Procell (Wuhan, China). L-02 and SMMC-7721 cells were maintained in RPMI 1640 (#11875119, Thermo Fisher, USA) supplemented with 5% FBS (#12303C, Sigma-Aldrich, USA) and 1% penicillin/streptomycin (#SV30010, GE Healthcare, USA). The remaining cells were cultured in DMEM (#10313021, Thermo Fisher, USA) containing 10% FBS and 1% penicillin/streptomycin. Cells were all incubated in a humidified 5% CO2 incubator at 37°C.
HepG2 cells were transfected with miR-10b-5p mimics, mimics NC (GenePharma, China), oe-NC, or oe-SLC38A2 vector (HonorGene, China). SK-Hep-1 cells were transfected with miR-10b-5p inhibitors and inhibitor NC (GenePharma, China) using Lipofectamine 2000 (#11668019, Thermo Fisher, USA) according to the manufacturer’s guidelines. To induce apoptosis, SK-Hep-1 and HepG2 cells were treated with the apoptosis inducer staurosporine (STS, 5 μM, #S1421, Selleck, USA) for 12 h.
4.4. RNA isolation and RT-qPCR
TRIzol reagent (#15596026, Thermo Fisher, USA) was used for RNA extraction from tissues or cells. The mRNA cDNA and miRNA cDNA were synthesized using commercial cDNA synthesis kits (#CW2569 and #CW2141, Cwbiotech, China). An UltraSYBR Mixture (#CW2601, Cwbiotech, China) was used to perform quantitative PCR on a PCR instrument (#PIKOREAL96, Thermo Fisher, USA). The mRNA and miRNA expression levels were normalized to those of β-actin and U6, respectively. The primer sequences are presented in .
Table 1. The primers used for RT-qPCR analysis.
4.5. Immunohistochemical (IHC) analysis
A microtome (#M199, Leica, Germany) was used to slice the paraffin-embedded tissues to a thickness of 3 μm. The sections were then deparaffinized with xylene and successively rehydrated with ethanol. After inactivation of the endogenous peroxidase using .3% H2O2, the slides were washed with PBS. Slides were stained at 4°C overnight with anti-Ki67 (1:200; #ab16667, Abcam, UK) or anti-PCNA (1:200; #ab29, Abcam, UK). The next day, sections were washed with PBS and probed with anti-mouse (1:200, #SA00013–3, Proteintech, USA) or anti-rabbit (1:200, #SA00013–2, Proteintech, USA) antibodies at 37°C for 90 min. After rinsing with PBS, the sections were incubated with DAB working solution (#ZLI-9017, ZSGB-Bio, China) at room temperature for 5 min. Hematoxylin, gradient ethanol, and xylene were used to re-stain, dehydrate, and clear the sections, successively. After sealing with neutral gum, the slides were observed under a microscope (#BA410T; Motic, China).
4.6. WB analysis
Total protein was extracted from tissues and cells using RIPA lysis buffer (#AWB0136, Abiowell, China) in the presence of a protease inhibitor (#583794, Gentihold, China). Protein content was determined using a BCA protein assay kit (#23227, Thermo Fisher, USA). Proteins were resolved by SDS-PAGE and electrotransferred onto PVDF membranes (#1620177, Bio-Rad, USA). Blocking with 5% skim milk (#AWB0004, Abiowell, China), the blots were probed overnight at 4°C with B cell lymphoma-2 (Bcl-2, 1:500, #ab59348, Abcam, UK), Bcl-2-associated X protein (Bax, 1:5000, #50599–2-Ig, Proteintech, USA), Caspase 3 (1:1000, #19677–1-Ap, Proteintech, USA), solute carrier family 38 member 2 (SLC38A2, 1:1000, #Bs -12,125 R, Bioss, China), and β-actin (1:5000, #66009–1-Ig, Proteintech, USA) primary antibodies. The blots were then washed with PBS, incubated with horseradish peroxidase (HRP)-conjugated anti-mouse (1:5000, #SA00001–1, Proteintech, USA) and anti-rabbit (1:6000, #SA00001–2, Proteintech, USA) antibodies, and visualized using ECL WB Substrate (#AWB0005b, Abiowell, China). The blots were imaged and quantified using Quantity One software.
4.7. Apoptosis detection
TUNEL staining was used to evaluate tissue apoptosis using a TUNEL assay kit (#KGA704, KeyGEN Biotech, China), according to the manufacturer’s instructions. For in vitro experiments, flow cytometry was used to estimate cell apoptosis using an Annexin V-FITC/PI Kit (#KGA108, KeyGEN Biotech, China), according to the manufacturer’s protocol.
4.8. CCK-8 assay
The cells were seeded in 96-well plates at a density of 1 × 10Citation4 cells/100 μL per well. After transfection for 0 hours, 24, or 48 h, CCK-8 solution (#NU679, Dojindo, Japan) of 10 μL per well was used to treat cells, which were then maintained in a humidified 37°C incubator containing 5% CO2 for 4 h. The OD value was measured at 450 nm using a microplate reader (#MB-530, Huisong Technology, China).
4.9. Transwell assay
The migration and invasion of SK-Hep-1 and HepG2 cells were detected using a transwell system. First, the cells were detached using .25% trypsin (#C0201, Beyotime Biotech, China) and resuspended in serum-free medium to a density of 1 × 10Citation5 cells/mL. Next, the upper chambers (#33318035, Corning, USA) were filled with 100 μL of cell suspension and the lower chambers were loaded with 500 μL of medium containing 10% FBS. For the invasion assay, the upper chambers were pre-coated with Matrigel (#356231, Corning, USA) before cell seeding, according to the manufacturer’s instructions. After culturing for 48 h, migratory or invasive cells in the lower chambers were fixed with 4% paraformaldehyde (#N1012, New Cell & Molecular Biotech, China), stained with crystal violet (#C8470, Solarbio Life Sciences, China), and counted using a microscope (#DSZ2000X, Beijing Cnmicro Instrument, China).
4.10. Dual-luciferase reporter assay
HEK-293A cells with high transfection efficiency was used for the validation of microRNA targets and a dual firefly-Renilla luciferase reporter assay.Citation35 The 3’ UTR binding sequence of SLC38A2, comprising the wild-type or mutant predicted miR-10b-5p targeting regions, was cloned into luciferase reporter vectors using HonorGene (Changsha, China). The HEK-293A cells (#AW-CNH216, Abiowell, China) were co-transfected with the synthesized luciferase constructs, miR-10b-5p mimic or mimic NC (GenePharma, China), using Lipofectamine 2000 (#11668019, ThermoFisher, USA). After 48 h, the luciferase activities of firefly and Renilla were detected using a dual-luciferase reporter assay system (#E1910, Promega, USA) following the manufacturer’s protocol.
4.11. Tumorigenicity assay in vivo
The animal studies were approved by the Medical Ethics Committee of Hunan Cancer Hospital (KYJJ-2020-049). Four-week-old BALB/C nude mice purchased from Hunan SJA Laboratory Animal Co., Ltd., were used to establish a xenograft model. SMMC-7721 cells (3 × 10⁶ cells/100 μL per mouse) transfected with miR-10b-5p mimics or NC mimics (GenePharma, China) were subcutaneously injected into the axillae of the anterior left limb of the mice.Citation36 The tumor volumes were measured twice per week. Thirty-five days later, the mice were sacrificed, and tumors were harvested for weighing, imaging, and further detection.
4.12. LC-MS untargeted metabolomics
LC-MS analysis was conducted using a mass spectrometer (#TripleTOF5600+, AB Sciex, USA). Tumor tissue extracts from different groups were centrifuged at 1 × 10⁴ rpm for 10 min, and the supernatant was collected and diluted to the appropriate concentration using 50% methanol. The extracts were subsequently filtered using a .22 μm filter and separated using an HSS T3 column (100 × 2.1 mm, 1.7 μm; Waters, USA) at 40°C. The mobile phases A and B were H2O (.1% FA) and acetonitrile, respectively. The liquid phase gradient conditions were .01 min, A:B = 99:1; 1.5 min, A:B = 99:1; 13 min, A:B = 1:99; 16.5 min, A:B = 1:99; 16.6 min, A:B = 99:1; 20 min. Metabolomic analysis of LC-MS data was performed by Changsha Abiowell Biotechnology Co., Ltd.
4.13. Statistical analysis
Data were analyzed and graphed using the GraphPad Prism 7 software. Student’s t-test or one-way analysis of variance (ANOVA) followed by Tukey’s post hoc test were used to determine the significance between two or more groups, respectively. Data are presented as the mean ± standard deviation (SD), and differences with p < .05 were considered statistically significant at p < .05.
Ethical statement
This study was approved by the Medical Ethics Committee of Hunan Cancer Hospital (KYJJ-2020-049) and informed consent was obtained from all participants.
Supplemental Material
Download Zip (2.3 MB)Disclosure statement
No potential conflict of interest was reported by the author(s).
Data availability statement
The datasets used and analyzed during the current study are included in this article.
Supplementary material
Supplemental data for this article can be accessed online at https://doi.org/10.1080/15384047.2024.2315651
Additional information
Funding
Notes on contributors
Mingzhi Xia
Mingzhi Xia, graduated from the Central South University, Master of Medicine, Associate Chief Physician, and now works in the Breast Surgery Department I, Hunan Cancer Hospital/the Affiliated Cancer Hospital of Xiangya School of Medicine, Central South University. His main focus is on basic and clinical research of breast tumors, as well as clinical diagnosis and treatment.
Jie Chen
Jie Chen, graduated from Xiangya School of Medicine, Central South University, Master of Medicine, Associate Chief Physician, and now works in the Liver and gallbladder surgery Department I, Hunan Cancer Hospital/the Affiliated Cancer Hospital of Xiangya School of Medicine, Central South University. He specializes in the basic and clinical research of liver and gallbladder malignant tumors.
Yingyun Hu
Yingyun Hu, graduated from the Xiangya School of Public Health, Central South University, major in Epidemiology and Health Statistics, Master of Medicine, Associate Chief Physician. She currently works in the Hunan Cancer Prevention and Control Office, Hunan Cancer Hospital/the Affiliated Cancer Hospital of Xiangya School of Medicine, Central South University. Her main focus is on cancer prevention and control.
Bin Qu
Bin Qu, graduated from Central South University, major in Immunology, Master of Medicine. He currently works in the Department of Clinical Laboratory, Hunan Key Laboratory of Oncotarget Gene, Hunan Cancer Hospital/the Affiliated Cancer Hospital of Xiangya School of Medicine, Central South University, mainly engaged in basic and clinical research on ovarian cancer.
Qianqian Bu
Qianqian Bu, graduated from Xiangya School of Medicine, Central South University, major in Clinical Laboratory Diagnosis, Master of Medicine, Associate Chief Technician, works in the Department of Clinical Laboratory, Hunan Key Laboratory of Oncotarget Gene, Hunan Cancer Hospital/the Affiliated Cancer Hospital of Xiangya School of Medicine, Central South University, and mainly engaged in research on gastrointestinal tumors, bone tumors, and lymphoma.
Haoming Shen
Haoming Shen, graduated from the Tongji Medical College of Huazhong University of Science & Technology, major in Immunology, Master of Medicine, Chief Technician. and is now working in the Department of Clinical Laboratory, Hunan Key Laboratory of Oncotarget Gene, Hunan Cancer Hospital/the Affiliated Cancer Hospital of Xiangya School of Medicine, Central South University. He is mainly engaged in liver cancer and its related immunology research.
References
- McGlynn KA, Petrick JL, El-Serag HB. Epidemiology of Hepatocellular Carcinoma. Hepatology. 2021;73(Suppl 1):4–15. doi:10.1002/hep.31288.
- Chan LK, Tsui YM, Ho DW, Ng IO. Cellular heterogeneity and plasticity in liver cancer. Semin Cancer Biol. 2022. 82:134–49. doi:10.1016/j.semcancer.2021.02.015.
- Anwanwan D, Singh SK, Singh S, Saikam V, Singh R. Challenges in liver cancer and possible treatment approaches. Biochim Biophys Acta Rev Cancer. 2020;1873(1):188314. doi:10.1016/j.bbcan.2019.188314.
- Riddiough GE, Jalal Q, Perini MV, Majeed AW. Liver regeneration and liver metastasis. Semin Cancer Biol. 2021. 71:86–97. doi:10.1016/j.semcancer.2020.05.012.
- Bao MH, Hypoxia WC. Metabolic reprogramming, and drug resistance in liver cancer. Cells. 2021;10(7):1715. doi:10.3390/cells10071715.
- Su GL, Altayar O, O’Shea R, Shah R, Estfan B, Wenzell C, Sultan S, Falck-Ytter Y. AGA Clinical Practice Guideline on Systemic Therapy for Hepatocellular Carcinoma. Gastroenterology. 2022;162(3):920–934. doi:10.1053/j.gastro.2021.12.276.
- Wang X, He Y, Mackowiak B, Gao B. MicroRNAs as regulators, biomarkers and therapeutic targets in liver diseases. Gut. 2021;70(4):784–95. doi:10.1136/gutjnl-2020-322526.
- Mohr R, Ozdirik B, Lambrecht J, Demir M, Eschrich J, Geisler L, Hellberg T, Loosen SH, Luedde T, Tacke F, et al. From liver cirrhosis to cancer: the role of micro-RNAs in hepatocarcinogenesis. Int J Mol Sci. 2021;22(3):1492. doi:10.3390/ijms22031492.
- Yan W, Wu X, Zhou W, Fong MY, Cao M, Liu J, Liu X, Chen C-H, Fadare O, Pizzo DP, et al. Cancer-cell-secreted exosomal miR-105 promotes tumour growth through the MYC-dependent metabolic reprogramming of stromal cells. Nat Cell Biol. 2018;20(5):597–609. doi:10.1038/s41556-018-0083-6.
- Yin J, Shi Z, Wei W, Lu C, Wei Y, Yan W, Li R, Zhang J, You Y, Wang X, et al. MiR-181b suppress glioblastoma multiforme growth through inhibition of SP1-mediated glucose metabolism. Cancer Cell Int. 2020;20(1):69. doi:10.1186/s12935-020-1149-7.
- Liu C, Cai L, Li H. miR185 regulates the growth of osteosarcoma cells via targeting hexokinase 2. Mol Med Rep. 2019. 20:2774–2782. doi:10.3892/mmr.2019.10534.
- Li W, Li C, Xiong Q, Tian X, Ru Q. MicroRNA-10b-5p downregulation inhibits the invasion of glioma cells via modulating homeobox B3 expression. Exp Ther Med. 2019. 17:4577–4585. doi:10.3892/etm.2019.7506.
- Yan T, Wang X, Wei G, Li H, Hao L, Liu Y, Yu X, Zhu W, Liu P, Zhu Y, et al. Exosomal miR-10b-5p mediates cell communication of gastric cancer cells and fibroblasts and facilitates cell proliferation. J Cancer. 2021;12(7):2140–50. doi:10.7150/jca.47817.
- Wang D, Wang Z, Zhang L, Sun S. LncRNA PDCD4-AS1 alleviates triple negative breast cancer by increasing expression of IQGAP2 via miR-10b-5p. Transl Oncol. 2021;14(1):100958. doi:10.1016/j.tranon.2020.100958.
- Meerson A, Eliraz Y, Yehuda H, Knight B, Crundwell M, Ferguson D, Lee BP, Harries LW. Obesity impacts the regulation of miR-10b and its targets in primary breast tumors. BMC Cancer. 2019;19(1):86. doi:10.1186/s12885-019-5300-6.
- Khalighfard S, Alizadeh AM, Irani S, Omranipour R. Plasma miR-21, miR-155, miR-10b, and let-7a as the potential biomarkers for the monitoring of breast cancer patients. Sci Rep. 2018;8(1):17981. doi:10.1038/s41598-018-36321-3.
- Wang B, Zhang Y, Zhang H, Lin F, Tan Q, Qin Q, Bao W, Liu Y, Xie J, Zeng Q, et al. Long intergenic non-protein coding RNA 324 prevents breast cancer progression by modulating miR-10b-5p. Aging (Albany NY). 2020;12(8):6680–99. doi:10.18632/aging.103021.
- Yang Y, Liu X, Zheng J, Xue Y, Liu L, Ma J, Wang P, Yang C, Wang D, Shao L, et al. Interaction of BACH2 with FUS promotes malignant progression of glioma cells via the TSLNC8–miR-10b-5p–WWC3 pathway. Mol Oncol. 2020;14(11):2936–2959. doi:10.1002/1878-0261.12795.
- Broer S. Amino acid transporters as targets for cancer therapy: why, where, when, and how. Int J Mol Sci. 2020;21(17):6156. doi:10.3390/ijms21176156.
- Broer S, Broer A. Amino acid homeostasis and signalling in mammalian cells and organisms. Biochem J. 2017;474(12):1935–63. doi:10.1042/BCJ20160822.
- Schioth HB, Roshanbin S, Hagglund MG, Fredriksson R. Evolutionary origin of amino acid transporter families SLC32, SLC36 and SLC38 and physiological, pathological and therapeutic aspects. Mol Aspects Med. 2013;34(2–3):571–85. doi:10.1016/j.mam.2012.07.012.
- Morotti M, Bridges E, Valli A, Choudhry H, Sheldon H, Wigfield S, Gray N, Zois CE, Grimm F, Jones D, et al. Hypoxia-induced switch in SNAT2/SLC38A2 regulation generates endocrine resistance in breast cancer. Proc Natl Acad Sci U S A. 2019;116(25):12452–61. doi:10.1073/pnas.1818521116.
- Morotti M, Zois CE, El-Ansari R, Craze ML, Rakha EA, Fan SJ, Valli A, Haider S, Goberdhan DCI, Green AR, et al. Increased expression of glutamine transporter SNAT2/SLC38A2 promotes glutamine dependence and oxidative stress resistance, and is associated with worse prognosis in triple-negative breast cancer. Br J Cancer. 2021;124(2):494–505. doi:10.1038/s41416-020-01113-y.
- Parker SJ, Amendola CR, Hollinshead KER, Yu Q, Yamamoto K, Encarnacion-Rosado J, Rose RE, LaRue MM, Sohn ASW, Biancur DE, et al. Selective Alanine Transporter Utilization Creates a Targetable Metabolic Niche in Pancreatic Cancer. Cancer Discov. 2020;10(7):1018–37. doi:10.1158/2159-8290.CD-19-0959.
- Nie K, Cai M. SNAT2/SLC38A2 confers the stemness of gastric cancer cells via regulating glutamine level. Dig Dis Sci. 2022;67(7):2948–2956. doi:10.1007/s10620-021-07110-2.
- Gjymishka A, Palii SS, Shan J, Kilberg MS. Despite increased ATF4 binding at the C/EBP-ATF composite site following activation of the unfolded protein response, system a transporter 2 (SNAT2) transcription activity is repressed in HepG2 cells. J Biol Chem. 2008;283(41):27736–47. doi:10.1074/jbc.M803781200.
- Pavlova NN, Zhu J, Thompson CB. The hallmarks of cancer metabolism: still emerging. Cell Metab. 2022;34(3):355–77. doi:10.1016/j.cmet.2022.01.007.
- Zhang LF, Lou JT, Lu MH, Gao C, Zhao S, Li B, Liang S, Li Y, Li D, Liu M-F, et al. Suppression of miR-199a maturation by HuR is crucial for hypoxia-induced glycolytic switch in hepatocellular carcinoma. EMBO J. 2015;34(21):2671–85. doi:10.15252/embj.201591803.
- Xu Q, Zhang M, Tu J, Pang L, Cai W, Liu X. MicroRNA-122 affects cell aggressiveness and apoptosis by targeting PKM2 in human hepatocellular carcinoma. Oncol Rep. 2015;34(4):2054–64. doi:10.3892/or.2015.4175.
- Wang J, Chen J, Sun F, Wang Z, Xu W, Yu Y, Ding F, Shen H. miR‑202 functions as a tumor suppressor in hepatocellular carcinoma by targeting HK2. Oncol Lett. 2020. 19:2265–2271. doi:10.3892/ol.2020.11334.
- Zhang H, Feng Z, Huang R, Xia Z, Xiang G, Zhang J. MicroRNA-449 suppresses proliferation of hepatoma cell lines through blockade lipid metabolic pathway related to SIRT1. Int J Oncol. 2014;45(5):2143–52. doi:10.3892/ijo.2014.2596.
- Yang H, Cho ME, Li TW, Peng H, Ko KS, Mato JM, Lu SC. MicroRNAs regulate methionine adenosyltransferase 1A expression in hepatocellular carcinoma. J Clin Invest. 2013;123(1):285–298. doi:10.1172/JCI63861.
- Kandasamy P, Zlobec I, Nydegger DT, Pujol-Giménez J, Bhardwaj R, Shirasawa S, Tsunoda T, Hediger MA. Oncogenic KRAS mutations enhance amino acid uptake by colorectal cancer cells via the hippo signaling effector YAP1. Mol Oncol. 2021;15(10):2782–2800. doi:10.1002/1878-0261.12999.
- Menchini RJ, Chaudhry FA. Multifaceted regulation of the system a transporter Slc38a2 suggests nanoscale regulation of amino acid metabolism and cellular signaling. Neuropharmacology. 2019. 161:107789. doi:10.1016/j.neuropharm.2019.107789.
- Alvarez ML. Faster experimental validation of microRNA targets using cold fusion cloning and a dual firefly-renilla luciferase reporter assay. Methods Mol Biol. 2014;1182:227–243.
- Li H, Wang N, Xu Y, Chang X, Ke J, Yin J. Upregulating microRNA-373-3p promotes apoptosis and inhibits metastasis of hepatocellular carcinoma cells. Bioengineered. 2022;13(1):1304–19. doi:10.1080/21655979.2021.2014616.