
ABSTRACT
We aimed to evaluate the influence of sirtuin1 (sirt1) on the ESCC chemotherapeutic sensitivity to cisplatin. We used ESCC cell ablation sirt1 for establishing a xenograft mouse tumor model. The tumor volume was then detected. sirt1 was over-expressed significantly in ESCC patients and cells. Moreover, sirt1 knockdown raised ESCC sensitivity to cisplatin. Besides, glycolysis was associated with ESCC cell chemotherapy resistance to cisplatin. Furthermore, sirt1 increased ESCC cells’ cisplatin chemosensitivity through HK2. Sirt1 enhanced in vivo ESCC chemosensitivity to cisplatin. Overall, these findings suggested that sirt1 knockdown regulated the glycolysis pathway and raised the ESCC chemotherapeutic sensitivity.
Introduction
EC (esophageal cancer) is a digestive system’s malignant cancer in the world. Principal pathological kind is ESCC (esophageal squamous cell carcinoma).Citation1 At present, there are many therapeutic drugs for ESCC, such as paclitaxel, cisplatin, and 5-fluorouracil.Citation2 Among these drugs, cisplatin is first approved as an antineoplastic agent, which is widely used in the treatment of diverse cancers.Citation3 However, it has been uncovered that cisplatin causes drug resistance in chemotherapy, which seriously affects patients’ survival rates.Citation4
It is reported that glycolysis is closely associated with drug resistance, and glycolysis suppression of cancer cells is a promising strategy for overcoming antimicrobial resistance.Citation5,Citation6 Convincing evidence has revealed that the uncontrollable proliferation of tumor cells is often accompanied by adaptive changes in energy metabolism.Citation7 As early as the 1950s, Otto Warburg discovered that tumor cells have abnormalities in glycometabolism: even under normoxic conditions, tumor cells would reprogram their metabolic programs and preferentially select glycolytic pathways for energy.Citation8
It is currently known that the sirtuin (sirt) family is primarily related to the modulation of metabolic diseases and aging and is widely involved in tumor progression.Citation9 The sirtuin family is mainly composed of seven different members (sirt1–7), among which sirt1 is demonstrated to be implicated in chemotherapeutics resistance in cancers.Citation10 It participates in DNA damage and repair, and apoptosis and metabolism of drugs cause multi-drug resistance.Citation11 Moreover, sirt1 is unveiled to facilitate glycolysis, accelerating malignant progression in bladder cancer.Citation12
HK2 (hexokinase 2) is one of four isozymes of hexokinase in mammalian metabolism.Citation13 The HK2 functions in tumor cells include metabolic rewiring toward aerobic glycolysis, autophagy tuning to handle nutrient shortages, and shielding from cell death stimuli.Citation14 Especially, sirt1 is proven to positively regulate HK2 expression, contributing to glycolysis in the malignant progression of TK6 cells.Citation15 Nevertheless, whether sirt1 can interact with HK2 to affect glycolysis in ESCC has not been reported.
Therefore, in this study, we hypothesized that the chemotherapeutic sensitivity of ESCC to cisplatin was regulated by sirt1, and the glycolysis pathway was related to this regulation. Several vivo and in vitro experiments from molecular and cellular aspects were carried out.
Results
Increased sirt1 expression in ESCC cells and tissues
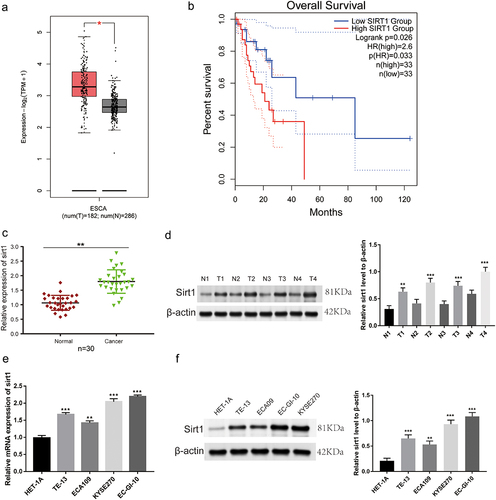
Firstly, we explored the expression and prognosis of sirt1 according to data from The Cancer Genome Atlas (TCGA) database. We found that mRNA expression of sirt1 was boosted in ESCC tissues compared to usual tissues (p < .05, ). The high expression level of sirt1 was related to ESCC patients’ poor prognosis (p = .026, ). Sirt1 expression level was improved in ESCC tissues when compared to usual tissues (p < .01, ). As expected, we observed increased sirt1 mRNA (p < .01) and protein (p < .01) levels in ESCC cell lines (TE-13, ECA109, KYSE270, and EC-GI-10) in comparison with HET-1A cells, especially KYSE270 and EC-GI-10 cells ().
Figure 1. Sirt1 is highly expressed in ESCC tissues and cells. (a) The expression of sirt1 was analyzed in normal and tumor tissues of ESCC patients based on the Cancer Genome Atlas (TCGA) database. (b) The prognosis of sirt1 was analyzed based on TCGA database. (c) The qRT-PCR experiment was utilized to test the mRNA expression level of sirt1 in cancerous tissues and adjacent normal tissues of ESCC patients. ***p < .001 vs. Normal tissues. (d) Western blotting was utilized to test the protein level of sirt1 in cancerous tissues and adjacent normal tissues of ESCC patients. N, normal; T, tumor. ***p < .001 vs. Normal tissues. (e) Sirt11 mRNA expression level in HET-1A, TE-13, ECA109, EC-GI-10 and KYSE270 cell lines. **p < .01, ***p < .001 vs. HET-1A group. (f) Sirt11 protein expression level in HET-1A, TE-13, ECA109, EC-GI-10 and KYSE270 cell lines. **p < .01, ***p < .001 vs. HET-1A group.
Sirt1 knockdown prevents ESCC cell proliferation and promotes cell apoptosis
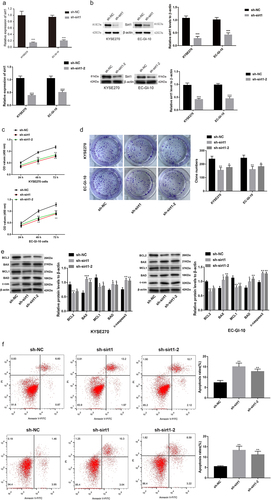
We conducted quantitative real time-polymerase chain reaction (qRT-PCR), western blot, 3-(4, 5-Dimethylthiazolyl2)-2, 5-diphenyltetrazolium bromide (MTT), and clone formation experiments. Sirt1 protein and mRNA levels were significantly decreased in the short hairpin (sh)-sirt1/sh-sirt1–2 group while comparing to the sh-negative control (NC) group (p < .001, ). Transfection of sh-sirt1/sh-sirt1–2 led to reduction of cell viability at 48 h and 72 h (p < .01, ). The clone number of EC-GI-10 and KYSE270 cells was significantly reduced in response to sirt1 knockdown (p < .05, ). Besides, western blotting and flow cytometry were applied to detect cell apoptosis. We found that BCL-2 and MCL1 protein levels were reduced by sirt1 knockdown, while BAD, BAX, and c-caspase3 protein levels were increased by sirt1 knockdown in EC-GI-10 and KYSE270 cells (p < .05, ). Also, the result of flow cytometry showed that the apoptosis rates of EC-GI-10 and KYSE270 cells were significantly increased after sirt1 knockdown (p < .01, ).
Figure 2. Sirt1 knockdown suppresses proliferation and promotes apoptosis in ESCC cells. (a) qRT-PCR was used to test sirt1 mRNA expression level in KYSE270 and EC-GI-10 cells. (b) Western blotting assay was used to detect sirt1 protein level in KYSE270 and EC-GI-10 cells. (c) Cell viability of KYSE270 and EC-GI-10 cells was determined by MTT. (d) Cell proliferation was tested by clone formation experiment in KYSE270 and EC-GI-10 cells. (e) Protein levels of apoptosis-related proteins were detected by western blotting in KYSE270 and EC-GI-10 cells. (f) The apoptosis rates of KYSE270 and EC-GI-10 cells were determined by flow cytometry. *p < .05, **p < .01, ***p < .001, vs. sh-NC.
Sirt1 knockdown represses glycolysis in ESCC cells
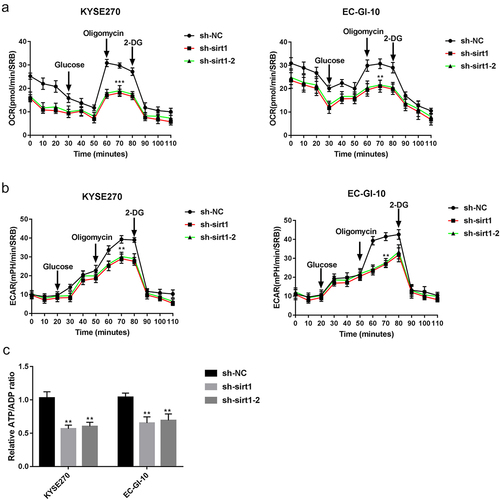
Then, the sirt1 influence on glycolysis was explored in ESCC cells. It was found that oxygen consumption rate (OCR) was markedly reduced by sirt1 knockdown in EC-GI-10 and KYSE270 cells (p < .01, ). Likewise, extracellular acidification rate (ECAR) was significantly reduced by sirt1 knockdown in EC-GI-10 and KYSE270 cells (p < .01, ). Moreover, the relative adenosine-triphosphate (ATP)/adenosine diphosphat (ADP) ratio in KYSE270 and EC-GI-10 cells was decreased after sirt1 knockdown (p < .01, ). The above outcomes suggested that sirt1 knockdown impaired glycolysis in ESCC cells.
Figure 3. Sirt1 knockdown represses glycolysis in ESCC cells. (a) Mitochondrial stress test of sh-NC, sh-sirt1 and sh-sirt1–2. Vertical lines in the graph indicate times for addition of compound and mitochondrial suppressors. (b) Impacts of sh-NC, sh-sirt1 and sh-sirt1–2 on ECAR (glycolysis rate) in KYSE270 and EC-GI-10 cells, respectively. (c) Influences of sh-NC, sh-sirt1 and sh-sirt1–2 on relative ATP/ADP ratio. **p < .01, ***p < .001, vs. sh-NC.
Sirt1 knockdown raises cisplatin sensitivity in ESCC
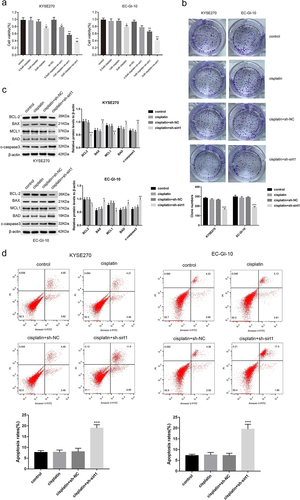
Afterward, whether sirt1 could influence the ESCC cell sensitivity to cisplatin was explored. The viability of KYSE270 and EC-GI-10 cells in the 2 μM cisplatin group was reduced relative to that in the control (p < .05) (). The viability of KYSE270 and EC-GI-10 cells treated by cisplatin (0.5 μM), cisplatin (1 μM), and cisplatin (2 μM) was all reduced after sirt1 knockdown (p < .05, ). Then, 1 μM cisplatin was used for the following experiments. As shown in , the clone number of KYSE270 and EC-GI-10 cells was significantly reduced in the cisplatin + sh-sirt1 group when relative to the control, cisplatin, and cisplatin + sh-NC groups (p < .001). Furthermore, we applied western blot and flow cytometry to test the KYSE270 and EC-GI-10 cell apoptosis. It came out that BCL-2 and MCL1 protein levels were reduced by cisplatin + sh-sirt1, while protein levels of BAX, BAD, and c-caspase3 were raised by cisplatin + sh-sirt1 (p < .05, ). The apoptosis rate of KYSE270 and EC-GI-10 cells was raised by cisplatin + sh-sirt1 (p < .001, ).
Figure 4. Sirt1 knockdown increases the sensitivity of cisplatin in ESCC. (a) Cell viability of KYSE270 and EC-GI-10 cells was determined by MTT at 48 h. (b) Cell proliferation was tested by clone formation experiment in KYSE270 and EC-GI-10 cells. (c) The protein levels of apoptosis-related proteins were detected by western blotting in KYSE270 and EC-GI-10 cells. (d) Cell apoptosis was determined by flow cytometry in KYSE270 and EC-GI-10 cells. *p < .05, **p < .01, ***p < .001, vs. cisplatin + sh-NC.
Glycolysis is involved in ESCC cell chemotherapy resistance to cisplatin
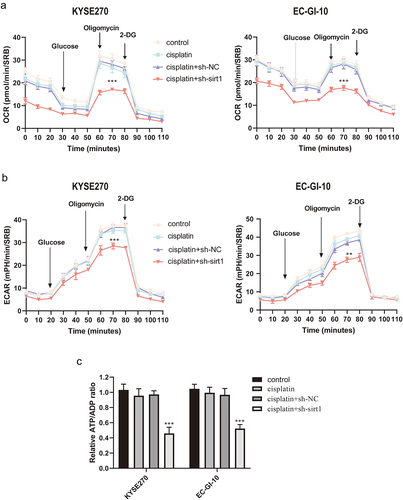
OCR, ECAR, and ATP were determined. As expected, treatment with cisplatin + sh-sirt1 resulted in a significant reduction of OCR in EC-GI-10 and KYSE270 cells (p < .001, ). Also, cisplatin + sh-sirt1 remarkably reduced ECAR in EC-GI-10 and KYSE270 cells (p < .01, ). The ATP/ADP ratios after cisplatin + sh-sirt1 treatment were lower than the cisplatin + sh-NC group (p < .001, ).
Figure 5. Glycolysis is involved in chemotherapy resistance of ESCC cells with cisplatin. (a) Mitochondrial stress test of control, cisplatin, cisplatin + sh-NC and cisplatin + sh-sirt1. Vertical lines in the graph indicate times for addition of compound and mitochondrial suppressors. (b) Impacts of control, cisplatin, cisplatin + sh-NC and cisplatin + sh-sirt1 treatment on ECAR (glycolysis rate) in KYSE270 and EC-GI-10 cells, respectively. (c) Influences of control, cisplatin, cisplatin + sh-NC and cisplatin + sh-sirt1 treatment on ATP/ADP ratio. **p < .01, ***p < .001, vs. cisplatin + sh-NC.
Sirt1 knockdown increases cisplatin chemosensitivity of ESCC cells through HK2
In order to explore whether sirt1 might increase cisplatin chemosensitivity of ESCC through HK2, the following experiments were performed. Firstly, co-immunoprecipitation (Co-IP) was executed to explore the interaction between sirt1 and HK2. The results of the Co-IP assay revealed specific enrichment of HK2 coprecipitated within sirt1 immunocomplex in EC-GI-10 and KYSE270 cells (). sirt1 was positively regulated HK2 expression in EC-GI-10 and KYSE270 cells (p < .001) (). More importantly, we found that cisplatin + sh-sirt1 treatment reduced GLUT1, LDHA, PKM2, and PGK1 levels reversed by HK2 overexpression in EC-GI-10 and KYSE270 cells (, p < .05).
Figure 6. Sirt1 knockdown increases cisplatin chemosensitivity of ESCC cells through HK2. (a) The robust and specific enrichment of sirt1 coprecipitated within HK2 immunocomplex were tested by Co-IP assay in KYSE270 and EC-GI-10 cells. (b) The protein level of HK2 in KYSE270 and EC-GI-10 cells was detected by western blotting after sirt1 knockdown. ***p < .001 vs. sh-NC group. (c) Protein levels of GLUT1, LDHA, PKM2 and PGK1 in KYSE270 and EC-GI-10 cells were tested by western blotting. **p < .01, ***p < .001 vs. cisplatin + sh-NC group; *p < .05, **p < .01 vs. cisplatin + sh-sirt1 group.
Sirt1 knockdown enhances in vivo ESCC chemosensitivity to cisplatin
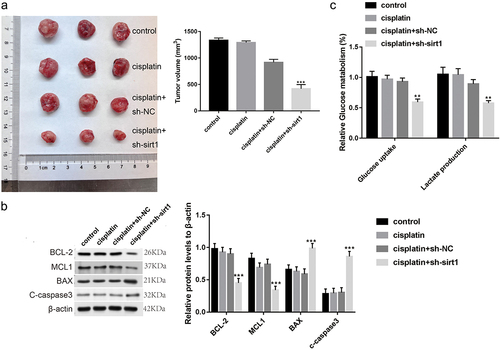
Finally, the sirt1 influence on ESCC cell cisplatin resistance was explored in mice. As displayed in , the xenograft tumor model with cisplatin + sh-sirt1 was discovered to be depressed in tumor volume relative to the tumor model with cisplatin + sh-NC (p < .001, ). Moreover, sirt1, BCL-2, and MCL1 protein levels were decreased, while BAX and c-caspase3 protein levels were increased by cisplatin + sh-sirt1 (p < .001, ). Besides, the uptake of glucose and lactate production of lactate were repressed by cisplatin + sh-sirt1 (p < .001, ).
Figure 7. Sirt1 knockdown enhances the chemosensitivity of ESCC to cisplatin in vivo. (a) Tumor volume was calculated. (b) Glucose uptake and lactate production were tested by a glucose test kit and a lactic acid production kit, respectively. (c) The protein levels of BCL-2, MCL1, BAX and c-caspase3 were analyzed by western blotting. **p < .01, ***p < .001 vs. cisplatin + sh-NC group.
Discussion
Sirt1 is reported to participate in the metabolism modulation and hold genome integrity.Citation16 Up-regulation of sirt1 expression has been revealed in ESCC.Citation17,Citation18 Consistent with the above reports, sirt1 expression was up-regulated in ESCC cells and tissues, suggesting that sirt1 may be a risk factor in ESCC. In previous studies, sirt1 has been proven to act as a tumor promoter in ESCC. For instance, suppression of sirt1 impedes proliferation of ESCC cells.Citation19 Overexpression of long non-coding RNA HOXC-AS1 exerts its oncogenic influence via up-regulating sirt1 expression in ESCC cells.Citation20 We also found carcinogenesis of sirt1 in ESCC, manifested as the sirf1 inhibitory impact knockdown on ESCC proliferation cells and the promoting impact of sirt1 knockdown on ESCC cell apoptosis. More importantly, sirt1 is found to promote glycolysis in several malignant tumors. For example, up-regulation of sirt1 promotes glycolysis in bladder cancer cells.Citation12 Sirt1 knockdown inhibits glycolysis in TK6 cell lymphoblastoid hydroquinone-enhanced malignant progression.Citation15 Similarly, the inhibitory effect of sirt1 knockdown was found on glycolysis in ESCC cells, exhibiting decreases in OCR, ECAR, and ATP/ADP ratios. Based on our results, sirt1 knockdown plays an anti-tumor role in ESCC cells, which may be used as a target for ESCC treatment.
Cisplatin is a highly efficient chemotherapeutic drug that has been widely utilized in ESCC treatment.Citation21 It can bind to cellular DNA to prevent cell replication, thereby causing cell death.Citation22 Previous studies have observed different human ESCC patients’ sensitivity to cisplatin treatment, indicating that ESCC patients’ chemosensitivity is not universal.Citation23,Citation24 In this paper, we investigated whether targeting sirt1 expression can affect the sensitivity of ESCC patients to cisplatin. Our data showed that when ESCC cells were treated with only cisplatin (1 μM), cell apoptosis and proliferation were not affected. However, when we treated ESCC cells with cisplatin (1 μM) + sh-sirt1, cell proliferation was significantly suppressed, and apoptosis was significantly promoted. At the same time, tumor growth was repressed after treatment of cisplatin (1 μM) + sh-sirt1 in mice. These results implied that the expression of sirt1 affected ESCC cell sensitivity to cisplatin. If sirt1 expression in ESCC cells was decreased, ESCC cells’ response to cisplatin was more sensitive. Furthermore, we discovered decreases in OCR, ECAR, and ATP/ADP ratio in vitro and decreases in the production of lactate and uptake of glucose in vivo after treatment of cisplatin + sh-sirt1, showing the suppressive effect of cisplatin + sh-sirt1 on glycolysis. The above findings suggested that glycolysis was involved in chemotherapy resistance of ESCC to cisplatin.
In glycolysis, metabolic control is generally regarded to be controlled by classical modulatory enzymes.Citation25 The activation and glucose metabolizing enzyme up-regulation, LDHA, PGK1, and PKM2 have been revealed in the modulation of sugar metabolism of various toxic substances.Citation26 GLUT1, which is answerable for glucose uptake, is enhanced in two tumor cell lines, mirroring the increase in capacity requirements, possibly in the condition of accelerated proliferation.Citation27,Citation28 A previous study has shown that sirt1 can interact with HK2 to facilitate glycolysis in the malignant progression of TK6 cells.Citation15 In our research, PGK1, PKM2, GLUT1, and LDHA mRNA expression levels were reduced by cisplatin + sh-sirt1 in ESCC cells. In particular, cisplatin + sh-sirt1 inhibitory impact on glycolysis was reversed by HK2 overexpression in ESCC cells. We have deduced that cisplatin + sh-sirt1 may repress glycolysis of ESCC cells through down-regulating HK2 expression.
In this study, we revealed sirt1 as a highly expressed gene in ESCC, and sirt1 knockdown suppressed the proliferation and glycolysis of ESCC cells. In particular, sirt1 knockdown increased the sensitivity of ESCC to cisplatin. These consequences revealed that sirt1 might be a new factor in the malignancy and progression of ESCC.
Materials and methods
Clinical samples
Cancer tissues and adjacent normal tissues (n = 30 pairs) were collected from ESCC patients at Air Force Medical University’s First Affiliated Hospital. These patients were confirmed ESCC by two experienced pathologists. After surgery, all tissues were sampled, collected, and stored (−80°C). This study acquired the support of the Medical Ethics Committee of the First Affiliated Hospital of Air Force Medical University (KY20213531–1). We obtained patient consent from all participants.
ESCC cell line cultivation
TE-13, ECA109, EC-GI-10, KYSE270, and HET-1A were obtained from the Chinese Academy of Medical Sciences Shanghai Cell Bank. Then, these cells were cultured in Dulbecco’s Modified Eagle’s Medium (DMEM) medium with 10% FBS (fetal bovine serum) and 1% streptomycin/penicillin. All cell lines were incubated in a humidified atmosphere containing 5% CO2 at 37°C.
Transfection of cells
The pcDNA3.1-HK2, sh-NC, sh-sirt1, sh-sirt1–2, and pcDNA3.1-NC were bought from Gene Pharma Co. KYSE270 and EC-GI-10 cells were seeded into 6-well plates and cultured for 24 h until they reached a confluence of about 80%. Then Lipofectamine 3000 (Invitrogen, Carlsbad, CA) was used to transfect above plasmids (2 µg) into KYSE270 and EC-GI-10 cells for 48 h.
QRT-PCRTRIzol reagent was used to isolate total RNA from the specimens and synthesized complementary DNA (cDNA) by a SuperScriptTM III reverse transcriptase (Invitrogen). The RNA concentration and purity were measured using NanoDrop 2000 (Thermo Fisher Scientific, Waltham, MA, USA). The qRT-PCR was executed with SYBR Green qPCR Master Mix (Thermo Fisher Scientific). Amplification procedures were as follows: 95°C for 5 min, 40 cycles each of 95°C for 15 s, 60°C for 20 s and 72°C for 40 s. The primer sequences from Sangon (Shanghai, China) were displayed as follows: F, 5'-GCGATTGGGTACCGAGATAA-3'; sirt1-R, 5'-TTGCATGTGAGGCTCTATCC −3'; GAPDH (glyceraldehyde 3-phosphate dehydrogenase)-F, 5'-GGAGCGAGATCCCTCCAAAAT-3'; GAPDH-R, 5'-GGCTGTTGTCATACTTCTCATGG-3'. Relative expression of sirt1 was determined following the 2−ΔΔct method, and GAPDH was used as the normalization reference.
Western blotting
We isolated total proteins by radioimmunoprecipitation assay (RIPA) buffer with protease inhibitor (Beyotime, Shanghai, China). A BCA Kit (Beyotime) was applied to detect protein concentration. After that, we isolated protein specimens with 10% sodium dodecyl sulfate-polyacrylamide gel electrophoresis (SDS-PAGE) (Solarbio, Beijing, China) and transported them to a polyvinylidene difluoride (PVDF) membrane. Then the membrane was blocked with 5% defatted milk for one hour, followed by incubation with primary antibodies for 24 h at 4°C. Primary antibodies included anti-sirt1 (ab189494, Abcam, CA, USA), anti-BCL-2 (ab182858), anti-BAX (ab32503), anti-MCL1 (ab32087), anti-BAD (ab32445), anti-c-caspase3 (ab32351), anti-HK2 (ab209847), anti-GLUT1 (ab115730), anti-LDHA (#3582, CST, Boston, Massachusetts, USA), anti-PKM2 (ab85555), anti-PGK1 (ab199438, Abcam) and anti-β-actin (ab213262, Abcam). Next, the anti-rabbit secondary antibody (1:1000, ab7090, Abcam) was added to incubate for one hour. Protein bands were tested by ECL (Amersham Biosciences, Shanghai, China), which were quantified using Image J software (NIH, USA).
MTT assay
The MTT assay was conducted for evaluating proliferation of KYSE270 and EC-GI-10 cells. These cells (5 × 10⁴/well) were plated into 96-well-plates. After 24 h, 48 h and 72 h of incubation, we added 10 µL MTT reagent (5 mg/mL) into each well to incubate for 4 h at 37°C, followed by the addition of 150 µL dimethyl sulfoxide. At last, the optical density of each well was measured at 490 nm by the Microplate Reader (MG LABTECH, Durham, NC, USA).
Colony formation assay
KYSE270 and EC-GI-10 cells (1 × 10³ cells/well) were plated into 6-well plates and then incubated at 37°C. Two weeks later, these cells were washed with phosphate buffered saline (PBS), fixed with formaldehyde (30%) for 15 min and then stained with crystal violet (0.1%) for 30 min at room temperature. The colony number was counted under an optical microscope.
Apoptosis rate detection
The apoptotic rate of KYSE270 and EC-GI-10 cells was assessed through a flow cytometer (FACSCalibur, BD, USA). In brief, cells were collected and washed twice with PBS. Then cells were re-suspended in binding buffer, and cell suspension (100 μL) were incubated with Annexin V-FITC (5 µL) for 10 min and then incubated with propidium iodide (PI; 5 µL) in darkness for 5 min at room temperature. Finally, cell apoptosis was quantified with FlowJo software.
OCR and ECAR
Glycolytic capacity and cellular mitochondrial function were assessed through a Seahorse XF24 analyzer (Seahorse Biosciences, Shanghai, China). In brief, KYSE270 and EC-GI‒10 cells (2 × 10⁵ cells) were plated in Seahorse plates, incubated overnight, and washed in Seahorse buffer. Subsequently, 1 μmol/L oligomycin, 1 μmol/L FCCP and 1 μmol/L rotenone were added to detect the OCR. For measuring the ECAR, 10 mmol/L glucose, 1 μmol/L oligomycin and 100 mmol/L 2-DG were automatically added to the analyzer.
Detection of ATP level
We evaluated the production of ATP after 1 d. When EC-GI-10 and KYSE270 cells were plated in 6-well plates with 5 × 10⁵ cells per well. We collected the culture solution after 2 d culture, and the level of ATP was determined by a biochemical automatic analyzer.
Co-IP assay
We utilized Co-IP assay for validating the HK2 and sirt1 interaction, lysed the cells in RIPA buffer (50 mM Tris (pH 7.4), 150 mM NaCl, 1 mM EDTA, 1% Triton X-100, 10% glycerol, 10 μg/mL leupeptin, 10 μg/mL aprotinin, and 2 mM PMSF) for 4 h, and then centrifuged (12,000×g, 10 min). Supernatants were immunoprecipitated with the anti-sirt1 antibody (ab189494, Abcam) and incubated with magnetic protein A/G beads at 4°C for 2 h. Finally, for gel electrophoresis, we re-suspended precipitated beads in 2 × loading buffer.
Tumor formation assay in vivo
Six-week-old BALB/c nude mice (Female, weight 1822 g) were obtained and housed with 3060% humidity at room temperature under a 12:12 h L/D cycle, having access to food and water.
For performing xenograft tumor assay, KYSE270 cells (1 × 10⁷) transfected with sh-NC/sh-sirt1 were then injected in mice flank. When the xenograft tumors were visible, some mice were injected intraperitoneally injected with cisplatin (5 mg/kg) daily. We divided all mice into control, cisplatin, cisplatin + sh-NC, and cisplatin + sh-sirt1 groups. Four weeks later, blood samples of mice were collected for further analysis. Then, the mice were euthanized. After that, tumors were collected. Tumor width and length were gauged. Tumor volume was calculated by means of the given formula: volume = 0.5 × width2 × length. Our research developed the support of Beijing Viewsolid Biotechnology Co. Ltd.’s Animal Ethics Committee (VS212601443).
Lactate production and glucose uptake detection
The glucose level in serum of mice was quantified by a glucose assay kit (Sigma-Aldrich, St. Louis, MO, USA). The lactate level in serum of mice was detected using a Lactate Assay kit (Eton Bioscience, Beijing, China).
Data analysis
GraphPad Prism 7.0 was utilized for performing data analysis. Data from at least three independent experiments were shown as mean ± SD (standard deviation). Then, difference comparison was achieved via one-way Analysis of Variance (ANOVA) and Tukey’s multiple comparisons test. Difference evaluation between 2 groups was executed through Student’s t-test. Statistical significance was identified as any difference with p < .05.
Abbreviations
| Esophageal cancer | = | EC |
| Esophageal squamous cell carcinoma | = | ESCC |
| Sirtuin (sirt); Hexokinase 2 | = | HK2 |
| Dulbecco’s Modified Eagle’s Medium | = | DMEM |
| Fetal bovine serum | = | FBS |
| Short hairpin | = | sh |
| Negative control | = | NC |
| Quantitative real time-polymerase chain reaction | = | QRT-PCR |
| Complementary DNA | = | cDNA |
| 3-(4, 5-Dimethylthiazolyl2)-2, 5-diphenyltetrazolium bromide | = | MTT |
| glyceraldheyde 3-phosphate dehydrogenase | = | GAPDH |
| phosphate buffered saline | = | PBS |
| propidium iodide | = | PI |
| Oxygen consumption rate | = | OCR |
| Extracellular acidification rate | = | ECAR |
| Adenosine-triphosphate | = | ATP |
| Co-immunoprecipitation | = | Co-IP |
| Radioimmunoprecipitation assay | = | RIPA |
| sodium dodecyl sulfate-polyacrylamide gel electrophoresis | = | SDS-PAGE |
| polyvinylidene fluoride | = | PVDF |
| enhanced chemiluminescence | = | ECL |
| Standard deviation | = | SD |
| Analysis of Variance | = | ANOVA |
| The Cancer Genome Atlas | = | TCGA |
| Adenosine diphosphat | = | ADP |
Supplementary data WB.docx
Download MS Word (9.9 MB)Disclosure statement
No potential conflict of interest was reported by the author(s).
Data availability statement
All data generated or analyzed during this study are included in this published article.
Supplemental material
Supplemental data for this article can be accessed online at https://doi.org/10.1080/15384047.2024.2365449
Additional information
Funding
References
- Siersema PD. Esophageal cancer. Gastroenterol Clin North Am. 2008;37(4):943–11. 10.1016/j.gtc.2008.09.012.
- Hirano H, Kato K. Systemic treatment of advanced esophageal squamous cell carcinoma: chemotherapy, molecular-targeting therapy and immunotherapy. Jpn J Clin Oncol. 2019;49(5):412–20. doi:10.1093/jjco/hyz034.
- Dasari S, Tchounwou PB. Cisplatin in cancer therapy: molecular mechanisms of action. Eur J Pharmacol. 2014;740:364–78. doi:10.1016/j.ejphar.2014.07.025.
- Makovec T. Cisplatin and beyond: molecular mechanisms of action and drug resistance development in cancer chemotherapy. Radiol Oncol. 2019;53(2):148–58. doi:10.2478/raon-2019-0018.
- Abbaszadeh Z, Cesmeli S, Biray Avci C. Crucial players in glycolysis: cancer progress. Gene. 2020;726:144158. doi:10.1016/j.gene.2019.144158.
- Akram M. Mini-review on glycolysis and cancer. J Cancer Educ. 2013;28(3):454–57. doi:10.1007/s13187-013-0486-9.
- Rodriguez-Enriquez S, Marin-Hernandez Á, Gallardo-Perez JC, Pacheco-Velazquez SC, Belmont-Diaz JA, Robledo-Cadena DX, Vargas-Navarro JL, Corona de la Peña NA, Saavedra E, Moreno-Sánchez R, et al. Transcriptional regulation of energy metabolism in cancer cells. Cells. 2019;8(10):1225. doi:10.3390/cells8101225.
- Schwartz L, Supuran CT, Alfarouk KO. The Warburg effect and the hallmarks of cancer. Anticancer Agents Med Chem. 2017;17(2):164–70. doi:10.2174/1871520616666161031143301.
- Dai H, Sinclair DA, Ellis JL, Steegborn C. Sirtuin activators and inhibitors: promises, achievements, and challenges. Pharmacol Ther. 2018;188:140–54. doi:10.1016/j.pharmthera.2018.03.004.
- Nikas IP, Paschou SA, Ryu HS. The role of nicotinamide in cancer chemoprevention and therapy. Biomolecules. 2020;10(3):477. doi:10.3390/biom10030477.
- Yousafzai NA, Jin H, Ullah M, Wang X. Recent advances of SIRT1 and implications in chemotherapeutics resistance in cancer. Am J Cancer Res. 2021;11:5233–48.
- Chen J, Cao L, Li Z, Li Y. SIRT1 promotes GLUT1 expression and bladder cancer progression via regulation of glucose uptake. Hum Cell. 2019;32(2):193–201. doi:10.1007/s13577-019-00237-5.
- John S, Weiss JN, Ribalet B, Rodrigues-Lima F. Subcellular localization of hexokinases I and II directs the metabolic fate of glucose. PLOS ONE. 2011;6(3):e17674. doi:10.1371/journal.pone.0017674.
- Roberts DJ, Miyamoto S. Hexokinase II integrates energy metabolism and cellular protection: akting on mitochondria and TORCing to autophagy. Cell Death Differ. 2015;22(2):248–57. doi:10.1038/cdd.2014.173.
- Chen Y, Yang H, Chen S, Lu Z, Li B, Jiang T, Xuan M, Ye R, Liang H, Liu X, et al. SIRT1 regulated hexokinase-2 promoting glycolysis is involved in hydroquinone-enhanced malignant progression in human lymphoblastoid TK6 cells. Ecotox Environ Safe. 2022;241:113757. doi:10.1016/j.ecoenv.2022.113757.
- Kozako T, Suzuki T, Yoshimitsu M, Arima N, Honda S, Soeda S. Anticancer agents targeted to sirtuins. Molecules. 2014;19(12):20295–313. doi:10.3390/molecules191220295.
- Yan L, Zhao Q, Liu L, Jin N, Wang S, Zhan X. Expression of SIRT1 and survivin correlates with poor prognosis in esophageal squamous cell carcinoma. Medicine (Baltimore). 2020;99(34):e21645. doi:10.1097/MD.0000000000021645.
- Otsuka R, Sakata H, Murakami K, Kano M, Endo S, Toyozumi T, Matsumoto Y, Suito H, Takahashi M, Sekino N, et al. SIRT1 expression is a promising prognostic biomarker in esophageal squamous cell carcinoma: a systematic review and meta-analysis. Cancer Diagn Prognosis. 2022;2(2):126–33. doi:10.21873/cdp.10086.
- Ma MC, Chiu TJ, Lu HI, Huang WT, Lo CM, Tien WY, Lan Y-C, Chen Y-Y, Chen C-H, Li S-H, et al. SIRT1 overexpression is an independent prognosticator for patients with esophageal squamous cell carcinoma. J Cardiothorac Surg. 2018;13(1):25. doi:10.1186/s13019-018-0718-5.
- Yang Z, Wan J, Ma L, Li Z, Yang R, Yang H, Li J, Zhou F, Ming L. Long non-coding RNA HOXC-AS1 exerts its oncogenic effects in esophageal squamous cell carcinoma by interaction with IGF2BP2 to stabilize SIRT1 expression. J Clin Lab Anal. 2023;37(1):e24801. doi:10.1002/jcla.24801.
- Lin W, Qian J, Wang H, Ren L, Yang Y, Chen C, Chen X, Huang Y, Liu J, Xu N, et al. Cisplatin plus anti-PD-1 antibody enhanced treatment efficacy in advanced esophageal squamous cell carcinoma. Am J Cancer Res. 2022;12(2):451–68.
- Amable L. Cisplatin resistance and opportunities for precision medicine. Pharmacol Res. 2016;106:27–36. doi:10.1016/j.phrs.2016.01.001.
- Nie C, Qin X, Li X, Tian B, Zhao Y, Jin Y, Li Y, Wang Q, Zeng D, Hong A, et al. CACNA2D3 enhances the chemosensitivity of esophageal squamous cell carcinoma to cisplatin via inducing Ca(2+)-mediated apoptosis and suppressing PI3K/Akt pathways. Front Oncol. 2019;9:185. doi:10.3389/fonc.2019.00185.
- Zheng ZY, Yang PL, Li RY, Liu LX, Xu XE, Liao LD, Li X, Chu M-Y, Peng L, Huang Q-F, et al. STAT3β disrupted mitochondrial electron transport chain enhances chemosensitivity by inducing pyroptosis in esophageal squamous cell carcinoma. Cancer Lett. 2021;522:171–83. doi:10.1016/j.canlet.2021.09.035.
- Bommer GT, Van Schaftingen E, Veiga-da-Cunha M. Metabolite repair enzymes control metabolic damage in glycolysis. Trends Biochem Sci. 2020;45(3):228–43. doi:10.1016/j.tibs.2019.07.004.
- Wang Y, Zhao M, Cui J, Wu X, Li Y, Wu W, Zhang X. Ochratoxin a induces reprogramming of glucose metabolism by switching energy metabolism from oxidative phosphorylation to glycolysis in human gastric epithelium GES-1 cells in vitro. Toxicol Lett. 2020;333:232–41. doi:10.1016/j.toxlet.2020.08.008.
- Ancey PB, Contat C, Meylan E. Glucose transporters in cancer – from tumor cells to the tumor microenvironment. FEBS J. 2018;285(16):2926–43. doi:10.1111/febs.14577.
- Koukourakis MI, Kalamida D, Mitrakas AG, Liousia M, Pouliliou S, Sivridis E, Giatromanolaki A. Metabolic cooperation between co-cultured lung cancer cells and lung fibroblasts. Lab Invest. 2017;97(11):1321–31. doi:10.1038/labinvest.2017.79.