
ABSTRACT
Neuroblastoma, the most common solid tumour in early childhood, is characterized by very frequent chromosomal copy number variations (CNVs). While chromosome 2p amplification, 17q gain, 1p and 11q deletion in human neuroblastoma tissues are well-known, the exact frequencies and boundaries of the chromosomal CNVs have not been delineated. We analysed the publicly available single nucleotide polymorphism (SNP) array data which were originally generated by the Therapeutically Applicable Research to Generate Effective Treatments (TARGET) initiative, defined the frequencies and boundaries of chromosomes 2p11.2 – 2p25.3 amplification, 17q11.1-17q25.3 gain, 1p13.3-1p36.33 deletion and 11q13.3-11q25 deletion in neuroblastoma tissues, and identified chromosome 7q14.1 (Chr7:38254795-38346971) and chromosome 14q11.2 (Chr14:21637401-22024617) deletion in blood and bone marrow samples from neuroblastoma patients, but not in tumour tissues. Kaplan Meier analysis showed that double deletion of Chr7q14.1 and Chr14q11.2 correlated with poor prognosis in MYCN gene amplified neuroblastoma patients. In conclusion, the oncogenes amplified or gained and tumour suppressor genes deleted within the boundaries of chromosomal CNVs in tumour tissues should be studied for their roles in tumourigenesis and as therapeutic targets. Focal deletions of Chr7q14.1 and Chr14q11.2 together in blood and bone marrow samples from neuroblastoma patients can be used as a marker for poorer prognosis and more aggressive therapies.
Introduction
Neuroblastoma is derived from primordial neural crest cells that eventually reside in the sympathetic nervous system, and is the most common extracranial solid tumour in children [Citation1,Citation2]. Neuroblastoma most commonly occurs in the abdomen, particularly in the adrenal medulla, but also at other parts of the human body where sympathetic ganglia or other sympathetic nervous system components are present, such as chest, neck and pelvis [Citation1,Citation2]. Importantly, patients with neuroblastoma show poor prognosis, and neuroblastoma accounts for more than 10% cancer death in children [Citation3,Citation4].
Single nucleotide polymorphisms (SNP) or mutations contribute to aggressive neuroblastoma. Genome-wide linkage analysis of neuroblastoma pedigrees identifies anaplastic lymphoma kinase (ALK) as the main familial neuroblastoma predisposition gene [Citation5,Citation6]. ALK mutations can also occur somatically in a significant portion (6-8%) of sporadic cases [Citation7,Citation8]. Paired-like homeobox 2b (PHOX2B), a key regulator in the process of nervous system development, has been demonstrated to be mutated in some neuroblastoma patients [Citation9]. The other gene mutated in human neuroblastoma is α-thalassaemia/mental retardation syndrome X-linked (ATRX) [Citation10,Citation11]. ATRX mutation leads to complete loss of function and causes neuroblastoma in older children [Citation10,Citation11].
Nevertheless, the most prominent feature of human neuroblastoma, unlike adult cancers, is gene copy number variations (CNVs), and CNVs target large genomic regions encompassing a number of genes [Citation1,Citation2]. Regions that are frequently associated with CNVs include chromosomes 2p, 17q, 1p and 11q in primary neuroblastoma tissues [Citation2,Citation12,Citation13].
While chromosomes 2p amplification (≥ 5 copies), 17q gain (3-4 copies), 1p and 11q deletion are well-known to be associated with neuroblastoma, the frequencies and boundaries of CNVs at different regions of 2p, 17q, 1p and 11q are not clear. In this study, we analysed the publicly available SNP array data which were originally generated by the Therapeutically Applicable Research to Generate Effective Treatments (TARGET) initiative (https://target-data.nci.nih.gov/) [Citation14], to define the frequencies and boundaries of CNVs at different regions of 2p, 17q, 1p and 11q in tumour tissues, and identified chromosome 7 and chromosome 14 deletion in blood and bone marrow samples from neuroblastoma patients.
Results
Chromosome 2p11.2-2p25.3 amplification in human neuroblastoma tissues
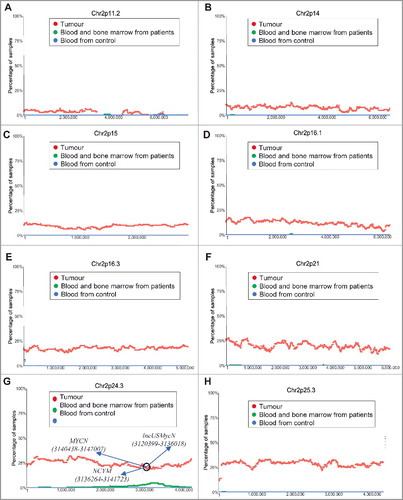
To define the frequencies and boundaries of genome-wide chromosomal CNVs in paediatric neuroblastoma tissues, we made use of the publicly available SNP array data which were originally generated by the TARGET initiative (https://target-data.nci.nih.gov/). While amplification of the MYCN oncogene at chromosome (Chr) 2p24 is well-known as the most important CNV marker for poor patient prognosis [Citation1,Citation2], our chromosomal CNV analysis confirmed chromosome 2p regional amplification. As shown in , chromosome 2p amplification occurred in less than 10% of tumours from Chr2p11.2 to Chr2p14, in approximately 10% of tumours at Chr2p15, in 10–20% of tumours from Chr2p16.1 to Chr2p16.3, and in 20–25% of tumours from Chr2p21 to Chr2p25.3 (). Our visualisation also confirmed that the Chr2p24.3 region containing the MYCN (15940438-15947007), NCYM (15936265-15941723) and lncUSMycN (15920399-15936018) genes were amplified in one quarter of neuroblastoma tissues ().
Figure 1. Chromosome 2p11.2-2p25.3 gain in human neuroblastoma tissues. SNP array data originally generated by the TARGET initiative (https://target-data.nci.nih.gov/) and the CHOP Copy Number Variance project were analysed. Chromosome amplification frequencies in neuroblastoma tissues, compared with blood and bone marrow samples from the neuroblastoma patients and blood samples from healthy children, at different regions of chromosome 2 were plotted against all genomic locations, including the following representative regions: Chr2p11.2 (A), Chr2p14 (B), Chr2p15 (C), Chr2p16.1 (D), Chr2p16.3 (E), Chr2p21 (F), Chr2p24.3 (G) and Chr2p25.3 (H). Tumour = tumour samples; Blood and bone marrow from patients = normal blood and bone marrow samples from neuroblastoma patients; Blood from control = blood samples from heathy children from The Children's Hospital of Philadelphia.
Chromosome 17q11.1-17q25.3 gain in human neuroblastoma tissues
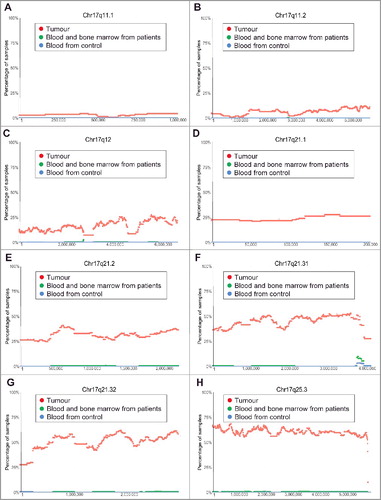
The most common chromosomal CNV in human neuroblastoma tissues is chromosome 17q21-25 gain [Citation13]. Our analysis of the TARGET SNP array data revealed that chromosome 17q gain occurred at Chr17q11.1 and Chr17q11.2 in less than 10% and 15% tumours respectively (). The incidence of chromosome 17q gain reached 25% from Chr17q12 to Chr17q21.1, further increased to 25–50% from Chr17q21.2 to Chr17q21.31, and remained at 50–60% thereafter from Chr17q21.32 to Chr17q25.3 ().
Figure 2. Chromosome 17q11.1-17q25.3 gain in human neuroblastoma tissues. SNP array data originally generated by the TARGET initiative and the CHOP Copy Number Variance project were analysed. Chromosome gain frequencies in neuroblastoma tissues, compared with blood and bone marrow samples from the neuroblastoma patients and blood samples from healthy children, at different regions of chromosome 17 were plotted against all genomic locations, including the following representative regions: Chr17q11.1 (A), Chr17q11.2 (B), Chr17q12 (C), Chr17q21.1 (D), Chr17q21.2 (E), Chr17q21.31 (F), Chr17q21.32 (G) and Chr17q25.3 (H). Tumour = tumour samples; Blood and bone marrow from patients = normal blood and bone marrow samples from neuroblastoma patients; Blood from control = blood samples from heathy children from The Children's Hospital of Philadelphia.
Chromosome 1p13.3-1p36.33 deletion in human neuroblastoma tissues
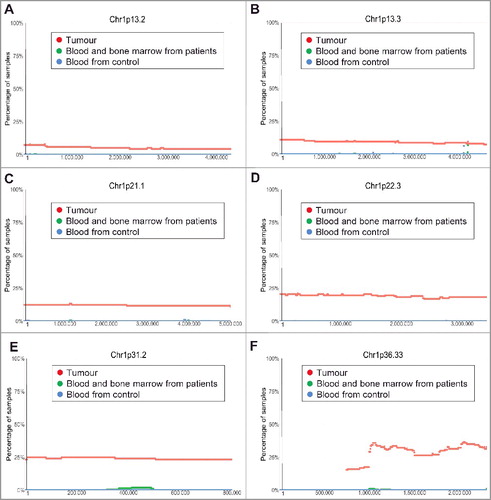
Chromosome 1p36 deletion in human neuroblastoma tissues is a well-known marker for poor patient prognosis [Citation12]. However, the exact region of chromosome 1p deletion is not clear. Our analysis of the TARGET SNP array data revealed that chromosome 1p deletion in human neuroblastoma tissues occurred at less than 10% at Chr1p13.2, at approximately 10% at Chr1p13.3, at 10–20% from Chr1p21.1 to Chr1p22.3, and at 25%-40% from Chr1p31.2 to Chr1p36.33 ().
Figure 3. Chromosome 1p13.3-1p36.33 deletion in human neuroblastoma tissues. SNP array data originally generated by the TARGET initiative and the CHOP Copy Number Variance project were analysed. Chromosome deletion frequencies in neuroblastoma tissues, compared with blood and bone marrow samples from the neuroblastoma patients and blood samples from healthy children, at different regions of chromosome 1p were plotted against all genomic locations, including the following representative regions: Chr1p13.2 (A), Chr1p13.3 (B), Chr1p21.1 (C), Chr1p22.3 (D), Chr1p31.2 (E) and Chr1p36.33 (F). Tumour = tumour samples; Blood and bone marrow from patients = normal blood and bone marrow samples from neuroblastoma patients; Blood from control = blood samples from heathy children from The Children's Hospital of Philadelphia.
Chromosome 11q13.3-11q25 deletion in human neuroblastoma tissues
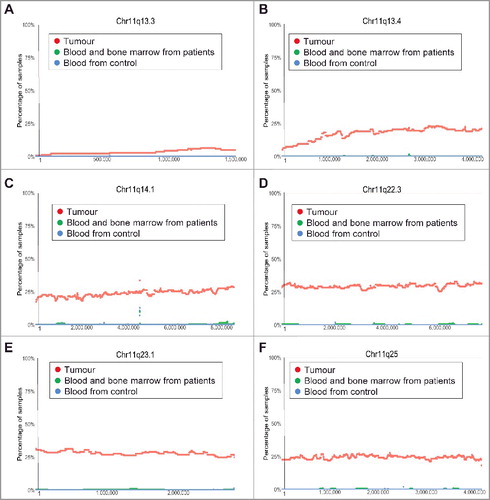
Chromosome 11q23 deletion is also a known common genetic abnormality in human neuroblastoma tissues which predicts poor patient survival [Citation12]. However, the exact region of chromosome 11q deletion is not clear. Our analysis of the TARGET SNP array data revealed that chromosome 11q deletion started in less than 10% of neuroblastoma tumours at Chr11q13.3, increased to just below 25% at Chr11q13.4, reached above 25% at Chr11q14.1, maintained at approximately 30% from Chr11q22.3 to Chr11q23.1, and then reduced to approximately 25% thereafter at Chr11q25 ().
Figure 4. Chromosome 11q13.3-11q25 deletion in human neuroblastoma tissues. SNP array data originally generated by the TARGET initiative and the CHOP Copy Number Variance project were analysed. Chromosome deletion frequencies in neuroblastoma tissues, compared with blood and bone marrow samples from the neuroblastoma patients and blood samples from healthy children, at different regions of chromosome 11q were plotted against all genomic locations, including the following representative regions: Chr11q13.3 (A), Chr11q13.4 (B), Chr11q14.1 (C), Chr11q22.3 (D), Chr11q 23.1 (E) and Chr11q25 (F). Tumour = tumour samples; Blood and bone marrow from patients = normal blood and bone marrow samples from neuroblastoma patients; Blood from control = blood samples from heathy children from The Children's Hospital of Philadelphia.
Chromosomes 7q14.1 and 14q11.2 focal deletion in blood and bone marrow samples from neuroblastoma patients
In addition to the above common CNVs in tumour tissues, we identified two additional regions of interest where CNVs were found to be more frequent in blood and bone marrow samples from neuroblastoma patients than in tumour samples and blood samples from healthy children controls. The first region was within chromosome 7q14.1 (Chr7:38254795-38346971) (). 35.29% (72/204) of blood and bone marrow samples from neuroblastoma patients showed a single copy deletion within this region, in contrast to only 1.45% (2/137) of primary tumour samples and 0.83% (17/2026) of blood samples from heathy controls. At its maxima site, 30.39% of blood and bone marrow samples (62/204 samples) from neuroblastoma patients have a single copy deletion at the same position (). The second region of chromosomal deletion was within chromosome 14q11.2 (Chr14: 21637401–22024617) (). 55.88% (114) of blood and bone marrow samples from neuroblastoma patients showed a single copy deletion within the region, in contrast to 9.48% (13) of primary tumour samples and 1.87% (38) of blood samples from healthy controls. At its maxima site, 41.66% (85) of blood and bone marrow samples from neuroblastoma patients showed a single copy deletion at the same position ().
Figure 5. Chromosomes 7q14.1 and 14q11.2 focal deletion in blood and bone marrow samples from neuroblastoma patients. (A) and (B) SNP array data originally generated by the TARGET initiative and the CHOP Copy Number Variance project were analysed. Chromosome deletion frequencies in blood and bone marrow samples from neuroblastoma patients, compared with neuroblastoma tissues and blood samples from healthy children, at different regions of chromosome 7q14.1 (A) and 14q11.2 (B) were plotted. Tumour = tumour samples; Blood and bone marrow from patients = normal blood and bone marrow samples from neuroblastoma patients; Blood from control = blood samples from heathy children from The Children's Hospital of Philadelphia. (C) and (D) Genes located at Chr7:38254795-38346971 (C) or Chr14:21637401-22024617 (D), according to University of California Santa Cruz Genome Browser.
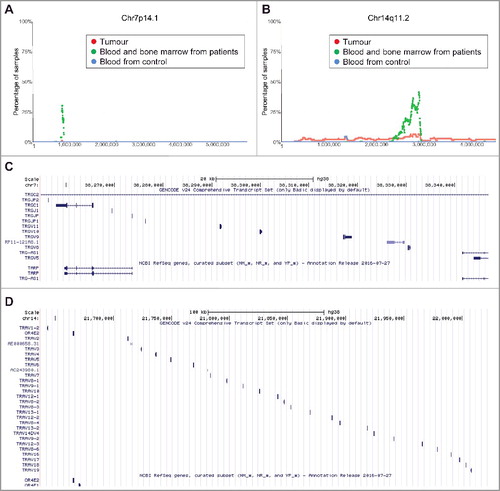
To identify genes deleted at Chr7:38254795-38346971 and Chr14:21637401-22024617, we made use of University of California Santa Cruz Genome Browser. The analyses showed that genes located at Chr7:38254795-38346971 included T Cell Receptor Gamma Constant 1 (TRGC1), T Cell Receptor Gamma Joining P, P1 and P2 (TRGJP, TRGJP1 and TRGJP2), T cell receptor gamma joining 1 (TRGJ1), T cell receptor gamma variable 5, 8, 9, 10 and 11 (TRGV5, 8, 9, 10 and 11), T-cell receptor gamma locus antisense RNA 1 (TRG-AS1) and T-Cell Receptor Gamma-Chain Constant Region (TARP) genes (). In comparison, genes located at Chr14:21637401-22024617 mainly included T Cell Receptor Alpha Variable 1–19 (TRAV1-19) genes as well as Olfactory Receptor Family 4 Subfamily E Member 1 and 2 (OR4E1 and OR4E2) genes ().
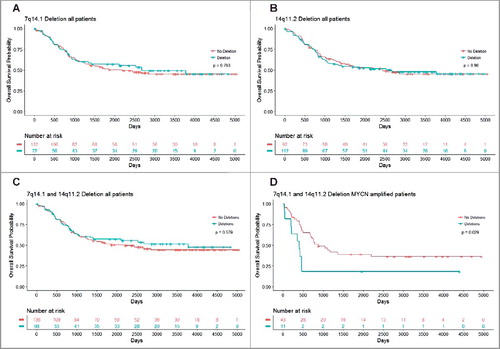
Chromosomes 7q14.1 and 14q11.2 focal deletion predicts poorer survival in MYCN gene-amplified neuroblastoma patients
Using the TARGET data, we further performed Cox proportional hazard regression analysis, and found that single copy deletion of chromosome 7q14.1 (Chr7:38254795-38346971) or chromosome 14q11.2 (Chr14: 21637401–22024617) in either region alone was not predictive of overall survival (Chr7q14.1: HR = 0.936, 95% CI = 0.6236–1.407, p = 0.753; and Chr14q11.2: HR = 1.010, 95% CI = 0.686-1.48, p = 0.96) (). However, a single copy deletion in both regions was predictive of poor overall survival for MYCN amplified neuroblastoma patients (n = 54, HR = 2.296, 95% CI = 1.065–4.951, p = 0.034), and dichotomised these patients into different survival distributions (p = 0.029), as compared to all patients irrespective of MYCN amplification status (n = 204, p = 0.579) (). The data indicate that single copy deletion of chromosome 7q14.1 (Chr7:38254795-38346971) and chromosome 14q11.2 (Chr14:21637401-22024617) regions together in the blood and bone marrow samples is a marker for poor survival in MYCN gene-amplified neuroblastoma patients.
Figure 6. Chromosomes 7q14.1 and 14q11.2 focal deletions in blood and bone marrow samples from MYCN-amplified neuroblastoma patients predict poor survival. Kaplan Meier curve for overall survival in all patients with Chr7q14.1 deletion (A), Chr14q11.2 deletion (B) or both Chr7q14.1 and Chr14q11.2 deletions (C), and in MYCN-amplified neuroblastoma patients with focal deletions at both 7q14.1 and 14q11.2 (D).
Discussion
Unlike adult cancers, neuroblastoma is characterized by very frequent chromosomal CNVs [Citation1]. While chromosome 2p amplification, 17q gain, 1p and 11q deletion in human neuroblastoma tissues are well-known, the exact frequencies and boundaries of the chromosomal CNVs have not been delineated. In this study, we have analysed the SNP array data from tumour tissues and matched blood and bone marrow samples from neuroblastoma patients in the TARGET initiative [Citation14], as well as SNP array data from normal blood samples from healthy children in the CHOP Copy Number Variance project [Citation15], and delineated the frequencies and the boundaries of chromosomal CNVs.
Chromosome 2p amplification in tumour tissues is one of the best known markers for poor prognosis in neuroblastoma patients [Citation2]. The amplification of the MYCN, NCYM and lncUSMycN genes at chr2p.24 is generally believed to be the main oncogenic event [Citation16–Citation18], and other genes in the region, such as the DDX1 gene upstream of the MYCN gene at chr2p.24, have been suggested to be up-regulated in human neuroblastoma tissues due to its proximity to the MYCN gene [Citation19]. In this study, we have found that chromosome 2p amplification starts from Chr2p11.2, albeit at a low frequency, and peaks at a frequency of 20–25% throughout Chr2p21 to Chr2p25.3. As there are many genes between Chr2p21 to Chr2p25.3, in addition to MYCN, NCYM and lncUSMycN, our data suggest that the potential roles of other genes at Chr2p21 to Chr2p25.3 in neuroblastoma tumourigenesis and as therapeutic targets warrant investigation.
Chromosome 17q gain is the most common CNV in human neuroblastoma [Citation13]. Unbalanced gain of Chr17q21-25 is associated with advanced disease stage and is a significant predictive marker for adverse outcome in patients, as five year overall survival for patients with 17q gain is less than half of those with normal 17q status [Citation13]. While the IGF2BP1 and BIRC5 (Survivin) genes at 17q21.32 and 17q25 respectively have been suggested to contribute to neuroblastoma tumourigenesis [Citation20,Citation21], it is not clear which genes are crucial for chromosome 17q gain-induced neuroblastoma. In the current study, we have found that Chr17q gain occurs at a rate of 25% from Chr17q12 to Chr17q21.1, at a rate of 25% to 50% from Chr17q21.2 to Chr17q21.31, and at 50–60% from Chr17q21.32 to Chr17q25.3. Our data suggest that oncogenic genes from Chr17q12 to Chr17q25.3 are likely to be involved in the tumourigenesis of neuroblastoma characterized by chromosome 17q gain and are therefore potential therapeutic targets.
Chromosome 1p36 deletion in neuroblastoma tissues is also well-known as one of the most powerful markers for poor prognosis in neuroblastoma patients [Citation2,Citation12,Citation22]. Several candidate tumour suppressor genes have been identified at Chr1p36, including CHD5, CAMTA1, KIF1B, CASZ1 and miR-34A [Citation23]. In the current study, we have found that chromosome 1p deletion occurs in less than 10% of tumours at Chr1p13.2, in 10–20% of tumours at Chr1p21.1 to Chr1p22.3, and in 25–40% of tumours at Chr1p31.2 to Chr1p36.33. Our data suggest that deletion of tumour suppressor genes from Chr1p21.1 to Chr1p36.33 is likely to be involved in the tumourigenesis of neuroblastoma characterized by chromosome 1p deletion and is therefore a potential therapeutic target.
The other well-known CNV in human neuroblastoma is chromosome 11q23 deletion which also correlates with poor patient survival [Citation1,Citation2,Citation12]. However, it is not clear which genes are critical for chromosome 11q deletion-medicated neuroblastoma. Our analysis reveals that chromosome 11q deletion occurs in just below and above 25% of tumours at Chr11q13.4 and Chr11q14.1 respectively, in approximately 30% of tumours from Chr11q22.3 to Chr11q 23.1, and in 25% tumours at Chr11q25. Our data suggest that deletion of tumour suppressor genes from Chr11q13.4 to Chr11q25 is likely to be involved in the tumourigenesis of neuroblastoma characterized by chromosome 11q deletion and is therefore a potential therapeutic target.
Little studies on CNVs in non-tumour tissues from neuroblastoma patients has been reported. In this study, we have confirmed chromosomes 7q14.1 (chr7:38254795-38346971) and 14q11.2 (chr14:21637401-22024617) deletion in blood and bone marrow samples from neuroblastoma patients, but not in tumour tissues. Importantly, genes deleted in both of the two chromosome regions are T cell receptor genes, and Kaplan-Meier analysis shows that double deletion of the two regions correlates with poor prognosis in MYCN gene-amplified neuroblastoma patients. These findings are consistent with the data reported by Diskin et al [Citation24], and suggest that Chr7q14.1 (chr7:38254795-38346971) and Chr14q11.2 (chr14:21637401-22024617) deletion in the blood from neuroblastoma patients can be used as a marker for poor prognosis and therefore for more aggressive therapies.
In conclusion, chromosomes 2p amplification, 17q gain, 1p and 11q deletion are well-known to be associated with neuroblastoma, however, the frequencies and boundaries of the CNVs are not clear. In this study, we have delineated the frequencies and the boundaries of the CNVs in human neuroblastoma tissues, and identified chromosome 7 and 14 deletions in blood and bone marrow samples from neuroblastoma patients. The oncogenes amplified or gained and tumour suppressor genes deleted within the boundaries of chromosomal CNVs in tumour tissues should be studied for their roles in tumourigenesis and as therapeutic targets. Chr7q14.1 and Chr14q11.2 deletion in blood and bone marrow samples from neuroblastoma patients can be used as a marker for poorer prognosis and for the application of more aggressive therapies.
Materials and methods
Analyses of chromosomal copy number variations in tumours, blood and bone marrow samples from neuroblastoma patients and matched healthy paediatric control samples
Publicly available SNP array data from primary tumour, blood and bone marrow samples from neuroblastoma patients and relevant clinical data were obtained from the TARGET initiative (https://target-data.nci.nih.gov/, last accessed June 12, 2013) [Citation14]. The SNP data were generated from Illumina HumanHap550 SNP arrays and had been described in detail by the original researchers [Citation14]. Signal intensity data in the form of Log R Ratios and B Allele Frequencies from individual genotyped samples were processed with PennCNV [Citation25] for the detection and quality assessment of regions of CNV. Samples that did not pass the quality control criteria were discarded and the remaining dataset consisted of 137 tumour samples and 204 normal blood and/or bone marrow samples of which 87 were matched pairs from neuroblastoma patients. In order to compare our results to a healthy population, regions of CNVs from 2,026 healthy children were retrieved from the Copy Number Variance project at The Children's Hospital of Philadelphia (CHOP) (http://cnv.chop.edu/, last accessed Nov 23, 2016) [Citation15]. Genome coordinates for both TARGET and CHOP data were relative to build hg18.
A custom script was used to calculate, at single-base resolution, the percentage of samples with deletions and gains in neuroblastoma tumours, blood and bone marrow samples from neuroblastoma patients and blood samples from healthy paediatric controls. The data were then visualised using R [Citation26] and regions of frequent deletions or gains were identified.
Analysis of CNVs as a marker for patient prognosis
Two regions of frequent copy number deletion in the normal blood and bone marrow from paediatric neuroblastoma patients were identified in chromosomes 7 and 14. The association of copy number deletion within these regions in patients harbouring MYCN-amplification with prognosis was assessed using Kaplan-Meier survival curves [Citation27]. Clinical data were retrieved from the TARGET initiative and survival analyses were performed with R using the survival [Citation28] and survminer [Citation29] packages. The log-rank test was used to test the null hypothesis that there is no difference in survival between the curves [Citation30].
Disclosure of potential conflict of interest
No potential conflicts of interest were disclosed.
Acknowledgments
Children's Cancer Institute Australia is affiliated with University of New South Wales and Sydney Children's Hospital. We acknowledge the TARGET initiative and the database of Genotypes and Phenotypes (dbGaP) for providing TARGET (phs000467) data stored at the TARGET Data Coordinating Center (DCC), accessed through the TARGET Data Matrix and downloaded on June 12, 2013.
Additional information
Funding
References
- Maris JM. Matthay KK. Molecular biology of neuroblastoma. J Clin Oncol. 1999;17:2264–2279. doi:10.1200/JCO.1999.17.7.2264. PMID:10561284
- Matthay KK, Maris JM, Schleiermacher G, et al. Neuroblastoma. Nature reviews Disease Primers. 2016;2:16078. doi:10.1038/nrdp.2016.78. PMID:27830764
- Colon NC, Chung DH. Neuroblastoma. Advances in Pediatrics. .2011;58:297–311. doi:10.1016/j.yapd.2011.03.011. PMID:21736987
- Matthay KK, George RE, Yu AL. Promising therapeutic targets in neuroblastoma. Clin Cancer Res. 2012;18:2740–2753. doi:10.1158/1078-0432.ccr-11-1939. PMID:22589483
- Janoueix-Lerosey I, Lequin D, Brugieres L, et al. Somatic and germline activating mutations of the ALK kinase receptor in neuroblastoma. Nature. 2008;455:967–970. doi:10.1038/nature07398. PMID:18923523
- Mosse YP, Laudenslager M, Longo L, et al. Identification of ALK as a major familial neuroblastoma predisposition gene. Nature. 2008;455:930–935. doi:10.1038/nature07261. PMID:18724359
- Chen Y, Takita J, Choi YL, et al. Oncogenic mutations of ALK kinase in neuroblastoma. Nature. 2008;455:971–974. doi:10.1038/nature07399. PMID:18923524
- George RE, Sanda T, Hanna M, et al. Activating mutations in ALK provide a therapeutic target in neuroblastoma. Nature. 2008;455:975–978. doi:10.1038/nature07397. PMID:18923525
- Mosse YP, Laudenslager M, Khazi D, et al. Germline PHOX2B mutation in hereditary neuroblastoma. Am J Hum Genet. 2004;75:727–730. doi:10.1086/424530. PMID:1182065
- Cheung NK, Zhang J, Lu C, et al. Association of age at diagnosis and genetic mutations in patients with neuroblastoma. Jama. 2012;307:1062–1071. doi:10.1001/jama.2012.228. PMID:3527076
- Molenaar JJ, Koster J, Zwijnenburg DA, et al. Sequencing of neuroblastoma identifies chromothripsis and defects in neuritogenesis genes. Nature. 2012;483:589–593. doi:10.1038/nature10910. PMID:22367537
- Attiyeh EF, London WB, Mosse YP, et al. Chromosome 1p and 11q deletions and outcome in neuroblastoma. N Engl J Med. 2005;353:2243–2253. doi:10.1056/NEJMoa052399. PMID:16306521
- Bown N, Cotterill S, Lastowska M, et al. Gain of chromosome arm 17q and adverse outcome in patients with neuroblastoma. N Engl J Med. 1999;340:1954–1961. doi:10.1056/nejm199906243402504. PMID:10379019
- Pugh TJ, Morozova O, Attiyeh EF, et al. The genetic landscape of high-risk neuroblastoma. Nat Genet. 2013;45:279–284. doi:10.1038/ng.2529. PMID:3682833
- Shaikh TH, Gai X, Perin JC, et al. High-resolution mapping and analysis of copy number variations in the human genome: a data resource for clinical and research applications. Genome Res. 2009;19:1682–1690. doi:10.1101/gr.083501.108. PMID:2752118
- Suenaga Y, Islam SM, Alagu J, et al. NCYM, a Cis-Antisense Gene of MYCN, Encodes a De Novo Evolved Protein That Inhibits GSK3beta Resulting in the Stabilization of MYCN in Human Neuroblastomas. PLoS Genet. 2014;10:e1003996. doi:10.1371/journal.pgen.1003996. PMID:3879166
- Liu PY, Erriquez D, Marshall GM, et al. Effects of a novel long noncoding RNA, lncUSMycN, on N-Myc expression and neuroblastoma progression. J Natl Cancer Inst. 2014;106: pii: dju113. doi:10.1093/jnci/dju113. PMID:24906397.
- Weiss WA, Aldape K, Mohapatra G, et al. Targeted expression of MYCN causes neuroblastoma in transgenic mice. Embo J. 1997;16:2985–2995. doi:10.1093/emboj/16.11.2985. PMID:9214616
- Defferrari R, Tonini GP, Conte M, et al. Concomitant DDX1 and MYCN gain in neuroblastoma. Cancer Lett. .2007;256:56–63. doi:10.1016/j.canlet.2007.05.010. PMID:17611020
- Bell JL, Turlapati R, Liu T, et al. IGF2BP1 harbors prognostic significance by gene gain and diverse expression in neuroblastoma. J Clin Oncol. 2015;33:1285–1293. doi:10.1200/jco.2014.55.9880. PMID:25753434
- Islam A, Kageyama H, Takada N, et al. High expression of Survivin, mapped to 17q25, is significantly associated with poor prognostic factors and promotes cell survival in human neuroblastoma. Oncogene. 2000;19:617–623. doi:10.1038/sj.onc.1203358. PMID:10698506
- Caron H, van Sluis P, de Kraker J, et al. Allelic loss of chromosome 1p as a predictor of unfavorable outcome in patients with neuroblastoma. N Engl J Med. 1996;334:225–230. doi:10.1056/nejm199601253340404. PMID:8531999
- Henrich KO, Schwab M, Westermann F. 1p36 tumor suppression–a matter of dosage? Cancer Res. 2012;72:6079–6088. doi:10.1158/0008-5472.can-12-2230. PMID:23172308
- Diskin SJ, Hou C, Glessner JT, et al. Copy number variation at 1q21.1 associated with neuroblastoma. Nature. 2009;459:987–991. doi:10.1038/nature08035. PMID:2755253
- Wang K, Li M, Hadley D, et al. PennCNV: an integrated hidden Markov model designed for high-resolution copy number variation detection in whole-genome SNP genotyping data. Genome Res. 2007;17:1665–1674. doi:10.1101/gr.6861907. PMID:2045149
- R Core Team. R: a language and environment for statistical computing. Vienna, Austria: R Foundation for Statistical Computing; 2016.
- Kaplan EL, Meier P. Nonparametric estimation from incomplete observations. In: Kotz S, Johnson N, editors. Breakthroughs in statistics. Springer Series in Satistics. New York (NY): Springer New York; 1992. p. 319–337.
- Therneau T [Internet]. Rochester (MN): Mayo Clinic; A Package for Survival Analysis in S. version 2.38. c2015 [cited 2017 July 17]. Available from: https://CRAN.R-project.org/package=survival
- Kassambara A, Kosinski M [Internet]. Marseille (France): Statistical tools for high throughput data analysis. Survminer: Drawing Survival Curves using ‘ggplot2’. 2016. c2016 [cited 2017 July 17]. Available from: http://www.sthda.com/english/rpkgs/survminer/.
- Goel MK, Khanna P, Kishore J. Understanding survival analysis: Kaplan-Meier estimate. Int J Ayurveda Res. 2010;1:274–278. doi:10.4103/0974-7788.76794. PMID:3059453