
 ?Mathematical formulae have been encoded as MathML and are displayed in this HTML version using MathJax in order to improve their display. Uncheck the box to turn MathJax off. This feature requires Javascript. Click on a formula to zoom.
ABSTRACT
Exocytosis of large dense core vesicles is responsible for hormone secretion in neuroendocrine cells. The population of primed vesicles ready to release upon cell excitation demonstrates large heterogeneity. However, there are currently no models that clearly reflect such heterogeneity. Here, we develop a novel model based on single vesicle release events from amperometry recordings of PC12 cells using carbon fiber microelectrode. In this model, releasable vesicles can be grouped into two subpopulations, namely, SP1 and SP2. SP1 vesicles replenish quickly, with kinetics of ~0.0368 s−1, but likely undergo slow fusion pore expansion (amperometric signals rise at ~2.5 pA/ms), while SP2 vesicles demonstrate slow replenishment (kinetics of ~0.0048 s−1) but prefer fast dilation of fusion pore, with an amperometric signal rising rate of ~9.1 pA/ms. Phorbol ester enlarges the size of SP2 partially via activation of protein kinase C and conveys SP1 vesicles into SP2. Inhibition of Rho GTPase-dependent actin rearrangement almost completely depletes SP2. We also propose that the phorbol ester-sensitive vesicle subpopulation (SP2) is analogous to the subset of superprimed synaptic vesicles in neurons. This model provides a meticulous description of the architecture of the readily releasable vesicle pool and elucidates the heterogeneity of the vesicle priming mechanism.
INTRODUCTION
Exocytosis, also known as regulated secretion, refers to the membrane trafficking process by which secretory vesicles release their loading cargoes into the extracellular environment via the fusion of the vesicle membrane to the plasma membrane in response to signals such as Ca2+. Exocytosis plays critical roles in a variety of cell types. For example, it is responsible for neurotransmitter release from neurons and hormone secretion from endocrine cells. It also contributes to membrane protein delivery, acrosome reactions, etc [Citation1,Citation2].
Upon cell excitation, membrane depolarization induces Ca2+ influx via voltage-gated calcium channel (VGCC) opening. Calcium ions interact with Ca2+ sensors such as synaptotagmin [Citation3,Citation4] and subsequently trigger vesicle release through membrane fusion driven by the soluble N-ethylmaleimide-sensitive factor attachment protein receptor (SNARE) complex, which consists of a vesicle protein, vesicle-associated membrane protein (VAMP, also named synaptobrevin); a plasma membrane protein, syntaxin, and a cytoplasmic protein, synaptosomal-associated protein of 25 kD (SNAP-25) [Citation5,Citation6]. Nonetheless, vesicles must undergo docking and priming processes before membrane fusion occurs. In detail, vesicles are transported to the release site and anchor to the plasma membrane via a process termed docking and adopt a readily releasable mode through a maturation process known as priming [Citation7]. At this stage, the SNARE complex is formed and switches to a ready-to-work mode with the assistance of priming factors such as Munc13 [Citation8,Citation9]. In a particular cell, all primed vesicles that can be released upon excitation constitute the readily releasable pool (RRP) [Citation10,Citation11]. The size of the RRP determines the amount vesicles that are released in response to stimulation, while replenishment of the RRP largely mediates the plasticity of release [Citation12].
Although a tremendous number of studies have been carried out on vesicle priming and membrane fusion, the current understanding is still very limited. Currently, one important issue in this field is the heterogeneity of secretory vesicles, which makes exocytosis extremely complicated. Specifically, the priming state of each vesicle in the RRP is not uniform [Citation13,Citation14], probably due to divergent molecular mechanisms. Hence, to further elucidate the mechanisms underlying exocytosis, heterogeneous vesicles must be categorized into particular subgroups and studied individually.
Lee et al. proposed that in neurons, a subset of synaptic vesicles (SVs) is more competent for release than others [Citation15]. To distinguish these specific vesicles from normally primed vesicles, they are called “superprimed” vesicles. Experiments in neurons have identified this particular vesicle subpopulation [Citation16] and revealed that short-term synaptic plasticity is closely related to the superpriming of SVs [Citation16–18]. Phorbol ester was found to facilitate superpriming and enlarge the superprimed SV pool in mammalian neurons [Citation16]. In this case, the putative target of phorbol ester might be Munc13 [Citation19,Citation20] or protein kinase C (PKC) [Citation21,Citation22]. Interestingly, the protein Unc13, a homolog of Munc13, was found to participate in SV superpriming in C. elegans [Citation23,Citation24]. The Munc13 isoform Munc13-3 was also found to be involved in superpriming [Citation25]. Hence, Munc13 is likely a key mediator of heterogeneity in vesicle priming. However, whether PKC plays a role in heterogeneous priming is still unclear.
In neuroendocrine cells, large dense core vesicles (LDCVs), which control the release of hormones, have also been found to be heterogeneous. Distinct subsets of LDCVs might be associated with distinct phases of secretion [Citation26]. Amperometry recordings, which can distinguish released catecholamine from single vesicles in chromaffin cells [Citation27,Citation28] or PC12 cells [Citation29], have demonstrated the existence of heterogeneous LDCV release events [Citation30–32]. However, subpopulations of LDCVs in neuroendocrine cells have not been clearly modeled thus far. Whether the releasable population of LDCVs exhibits heterogeneity similar to that of SVs in neurons remains an open question.
In the present study, we characterized catecholamine release from LDCVs in PC12 cells at the single-vesicle level by amperometry recordings using a carbon fiber microelectrode. With this method, we were able to determine the fusion kinetics and quantal size of each released single vesicle, which might reflect the state of the vesicle immediately prior to release. From the analysis of the amperometry data, it was found that vesicles can be grouped into two subpopulations based on the rate of fusion pore expansion. Further studies revealed that these two subpopulations showed distinct fusion kinetics, quantal sizes and replenishment rates, suggesting that they had divergent priming states. Moreover, phorbol ester enlarged the subpopulation with faster fusion kinetics via PKC-dependent and PKC-independent pathways, demonstrating the similarity of this particular subpopulation of LDCVs to superprimed SVs and suggesting the involvement of PKC and other factors in the modulation of the heterogeneous priming states of vesicles. Finally, we developed a two-subpopulation model that fits the experimental data well to demonstrate the heterogeneity of LDCVs in neuroendocrine cells.
Materials and Methods
Chemicals and buffers
Phosphol-12-myristate-13-acetate (PMA), bisindolylmaleimide (BIS), Clostridium difficile toxin B (TOXB), 1-butanol (BUT), poly-L-lysine (PLL), and dexamethasone were purchased from Sigma (St. Louis, MO, USA). During the experiments, the cells were maintained in resting buffer consisting of 140 mM NaCl, 5.5 mM KCl, 2 mM MgCl2, 2 mM CaCl2, 10 glucose, and 10 mM 4-(2-hydroxyethyl)-1-piperazineethanesulfonic acid (HEPES) with a pH of 7.4. Ca2+-triggered release was evoked by perfusion of high-KCl buffer consisting of 37 mM NaCl, 105 mM KCl, 5 mM CaCl2, 2 mM MgCl2, and 10 mM HEPES with a pH of 7.4. The chemicals used in buffers were also obtained from Sigma.
Cell culture
PC12 cells (ATCC, Manassas, VA, USA) were cultured in a 37°C incubator (Thermo Fisher Scientific, Waltham, MA, USA) in a humidified atmosphere of 5% CO2. The culture medium was RPMI 1640 medium containing 10% fetal bovine serum and 5% horse serum. Penicillin-streptomycin supplement (1%) was also included in the culture medium. All media, supplements and serum samples were purchased from Thermo Fisher Scientific.
Amperometry measurement
PC12 cells were plated on PLL-coated coverslips for experiments. To induce a chromaffin cell-like phenotype, cells on coverslips were incubated with 5 μM dexamethasone for 3 ~ 5 days before the experiments as previously described [Citation33,Citation34].
During the experiment, PC12 cells were maintained in resting buffer at room temperature. Amperometry recordings were performed as previously described [Citation35,Citation36]. Briefly, a 5-μm-diameter carbon fiber microelectrode (ALA Scientific Instruments, Farmingdale, NY, USA) was constantly held at 700 mV and placed right touching the cell membrane. Only microelectrodes that give good response to a puffer application of 100 µM dopamine were used for experiments. To evoke the release of LDCVs, cells were stimulated via local perfusion of high-KCl buffer. Release events were recorded as amperometry signals using an EPC-10 double patch-clamp amplifier (HEKA Electronik, Lambrecht, Germany). The sampling rate for all recordings was 4 kHz and all signals were filtered by a low-pass filter of 1 kHz, as previously described [Citation37]. For recordings from the same cell with and without PMA treatment, cells were stimulated and recorded in the absence of PMA first. Afterward, the cells were allowed to recover in resting buffer for more than 5 min. Subsequently, 0.1 μM PMA was added to the buffer for 10 min, and the cells were stimulated and recorded again. A total of 15 min is sufficient for the recovery LDCV exocytosis in PC12 cells in the absence of PMA treatment (Supplementary Figure 1). Hence, the effect of PMA treatment on each single cell can be observed using this protocol.
Data analysis
All recorded amperometry traces were analyzed using the program “Amperometric Spike Analysis 8.15” [Citation38] in Igor Pro software (WaveMetrics, Lake Oswego, OR, USA). The half width (t1/2), amplitude (Imax), charge (Q), rise time, rise slope, fall time, foot amplitude (Ifoot), foot duration (tfoot), and foot charge (Qfoot) were quantified for each single spike. Only spikes with amplitudes larger than 2 pA were used for analysis. Data statistics and curve fitting (Gaussian or exponential) were performed using Prism 6 software (GraphPad, La Jolla, CA, USA). Significance of data was accessed using unpaired t-test, paired t-test, Kolmogorov–Smirnov test, or Kruskal-Wallis test followed by Dunn’s post hoc test as indicated. Significance comparing the single versus double Gaussian fitting was evaluated using the extra sum-of-squares F test.
Modeling
To depict the distinct priming processes of two subpopulations of LDCVs, termed subpopulation 1 (SP1) and subpopulation 2 (SP2), three models are proposed. The priming of SP1 and SP2 vesicles was assumed to be exponential process with kinetics of k1 and k2 (assuming SP1 vesicles prime faster than SP2, so k1 > k2; also assuming k1 and k2 are constant, independent of PMA treatment). The proportions of SP1 and SP2 were set as A1 and A2 (A1 + A2 = 1), respectively, which could be altered by PMA treatment.
Model 1, parallel model: in this model, we assume that unprimed vesicles are primed into SP1 and SP2 simultaneously and independently. If all primed vesicles are depleted at t = 0, the replenishment of each subpopulation can be expressed as functions of time as following:
And the total replenishment is the weighted sum of SP1 and SP2:
Model 2, tandem model: in this model, we assume that unprimed vesicles can only be primed into SP1, and only SP1 vesicles can be further primed into SP2. In this model, since all vesicles need to fill into SP1 at a rate of k1, the total replenishment would be:
And as k2 is the rate-limiting step (k2 < k1), the replenishment of SP2 is only dependent on k2, so
Finally, the replenishment of SP1 is total minus SP2 with weight, that could be expressed as following:
Please note a tandem model that vesicles refill SP2 first and convey to SP1 thereafter is not feasible, because k2 < k1, SP2 replenishment is too slow to supply the refilling of SP1.
Model 3, combined model: the combining of parallel and tandem models. It is assumed that a proportion of vesicles (p) in SP2 is further primed from SP1 whereas the rest of SP2 (1-p) is primed from unprimed vesicles. The value of p is dependent on PMA treatment. To simplify the model, we also assume that the refilling of SP2 from SP1 and unprimed vesicle pool are at the same rate (k2). Hence, the overall replenishment of SP2 is independent of p and only depends on k2, as following:
Meanwhile, the total replenishment is the direct refilling of SP2 from the unprimed pool ((1 – p) A2) at the rate of k2 plus the rest vesicles (A1 + pA2) that refill SP1 at the rate of k1, which would be:
Again, the replenishment of SP1 is total minus SP2 with weight:
Experimental data were fitted with the functions of each model, and optimized values of k1, k2, A1, A2, and p were obtained using GraphPad Prism 6 software.
RESULTS
A PMA-sensitive subpopulation of LDCVs exhibits a higher rate of fusion pore expansion in PC12 cells
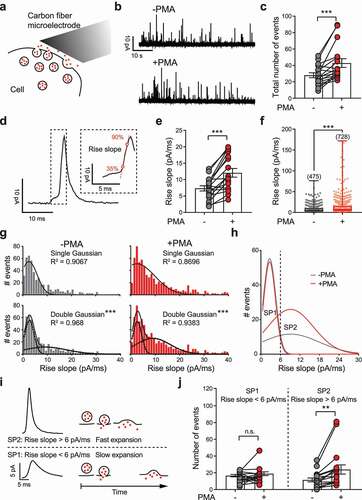
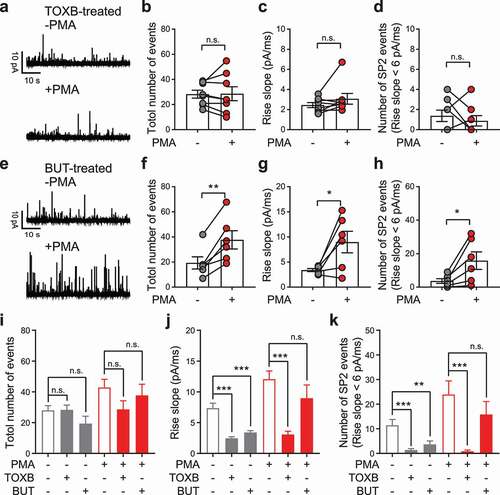
It has been well determined that phorbol ester (i.e. PMA) facilitates vesicle release by promoting priming and accelerates fusion pore kinetics [Citation21,Citation39,Citation40]. In neurons, PMA treatment specifically modulates the priming state of a subset of SVs via a process termed superpriming [Citation16]. To test whether such a phorbol ester-induced heterogeneous priming state also exists for LDCVs in neuroendocrine cells, we treated PC12 cells with 0.1 μM PMA for 10 min and tracked single vesicle release events by carbon fiber amperometry recordings ()). In detail, LDCV release was evoked by perfusion of high-KCl buffer for 60s before and after PMA treatment. A total of 475 fusion events before (-PMA) and 728 events after (+PMA) treatment were recorded as amperometric spikes ()) from 17 cells. Not surprisingly, PMA treatment significantly enhanced the total number of release events () and ) [Citation41]. To characterize single vesicles, the spike half width (t1/2), amplitude (Imax), quantal size (Q and Q1/3), rise time, rise slope and fall time were calculated for each single spike (). At single-vesicle level, PMA treatment significantly reduced t1/2 and fall time, and increased Imax, Q, Q1/3 and rise slope. But these changes were not significant at cell level except for Imax and rise slope. Consistent with a previous study [Citation40], the most PMA-sensitive spike parameter was the rise slope () and ), which represents the rate of fusion pore expansion [Citation38]. Our sampling (4 kHz) and filtering (1 kHz) rate is high enough to capture this quick process, since further enhancing the sampling and filtering rate to 20 kHz and 2 kHz had no significant effect on the data distribution of Imax and rise slope (Supplementary Figure 2). A significant increase (more than 60%) in the spike rise slope was found at both the cell level ()) or the single-vesicle level ()). To further explore whether such an increase in the rise slope resulted from enhancement of the whole vesicle population or changes in a specified subgroup, the histogram of the rise slope was plotted and fitted to either a single Gaussian or double Gaussian function ()). Remarkably, a double Gaussian function allowed significantly better fitting than a single Gaussian function (F = 373.5, P < 0.001, extra sum-of-squares F test), suggesting the existence of at least two subpopulations of LDCVs with distinct fusion pore expansion rates. We named the subpopulation with a lower spike rise slope of ~2.5 pA/ms subpopulation 1 (SP1), while the other subpopulation was named subpopulation 2 (SP2), whose rise slope was much higher (~9.1 pA/ms). Strikingly, PMA treatment largely enhanced the size of SP2 without affecting SP1 ()). These findings indicated the existence of a specific pool of releasable LDCVs in PC12 cells with a higher rate of fusion pore expansion and sensitivity to phorbol ester treatment. To characterize these two groups of vesicles, we isolated the two subpopulations by setting a threshold at 6 pA/ms. In brief, LDCVs with rise slopes lower than 6 pA/ms were considered SP1 vesicles, whereas SP2 vesicles were those with rise slopes higher than 6 pA/ms ()). With this straightforward and effective isolation method, we found that PMA had no effect on the size of SP1 but significantly enlarged that of SP2 ()).
Table 1. Quantificational characterization of amperometric spikes recorded from PC12 cells before and after PMA treatment
Figure 1. PMA treatment selectively enlarges a subpopulation of LDCVs in PC12 cells that manifests amperometric spikes with steeper rises. (a) A cartoon demonstrating amperometry recordings of single vesicle release events using a carbon fiber microelectrode. (b) Representative traces recorded by amperometry during 60s of membrane depolarization induced by high-KCl stimulation. Traces from the same PC12 cell before (-PMA, upper) and after (+PMA, lower) PMA treatment (0.1 µM, 10 min) are shown. Each spike represents a single LDCV release event. (c) Quantification of the total number of release events before and after PMA treatment. (d) A representative amperometric spike with a zoomed-in view of its rising phase. The slope of the linear fit between 35% and 90% of the peak amplitude (Imax) was defined as the rise slope. (e-f) Quantification of rise slopes before and after PMA treatment for each single cell (e) or for each individual release event (f). (g) Histograms of rise slopes before (-PMA, gray) and after (+PMA, red) PMA treatment are depicted and fit to either a single Gaussian or double Gaussian function. The R2 values of each fitting are shown. Please note that 9 -PMA events and 38 + PMA events with rise slopes > 40 pA/ms are not visible in the histogram, as they are out of range, but were still included in the Gaussian fitting. (h) The two individual components of double Gaussian fittings in panel g were replotted for comparison. PMA treatment enlarged the phase with a higher rise slope but did not affect the other phase. The events from these two subpopulations (SPs) can be approximately distinguished by delimitation at a rise slope = 6 pA/ms. (i) Representative spikes with a rise slope > 6 pA/ms may reflect a subpopulation of vesicles (SP2) with fast fusion pore expansion, while spikes with a rise slope < 6 pA/ms may reflect the other vesicle subpopulation (SP1) with slow fusion pore expansion. (j) Quantification of the number of release events from SP1 (rise slope < 6 pA/ms) and SP2 (rise slope > 6 pA/ms) before and after PMA treatment. All recordings were performed independently from 17 cells. In total, 475 events before and 728 events after PMA treatment were obtained and analyzed. In panels c, e and j, the data are shown as the mean ± SEM with individual data points, and a paired t-test was used to evaluate significance. In panel f, the data are shown in box plots with scatter plots, and the Kolmogorov–Smirnov test was used to evaluate significance. In panel g, the extra sum-of-squares F test was used to compare the single and double Gaussian fitting. n.s. P > 0.05, **P < 0.01, ***P < 0.001.
Distinct kinetics of single fusion events for the different subpopulations
Next, we analyzed the amperometric spikes to investigate the difference between SP1 and SP2 vesicles. The total charge (Q) of each individual spike represents the size of quantal release. Since the released quantum can be considered 3-dimensional, the cube root of total charge (Q1/3) is usually used to quantify the quantal size as a 1-dimensional parameter. Q1/3 is a more preferred quantification than Q because it is linearly associated with the radius of the vesicle, and its distribution shows less skewness [Citation42,Citation43]. Interestingly, SP2 vesicles exhibited significantly larger Q1/3 than SP1 vesicles although only a ~10% increase was observed ()), suggesting that the quantal sizes of the two subpopulations are nonidentical. Surprisingly, PMA treatment failed to alter the quantal size of either individual subpopulation, although the overall quantal size was significantly enhanced. Obviously, the PMA-induced increase in quantum release did not result from homogeneous elevation of single vesicles but from the enlargement of a special vesicle pool with a greater quantal size. Furthermore, the half width (t1/2) of amperometric spikes, which is a key temporal parameter to characterize membrane fusion, demonstrated a similar trend as quantal size. SP2 vesicles produced a shorter t1/2 than SP1 vesicles, but neither subpopulation was affected by PMA treatment. PMA led to a general reduction in the t1/2 due to the robust increase in vesicle number in SP2 ()).
Figure 2. Vesicles from two different subpopulations show distinct quantal size, spike half width and fusion pore sizes but similar fusion pore lifetimes. (a) Q1/3, the cube root of the spike charge (Q, schematic diagram in the upper left), was analyzed to estimate quantal size. PMA treatment generally increased Q1/3 (lower left). Vesicles from SP2 showed a larger Q1/3 than those from SP1, but neither subpopulation was affected by PMA (right). (b) For the spike half width (t1/2, schematic diagram in upper left), PMA treatment generally decreased t1/2 (lower left). Vesicles from SP2 showed a shorter t1/2 than those from SP1, but neither subpopulation was affected by PMA (right). (c) The amplitude of the prespike foot (Ifoot, schematic diagram in the upper left) was analyzed to estimate the size of the initial fusion pore. PMA treatment generally increased Ifoot (lower left). Vesicles from SP2 showed a larger Ifoot than SP1, but only SP1 was slightly but significantly affected by PMA (right). (d) The duration of the prespike foot (tfoot, schematic diagram in the upper left) was analyzed to estimate the lifetime of the initial fusion pore. PMA had no effect on tfoot (lower left), and vesicles from SP1 and SP2 exhibited no significant difference in tfoot with and without PMA treatment. All data are from the same recordings presented in . In total, 475 spike events and 196 foot events before PMA treatment and 728 spike events and 275 foot events after PMA treatment were analyzed from 17 cells independently. The Ns for statistics are shown in panels a and c. The data are presented in box plots with scatter plots. For comparison of two groups (low left of each panel), the Kolmogorov–Smirnov test was used to evaluate significance, and for comparison of four groups (right of each panel), the Kruskal-Wallis test followed by Dunn’s post hoc test was used. n.s. P > 0.05, * P < 0.05, **P < 0.01, ***P < 0.001.
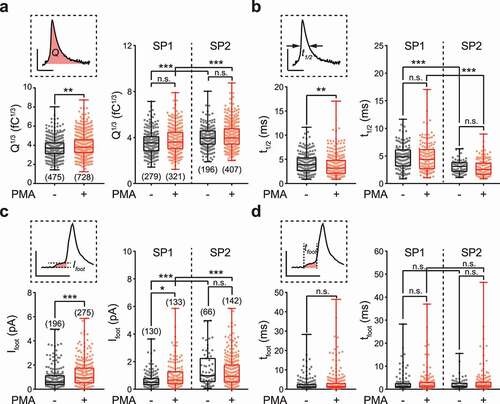
Prespike feet in amperometry recordings correspond with initial fusion pores before dilation [Citation38]. We then analyzed the prespike foot signals to characterize the initial fusion pores of vesicles from the two different subpopulations. Both before and after PMA treatment, ~40% of amperometric spikes contained a detectable prespike foot. There was no difference in the proportion of spikes with feet between SP1 and SP2 vesicles (Supplementary Figure 3). At single-vesicle level, PMA treatment significantly increased the amplitude (Ifoot) and charge (Qfoot) of the foot signal but had no effect on the duration of the foot (tfoot) () and ), albeit such significance was not observed as cell level (). A direct comparison between the two subpopulations revealed that Ifoot significantly differed between SP1 and SP2, whereas tfoot was the same for both subpopulations. These observations suggest that SP2 vesicles generate fusion pores with larger sizes at the initiation of membrane fusion than SP1 vesicles, but the fusion pore lifetime before dilation is not significantly different. PMA treatment enhanced Ifoot mainly due to the enlargement of the proportion of SP2, although a slight but significant elevation of Ifoot in SP1 vesicles was also observed ()). Taken together, these results suggest that vesicles from SP2 release larger quanta with a larger initial fusion pore and that the final fusion is likely accelerated (shorter t1/2), which is consistent with a higher fusion pore expansion rate. These observations confirmed the divergent states of the two subsets of vesicles.
The vesicle pool with faster fusion pore expansion rate exhibits slower replenishment kinetics
SP1 and SP2 vesicles demonstrate distinct fusion pore kinetics. However, it is not clear whether this is due to a unique priming state or special membrane fusion mechanism. To evaluate vesicle priming, the prefusion process, we measured the replenishment of the releasable vesicle pool by dual stimulations at a fixed time interval (30s, 60s or 120s) ()). Since a single stimulation for 60s is sufficient to deplete releasable vesicles from either SP1 or SP2 (the rate of release reaches a plateau, as shown in Supplementary Figure 4), the second stimulation after a certain duration should represent the recovery of the RRP, which results from priming of new vesicles. As shown in ), a much slower replenishment was found for SP2 than for SP1. The extremely slow replenishment suggested a distinct priming process that takes a much longer time for the SP2 vesicle subgroup.
Figure 3. The two subpopulations of vesicles demonstrated different kinetics of replenishment. (a) Representative traces recorded from PC12 cells subjected to repeated stimulations (high-KCl, 60s) at a time interval of 30s, 60s or 120 s. (b) The percentage of replenishment was quantified as the proportion of events after versus before the time interval. The percentages of all events (Total, left) and events with rise slopes < 6 pA/ms (SP1, middle) and > 6 pA/ms (SP2, right) were plotted versus the time interval. The data are presented as the mean ± SEM in scatter plots. An unpaired t-test was used to evaluate significance between untreated cells (-PMA, gray) and PMA-treated cells (+PMA, red). * P < 0.05, ** P < 0.01. (c) Three models for the replenishment of the two subpopulations of vesicles: parallel (model 1, upper), tandem (model 2, middle) and combined (model 3, lower). A schematic diagram of each model is shown in the upper left. Equations resolving the replenishment kinetics for the overall vesicle population (Total) and either subpopulation (SP1 or SP2) are shown in the lower left. The data from experiments (shown in panel b) were replotted as the mean ± SEM versus time and fitted to the kinetics equations for each model. The optimized values of kinetics (k1 and k2), relative sizes of the subpopulations (A1 and A2) and the proportion of tandem refilling of SP2 (p) for the curve fitting are shown for each individual model. (d) Pie chart showing the relative size of the two subpopulations of vesicles obtained from each model (A1 versus A2) and the relative event number of SP1 (rise slope < 6 pA/ms) and SP2 (rise slope > 6 pA/ms) observed in the experiments shown in . The real data from the experiments best fit model 3.
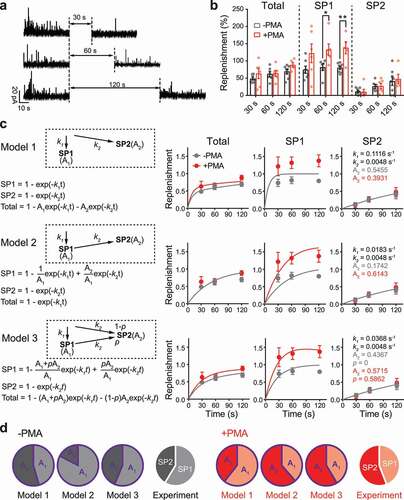
If the priming processes of SP1 and SP2 vesicles are completely different and the priming of SP2 vesicles takes much longer, a key question is whether SP2 vesicles are directly transferred from unprimed vesicles or conveyed from SP1 vesicles. As described in Materials and Methods (also see )), to address this question, we set up a parallel model (Model 1, vesicles are primed into SP1 and SP2 parallelly) and a tandem model (Model 2, vesicles are primed into SP1 first and further primed into SP2 afterward). The fittings of experimental data using these two models are plotted in ). Unfortunately, neither Model 1 nor Model 2 demonstrated good fitting for data from real experiments. Hence, SP2 vesicles are unlikely primed from one simple source. We thereby predict that SP2 vesicles are concurrently originated from both SP1 and the unprimed pool, and developed a Model 3 that combines Models 1 and 2. In this improved model, it is assumed that a proportion (p) of SP2 vesicles was from SP1 and the rest (1-p) was from unprimed vesicles. As expected, the experimental data fit model 3 much better than models 1 and 2 (,)).
In model 3, the optimized k1 was 0.0368 s−1, while k2 was 0.0046 s−1, indicating that the refilling rate of SP2 was ~8 times slower than that of SP1. This large difference in the kinetics of replenishment suggested completely distinct priming processes. In other words, SP1 and SP2 vesicles are likely in distinct priming states and possess different mechanisms. Interestingly, superpriming of SVs also takes much longer than normal priming [Citation16].
This model also produced optimized p values of 0 without PMA and 0.5862 with PMA, suggesting that SP1 and SP2 vesicles are primed in parallel from an unprimed vesicle pool in the absence of PMA but that in the presence of PMA, ~60% of SP2 vesicles are transferred from SP1 vesicles. This PMA-dependent fragment of SP2 originates from unprimed vesicle pool, quickly conveys into SP1 (time constant: ~30 s) and then slowly into SP2 (time constant: ~200 s) consequently. Therefore, during the 30 ~ 120 s of recovery in our experiment, this part of LDCVs is largely stuck in SP1 rather than SP2. This is why we observed that PMA treatment increased the recovery rate of SP1 but not SP2 to a value even greater than 100% ()).
PMA induces enlargement of SP2 partially via activation of PKC
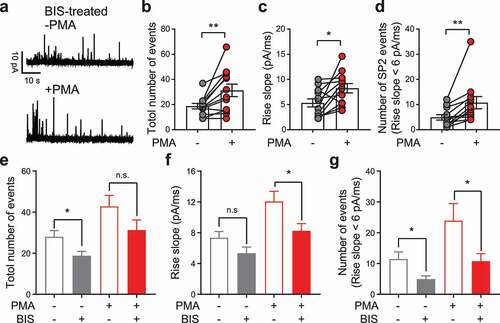
The above experiments revealed a phorbol ester-sensitive pool of releasable vesicles in PC12 cells that mimics the superprimed vesicle pool in neuronal synapses to some extent. It has been well established that phorbol ester facilitates vesicle priming and release by targeting two key proteins: Munc13 [Citation19] and PKC [Citation21]. Munc13 has been reported to involve vesicle superpriming [Citation23,Citation25], whereas the role of PKC has not yet been determined. Here, we used bisindolylmaleimide (BIS), a general inhibitor of most PKC isoforms [Citation40,Citation44], to examine the involvement of PKC in the formation of the superpriming-like LDCV pool (SP2) in PC12 neuroendocrine cells ()). After BIS treatment, PMA still significantly elevated the total number of release events, averaged spike rise slope and number of release events from SP2 ()), indicating that PMA activated PKC-independent mechanisms. Interestingly, compared with the non-BIS treated control cells mentioned above, BIS pretreatment significantly reduced the number of total release events and release events from SP2, and PMA failed to completely rescue the averaged spike rise slope and number of release events from SP2 in BIS-pretreated cells (-)). These results suggest that inhibition of PKC partially disrupts the SP2 vesicle pool. Hence, PKC-dependent and PKC-independent pathways are likely involved in the maintenance of the size of the SP2 vesicle pool.
Figure 4. Bisindolylmaleimide (BIS) partially abolished the PMA-induced enlargement of SP2. (a) Representative recordings from a PC12 cell pretreated with 2.5 μM BIS for 30 min. Traces from the same cell before (-PMA, upper) and after (+PMA, lower) PMA treatment are shown. (b-d) Individual data points for the total number of release events (b), averaged spike rise slope of each cell (c) and number of release events from SP2 (events with rise slope > 6 pA/ms) (d) before and after PMA treatment were plotted as the mean ± SEM. The data were collected independently from 12 cells. Paired t-test was used to evaluate significance. (e-g) For comparison, the total number of release events (e), average spike rise slope of each cell (f) and number of release events from SP2 (g) before and after PMA treatment from 17 control cells (see ) and 12 BIS-pretreated cells (see panels b-d) were replotted together as the mean ± SEM. Unpaired t-test was used to evaluate significance. n.s. P > 0.05, *P < 0.05, **P < 0.01.
Drugs that modulate the PMA-sensitive SP2 vesicle pool
Next, we tested whether factors other than PKC contribute to the formation of SP2. Actin rearrangement plays a key role in the recruitment of vesicles to release sites [Citation45] and hence is potentially involved in the formation of distinct vesicle pools such as SP1 and SP2. To test this idea, we blocked actin rearrangement by inhibition of Rho GTPase [Citation46] using C. difficile toxin B (TOXB) [Citation47,Citation48] As shown in -), after pretreatment with TOXB, PMA no longer led to enlargement of SP2. Moreover, TOXB pretreatment likely eliminated the PMA-sensitive SP2 vesicle pool completely.
Figure 5. C. difficile toxin B (TOXB), but not 1-butanol (BUT), eliminated PMA-sensitive SP2 vesicles. (a) Representative recordings from a PC12 cell pretreated with 100 ng/ml TOXB for 18 h. Traces from the same cell before (-PMA, upper) and after (+PMA, lower) PMA treatment are shown. (b-d) Individual data points for the total number of release events (b), averaged spike rise slope of each cell (c) and number of release events from SP2 (events with rise slope > 6 pA/ms) (d) before and after PMA treatment were plotted as the mean ± SEM. The data were collected independently from 8 cells. (e) Representative recordings from a PC12 cell maintained in 0.2% BUT throughout the whole experiment. Traces from the same cell before (-PMA, upper) and after (+PMA, lower) PMA treatment are shown. (f-h) Individual data points for the total number of release events (f), averaged rise slope of each cell (g) and number of release events from SP2 (h) before and after PMA treatment were plotted as the mean ± SEM. The data were collected independently from 6 cells. (i-k) The total number of release events (i), averaged spike rise slope of each cell (j) and number of release events from SP2 (k) before and after PMA treatment from 17 control cells (see ), 8 TOXB-treated cells (see panels a-d) and 6 BUT-treated cells (see panels e-h) were replotted together as the mean ± SEM. For the data in panels b-d and f-h, paired t-tests were used to evaluate significance, and for the data in panels i-k, unpaired t-tests were used. n.s. P > 0.05, *P < 0.05, **P < 0.01, ***P < 0.001.
In addition to proteins, lipids are also critical regulatory molecules of exocytosis. Phospholipase D (PLD) hydrolyzes phosphatidylcholine to generate phosphatidic acid in the lipid bilayer membrane [Citation49]. Inhibiting PLD activity using 1-butanol (BUT) influences secretion through altering the lipid component of the membrane [Citation50,Citation51]. We next tested the effect of PMA on SP2 size in the presence of BUT. Significant enlargement of SP2 was found, and the number of total release events and overall spike rise slope were both elevated by PMA (-)).
Compared with control treatments, neither TOXB nor BUT had an effect on the total number of release events ()), but both drugs decreased the averaged spike rise slope ()) and number of release events from SP2 ()). PMA rescued this effect in BUT-treated cells but not in TOXB-treated cells (-)). Hence, Rho GTPase-dependent actin rearrangement is likely essential for the formation of the SP2 vesicle pool. The lipid component of the membrane mediated by PLD is probably involved in but not required for vesicle subgrouping.
DISCUSSION
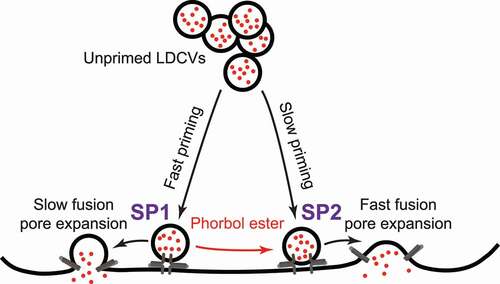
Vesicle exocytosis is a key process that mediates hormone secretion from endocrinal cells and neurotransmitter release from neurons. The heterogeneity of secretory vesicles has been found to be important for the final quantity and kinetics of total release but has not been well characterized. In the present study, we developed a two-subpopulation model for releasable LDCVs in PC12 cells based on single vesicle release event recordings using carbon fiber microelectrode. As shown in , releasable vesicles can be divided into two subpopulations, SP1 and SP2. SP1 vesicles undergo fast priming but slow fusion pore dilation. In contrast, SP2 vesicles are slowly primed but with faster fusion pore expansion kinetics. Treatment with phorbol ester transfers SP1 vesicles to SP2 and enlarges the size of SP2. This model describes the heterogeneity of LDCVs in PC12 and explains the effect of phorbol ester.
Figure 6. Schematic diagram of the two-subpopulation model of releasable LDCVs in PC12 cells. Vesicles can be parallelly primed into two distinct releasable states. Vesicles in the two states form subpopulations of releasable vesicles (SP1 and SP2). SP1 vesicles are primed quickly, whereas SP2 vesicles are primed slowly. In response to stimulation, SP2 vesicles exhibit faster fusion pore dilation and more thorough membrane fusion than SP1 vesicles. In the presence of phorbol ester, SP1 vesicles can be switched to SP2.
Neuroendocrine cells such as PC12 cells and chromaffin cells are popular cell models for studying vesicle exocytosis. Previous studies have identified three pools of vesicles in neuroendocrine cells, the readily releasable pool (RRP), slow releasable pool (SRP) and reserved pool (RP), based on the kinetics of release in response to photolysis of caged Ca2+ [Citation52,Citation53]. Vesicles are transferred from the SP to the SRP and then to the RRP prior to final release. This classic three-pool model revealed a two-step maturation process for vesicles that might involve docking and priming. Similarly, SVs in neurons can also be grouped into several pools, such as the RRP, RP and recycling pool [Citation54]. However, according to these models, vesicles are categorized into vesicle pools based only on the stage of the vesicle life cycle during exocytosis; however, the heterogeneity of vesicles in a particular stage has not been determined. A remarkable feature of our two-subpopulation model is that unlike these models, it addresses the heterogeneous states of vesicles in the same stage. In particular, this model is based on vesicle release events recorded by amperometry. Each event is from a vesicle that completes the whole process of exocytosis. Hence, this model reflects the final stage of exocytosis for readily releasable vesicles in response to high-KCl stimulation close to physiological levels. In this sense, our model actually divides the RRP further into two subpopulations, SP1 and SP2, and explains the heterogeneity of the RRP. Therefore, our two-subpopulation model can be considered a further refinement of the classic three-pool model. Combining these two models provides a more complete view of LDCV dynamics and heterogeneity in neuroendocrine cells.
Exocytosis in neuroendocrine cells is analogous to that in neurons, as both cell types requires the SNARE complex and priming factors such as Munc13 and Munc18 [Citation55] and can be potentiated by phorbol ester [Citation19,Citation21]. Notably, heterogeneity has been observed for readily releasable SVs in neurons [Citation13–15]. The SP2 LDCVs in our study demonstrated some similarity with a subset of SVs named superprimed SVs in neurons [Citation16]. First, superpriming takes a much longer time than normal priming, and SP2 vesicles in PC12 cells undergo a slower priming process as well. Second, phorbol ester induces superpriming in neurons and enlarges SP2 in PC12 cells. PMA-induced transfer of SP1 vesicles to SP2 in PC12 cells likely mimics superpriming in neurons. Nonetheless, whether the SP2 vesicles are relatively more easily released in response to stimulation like the superprimed vesicles in neurons still need to be proved in further studies.
Although it has been shown that superpriming in neurons involves Munc13 [Citation23,Citation25] and Doc2 [Citation18], the molecular mechanism of superpriming remains largely unclear. In the present study, we attempted to probe the molecular mechanism of this heterogeneous priming process in PC12 cells. To the best of our knowledge, phorbol ester has two targets involved in the exocytosis pathway. One is Munc13 [Citation19], and the other is PKC [Citation21]. Since blocking Munc13 largely eliminates vesicle release and produces very few release events insufficient for analysis, we chose to inhibit PKC activity with a commonly used blocker, BIS. Consistent with previous studies [Citation40], BIS treatment significantly reduced the number of release events but still generated sufficient events for analysis. Interestingly, inhibition of PKC led to a decrease in vesicle number in SP2, but phorbol ester partially recused the size of SP2 in the presence of a PKC inhibitor. Hence, phorbol ester enlarges SP2 via both PKC-dependent and PKC-independent mechanisms concurrently. In other words, it is likely that both PKC and Munc13 are involved in the formation of the SP2 vesicle pool. Moreover, inhibition of Rho GTPase-dependent actin rearrangement by TOXB almost completely eliminated SP2. This finding indicated that in addition to phorbol ester-related mechanisms, an intact and active actin network is likely a necessary precondition for the maintenance of SP2. In contrast, altering the lipid composition of the membrane by blocking PLD has only minor effects on vesicle subgrouping.
Given the heterogeneity of vesicles in neurons and neuroendocrine cells, it would be interesting to determine whether different vesicle subpopulations correspond to distinct physiological functions. Generally, a vesicle pool that can be easily released but replenishes slowly possibly makes a major contribution to maintaining the competence of release, while the vesicle subset that replenishes quickly likely contributes to the recovery of release capacity for repeated stimulation. In neurons, it has been reported that modulation of SV subpopulations may mediate synaptic strength and plasticity [Citation16,Citation18]. In neuroendocrine cells, how vesicle subpopulations influence total secretion is still an open question. In the present study, our results indicated that phorbol ester potentiated total release (), which can be attributed to selective enlargement of SP2, the subpopulation that releases larger quantal but recovered slower. On the other hand, PMA had only a small effect on the recovery of release capacity (), likely due to the lack of an effect on SP1, the actively replenishing subpopulation. This finding is consistent with the idea that SP2 is associated with release, whereas SP1 is associated with recovery of release. The specific function of each individual vesicle subpopulation will be further explored in future studies.
In conclusion, releasable LDCVs in neuroendocrine cells are heterogeneous and have at least two distinct priming states, a fast priming and slow fusion pore expansion state (SP1) and a slow priming and fast fusion pore dilation state (SP2), and thereby can be categorized into two subpopulations. Both subpopulations have unique priming mechanisms and specific functions in cell secretion. Based on this two-subpopulation model, the priming mechanism and physiological function of each subset of LDCVs can be studied individually to further illuminate the molecular mechanism and physiological role of exocytosis.
Supplemental Material
Download Zip (504.2 KB)Disclosure statement
No potential conflict of interest was reported by the author(s).
Supplementary Material
Supplemental data for this article can be accessed here.
Additional information
Funding
References
- Burgoyne RD, Morgan A. Secretory granule exocytosis. Physiol Rev. 2003;83(2):581–632.
- Jahn R, Fasshauer D. Molecular machines governing exocytosis of synaptic vesicles. Nature. 2012;490(7419):201–207.
- Geppert M, Goda Y, Hammer RE, et al. Synaptotagmin I: a major Ca2+ sensor for transmitter release at a central synapse. Cell. 1994;79(4):717–727.
- Chapman ER. Synaptotagmin: a Ca2+ sensor that triggers exocytosis? Nat Rev Mol Cell Biol. 2002;3(7):498–508.
- Sollner T, Bennett MK, Whiteheart SW, et al. A protein assembly-disassembly pathway in vitro that may correspond to sequential steps of synaptic vesicle docking, activation, and fusion. Cell. 1993;75(3):409–418.
- Sollner TH. Regulated exocytosis and SNARE function (review). Mol Membr Biol. 2003;20(3):209–220.
- Suedhof TC. Neurotransmitter release: the last millisecond in the life of a synaptic vesicle. Neuron. 2013;80(3):675–690.
- Augustin I, Rosenmund C, Sudhof TC, et al. Munc13-1 is essential for fusion competence of glutamatergic synaptic vesicles. Nature. 1999;400(6743):457–461.
- Ma C, Li W, Xu Y, et al. Munc13 mediates the transition from the closed syntaxin-Munc18 complex to the SNARE complex. Nat Struct Mol Biol. 2011;18(5):542–U206.
- Rosenmund C, Stevens CF. Definition of the readily releasable pool of vesicles at hippocampal synapses. Neuron. 1996;16(6):1197–1207.
- Horrigan FT, Bookman RJ. Releasble pools and the kinetics of exocytosis in adrenal chromaffin cells. Neuron. 1994;13(5):1119–1129.
- Schneggenburger R, Sakaba T, Neher E., et al. Vesicle pools and short-term synaptic depression: lessons from a large synapse. Trends Neurosci. 2002;25(4):206–212.
- Jung JH, Szule JA, Marshall RM, et al. Variable priming of a docked synaptic vesicle. Proc Natl Acad Sci U S A. 2016;113(8):E1098–E1107.
- Neher E, Brose N. Dynamically primed synaptic vesicle states: key to understand synaptic short-term plasticity. Neuron. 2018;100(6):1283–1291.
- Lee JS, Ho W-K, Neher E, et al. Superpriming of synaptic vesicles after their recruitment to the readily releasable pool. Proc Natl Acad Sci U S A. 2013;110(37):15079–15084.
- Taschenberger H, Woehler A, Neher E., et al. Superpriming of synaptic vesicles as a common basis for intersynapse variability and modulation of synaptic strength. Proc Natl Acad Sci U S A. 2016;113(31):E4548–E4557.
- Ortega JM, Genc O, Davis GW., et al. Molecular mechanisms that stabilize short term synaptic plasticity during presynaptic homeostatic plasticity. Elife. 2018;7:e40385.
- Xue R, Ruhl DA, Briguglio JS, et al. Doc2-mediated superpriming supports synaptic augmentation. Proc Natl Acad Sci U S A. 2018;115(24):E5605–E5613.
- Betz A, Ashery U, Rickmann M, et al. Munc13-1 is a presynaptic phorbol ester receptor that enhances neurotransmitter release. Neuron. 1998;21(1):123–136.
- Rhee JS, Betz A, Pyott S, et al. beta phorbol ester- and diacylglycerol-induced augmentation of transmitter release is mediated by Munc13s and not by PKCs. Cell. 2002;108(1):121–133.
- Gillis KD, Mossner R, Neher E., et al. Protein kinase C enhances exocytosis from chromaffin cells by increasing the size of the readily releasable pool of secretory granules. Neuron. 1996;16(6):1209–1220.
- Stevens CF, Sullivan JM. Regulation of the readily releasable vesicle pool by protein kinase C. Neuron. 1998;21(4):885–893.
- Palfreyman MT, Jorgensen EM. Unc13 aligns SNAREs and superprimes synaptic vesicles. Neuron. 2017;95(3):473–475.
- Reddy-Alla S, Boehme MA, Reynolds E, et al. Stable positioning of Unc13 restricts synaptic vesicle fusion to defined release sites to promote synchronous neurotransmission. Neuron. 2017;95(6):1350-+.
- Ishiyama S, Schmidt H, Cooper BH, et al. Munc13-3 superprimes synaptic vesicles at granule cell-to-basket cell synapses in the mouse cerebellum. J Neurosci. 2014;34(44):14687–14696.
- Rao TC, Rodriguez ZS, Bradberry MM, et al. Synaptotagmin isoforms confer distinct activation kinetics and dynamics to chromaffin cell granules. J Gen Physiol. 2017;149(8):763–780.
- Wightman RM, Jankowski JA, Kennedy RT, et al. Temporally resolved catecholamine spikes correspond to single vesicle release from individual chromaffin cells. Proc Natl Acad Sci U S A. 1991;88(23):10754–10758.
- Jackson MB, Hsiao Y-T, Chang C-W., et al. Fusion pore expansion and contraction during catecholamine release from endocrine cells. Biophys J. 2020;119(1):219–231.
- Westerink RHS, Ewing AG. The PC12 cell as model for neurosecretion. Acta Physiol. 2008;192(2):273–285.
- Westerink RHS, de Groot A, Vijverberg HPM., et al. Heterogeneity of catecholamine-containing vesicles in PC12 cells. Biochem Biophys Res Commun. 2000;270(2):625–630.
- van Kempen Gth, vanderLeest HT, van Den Berg Rj, et al. Three distinct modes of exocytosis revealed by amperometry in neuroendocrine cells. Biophys J. 2011;100(4):968–977.
- Graham ME, O’Callaghan DW, McMahon HT, et al. Dynamin-dependent and dynamin-independent processes contribute to the regulation of single vesicle release kinetics and quantal size. Proc Natl Acad Sci U S A. 2002;99(10):7124–7129.
- Tischler AS, Perlman RL, Morse GM, et al. Glucocorticoids increase catecholamine synthesis and storage in PC12 pheochromocytoma cell-cultures. J Neurochem. 1983;40(2):364–370.
- Xue R, Zhao Y, Su L, et al. PKC epsilon facilitates recovery of exocytosis after an exhausting stimulation. Pflugers Arch. 2009;458(6):1137–1149.
- Machado DJ, Montesinos MS, Borges R., et al. Good practices in single-cell amperometry. In: Ivanov, AI. Exocytosis and Endocytosis. Vol 440. Methods in molecular biology . Clifton (NJ): Humana Press; 2008. p. 297–313.
- Cahill PS, Walker QD, Finnegan JM, et al. Microelectrodes for the measurement of catecholamines in biological systems. Anal Chem. 1996;68(18):3180–3186.
- Wang CT, Grishanin R, Earles CA, et al. Synaptotagmin modulation of fusion pore kinetics in regulated exocytosis of dense-core vesicles. Science. 2001;294(5544):1111–1115.
- Mosharov EV, Sulzer D. Analysis of exocytotic events recorded by amperometry. Nat Methods. 2005;2(9):651–658.
- Graham ME, Fisher RJ, Burgoyne RD., et al. Measurement of exocytosis by amperometry in adrenal chromaffin cells: effects of clostridial neurotoxins and activation of protein kinase C on fusion pore kinetics. Biochimie. 2000;82(5):469–479.
- Xue R, Zhao Y, Chen P., et al. Involvement of PKC alpha in PMA-induced facilitation of exocytosis and vesicle fusion in PC12 cells. Biochem Biophys Res Commun. 2009;380(2):371–376.
- Zhang E, Xue R, Soo J, et al. Effects of phorbol ester on vesicle dynamics as revealed by total internal reflection fluorescence microscopy. Pflugers Arch. 2008;457(1):211–222.
- Clark RA, Ewing AG. Quantitative measurements of released amines from individual exocytosis events. Mol Neurobiol. 1997;15(1):1–16.
- Zhang J, Xue R, Ong W-Y, et al. Roles of cholesterol in vesicle fusion and motion. Biophys J. 2009;97(5):1371–1380.
- Toullec D, Pianetti P, Coste H, et al. The bisindolylmaleimide GF-109203X is a potent and selective inhibitor of Protein-Kinase-C. J Biol Chem. 1991;266(24):15771–15781.
- Li P, Bademosi AT, Luo J, et al. Actin remodeling in regulated exocytosis: toward a mesoscopic view. Trends Cell Biol. 2018;28(9):685–697.
- Ridley AJ. Rho GTPases and actin dynamics in membrane protrusions and vesicle trafficking. Trends Cell Biol. 2006;16(10):522–529.
- Doussau F, Gasman S, Humeau Y, et al. A rho-related GTPase is involved in Ca2+-dependent neurotransmitter exocytosis. J Biol Chem. 2000;275(11):7764–7770.
- Gasman S, Chasserot-Golaz S, Popoff MR, et al. Involvement of Rho GTPases in calcium-regulated exocytosis from adrenal chromaffin cells. J Cell Sci. 1999;112(24):4763–4771.
- Liscovitch M, Cantley LC. LIPID 2ND MESSENGERS. Cell. 1994;77(3):329–334.
- Caumont AS, Galas MC, Vitale N, et al. Regulated exocytosis in chromaffin cells - translocation of ARF6 stlmulates a plasma membrane-associated phospholipase D. J Biol Chem. 1998;273(3):1373–1379.
- Choi WS, Kim YM, Combs C, et al. Phospholipases D1 and D2 regulate different phases of exocytosis in mast cells. J Immunol. 2002;168(11):5682–5689.
- Heinemann C, Chow RH, Neher E, et al. KINETICS OF THE SECRETORY RESPONSE IN BOVINE CHROMAFFIN CELLS FOLLOWING FLASH-PHOTOLYSIS OF CAGED CA2+. Biophys J. 1994;67(6):2546–2557.
- Xu T, Binz T, Niemann H, et al. Multiple kinetic components of exocytosis distinguished by neurotoxin sensitivity. Nat Neurosci. 1998;1(3):192–200.
- Rizzoli SO, Betz WJ. Synaptic vesicle pools. Nat Rev Neurosci. 2005;6(1):57–69.
- An S, Zenisek D. Regulation of exocytosis in neurons and neuroendocrine cells. Curr Opin Neurobiol. 2004;14(5):522–530.