
Abstract
Objective
Driving under the influence of alcohol or drugs is one of the main contributing causes of serious road traffic crashes (RTCs). This study aimed to investigate the involvement of alcohol and drugs in driver fatalities in Norway during 2011–2020 and compare the findings with data from the previous decade.
Methods
We linked the results of forensic toxicology testing for alcohol and the 17 most commonly used drugs assigned with legal limits with data on fatal road traffic crashes obtained from Statistics Norway and the Norwegian Public Roads Administration.
Results
The number of fatalities had decreased significantly since the previous decade, while the proportion of drivers and riders tested for alcohol and drug use increased. Blood alcohol concentrations at the legal limit or higher were found in 14.4% and psychoactive drugs were detected in 15.8% of the cases; 10.7% tested positive for illicit drugs, and 10.1% for medicinal drugs. The most prevalent illicit drugs were tetrahydrocannabinol (7.9%) and amphetamine/methamphetamine (4.7%), whereas the most prevalent medicinal drugs were clonazepam (3.7%) and diazepam (2.2%).
Conclusions
There was a marked reduction in the number of motor vehicle drivers killed in RTCs compared with the previous decade, and also a reduction in the prevalence of alcohol. For other substances, there were no marked changes in the prevalence.
Introduction
Road traffic injuries are estimated to be the 8th leading cause of death globally (World Health Organization Citation2018). In Norway, the number of road users killed in road traffic crashes (RTCs) reached a maximum in 1970 with 560 fatalities (144 per million population). The Norwegian government has over many decades introduced several preventive measures to reduce the number of serious RTCs, and a “Vision Zero” strategy for road safety was introduced in 2001 based on a model implemented in Sweden in 1997 (Elvebakk and Steiro Citation2009). The aim of “Vision Zero” is to work toward a future, in which no one will be killed or seriously injured in RTCs, by introducing several specific traffic safety measures.
Impairment by alcohol or drugs is one of the most common contributing causes of RTCs (Ringen Citation2021; World Health Organization Citation2021). Therefore, measures to reduce the incidence of driving under the influence (DUI) of alcohol or drugs have been introduced. The legal blood alcohol concentration limit was reduced in Norway from 0.05% to 0.02% in 2001, and legal limits for 20 drugs were introduced in 2012 (Vindenes et al. Citation2012) and for eight more drugs in 2016 (Vindenes et al. 2015). Random roadside breath alcohol testing was implemented in 1981. Testing of oral fluid for the presence of drugs started in 2016; at present, Dräger DrugWipe 5000 (Drägerwerk AG & Co., Lübeck, Germany) and DrugWipe with the WipeAlyser device (Securetec Detektions-Systeme AG, Neubiberg, Germany) are used for his purpose. Furthermore, regulations on the daily permissible prescription dose of medicinal drugs that may reduce the ability to drive safely have been introduced (Directorate of Health Citation2011). The police also received better training to detect signs and symptoms of drug use and impairment, and license plate recognition systems were taken into use to detect drivers with previous convictions for DUI, other violations of the road traffic act, or violations of the legislation on illicit drugs.
In 2021, the number of road traffic fatalities in Norway had declined to 15 per million inhabitants (80 fatalities), which is lower than the European Union’s average of 42 per million (European Transport Safety Council Citation2021). The current aim is to further reduce the number of road traffic deaths to a maximum of 50 fatalities in 2030 and none in 2050 (Ministry of Transport Citation2021).
Continued surveillance and investigation of the impact of alcohol and drugs on RTCs is an important contribution toward achieving “Vision Zero.” Data on alcohol and drug findings in blood samples from drivers killed in RTCs in Norway during 2001–2010 have been published earlier (Christophersen and Gjerde Citation2014, Citation2015). Here we present the results of a new investigation of drivers killed in RTCs during 2011–2020, and we compare our findings with numbers from 2001–2010 to determine whether there had been any marked changes over time.
Methods
Data sources
Information about fatal crashes was obtained from the Road Traffic Crash Registry (Statistics Norway, Kongsvinger, Norway) and the Crash Investigation Team Database (Public Roads Administration, Oslo, Norway). Drivers who lost their lives in RTCs, or who died within 30 days after the crash, were defined as killed in RTCs. The collected data included the date and time of the crash, the county where the crash took place, the age, and sex of the killed drivers, and vehicle type. In addition, information about likely alcohol or drug impairment based on witness reports was recorded, and detailed data on alcohol and drug findings in blood samples were obtained from the Norwegian forensic toxicology databases. Information about crash responsibility was not available. Cyclists and pedestrians were not included in this study.
Alcohol and drug testing
The blood samples for alcohol and drug testing were taken shortly after the crash or during medical or legal autopsy. The samples were analyzed for alcohol and drugs either at the Department of Forensic Sciences at Oslo University Hospital (Oslo, Norway) or at the Department of Clinical Pharmacology at St. Olav University Hospital (Trondheim, Norway). Alcohol was analyzed by an enzymatic method or by head-space gas chromatography (HS-GC). Drug screening was performed by high-performance liquid chromatography with mass spectrometric detection (LC-MS). Confirmation and quantification of drugs were performed with LC-MS or GC-MS methods. Both laboratories are accredited by the Norwegian body for the accreditation of laboratories (Norwegian Accreditation, Lillestrøm, Norway) and participate in international interlaboratory comparisons and proficiency testing programs. Test results were recorded in the two laboratories’ toxicology databases.
In this study, we have included findings of alcohol and the 17 most commonly used drugs that have been assigned with legislative limits (see online supplement Table A1). To enable comparison with the previous study (2001–2010), we regarded alcohol and drug concentrations at or above the legal limits implemented in 2012 as positive (Vindenes et al. Citation2012). The legal limits are fairly low and often not associated with clinical impairment. When assessing alcohol and drug concentrations associated with likely impairment, we used the medium sanction limits corresponding to driving with a blood alcohol concentration (BAC) above 0.05% (Ministry of Transport Citation2022).
Table 1. Prevalence (numbers in brackets) of alcohol and drug groups in concentrations at or above the legal limits for drivers killed in road traffic crashes in Norway during 2011–2020.
The weekend was defined as the period from Friday at 16:00 to Monday at 3:59.
Data analysis
The results for the period 2011–2020 were compared with anonymized data from the studies of drivers of cars and vans and riders of motorcycles and mopeds who were killed in RTCs during 2001–2010 (Christophersen and Gjerde Citation2014, Citation2015). Pearson’s Chi-Square test for categorical data was used to compare data. No comparable data were available for drivers of other types of motor vehicles during 2001–2010.
Linking of databases
Data from the two toxicology databases was linked with the Road Traffic Accident Registry using the Norwegian National Identity Number, and with the Crash Investigation Team Database using data on date, time, county, age, sex, and vehicle type. Information that could identify the included motor vehicle drivers and riders (directly or backward) was deleted. Cases, where unique linking could not be performed, were excluded. Due to the small number of cases, the data were aggregated into three vehicle type groups: cars and vans, motorcycles and mopeds, and others.
Ethical approval
The study was approved by the Regional Committee for Medical and Health Research Ethics (approval number 2010/2191), the Higher Prosecution Authority of Norway, and the Council for Confidentiality and Research of the Norwegian Ministry of Justice. Drivers and riders were deleted from the database if they were registered in the Norwegian Registry of Withdrawal from Biological Research Consent or in the Registry of Autopsy Material Research Refusal.
Results
Participants
In total, 863 motor vehicle drivers and riders were killed in RTCs between 2011 and 2020. The majority were drivers of cars or vans (n = 585) followed by motorcycles or mopeds (n = 190), heavy vehicles (n = 51), ATVs or snowmobiles (n = 17), buses or minibuses (n = 7), agricultural tractors (n = 7) and other vehicles (n = 6). Results of toxicological analyses were available for 645 drivers (75%). In most of the remaining cases, blood samples were not collected for alcohol and drug testing. In a few cases, personal identification data were missing or incorrectly recorded making the linkage between databases impossible.
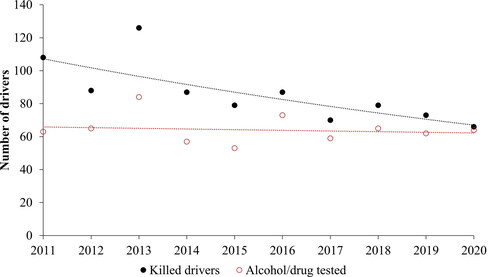
The annual number of fatally injured motor vehicle drivers and riders declined during the study period, whereas the number of drivers and riders who were tested for alcohol or drugs by analyzing blood samples was fairly constant at about 60 cases (). The proportion that was analyzed for alcohol and drugs increased from 58% (63 out of 108) in 2011 to 97% (64 out of 66) in 2020.
Figure 1. Annual numbers of motor vehicle drivers killed in road traffic crashes and numbers analyzed for alcohol and drugs in blood with regression lines.
Toxicological findings
About 5% of the 645 samples that had been analyzed were only investigated for alcohol; the other samples were analyzed systematically for drugs in addition to alcohol. The toxicological findings are presented in , and with details for individual substances in Table A2 (see online supplement). In , drug detections are further separated into “any illicit drug” and “any medicinal drug,” and the most frequently detected illicit drugs, which are THC and amphetamines.
Table 2. Prevalence (numbers in brackets) of alcohol and drug concentrations indicating impairment and witness reports indicating impairment for non-tested drivers.
The most commonly detected substances in blood were alcohol (14.4%), tetrahydrocannabinol (THC) (7.9%), amphetamines (amphetamine or methamphetamine) (4.7%), and benzodiazepines and z-hypnotics (8.7%), of which clonazepam was most prevalent (3.7%). In total, illicit drugs were found in 10.7% and psychoactive medicinal drugs in 10.1% of the samples. Of all fatalities, car and van drivers tested positive for alcohol more often than motorcycle and moped riders, whereas motorcycle and moped drivers more often tested positive for illicit drugs.
Of those who tested positive for alcohol or drugs, a third tested positive for two or more substances. Therefore, the sum of single substance detections is larger than the number of drivers testing positive for any substance (alcohol or drugs). The proportion of polysubstance use was highest among those who tested positive for amphetamines (80.0%) followed by those who tested positive for THC (66.7%) and medicinal drugs (56.3%), and lowest among those who tested positive for alcohol (24.3%).
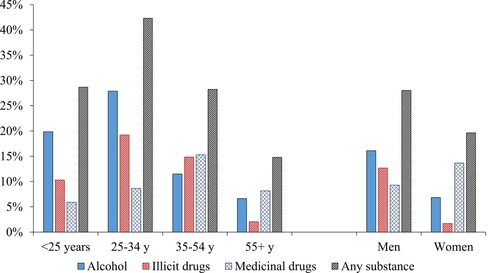
The prevalence (%) of alcohol, illicit drugs, and medicinal drugs across age groups and sexes among motor vehicle drivers killed in RTCs is presented in . The term “tested positive for any substance” means having a positive test result for alcohol, drugs, or both. The prevalence of alcohol and illicit drugs was highest among those aged 25–34 years, whereas the prevalence of medicinal drugs was highest among those aged 35–54 years. Men were more likely to test positive for alcohol and illicit drugs, whereas women were more likely to test positive for medicinal drugs.
Figure 2. Proportion (%) of drivers killed in road traffic crashes (n = 645) who tested positive for alcohol, illicit drugs, medicinal drugs, and any substance, across age groups, and sexes.
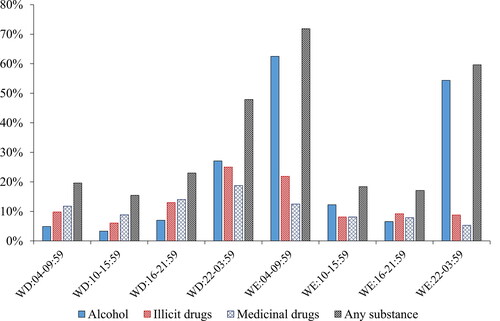
The prevalence of alcohol and drugs across the week is presented in . The results show that the prevalence of alcohol was highest in samples from drivers killed in crashes during weekend nights and mornings, whereas the prevalence of illicit and medicinal drugs was highest in samples from those killed during weekday nights.
Figure 3. Proportion (%) of drivers killed in road traffic crashes (n = 645) who tested positive for alcohol, illicit drugs, medicinal drugs, and any substance, across time intervals. WD = weekdays; WE = weekends.
Likely impairment
Drivers with BACs above 0.05%, and those with equivalent levels of drugs (see online supplement Table A1), were regarded as likely impaired. For some drivers who were not subject to toxicological investigation in blood, witness reports indicated alcohol or drug impairment. The prevalence of likely impairment (either based on the toxicological testing of blood samples or witness reports) is presented in for different groups of drivers; it was highest among drivers of cars and vans.
Comparison of results for the periods 2001–2010 and 2011–2020
Alcohol and drug findings in blood samples from the fatally injured car and van drivers and motorcycle and moped riders in total is presented in . The prevalence of alcohol was significantly lower in the period 2011–2020 as compared with the period 2001–2010. The total prevalence of any illicit and any medicinal drug was about the same in both periods; however, the prevalence of amphetamines among drivers killed in the period 2011–2020 was significantly lower than in the previous period. Separate test results for drivers and riders are not presented in the table, but are summarized below.
Table 3. Prevalence (numbers in brackets) of alcohol and drug groups in concentrations at or above the legal limits in blood samples from the car and van drivers and motorcycle and moped riders killed in road traffic crashes, in total, for the periods 2001–2010 and 2011–2020.
The number of car and van driver fatalities declined by 46% from the period 2001–2010 to the period 2011–2020 (from 1,077 to 585 drivers), whereas the number of motorcycle and moped rider fatalities declined by 42% (from 328 to 190). The prevalence of positive test results for alcohol or drugs declined from 40.2% to 28.5% (p < 0.001) among car/van drivers, and from 27.1% to 22.6% (p = 0.36; not significant) among motorcycle/moped riders. The prevalence of alcohol decreased from 25.3% to 16.0% (p < 0.001), and from 17.4% to 8.8% (p = 0.02) among car/van drivers and motorcycle/moped riders, respectively.
Official statistics in Norway, and several other countries, present alcohol and drug findings as a percent of the total number of fatalities, not as a percent of those investigated. When calculated as a percent of the total number of driver fatalities, the prevalence of alcohol declined from 14.7% to 10.8% (p < 0.02; result not shown). The prevalence of amphetamines was not significantly lower in 2011–2020 when calculated that way.
Discussion
Alcohol was the most commonly detected psychoactive substance in line with findings in the Norwegian studies of drivers killed in RTCs during 2001–2010 (Christophersen and Gjerde Citation2014, Citation2015). The prevalence of alcohol was highest among those killed during weekend nights and mornings, while drugs were more prevalent on weekday nights. Alcohol and illicit drugs were most prevalent among males aged 25–34.
Of illicit drugs, THC was most often detected, followed by amphetamines, whereas cocaine and MDMA were rarely detected. Among medicinal drugs, benzodiazepines or z-hypnotics were more often detected than opioids. These findings reflect the pattern of drug use among drivers arrested for DUI of drugs (Valen et al. Citation2017b).
When combining results from the toxicological testing with witness reports, about one-fifth of the motor vehicle drivers killed in RTCs were likely impaired. The proportions of detected alcohol or drugs, as well as probable impairment, were highest among killed car and van drivers. Riders of motorcycles and mopeds have, in general, a larger crash risk than drivers of cars and vans, even when sober (Keall and Newstead Citation2012). This may explain why a larger proportion of fatally injured motorcycle and moped riders tested negative for alcohol or drugs compared to car and van drivers.
Changes since 2001–2010
There was a marked reduction in the number of motor vehicle drivers killed in RTCs in the period 2011–2020 compared with the previous decade. The number of drivers and riders who tested positive for alcohol or drugs also declined. The decline is presumably a result of continuous improvement in road safety in line with the “Vision Zero” approach.
The proportion of drivers that were tested for alcohol and drugs by analysis of blood samples increased from 63% for both car/van drivers and motorcycle/moped riders in 2001–2010 to 77% and 72% for car/van drivers and motorcycle/moped riders, respectively. We consider it likely that the numbers of alcohol and drug users are underestimated, as some drivers and riders who were not subject to a toxicological investigation may have used alcohol and/or drugs.
There was a statistically significant reduction in the prevalence of alcohol, both when calculated as a percent of all driver and rider fatalities, and as a percent of those investigated for alcohol use.
There was no significant change in the total prevalence of medicinal or illicit drugs. For the use of cannabis, there was an increase in prevalence that was not statistically significant. There has likely been an increase in cannabis use among some groups of people in Norway during the last decades. A recent study found that the reported use of cannabis during the past year has increased among adolescents (aged about 13–19 years) over the last decade and was 9.6% among boys and 5.5% among girls in 2017–2019 (Heradstveit et al. Citation2021), but this might not be relevant information as few of the adolescents drive motor vehicles. Also, the number of drivers arrested for DUI of cannabis more than doubled between 2000 and 2015 (Valen et al. Citation2017a). The reasons for the latter increase may not only be an increased use of cannabis, but also improvements in detecting cannabis-using drivers by the police, such as the implementation of oral fluid drug testing, more frequent examination of signs and symptoms of drug use, and the use of license plate recognition technology. On the other hand, surveys have not indicated any increased use of cannabis among Norwegian adults aged 15–64 years during the last two decades; in 2004, 4.6% of adults reported using cannabis in the past 12 months (EMCDDA Citation2010), whereas in 2020, 4.3% reported the same (EMCDDA Citation2022). Neither did roadside surveys performed in 2016–2017 detect any increased use among drivers in random road traffic when compared with a study performed in 2008–2009 (Furuhaugen et al. Citation2018). Thus, the trend in cannabis use among drivers is unclear; one hypothesis is that there has been an increase among problem drug users and risk-taking drivers, but not among the general driving population.
There was a statistically significant reduction in the prevalence of amphetamine in the car and van driver and motorcycle and moped rider fatalities in total when calculated as a percent of those investigated for drug use, but not when calculated as a percent of all killed drivers and riders. The trend is therefore unclear. Among drivers apprehended for DUI in Norway during the same periods, the proportion that tested positive for amphetamines was 38% in the period 2001–2010 and 36% in 2011–2020 according to the toxicology statistics for DUI suspects from Oslo University Hospital, although the total number of apprehended drivers increased (H. Gjerde, unpublished data). The decrease in amphetamine detections among killed drivers and riders thus does not correspond to the observed trend in drug-driving arrests.
In this study, only motor vehicle drivers who were fatally injured were included. A previous study of alcohol and drugs in blood samples from all types of road users involved in fatal crashes from 2016 to 2018 used police data (Pasnin and Gjerde Citation2021). That study found a high prevalence of alcohol and drugs in blood samples from bicyclists and pedestrians, in addition to motor vehicle drivers who were killed in RTCs, and a low prevalence among drivers surviving fatal crashes. Those data indicate that alcohol and drug impairment is not only a road traffic safety problem among motor vehicle drivers, but also among bicyclists and pedestrians. This should be borne in mind when planning future preventive measures.
In conclusion, there was a marked reduction in the number of motor vehicle drivers killed in RTCs from 2011 to 2020 compared with the period from 2001 to 2020. Alcohol was the most frequently detected substance, but the prevalence of alcohol was lower than in the previous decade. There were no significant changes in the prevalence of other substance groups.
Limitations
A selection bias was probably introduced when the police decided which drivers to examine for alcohol or drug use. As a result, the analytical test results may not accurately reflect the number of killed drivers who had used alcohol or drugs, nor the prevalence. More accurate data on alcohol and drug use may be expected in the future due to a change in the legislation in 2020; from that year all killed road users should undergo a forensic autopsy, which routinely includes toxicological analyses of alcohol and drugs (Ministry of Health and Care Services Citation2020).
The legislative limits for DUI of drugs have changed over time; some limits have been revised, and limits for more drugs were introduced in 2016. For consistency, we have used the limits introduced in 2012, and regarded concentrations equal to or greater than the legal limits as positive alcohol or drug findings.
The degree of impairment is not only related to the blood concentration of psychoactive substances in itself, but also to the user’s tolerance and drug use pattern. In addition, alcohol and drug concentrations in postmortem blood samples may not accurately reflect the concentrations at the time of the crash. Moreover, witness statements on signs of impairment are subjective and should be viewed with caution.
Some drugs that may impair the ability to drive safely were not included in this study. This includes gamma-hydroxybutyrate, hallucinogens, tramadol, oxycodone, various antidepressants and antipsychotics, and new psychoactive substances. In cases where morphine or diazepam was known or suspected to have been given to injured drivers or riders as part of acute medical treatment, positive test results for those drugs were deleted. Thus, the presented results do not completely reflect the use of all psychoactive substances.
Supplemental Material
Download Zip (19.6 KB)Acknowledgments
We would like to thank Terje Hammer for extracting data from the Forensic Toxicology Database and Anja Valen for participating in the coupling of data.
Disclosure statement
The authors have no conflicts of interest to declare.
Data availability statement
We do not have permission to share research data.
Additional information
Funding
References
- Christophersen AS, Gjerde H. 2014. Prevalence of alcohol and drugs among car and van drivers killed in road accidents in Norway: an overview from 2001–2010. Traffic Inj Prev. 15(6):523–531. doi:10.1080/15389588.2013.848981.
- Christophersen AS, Gjerde H. 2015. Prevalence of alcohol and drugs among motorcycle riders killed in road crashes in Norway during 2001–2010. Accid Anal Prev. 80:236–242. doi:10.1016/j.aap.2015.04.017.
- Directorate of Health. 2011. Retningslinjer for fylkesmennene ved behandling av førerkortsaker (IS-1348) [Guidelines for county governors when assessing driver’s license cases]. Oslo, Norway: Norwegian Directorate of Health.
- Elvebakk B, Steiro T. 2009. First principles, second hand: perceptions and interpretations of vision zero in Norway. Safety Sci. 47(7):958–966. doi:10.1016/j.ssci.2008.10.005.
- EMCDDA. 2010. Statistical Bulletin 2010. Lisbon, Portugal: European Monitoring Centre for Drugs and Drug Addiction [accessed 2023 January 21]. https://www.emcdda.europa.eu/stats10.
- EMCDDA. 2022. Statistical Bulletin 2022. Lisbon, Portugal: European Monitoring Centre for Drugs and Drug Addiction [accessed 2023 January 21]. https://www.emcdda.europa.eu/data/stats2022.
- European Transport Safety Council. 2021. Ranking EU Progress on Road Safety - 15th Road Safety Performance Index Report. Brussels, Belgium: European Transport Safety Council [accessed 2023 January 21]. https://etsc.eu/wp-content/uploads/15-PIN-annual-report-FINAL.pdf.
- Furuhaugen H, Jamt REG, Nilsson G, Vindenes V, Gjerde H. 2018. Roadside survey of alcohol and drug use among Norwegian drivers in 2016–2017: a follow-up of the 2008–2009 survey. Traffic Inj Prev. 19(6):555–562. doi:10.1080/15389588.2018.1478087.
- Heradstveit O, Nilsen SA, Breivik K, Bakken A, Haug T, Hartveit K, Stormark KM. 2021. Past year cannabis use among Norwegian adolescents: time trends based on the Ungdata surveys 2010–2019. Front Psychiatry. 12(627479):627479. doi:10.3389/fpsyt.2021.627479.
- Keall MD, Newstead S. 2012. Analysis of factors that increase motorcycle rider risk compared to car driver risk. Accid Anal Prev. 49:23–29. doi:10.1016/j.aap.2011.07.001.
- Ministry of Health and Care Services. 2020. Lov om endringer i obduksjonsloven mv. (rettsmedisinsk obduksjon av drepte i veitrafikken og regulering av Statens vegvesens arbeid med ulykkesanalyser) [Revision of the Autosy Law (Legal autopsy of killed road users and regulation of the Public Roads Administration’s analysis of road traffic crashes)]. Oslo, Norway: Ministry of Health and Care Services [accessed 2023 January 21]. https://lovdata.no/LTI/lov/2020-03-06-2.
- Ministry of Transport. 2021. Nasjonal transportplan 2022–2033. Meld. St. 20 [National transport plan 2022–2033. White paper]. Oslo, Norway: Ministry of Transport [accessed 2023 January 21]. https://tinyurl.com/ntplan2022.
- Ministry of Transport. 2022. Forskrift om endring i forskrift om faste grenser for påvirkning av andre berusende eller bedøvende middel enn alkohol m.m. (forskrift om faste grenser) (FOR-2022-01-24-119) [Revision of the Regulations on Fixed Legal Limits for Impairment by Intoxicating Substances Other than Alcohol] Oslo, Norway: Ministry of Transport [accessed 2023 January 21]. https://lovdata.no/dokument/LTI/forskrift/2022-01-24-119.
- Pasnin LT, Gjerde H. 2021. Alcohol and drug use among road users involved in fatal crashes in Norway. Traffic Inj Prev. 22(4):267–271. doi:10.1080/15389588.2021.1887854.
- Ringen S, Jr. 2021. Dybdeanalyser av dødsulykker i vegtrafikken 2020 [In-depth analysis of fatal road traffic crashes 2020 - Report no. 725]. Oslo, Norway: Norwegian Public Roads Adminstration [accessed 2023 January 21]. https://www.vegvesen.no/globalassets/fag/fokusomrader/trafikksikkerhet/ulykkesdata/dybdeanalyser-av-dodsulykker-i-vegtrafikken-2020.pdf.
- Valen A, Bogstrand ST, Vindenes V, Gjerde H. 2017a. Increasing use of cannabis among arrested drivers in Norway. Traffic Inj Prev. 18(8):801–806. doi:10.1080/15389588.2017.1321114.
- Valen A, Bogstrand ST, Vindenes V, Gjerde H. 2017b. Toxicological findings in suspected drug-impaired drivers in Norway - Trends during 1990–2015. Forensic Sci Int. 280:15–24. doi:10.1016/j.forsciint.2017.09.010.
- Vindenes V, Aamo T, Innerdal C, et al. 2015. Revidering av "forskrift om faste grenser for påvirkning av andre berusende eller bedøvende middel enn alkohol m.m." – Vurdering av eksisterende faste grenser og forslag til faste grenser for flere stoffer [Revision of "Regulations on Fixed Limits for Impairment by Other Intoxicating or Anaesthetic/Sedative Substances than Alcohol etc." – Assessment of Existing Fixed Limits and Proposed Fixed Limits for Additional Substances]. Oslo, Norway: Ministry of Transport and Communications [accessed 2023 January 21]. https://tinyurl.com/legallimits2015.
- Vindenes V, Jordbru D, Knapskog A-B, Kvan E, Mathisrud G, Slørdal L, Mørland J. 2012. Impairment based legislative limits for driving under the influence of non-alcohol drugs in Norway. Forensic Sci Int. 219(1–3):1–11. doi:10.1016/j.forsciint.2011.11.004.
- World Health Organization. 2018. Global Status Report on Road Safety 2018. Geneva, Switzerland: World Health Organization [accessed 2023 January 21]. https://www.who.int/violence_injury_prevention/road_safety_status/2018/en/.
- World Health Organization. 2021. Road traffic injuries. Geneva, Switzerland: World Health Organization [accessed 2023 January 21]. https://www.who.int/news-room/fact-sheets/detail/road-traffic-injuries.