
ABSTRACT
RNA half-life is closely related to its cellular physiological function, so stability determinants may have regulatory functions. Micro(mi)RNAs have primarily been studied with respect to post-transcriptional mRNA regulation and target degradation. Here we study the impact of the tumour suppressive melanoma miRNA miR-211 on transcriptome stability and phenotype in the non-pigmented melanoma cell line, A375. Using 5ʹ-bromouridine IP chase (BRIC)-seq, transcriptome-wide RNA stability profiles revealed highly regulated genes and pathways important in this melanoma cell line. By combining BRIC-seq, RNA-seq and in silico predictions, we identified both existing and novel direct miR-211 targets. We validated DUSP3 as one such novel miR-211 target, which itself sustains colony formation and invasion in A375 cells via MAPK/PI3K signalling. miRNAs have the capacity to control RNA turnover as a gene expression mechanism, and RNA stability profiling is an excellent tool for interrogating functionally relevant gene regulatory pathways and miRNA targets when combined with other high-throughput and in silico approaches.
Introduction
Melanoma is the commonest cause of skin cancer-related deaths, with an estimated 90,000 diagnoses and 10,000 deaths in the US in 2018 [Citation1]. The high mortality associated with melanoma is due to its intrinsic aggressiveness, metastatic potential, and resistance to conventional therapies [Citation2]. There is a pressing need to better understand the abnormal biological processes contributing to melanoma development, metastasis, and resistance to develop new biomarkers and therapies.
Whole transcriptome sequencing (RNA-seq) is now a standard method to interpret the cellular state during disease development and progression. However, RNA-seq represents a static image of the process of transcription, while biological processes are by their very nature dynamic. Recent studies on transcriptome dynamics have shown that transcript stability is correlated with function [Citation3–Citation6]. For instance, transcription factor mRNAs have high average decay rates [Citation6] and mRNA turnover correlates with signalling pathways active in cancer, suggesting a post-transcriptional component to oncogenesis [Citation7]. Hence, understanding transcriptional dynamics is important for understanding disease pathogenesis including in cancer.
mRNA decay studies have traditionally been dominated by the use of transcriptional inhibitors such as actinomycin D [Citation4,Citation8] or α-amanitin [Citation3,Citation9] to arrest transcription. mRNA concentrations are then quantified at progressive time points after transcriptional arrest. However, these transcriptional inhibitors stress cells and themselves alter transcript localization, stability, and cellular proliferation, introducing unintended and confounding variables [Citation10,Citation11]. More recent metabolic nucleotide labelling techniques such as with 5-bromouridine [Citation10,Citation12], 4-thiouridine [Citation3,Citation10], or 5-ethynyluridine [Citation13] have overcome these limitations by providing a direct read-out of transcript decay. Here we exploit the recently described 5ʹ-bromouridine IP chase (BRIC)-seq assay [Citation10,Citation12], in which the nucleotides of newly synthesized transcripts are labelled with 5'-bromouridine (BrU), to study transcriptomic stability in melanoma cells. Coupling BrU labelling with RNA-seq quantifies global RNA (mRNAs and long non-coding (lncRNAs)) stability over time without unduly perturbing the cellular environment [Citation10,Citation12,Citation14].
MicroRNAs (miRNAs) are a class of single-stranded short noncoding RNA, typically 22 nucleotides long in the mature form [Citation15]. miRNAs are well-known post-transcriptional regulators in both development and disease [Citation16,Citation17]. miRNAs tend to repress gene expression by binding to miRNA-specific sites in the 3ʹ UTR of the target mRNA in conjugation with the AGO protein-containing RNA-induced silencing complex (RISC) [Citation18]. Altered regulation of miRNAs or their targets is common in cancers, with miRNA dysregulation shown to have both oncogenic and tumour suppressive roles [Citation17,Citation19]. Further, miRNA targets tend to have shorter half-lives [Citation5], so miRNAs have a direct impact on steady-state transcript levels and ultimately protein activity. Thus, a miRNA-induced change in transcript stability – for example, of oncogenes or tumour suppressor genes – has functional consequences [Citation7,Citation20].
Here we explore the transcriptome stability of the stage IV amelanotic melanoma cell line A375 to better understand its role in melanoma development and progression. We also investigate RNA stability dynamics in the presence and absence of miR-211, which acts as a tumour suppressor in this cell line [Citation21,Citation22]. We show that miR-211 decreases transcriptome stability. miR-211-dependent destabilization also downregulates several target genes and pathways involved in cancer progression. Using a combination of stability dynamics, gene expression changes, and in silico prediction, we decipher transcriptome-wide miR-211 targets in A375 cells. Focusing on one such target gene, DUSP3, we show that its miR-211-dependent downregulation modulates signalling pathways and the cancer phenotype in vitro. Overall, the study provides insights into the dynamic interplay between miR-211 and its targets and how these interactions contribute to melanoma formation.
Results and discussion
Transcriptomic stability in the A375 amelanotic melanoma cell line
We were motivated to study the transcriptome-wide half-life of A375 amelanotic melanoma cells to better understand the relationship between mRNA stability and tumour phenotype. To this end, we used BRIC-seq to quantify transcriptome-wide half-life [Citation12,Citation14]. A375 cells were subjected to BRIC-seq at four time points (0, 1, 3, and 6 h) () to determine transcript decay rate or half-life. BrU labelled RNA was pulled down using an anti-BrdU antibody before being deep sequenced and processed to obtain read counts normalized to spike-in control RNA (see Methods). Normalized RNA reads were filtered for quality to obtain the decay profile (), which was converted into half-lives (, Table S1).
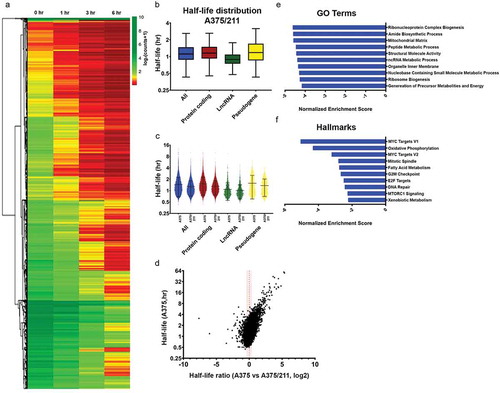
Figure 1. Transcriptome decay profile of the amelanotic melanoma cell line A375. A) Schematic of BRIC-seq ([Citation10], see Methods). BrU-labelled RNA is collected at defined intervals after initial incubation to identify transcriptome-wide decay rates. B) Heatmap of normalized read counts and depicting decay profiles of all the filtered transcripts. Unsupervised hierarchical clustering represents subgroups clustered based on decay profile. C) Box plots showing the half-life distribution (in hours) of all the transcripts and transcript species as calculated from the filtered data. D) Gene ontology (GO) analysis showing top 10 GO terms associated with the 5% most highly stable (top) and 5% most highly unstable (bottom) protein-coding transcripts. E) Hallmark analysis showing top 10 hallmarks associated with the 5% most highly stable (top) and 5% most highly unstable (bottom) protein-coding transcripts
![Figure 1. Transcriptome decay profile of the amelanotic melanoma cell line A375. A) Schematic of BRIC-seq ([Citation10], see Methods). BrU-labelled RNA is collected at defined intervals after initial incubation to identify transcriptome-wide decay rates. B) Heatmap of normalized read counts and depicting decay profiles of all the filtered transcripts. Unsupervised hierarchical clustering represents subgroups clustered based on decay profile. C) Box plots showing the half-life distribution (in hours) of all the transcripts and transcript species as calculated from the filtered data. D) Gene ontology (GO) analysis showing top 10 GO terms associated with the 5% most highly stable (top) and 5% most highly unstable (bottom) protein-coding transcripts. E) Hallmark analysis showing top 10 hallmarks associated with the 5% most highly stable (top) and 5% most highly unstable (bottom) protein-coding transcripts](/cms/asset/713f151c-a2f7-4f24-8a14-7026ea5ce456/krnb_a_1629769_f0001_c.jpg)
At the transcriptome-wide level, majority of the transcripts decayed over time (). Overall, transcripts had half-lives of under 2 h (mean 1.459 h, median 1.248 h) (), with mRNA stability (mean 1.512 h, median 1.324 h) higher than lncRNA stability (mean 1.077 h, median 0.9364 h) but comparable to pseudogene transcripts stability (mean 1.564 h, median 1.248 h) (). BRIC-seq-quantified half-lives were validated by BRIC-qPCR for select candidates, and MYC and GAPDH half-lives were within 20% of the deep sequencing estimate and half-life ratios were comparable (Fig. S1).
We next established whether transcript stability was associated with gene function in A375 cells. Gene ontology (GO) analysis of genes ranked based on half-life showed that the top 5% most stable (top 5%, high half-life) coding transcripts had a housekeeping function (e.g., mitochondrial function, metabolic processes, and enzyme binding), while the top 5% most unstable (bottom 5%, low half-life) coding transcripts tended to be important for transcriptional regulation (e.g., nucleic acid binding transcription factor activity, double-stranded DNA binding, negative regulation of gene expression; ), similar to observations in other genome-wide decay studies using different methodologies [Citation5,Citation6,Citation10,Citation23]. With respect to ‘hallmark’ signatures [Citation24], the most stable transcripts were enriched for genes involved in epithelial to mesenchymal transition (EMT) and MYC signaling in addition to housekeeping metabolic pathways such as oxidative phosphorylation (), while unstable transcripts were enriched for signalling pathways that play significant role in melanoma progression such as TNFα [Citation25,Citation26], p53 [Citation27], and TGFβ [Citation28,Citation29]. Interestingly, unstable genes were enriched for genes downregulated by UV radiation [Citation30] and KRAS signalling [Citation31,Citation32], two common drivers of melanoma progression. Overall, many pathways and processes are regulated at the RNA stability level, with the unstable decay profiles identifying highly regulated genes and pathways important in melanoma progression.
miR-211-mediated decay targets coding and non-coding transcripts
To better understand the role of miRNAs in transcript stability and cancer progression in A375 cells, we next determined transcriptome stability dynamics in A375 cells overexpressing miR-211 (A375/211 cells), a known tumour suppressor (,, Fig. S2) [Citation21,Citation22,Citation33]. miR-211 overexpression reduced the half-lives of all RNA species, especially mRNAs (mean 1.297 h, median 1.170 h, 14% reduction compared to parental cells) and pseudogenes (mean 1.365 h, median 1.187 h, ~13% reduction compared to parental cells; ). While miR-211 overexpression had little effect on the half-life (), transcript stability was affected in both directions but mainly towards destabilization (). Our approach to look for bona fide miR-211 targets using multiple approaches (in silico prediction and RNA-seq) overcame the impact of genome-wide noise associated with the ectopic expression of miR-211.
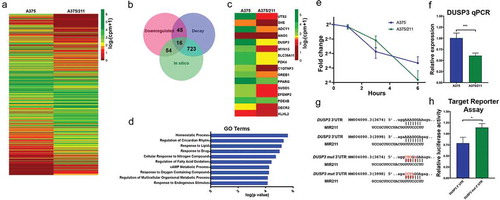
Figure 2. miR-211 destabilizes transcriptome stability in A375 cells. A) Heatmap of normalized read counts depicting decay profiles of all the filtered transcripts for A375/211 cells. Hierarchical clustering represents subgroups clustered based on decay profiles. B) Box plots showing the half-life distribution (in hours) of all the transcripts and transcript species as calculated from the filtered data for A375/211 cells. C) Violin plot depicting half-lives of each individual transcript for different RNA species between A375 and A375/211 cells. D) Volcano plot depicting the correlation between half-life of a transcript in control A375 cells and the change in half-life upon miR-211 induction in A375/211 cells. The majority of transcripts are destabilized upon miR-211 expression. Dashed line represent decay ratio 1 and dotted line depicts ±20% window. E) GSEA for gene ontology (GO) terms showing the top ten GO terms enriched for miR-211-driven destabilized transcripts with lower half-life (≤80%) compared to parental A375 cells. F) GSEA for hallmark terms showing the top ten hallmark terms enriched for miR-211 driven destabilized transcripts
GO and hallmark analysis suggested that miR-211 preferentially decreased the half-lives of genes involved in known miR-211-regulated pathways (,) such as oxidative phosphorylation/energy metabolism [Citation22,Citation34–Citation36], lipid/fatty acid metabolism [Citation36,Citation37], mitosis/cell-cycle progression/cell-cycle checkpoint [Citation38–Citation40], and MYC-dependent signaling [Citation41,Citation42], suggesting a miR-211-dependent contribution to half-life dynamics. This altered regulation extended to the individual pathway level, with gene set enrichment analysis (GSEA) for Biocarta pathways showing that integrin signalling, involved in cell shape and mobility, was enriched in destabilized protein-coding transcripts (data not shown), in line with our previous observation of drastically altered shape of A375/211 cells compared to A375 cells [Citation22]. Taken together, these results suggest that miR-211 drives transcript stability changes in A375 cells that are associated with functional outcomes.
miR-211 target prediction using BRIC-seq stability data
miR-211 might destabilize transcripts through both direct (miR-211 binding to the 3ʹUTR of the target mRNA with the RISC complex to degrade mature transcript) or indirect (destabilized through overall changes in the regulatory state of the cell) regulation. The observed level of an individual transcript will be governed by both the degradation rate and the transcription rate.
Given that miRNAs directly degrade transcript, we reasoned that direct functionally relevant miR-211 targets will have (i) lower stability (i.e., decreased half-lives, ≤80%) in A375/211 cells than in parental A375 cells; (ii) lower expression levels (), and (iii) miR-211 target sequences in their 3ʹUTRs. Using this stringent approach, 16 protein-coding genes (,) had a high probability of being miR-211 targets, and indeed PDK4 and EFEMP2 have been shown to be direct MIR211 targets in melanoma [Citation22,Citation43]. GO analysis of the selected candidates suggested that miR-211 directly targets genes related to cellular metabolism, and several of the predicted miR-211 targets have been implicated in the development and progression of other cancers; for example, ANO5 is downregulated in thyroid cancer [Citation44]; GREB1 is upregulated in ovarian [Citation45], breast [Citation46], and prostate cancers [Citation47]; and EFEMP2 is upregulated in glioma [Citation48] and colorectal cancers [Citation49]. Some previously predicted miR-211 targets in melanoma cell lines such as RAB22A, SERINC3, AP1S2 [Citation50]; NUAK1 [Citation43]; and BRN2/POU3F2 [Citation51] did not meet the criteria, suggesting that the approach shows some cell type specificity. Nevertheless, combining half-life/decay data with gene expression data and existing information appears to provide a highly stringent approach for identifying miRNA targets.
Figure 3. Decay dynamics helps identify miR-211 targets in A375 cells. A) Heatmap showing normalized read counts comparing expression of significantly (two-fold change, FDR <0.1) differentially expressed protein-coding genes between A375 and A375/211 cells. B) Venn diagram showing the overlap between downregulated genes, destabilized genes, and in silico predicted gene targets. Seven hundred and twenty-three predicted targets decayed faster (half-life ratio A375 vs A375/211, ≥1.2) upon miR-211 induction; 54 predicted targets were downregulated and 45 faster decaying genes were downregulated. Altogether, 16 predicted targets were destabilized and downregulated. C) Heatmap plotting normalized read counts of selected miR-211 targets based on stringent criteria of overlap between destabilization, downregulation, and in silico prediction. D) Gene ontology (GO) analysis showing the top 10 GO terms enriched for direct miR-211 targets. E) Graph comparing decay profile of DUSP3 between A375 and A375/211 cells as calculated via BRIC-qPCR and showing that miR-211 reduces DUSP3 transcript half-life. F) qPCR validation of DUSP3 downregulation upon miR-211 induction in A375 cells. G) In silico predicted miR-211 target sites in the DUSP3 3ʹ UTR. H) In vitro validation of miR-211-dependent DUSP3 3ʹ UTR decay via a luciferase-based mi-RNA reporter assay. * p < 0.05; *** p < 0.001
DUSP3 is an miR-211 target in A375 cells where it promotes cancer progression
To examine whether our approach had successfully identified a hitherto unknown miR-211 target in melanoma, we selected DUSP3 for further validation. DUSP3, also known as vaccinia-H1 related (VHR) [Citation52], has been shown to be functionally involved in various cancers including cervical carcinoma [Citation53], prostate cancer [Citation54], and breast cancer [Citation55]. However, there are no reports of DUSP3 involvement in melanoma or its regulation by miR-211.
We first validated DUSP3 as an miR-211 target. BRIC-qPCR (t1/2; A375 = 0.956 h, A375/211 = 0.775 h) () and RT-qPCR (, Fig. S3) showed that miR-211 upregulated the DUSP3 transcript decay rate and downregulated DUSP3 expression. There were two in silico-predicted miR-211-binding sites in the DUSP3 3ʹUTR (), so we tested both sites for miR-211 targeting by transfecting cells with a luciferase vector containing native DUSP3 3ʹUTR or mutated (mut) DUSP3 3ʹUTR (). The mutated 3ʹUTR abrogated miR-211-dependent downregulation of luciferase activity () compared to the native 3ʹUTR.
To understand whether miR-211-mediated DUSP3 downregulation in melanoma was functional, we next performed loss-of-function experiments with siRNA knock-down of endogenous DUSP3 in A375 cells (). While miR-211 overexpression significantly reduced proliferation compared to parental A375 cells (), siRNA knockdown of DUSP3 in A375 cells did not affect proliferation (). However, DUSP3 knockdown reduced invasion and colony formation at comparable levels to those observed in A375/211 cells compared to A375 (,), suggesting that DUSP3 downregulation might contribute to miR-211-dependent regulation of cell invasion and anchorage-independent growth. DUSP3 has previously been shown to induce cell growth and inhibit apoptosis in adenocarcinoma cells [Citation54], and DUSP3 depletion in HeLa cells induces cell cycle arrest and reduces cell proliferation [Citation56]. Furthermore, DUSP3 knockout reduces cell migration [Citation57] and inhibits in vitro angiogenic sprouting [Citation58], consistent with the oncogenic function seen here.
Figure 4. DUSP3 downregulation reduces cell invasion and colony forming ability in A375 cells and alters MAPK/PI3K signalling. A) Western blot showing downregulation of DUSP3 protein in A375/211 cells and validating knockdown of DUSP3 upon transient DUSP3 siRNA (siDUSP3; 48 h post-transfection) transfection in A375 background compared to control siRNA (siNEG). B) DUSP3 knockdown does not affect A375 cell proliferation in vitro (right, compared to control siRNA, siNEG, based on four independent experiments). C) DUSP3 knockdown in A375 leads reduces cell invasion (right two panels; compared to control siRNA, siNEG). Reduced cell invasion is also seen in A375/211 compared to A375 cells (left two panels). Bar graph quantifying three independent trials. D) DUSP3 knockdown in A375 cells reduces colony formation (right two panels; compared to control siRNA, siNEG). Reduced colony formation is also seen in A375/211 compared to A375 cells (left two panels). Bar graph quantifying three independent trials. E) Human MAPK array depicting levels of various phosphorylated kinases with 8-minute exposure time. Boxed dots represent duplicate spots for identifying the indicated phosphorylated protein kinases. Bar graph representing normalized levels of selected (boxed) phosphorylated protein kinases for comparison between A375 vs. A375/211 and siNEG (control siRNA) and siDUSP3 (DUSP3 siRNA) conditions. F) Model of DUSP3 and miR-211-dependent dysregulation of MAPK and PI3K signalling. Significance level: * p < 0.05; ** p < 0.005; *** p < 0.001
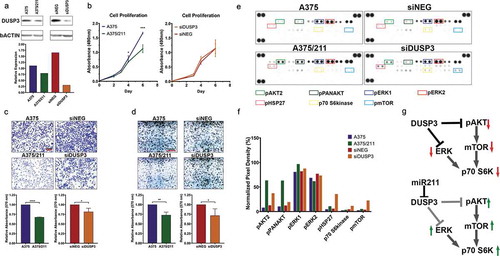
DUSP3 is a dual activity phosphatase that regulates signalling pathways by dephosphorylating target tyrosine and/or serine/threonine residues [Citation59]. While DUSP3 has been shown to specifically target ERK1/2 and JNK MAP kinase (MAPK) pathways in multiple cancers [Citation55,Citation56,Citation58,Citation60], its role in melanoma is unknown. To investigate the specific kinase pathway(s) regulated by DUSP3 in A375 cells, we assessed phosphorylation of various MAPK pathway members using a MAPK array upon DUSP3 knockdown (). DUSP3 knockdown increased phosphorylation of pAKT, pERK1, pHSP27, p70 S6kinase, and pmTOR, similar to the pattern seen in A375/211 cells (). While previous reports have suggested DUSP3 targets the ERK pathway, our observation suggests that DUSP3 also regulates PI3K/AKT signalling, not only upstream at the level of pAKT but also the downstream pathways members p70 S6kinase and pmTOR () [Citation61]. Recent reports have suggested that HSP27 is associated with both the ERK and AKT pathways, suggesting the observed change in phosphorylation could be via these pathways [Citation62–Citation64]. Similar positive regulation of ERK [Citation65] or AKT [Citation35] by miR-211 has previously been reported in other cell lines. Taken together, these results support that miR-211 may exert some of its tumour suppressive function via downregulation of DUSP3 and related downstream pathways to inhibit growth and invasion.
Conclusions
Here we explored the transcriptome stability of the stage IV non-pigmented melanoma cell line A375 to better understand its role in melanoma development and progression. We also investigated RNA stability dynamics in the presence and absence of miR-211, which acts as a tumour suppressor in this cell line [Citation21,Citation22]. We demonstrated that miR-211 decreases transcriptome stability and that this miR-211-dependent destabilization downregulates key target genes and pathways that lead to melanoma progression.
In general, our pathway analysis showed that genome-wide transcript stability was related to several pathways of interest in cancer and more specifically melanoma. For instance, stable transcripts were enriched for MYC targets and mTORC1 signalling, both of which are targets of the constitutively active RAS-RAF-MEK-ERK signalling pathway and important regulators of the melanoma phenotype [Citation66–Citation68]. Genes involved in oxidative phosphorylation and EMT also showed higher stability and, given that EMT in particular drives invasion and metastasis, implicates global transcript stability in the maintenance of critical cancer hallmarks [Citation69–Citation71]. Unstable genes were enriched for apoptosis and p53 signalling pathways, suggesting that global instability could disrupt critical tumour suppressive pathways.
miR-211 also had a global impact on transcript stability through direct targeting and indirect physiological changes: miR-211 directly targeted and destabilized A375 homeostatic and metabolic processes and indirectly destabilized genes involved in cell cycle, DNA repair, and MYC-dependent regulation. Interestingly, miR-211 destabilized oxidative phosphorylation in A375 cells, a previously described metabolic switch function of miR-211 in melanotic and amelanotic melanomas [Citation22,Citation35,Citation36].
One important observation from the decay rates dynamics is the abundance of non-target-specific interactions upon miR-211 overexpression. Unfortunately, since this was a first proof of concept study using this approach, it is difficult to establish the exact cause of this observation. However, other genome-wide miRNA target identification approaches such as AGO2-RIP-seq also result in non-target-specific interactions. For instance, Meier et al. [Citation72] investigated genome-wide translational inhibition upon miRNA (miR-155) expression and also observed indirect mRNA and miRNA expression profile alterations that contributed to the observed phenotype. While this study did not investigate transcriptome-wide half-life dynamics, AGO2-RIP-seq and RNA-seq analysis suggested considerable non-target specific interactions and regulation. RNA-seq analysis of total cell lysates suggested that only 21.5% of downregulated (total 339) targets were predicted based on miR-155 binding sites alone. In addition, 11.6% of 121 upregulated genes were predicted miR-155 targets, suggesting context-dependent regulation. RIP-seq following AGO pull-down showed that 100 transcripts were enriched upon miR-155 induction and, of those, only 67 were predicted targets and only nine of those predicted targets showed regulation by decay. Similarly, Kutsche et al. [Citation73] also found that out of 127 differentially AGO2-enriched and upregulated genes upon miR-124 deletion, only 98 were predicted targets. Taken together, these studies and out data suggest that miRNA-dependent regulation of targets without predicted binding sites could either be a by-product of miRNA overexpression that overloads AGO2 RISC with the candidate miRNA or could be a genuine interaction via currently unknown mechanisms.
Finally, we successfully exploited a genome-wide transcript half-life changes assay to identify context-dependent transcriptome-wide miRNA targets. Our combinatorial approach of using half-life ratios, differential expression, and in silico prediction proved to be a stringent method to identify functionally relevant and novel miRNA targets. We show that the novel direct miR211 target DUSP3 has an oncogenic role in A375 melanoma cells. Finally, our results support a role for miR211-dependent regulation of DUSP3 in regulating melanoma growth and progression by modulating MAPK/PI3K signalling.
Materials and methods
Cell culture
The human stage IV amelanotic melanoma cell line A375 (ATCC Number: CRL-1619) and the derived miR-211-overexpressing A375/211 cell line [Citation21] were grown in Tu+ medium as previously described [Citation21].
BRIC-seq and BRIC-qPCR
A375 and A375/211 cells were incubated with metabolic bromouridine (BrU) for 24 h and then used as per the BRIC kit (RN1007/1008; MBL International, Woburn, MA) protocol. Briefly, labelled medium was replaced with fresh medium and cells were collected at 0, 1, 3, and 6 h post labelling. Total RNA was extracted using the Direct-zol RNA miniprep kit (R2060, Zymo Research) mixed with external spike-in labelled RNA according to the manufacturer’s recommendation, before pulling down labelled RNA with an anti-BrdU antibody (BRIC kit). Bound RNA was eluted and followed by RT-qPCR or deep sequencing.
RNA extraction, cDNA synthesis, and qPCR
Total RNA was isolated from cells using the Direct-zol RNA miniprep kit (R2060, Zymo Research), with subsequent quantification using Nanodrop (Thermo Fisher Scientific). TaqMan probes were used to quantify DUSP3 (Hs01115776_m1) using GAPD (Hs99999905_m1) and ACTB (Hs1060665_g1) as control. Standard qPCR primers were used for GAPDH, MYC, and BRIC-spike in control for BRIC-qPCR. TaqMan probes were used to quantify levels of miR-211 (TM: 000514) and RNU48 (TM: 001006) expression was used as control. Fold change was obtained from the Ct value comparison. Fold change from different condition was compared using two-tailed Student’s t-test assuming equal variance.
Northern blot analysis
Total 20 µg of RNA from A375 and A375/211 cells was separated on 15% denaturing polyacrylamide NovexTM TBE urea gel (Invitrogen), blotted on to BrightStarTM- plus positively charged nylon membrane (Invitrogen) and hybridized with UltraHyb-Oligo buffer (Invitorgen). The blots were then hybridized with DIG-labelled miRCURY LNA miRNA detection probes specific for miR-211 (339,111 YD00612245-BCH) and U6 (339,111 YD00699002-BCH). The blots were washed with 2X SSC buffer and 0.5% sodium dodecyl sulfate (SDS) and processed for autoradiography.
RNA-seq
RNA sequencing was performed at the Genomics Core at the Sanford Burnham Prebys Medical Discovery Institute, Orlando, FL. Before sequencing, total RNA quality was assessed with the Agilent Bioanalyzer Nano Assay (part no. 5067–1512) (Agilent Technologies). RNA-seq libraries were constructed using the Illumina TruSeq Stranded Total RNA Library preparation Gold kit (catalog no. 20,020,598) (Illumina Inc.) as per the instructions. The quality and quantity of the libraries were analysed using the Agilent Bioanalyzer and Kapa Biosystems qPCR (Sigma Aldrich). Multiplexed libraries were pooled, and single-end 50 base-pair sequencing was performed on one flow-cell of an Illumina HiSeq 2500. The RNA-seq data is available on GEO, accession number GSE126784.
The reads were mapped to GRCh38/hg38 human genome assembly p12 (release 28, www.gencodegenes.org) using HISAT2 and annotated using corresponding release version gencode comprehensive annotation file. Mapped reads were quantified using StringTie to obtain FPKM values, which were converted to read counts using prepDE.py script (provided in StringTie manual).
For differential gene expression analysis, read counts from two independent samples for A375 and A375/211 each were analysed by DESeq2 script in R [Citation74].
Decay rate analysis
For BRIC-seq decay analysis, read counts from four time points (0, 1, 3 and 6 h) were normalized to that of spike-in RNA counts to obtain normalized read counts. Normalized read counts at time 1/3/6 h were scaled with respect to 0 h reads. The decay constant was obtained from normalized and scaled read counts by fitting it to a linear model (log(y) = x + c) using R. Data with positive decay constant or R-squared values <0.75 in both A375 and A375/211 conditions were removed from further analysis. Decay constant was converted into half-life from relation t1/2 = −0.693/decay_constant.
For BRIC-qPCR decay analysis, fold changes in genes were obtained with respect spike-in RNA at each time point. Fold changes at time points 1, 3, and 6 h were then scaled to that at 0 h and fitted to an exponential curve to obtain the decay constant, which was then converted to half-life as described above.
GSEA and gene ontology (GO) analysis
Genes selected for GO term and hallmark analysis were subjected to functional annotation using the GSEA web-based application (broad.mit.edu/gsea/) [Citation24]. GSEA for decay ratio was conducted with GSEAPreranked list, with rank determined by decay rate ratio between A375 vs A375/211.
microRNA reporter assay
The 3′ UTR sequences of DUSP3 (NM004090) mRNA genes were amplified by PCR using the primers (forward: AGTGGCAGGGCGGCCGCCACTGCCGGGAAGGTTATAGC, reverse: GGTGATGATGACCGGTAGCGAGTCCAATTGCTTCATGTG) using A375 genomic DNA. The forward and reverse primer contained 5′ NotI or 3′ AgeI (underscored sequence), respectively. The PCR product was cloned into pcDNA6/luc/NP3 into a NotI-AgeI site using the Clontech In-Fusion kit (Clontech Laboratories, Mountain View, CA). To remove the two putative MIR211 sites, mutated DUSP3 3ʹUTR was engineering via site-directed mutagenesis using the primers: first site (XhoI site) CACCAACATTCTCGAGCCAAACCATCCATCACCATG, reverse: GATGGTTTGGCTCGAGAATGTTGGTGCCTTTTGTGCC; second site (AvrII site), forward: TGGTAGCTCTCCTAGGTCTGTCCAGAAAAATTCACTC, reverse: TCTGGACAGACCTAGGAGAGCTACCAAATTGTTT. The mutated insert was cloned into the same insertion site of a luciferase vector. 100,000 HEK293T cells were transfected with 33 ng DUSP3 3ʹUTR or mutated 3ʹUTR (DUSP3mut) with 200 ng of miR-211 overexpression construct or empty vector along with 5 ng of pRL-CMV plasmid vector encoding Renilla luciferase gene using FuGENE transfection reagent (Promega, Madison, WI). After 48 h incubation, cells were washed in PBS and lysed using cell lysis buffer (Promega). The lysate was quantified for firefly and Renilla luciferase activity using the Dual-Glo Luciferase assay system (Promega) to determine miR-211-dependent target degradation/transcriptional inhibition. Firefly luciferase activity of each 3ʹ UTR in each case, with and without miR-211 overexpression, was first normalized with respect to that of Renilla luciferase activity of the cell lysate. Then, the firefly luciferase activity of each 3ʹ UTR in the presence of miR-211 was normalized with that of control transfections with empty vector lacking miR-211.
DUSP3 siRNA knockout
A375 cells were transfected with siRNA against DUSP3 (siDUSP3) mRNA (s4371, Ambion) to achieve downregulation of DUSP3 expression. Negative control siRNA (siNEG) (AM4635, Ambion) was used as a control.
Cell proliferation assay
Cells were plated in triplicate at 5000 cells per well into 96-well plates for the various time points indicated in the figures and legends. Cell proliferation was assessed using the CellTiter96 Aqueous One Solution Cell Proliferation Assay (MTS) kit (Promega).
Cell invasion assay
Cell invasion assay was performed using Corning BioCoat Matrigel Invasion Chambers (Discovery Labware) according to the manufacturer’s protocol. Briefly, cells were starved in FBS-free medium for 24 h before being transferred into the upper chambers in serum-free medium (50,000 cells per chamber). Medium containing 10% FBS was added to the lower chambers. Cells were incubated for 48 h at 37ºC. To quantify cell invasion, migrated cells were stained with 0.5% crystal violet dye. Excess staining was removed by rinsing with water and subsequently the membrane was dried before taking images. Dye from stained cells was extracted using methanol, and optical density was measured at 570 nm on a spectrophotometer to quantify cell invasion intensity.
Western blotting and MAPK phosphoarray
Whole cell extracts from A375 cells, A375 cells transfected with siNEG or siDUSP3, and A375/211 cells were fractionated by SDS-PAGE and transferred to a polyvinylidene difluoride membrane using a transfer apparatus according to the manufacturer’s protocols (Bio-Rad Laboratories). After incubation with blocking buffer containing 5% BSA in TBST (10 mM Tris, pH 8.0, 150 mM NaCl, 0.5% Tween 20) for 60 min, the membrane was washed once with TBST and incubated with antibodies against DUSP3 (4752, Cell Signaling Technology), and β-actin (4967, Cell Signaling) diluted in blocking buffer at 4°C for 16 h. Membranes were washed three times for 10 min and incubated with a 1:3000 dilution of horseradish peroxidase-conjugated anti-mouse or anti-rabbit antibodies for 2 h. Blots were washed with TBST three times and developed with the ECL system (Amersham Biosciences) according to the manufacturer’s protocols.
To determine the phosphorylation level of various MAPK pathway members, the phospho-MAPK array assay was performed using the human phospho-MAPK array kit (R&D Systems) according to the provided protocol.
Author Contributions
PJ and TS performed and analysed BRIC-seq experiment
PJ and AB performed and analysed IHC experiments
BL constructed DUSP3 and DUSP3mut constructs
PJ performed and analysed rest of the experiments
PJ and RJP wrote the manuscript
Supplemental Material
Download Zip (2.5 MB)Acknowledgments
We thank John Marchica at Sanford Burnham Prebys Medical Discovery Institute Analytical Genomics core for his support with RNA sequencing. We also thank Dr. Haritha Kunhiraman, JHU, for her help with the northern blot analysis. Part of this research project analysis was conducted using computational resources at the Maryland Advanced Research Computing Center (MARCC). We would like to thank Ms. Tiffany Casey for final formatting of the manuscript.
Disclosure statement
No potential conflict of interest was reported by the authors.
Supplementary Material
Supplemental data for this article can be accessed here.
Additional information
Funding
Related Research Data
References
- Siegel RL, Miller KD, Jemal A. Cancer statistics, 2018. CA Cancer J Clin. 2018;68(1):7–30.
- Pawlik TM, Sondak VK. Malignant melanoma: current state of primary and adjuvant treatment. Crit Rev Oncol Hematol. 2003;45(3):245–264.
- Lugowski A, Nicholson B, Rissland OS. Determining mRNA half-lives on a transcriptome-wide scale. Methods. 2018;137:90–98.
- Mitra M, Lee HN, Coller HA. Determining Genome-wide Transcript Decay Rates in Proliferating and Quiescent Human Fibroblasts. J Vis Exp. 2018;131. DOI:10.3791/56423
- Narsai R, Howell KA, Millar AH, et al. Genome-wide analysis of mRNA decay rates and their determinants in Arabidopsis thaliana. Plant Cell. 2007;19(11):3418–3436.
- Yang E, van Nimwegen E, Zavolan M, et al. Decay rates of human mRNAs: correlation with functional characteristics and sequence attributes. Genome Res. 2003;13(8):1863–1872.
- Benjamin D, Moroni C. mRNA stability and cancer: an emerging link? Expert Opin Biol Ther. 2007;7(10):1515–1529.
- Singer RH, Penman S. Stability of HeLa cell mRNA in actinomycin. Nature. 1972;240(5376):100–102.
- Alkallas R, Fish L, Goodarzi H, et al. Inference of RNA decay rate from transcriptional profiling highlights the regulatory programs of Alzheimer’s disease. Nat Commun. 2017;8(1):909.
- Tani H, Mizutani R, Salam KA, et al. Genome-wide determination of RNA stability reveals hundreds of short-lived noncoding transcripts in mammals. Genome Res. 2012;22(5):947–956.
- Bensaude O. Inhibiting eukaryotic transcription: which compound to choose? How to evaluate its activity? Transcription. 2011;2(3):103–108.
- Imamachi N, Tani H, Mizutani R, et al. BRIC-seq: a genome-wide approach for determining RNA stability in mammalian cells. Methods. 2014;67(1):55–63.
- Diermeier-Daucher S, Clarke ST, Hill D, et al. Cell type specific applicability of 5-ethynyl-2ʹ-deoxyuridine (EdU) for dynamic proliferation assessment in flow cytometry. Cytometry A. 2009;75(6):535–546.
- Imamachi N, Salam KA, Suzuki Y, et al. A GC-rich sequence feature in the 3ʹ UTR directs UPF1-dependent mRNA decay in mammalian cells. Genome Res. 2017;27(3):407–418.
- Ha M, Kim VN. Regulation of microRNA biogenesis. Nat Rev Mol Cell Biol. 2014;15(8):509–524.
- Alberti C, Cochella L. A framework for understanding the roles of miRNAs in animal development. Development. 2017;144(14):2548–2559.
- Peng Y, Croce CM. The role of MicroRNAs in human cancer. Signal Transduct Target Ther. 2016;1:15004.
- Kawamata T, Tomari Y. Making RISC. Trends Biochem Sci. 2010;35(7):368–376.
- Hayes J, Peruzzi PP, Lawler S. MicroRNAs in cancer: biomarkers, functions and therapy. Trends Mol Med. 2014;20(8):460–469.
- Khabar KS. Hallmarks of cancer and AU-rich elements. Wiley Interdiscip Rev RNA. 2017;8:1.
- Mazar J, DeYoung K, Khaitan D, et al. The regulation of miRNA-211 expression and its role in melanoma cell invasiveness. PLoS One. 2010;5(11):e13779.
- Mazar J, Qi F, Lee B, et al. MicroRNA 211 Functions as a Metabolic Switch in Human Melanoma Cells. Mol Cell Biol. 2016;36(7):1090–1108.
- Clark MB, Johnston RL, Inostroza-Ponta M, et al. Genome-wide analysis of long noncoding RNA stability. Genome Res. 2012;22(5):885–898.
- Subramanian A, Tamayo P, Mootha VK, et al. Gene set enrichment analysis: a knowledge-based approach for interpreting genome-wide expression profiles. Proc Natl Acad Sci U S A. 2005;102(43):15545–15550.
- Katerinaki E, Evans GS, Lorigan PC, et al. TNF-alpha increases human melanoma cell invasion and migration in vitro: the role of proteolytic enzymes. Br J Cancer. 2003;89(6):1123–1129.
- Gray-Schopfer VC, Karasarides M, Hayward R, et al. Tumor necrosis factor-alpha blocks apoptosis in melanoma cells when BRAF signaling is inhibited. Cancer Res. 2007;67(1):122–129.
- Box NF, Vukmer TO, Terzian T. Targeting p53 in melanoma. Pigment Cell Melanoma Res. 2014;27(1):8–10.
- Busse A, Keilholz U. Role of TGF-beta in melanoma. Curr Pharm Biotechnol. 2011;12(12):2165–2175.
- Perrot CY, Javelaud D, Mauviel A. Insights into the Transforming Growth Factor-beta Signaling Pathway in Cutaneous Melanoma. Ann Dermatol. 2013;25(2):135–144.
- Giles N, Pavey S, Pinder A, et al. Multiple melanoma susceptibility factors function in an ultraviolet radiation response pathway in skin. Br J Dermatol. 2012;166(2):362–371.
- Frederick DT, Piris A, Cogdill AP, et al. BRAF inhibition is associated with enhanced melanoma antigen expression and a more favorable tumor microenvironment in patients with metastatic melanoma. Clin Cancer Res. 2013;19(5):1225–1231.
- Ji Z, Flaherty KT, Tsao H. Targeting the RAS pathway in melanoma. Trends Mol Med. 2012;18(1):27–35.
- Xu Y, Brenn T, Brown ER, et al. Differential expression of microRNAs during melanoma progression: miR-200c, miR-205 and miR-211 are downregulated in melanoma and act as tumour suppressors. Br J Cancer. 2012;106(3):553–561.
- Guda MR, Asuthkar S, Labak CM, et al. Targeting PDK4 inhibits breast cancer metabolism. Am J Cancer Res. 2018;8(9):1725–1738.
- Sahoo A, Sahoo SK, Joshi P, et al. MicroRNA-211 Loss Promotes Metabolic Vulnerability and BRAF Inhibitor Sensitivity in Melanoma. J Invest Dermatol. 2019;139(1):167–176.
- Sahoo A, Lee B, Boniface K, et al. MicroRNA-211 Regulates Oxidative Phosphorylation and Energy Metabolism in Human Vitiligo. J Invest Dermatol. 2017;137(9):1965–1974.
- Barbato S, Marrocco E, Intartaglia D, et al. MiR-211 is essential for adult cone photoreceptor maintenance and visual function. Sci Rep. 2017;7(1):17004.
- Asuthkar S, Velpula KK, Chetty C, et al. Epigenetic regulation of miRNA-211 by MMP-9 governs glioma cell apoptosis, chemosensitivity and radiosensitivity. Oncotarget. 2012;3(11):1439–1454.
- Song GQ, Zhao Y. MicroRNA-211, a direct negative regulator of CDC25B expression, inhibits triple-negative breast cancer cells’ growth and migration. Tumour Biol. 2015;36(7):5001–5009.
- Xia B, Yang S, Liu T, et al. miR-211 suppresses epithelial ovarian cancer proliferation and cell-cycle progression by targeting Cyclin D1 and CDK6. Mol Cancer. 2015;14:57.
- Bu Y, Yoshida A, Chitnis N, et al. A PERK-miR-211 axis suppresses circadian regulators and protein synthesis to promote cancer cell survival. Nat Cell Biol. 2018;20(1):104–115.
- Chu TH, Yang CC, Liu CJ, et al. miR-211 promotes the progression of head and neck carcinomas by targeting TGFbetaRII. Cancer Lett. 2013;337(1):115–124.
- Bell RE, Khaled M, Netanely D, et al. Transcription factor/microRNA axis blocks melanoma invasion program by miR-211 targeting NUAK1. J Invest Dermatol. 2014;134(2):441–451.
- Chang Z, Cai C, Han D, et al. Anoctamin5 regulates cell migration and invasion in thyroid cancer. Int J Oncol. 2017;51(4):1311–1319.
- Hodgkinson K, Forrest LA, Vuong N, et al. GREB1 is an estrogen receptor-regulated tumour promoter that is frequently expressed in ovarian cancer. Oncogene. 2018;37(44):5873–5886.
- Ghosh MG, Thompson DA, Weigel RJ. PDZK1 and GREB1 are estrogen-regulated genes expressed in hormone-responsive breast cancer. Cancer Res. 2000;60(22):6367–6375.
- Rae JM, Johnson MD, Cordero KE, et al. GREB1 is a novel androgen-regulated gene required for prostate cancer growth. Prostate. 2006;66(8):886–894.
- Wang L, Chen Q, Chen Z, et al. EFEMP2 is upregulated in gliomas and promotes glioma cell proliferation and invasion. Int J Clin Exp Pathol. 2015;8(9):10385–10393.
- Yao L, Lao W, Zhang Y, et al. Identification of EFEMP2 as a serum biomarker for the early detection of colorectal cancer with lectin affinity capture assisted secretome analysis of cultured fresh tissues. J Proteome Res. 2012;11(6):3281–3294.
- Margue C, Philippidou D, Reinsbach SE, et al. New target genes of MITF-induced microRNA-211 contribute to melanoma cell invasion. PLoS One. 2013;8(9):e73473.
- Boyle GM, Woods SL, Bonazzi VF, et al. Melanoma cell invasiveness is regulated by miR-211 suppression of the BRN2 transcription factor. Pigment Cell Melanoma Res. 2011;24(3):525–537.
- Ishibashi T, Bottaro DP, Chan A, et al. Expression cloning of a human dual-specificity phosphatase. Proc Natl Acad Sci U S A. 1992;89(24):12170–12174.
- Henkens R, Delvenne P, Arafa M, et al. Cervix carcinoma is associated with an up-regulation and nuclear localization of the dual-specificity protein phosphatase VHR. BMC Cancer. 2008;8:147.
- Arnoldussen YJ, Lorenzo PI, Pretorius ME, et al. The mitogen-activated protein kinase phosphatase vaccinia H1-related protein inhibits apoptosis in prostate cancer cells and is overexpressed in prostate cancer. Cancer Res. 2008;68(22):9255–9264.
- Hao L, ElShamy WM. BRCA1-IRIS activates cyclin D1 expression in breast cancer cells by downregulating the JNK phosphatase DUSP3/VHR. Int J Cancer. 2007;121(1):39–46.
- Rahmouni S, Cerignoli F, Alonso A, et al. Loss of the VHR dual-specific phosphatase causes cell-cycle arrest and senescence. Nat Cell Biol. 2006;8(5):524–531.
- Chen YR, Chou HC, Yang CH, et al. Deficiency in VHR/DUSP3, a suppressor of focal adhesion kinase, reveals its role in regulating cell adhesion and migration. Oncogene. 2017;36(47):6509–6517.
- Amand M, Erpicum C, Bajou K, et al. DUSP3/VHR is a pro-angiogenic atypical dual-specificity phosphatase. Mol Cancer. 2014;13:108.
- Huang CY, Tan TH. DUSPs, to MAP kinases and beyond. Cell Biosci. 2012;2(1):24.
- Tambe MB, Narvi E, Kallio M. Reduced levels of Dusp3/Vhr phosphatase impair normal spindle bipolarity in an Erk1/2 activity-dependent manner. FEBS Lett. 2016;590(16):2757–2767.
- Hemmings BA, Restuccia DF. PI3K-PKB/Akt pathway. Cold Spring Harb Perspect Biol. 2012;4(9):a011189.
- Robitaille H, Simard-Bisson C, Larouche D, et al. The small heat-shock protein Hsp27 undergoes ERK-dependent phosphorylation and redistribution to the cytoskeleton in response to dual leucine zipper-bearing kinase expression. J Invest Dermatol. 2010;130(1):74–85.
- Rane MJ, Pan Y, Singh S, et al. Heat shock protein 27 controls apoptosis by regulating Akt activation. J Biol Chem. 2003;278(30):27828–27835.
- Deng W, Zhang Y, Gu L, et al. Heat shock protein 27 downstream of P38-PI3K/Akt signaling antagonizes melatonin-induced apoptosis of SGC-7901 gastric cancer cells. Cancer Cell Int. 2016;16:5.
- Hu X, Chen P, Wu Y, et al. MiR-211/STAT5A Signaling Modulates Migration of Mesenchymal Stem Cells to Improve its Therapeutic Efficacy. Stem Cells. 2016;34(7):1846–1858.
- Davies MA. The role of the PI3K-AKT pathway in melanoma. Cancer J. 2012;18(2):142–147.
- Zhuang D, Mannava S, Grachtchouk V, et al. C-MYC overexpression is required for continuous suppression of oncogene-induced senescence in melanoma cells. Oncogene. 2008;27(52):6623–6634.
- Lin X, Sun R, Zhao X, et al. C-myc overexpression drives melanoma metastasis by promoting vasculogenic mimicry via c-myc/snail/Bax signaling. J Mol Med (Berl). 2017;95(1):53–67.
- Corazao-Rozas P, Guerreschi P, Andre F, et al. Mitochondrial oxidative phosphorylation controls cancer cell’s life and death decisions upon exposure to MAPK inhibitors. Oncotarget. 2016;7(26):39473–39485.
- Das S, Das J, Samadder A, et al. Apigenin-induced apoptosis in A375 and A549 cells through selective action and dysfunction of mitochondria. Exp Biol Med (Maywood). 2012;237(12):1433–1448.
- Lin K, Baritaki S, Militello L, et al. The Role of B-RAF Mutations in Melanoma and the Induction of EMT via Dysregulation of the NF-kappaB/Snail/RKIP/PTEN Circuit. Genes Cancer. 2010;1(5):409–420.
- Meier J, Hovestadt V, Zapatka M, et al. Genome-wide identification of translationally inhibited and degraded miR-155 targets using RNA-interacting protein-IP. RNA Biol. 2013;10(6):1018–1029.
- Kutsche LK, Gysi DM, Fallmann J, et al. Combined Experimental and System-Level Analyses Reveal the Complex Regulatory Network of miR-124 during Human Neurogenesis. Cell Syst. 2018;7(4):438–52.e8.
- Love MI, Huber W, Anders S. Moderated estimation of fold change and dispersion for RNA-seq data with DESeq2. Genome Biol. 2014;15(12):550.