
ABSTRACT
Pancreatic cancer has the worst prognosis of all common cancers. Pancreatic cancer cells have a metabolic advantage due to their swiftly adaptive responses to hypoxic and low-nutrient medium. This advantage contributes to the aggressivity of pancreatic cancer. In this study, lncRNA MIR210HG was abnormally upregulated within pancreatic cancer. It acted as a key oncogenic regulator of pancreatic cancer aggressiveness and glycolysis. Knockdown of MIR210HG significantly inhibited the aggressive phenotype of pancreatic cancer cells and inhibited the growth of xenograft tumours. More importantly, MIR210HG knockdown inhibited pancreatic cancer cell glycolysis via regulating the glycolysis-related hexokinase 2 (HK2) and Pyruvate kinase muscle isozyme M2 (PKM2) expression. Compared with the MIR210HG knockdown group, miR-125b-5p inhibition promoted the aggressive phenotypes and glycolysis of pancreatic cancer cells. Furthermore, the effects of MIR210HG knockdown on HK2 and PKM2 expression, pancreatic cancer cell aggressive phenotypes, and glycolysis were significantly reversed by miR-125b-5p inhibition. In tissue samples, MIR210HG expression was negatively correlated with miR-125b-5p levels and positively correlated with HK2 and PKM2 expression. miR-125b-5p expression was negatively correlated with HK2 and PKM2 expression. In conclusion, MIR210HG affected the phenotypes of pancreatic cancer cells, including proliferation, invasion, migration, and glycolysis, via modulating the miR-125b-5p/HK2/PKM2 axis.
Introduction
Pancreatic cancer displays the poorest prognosis rates among common cancers. Despite breakthroughs in early diagnosis and treatment, the 5-year overall survival rate has remained unimproved at 6% [Citation1,Citation2]. The cause of poor prognosis rates is attributed to the high metastatic potential and proliferative properties of pancreatic cancer cells [Citation3,Citation4]. The low prognosis rates have triggered an urgent academic need to conduct research further and understand the molecular mechanism of malignant pancreatic tumours.
Malignant cells proliferate and migrate through cell division. These processes require energy and biological precursors to maintain cell division, invasion and migration. Furthermore, tumour cells show highly adaptive traits in situations of hypoxia and starvation through a phenomenon called the ‘Warburg Effect’. This is associated with elevated glucose uptake and lactate secretion. Warburg Effect is widely accepted as a common feature of metabolic reprogramming [Citation5]. This kind of process can provide energy, macromolecular precursors, and reduce oxidative stress, exerting a critical effect on the abnormal survival and growth of tumour cells [Citation6]. Additionally, glycolysis is enhanced even under normoxic conditions; therefore, it is hypothesized that this respiratory damage leads to aerobic glycolysis, which is thought to initiate cancer [Citation7]. In cases of pancreatic cancer, the hypo-vascularization of pancreatic cancer attenuates the delivery of biosynthetic nutrients to cancer cells, causing a hypoxic microenvironment and an energy crisis. While, the resistance to apoptosis in pancreatic cancer has been proven [Citation8]. These findings indicate that pancreatic cancer cells are metabolically suited to survive within their microenvironment [Citation9].
Aerobic glycolysis links the high rate of glucose fermentation with uncontrolled proliferation and cancer cell progression. The core of aerobic glycolysis is the signalling pathways mediated by hypoxia-inducible factor 1 (HIF-1), which changes the glucose metabolism to the glycolytic phenotype and allows cancer cells to survive under hypoxic stress [Citation10]. In pancreatic tumours, hypoxic conditions promote the expression levels of pyruvate dehydrogenase kinase (PDK1), lactate dehydrogenase A (LDHA), pyruvate kinase muscle isozyme (PKM), glucose-6-phosphate isomerase/autocrine motility factor (PGI/AMF), hexokinase 2HK2 (HK2). HIF-1α exerts a mediating effect on this process [Citation11–13]. Thereupon, targeting specific metabolic pathways and factors of pancreatic cancer is a novel strategy to develop new treatment regimens [Citation14].
Transcriptome analyses have revealed that only a small fraction of genetic transcripts (2%) can encode proteins and the rest are non-coding RNAs (ncRNAs) [Citation15,Citation16], including lncRNAs (long non-coding RNAs, longer than 200 nucleotides) and miRNAs (microRNAs, shorter than 20 nucleotides). Both lncRNAs and miRNAs contribute to various biological processes of carcinoma, such as cancer cell proliferation, migration, invasion, as well as metabolic reprogramming [Citation17–20]. Reportedly, in pancreatic cancer, lncRNAs such as HOXA distal transcript antisense RNA [Citation21], plasmacytoma variant translocation 1 (PVT1) [Citation22], and metastasis-associated lung adenocarcinoma transcript 1 (MALAT1) [Citation23] are related to pancreatic carcinoma chemoresistance. Through RNA-seq analysis, Gene Ontology (GO) and Kyoto Encyclopaedia of Genes and Genomes (KEGG) pathway enrichment analyses, and differentially expressed lncRNAs–mRNAs co-expression analysis, Li et al. [Citation24] constructed a co-expression network consists of a hub comprising lncRNAs (MIR210HG, SNHG1, and LOC729970) and mRNAs (RAB3D, DDX17, and SPNS2) which may exert a mediating effect on drug resistance of pancreatic tumour cells. Among the hub lncRNAs, MIR210HG has been regarded as an oncogenic lncRNA promoting cancer metastasis in breast carcinoma [Citation25], non-small cell lung carcinoma [Citation26], cervical carcinoma [Citation27], and osteosarcoma [Citation28]. Moreover, MIR210HG is the host gene of miR-210 and was identified as a hypoxia-related lncRNA [Citation29]. In triple-negative breast cancer, hypoxia-induced MIR210HG might act as a tumour promoter by enhancing the Warburg effect [Citation30]. However, the role and mechanism of MIR210HG within pancreatic carcinoma glycolysis have not been fully determined.
The study firstly confirmed MIR210HG expression within pancreatic carcinoma based on bioinformatics and experimental analyses. Next, the cellular functions of MIR210HG upon proliferation, invasion, and migration of pancreatic tumour cells and the in vivo effects of MIR210HG on xenograft tumour growth was determined. As for downstream genes, differentially expressed genes in pancreatic cancer and adjacent normal tissues were applied for KEGG signalling annotation enrichment analysis. HK2 and PKM2 were selected because they related to glycolysis and MIR210HG expression. MIR210HG regulation of HK2 and PKM2 were examined. Next, miRNAs that might target MIR210HG, 3ʹUTR of HK2, and PKM2 were analysed and miR-125b-5p was selected. The predicted miR-125b-5p binding sites to MIR210HG, HK2, and PKM2 were verified. The effects of miR-125b-5p alone and the dynamic effects of MIR210HG and miR-125b-5p on pancreatic cancer cell aggressiveness and glycolysis were evaluated. Finally, the correlation of the key factors mentioned was analysed. Overall, we proved a lncRNA-miRNA-mRNA axis in modulating pancreatic cancer cell aggressiveness and glycolysis.
Materials and methods
Clinical sampling
Pancreatic cancer tissues (n = 20) and adjacent normal tissues (n = 20) were harvested from pancreatic cancer patients who have undergone surgery from July 2019 to April 2020 (The clinical character is shown in Table S1). Patients who have undergone chemotherapy or radiation therapy prior to the surgical operation were excluded from this study. The diagnosis of each specimen was confirmed based on haematoxylin and eosin (H&E) staining results. all the specimens were stored at −80°C or fixed in formalin pending further experimental usage. This study gained the approval of the Ethics Committee of Zhongshan Hospital, Fudan University (Approval No. B2019-136R2). Written informed consent was signed by each enrolled patient.
Bioinformatics analysis
For MIR210HG, HK2 and PKM2 expression analysis in normal pancreatic tissues and pancreatic cancer tissues, expression data was procured from Genotype-Tissue Expression (GTEx) database (https://gtexportal.org/home, n = 171) and Genomic Data Commons(GDC)- The Cancer Genome Atlas (TCGA) – Pancreatic adenocarcinoma (PAAD) (downloaded from Xena data hub: https://xenabrowser.net/datapages/, n = 179). The expression matrix was normalized via the log2 (TPM+1) transformation. For overall survival analysis of MIR210HG, GDC-TCGA-PAAD downloaded expression matrix was normalized via the log2 (count+1) transformation. Meanwhile, the phenotype – Curated survival data was also obtained from this data hub, with 177 patients involved. The Overall-Survival Event (OS) and the Overall-Survival Time (OS-time) were used to calculate the survival signature of MIR210HG. The expression matrix of GDC-TCGA-PAAD and correlated survival data were both inducted into the R studio and combined by the unique TCGA sample ID. It was subsequently analysed by Graphpad software using the log-rank test. The Cox regression model was used to estimate the hazard ratio (HR). To exclude other disease burdens causing death, samples with an OS-time of less than 1 month were discarded from the analysis. The cut-off is valued at 0.5. For MIR210HG, HK2 and PKM2 expression analysis in pancreatic ductal adenocarcinoma, the Gene Expression Omnibus (GEO) dataset GSE55643, GSE16515 and GSE19650 were downloaded using R language GEOquery package and the differential expression genes were analysed by Limma package. For KEGG analysis, GSE55643, GSE16515, GSE15471 and GSE28735 were analysed to select differentially expressed genes between normal pancreatic and cancer tissues (|logFC|> 0.56, p < 0.05). A total of 403 differentially expressed genes were applied for KEGG signalling annotation. For miRNA selection, miRcode (http://www.mircode.org/) [Citation31] was used to predict miRNAs that might target MIR210HG. miRwalk (http://mirwalk.uni-hd.de/) [Citation32] was used to predict miRNAs that might target HK2 3ʹ-UTR and PKM2 3ʹ-UTR.
Real-time (RT) qPCR
RT-qPCR was performed to examine the expression levels of mRNA, lncRNA, and miRNA. For mRNA and lncRNA isolation, total RNA was collected using TRIzol reagent following the manufacturer’s instructions. For miRNA isolation, miRcute miRNA isolation kit (TIANGEN Biotech Co.ltd, China) was used following the manufacturer’s instructions. An ultraviolet spectrophotometer was used to confirm the concentration and purity of the total RNA. StarScript II First-strand cDNA Synthesis Kit-II (GeneStar, China) was used for reverse transcription. The reverse transcription system is composed of 1.0 µg Total RNA, 1 µL OLigo dT (for mRNA and lncRNA detection) or 1 µL specific RT primer (stem-loop primers for miRNA detection were listed in Table S2), 10 µL Reaction Buffer, 1 µL StarScript II RT Mix and RNase-free DEPC water (to a total of 20 µl). After mixing and spinning the reverse transcription system in the 96-well PCR reaction plate (Thermo Fisher Scientific, USA), the plate was incubated in a metal bath equipment (ALLSHENG, Hangzhou, China) at 42°C for 30 min and 85°C for 5 min. An SYBR-Green RT PCR Master Mix (GenStar) was used for the RT-qPCR assay on a RT PCR amplification equipment (ABI7500, USA) (Primers showed in Table S2). The amplification used the following conditions: 95°C for 2 min, followed by 40 amplification cycles at 95°C for 15 s and 60°C for 30 s. β-actin (for mRNA and lncRNA) or miR-25-3p (for miRNA) [Citation33] was used as an internal control.
Cell resource and cell culture
Pancreatic cancer cell lines and normal pancreatic epithelial cell line, Panc-1 (ATCC® CRL-1469™), Mia PaCa-2 (ATCC® CRM-CRL-1420™), BxPC-3 (ATCC®CRL-1687), AsPC-1 (ATCC®CRL-1682) and hTERT-HPNE (ATCC®CRL-4023) were obtained from ATCC (Manassas, VA, USA) and cultured in Dulbecco’s Modified Eagle’s Medium (DMEM; Invitrogen, Carlsbad, CA, USA) supplemented with 10% FBS (Invitrogen). All the cells were cultured at 37°C in 5% CO2.
Cell transfection
The short hairpin RNA structure (sh1/2-MIR210HG and sh-NC as a negative control) was constructed with a stem-loop CTCGAG connecting the MIR210HG-target siRNA sequence and its reverse complementary sequence. The pLVX-shRNA2-puro plasmid was double-digested using the BamHI and EcoRI restriction enzyme cutting sites and then the short hairpin RNA structure was connected with the plasmid fragments following the aforementioned methods [Citation34]. For overexpression of lncRNA-MIR210HG in BxPC-3 cells, the full length of lncRNA-MIR210HG was cloned into pLVX-puro vector using homologous recombination methods. These plasmids were subsequently transfected in target cells with the help of Lipofectamine 3000 Reagent (Thermo Fisher scientific). The primers are listed in Table S2.
CCK-8 for cell viability
The cell viability was assessed using a CCK-8 kit (Beyotime, Shanghai, China). A total of 5 × 10³ cells were plated in each well of a 96-well plate. A total of 20 μl of CCK-8 solution was added to each well and the cells were further cultured for 2 h at 37°C. At the end of the incubation period, the optical density value (OD) was measured at 450 nm using a microplate reader.
EdU (5-Ethynyl-2´-deoxyuridine) for DNA synthesis capacity
Cells were transfected for 48 h, incubated with EdU for 2 h, fixed with 4% formaldehyde, washed with PBS, permeated and stained by Apollo 643 reagent. After staining the cell nucleus with DAPI, the number of cells stained with EdU was counted and photographed under a fluorescence microscope.
Transwell invasion
The Matrigel gel was diluted in serum-free DMEM culture solution at a ratio of 1:5. A total of 80 μl of the mixture was added to the well of the Transwell plate. The Transwell chambers were then placed into 24-well plates and incubate at 37°C for 5 h until the gel solidifies. Target cells were transfected and digested with 0.25% trypsin, suspended in serum-free medium and counted. Subsequently, 200 μl (5 × 10⁵ cells/ml) of transfected cells were plated in the upper chamber and 600 µl of DMEM medium containing 10% FBS was added to the lower chamber. After a 24 h incubation period, the upper chamber was washed twice with PBS. The cells on the upper surface were skimmed off with a cotton swab and the cells left were fixed with anhydrous methanol for 30 min and stained with 0.4% crystal violet for 15 min. The number of cells passing through the basement membrane was counted under an optical microscope and photographed.
Wound healing migration
Following transfection, approximately 5 × 10⁵ cells were added to 24-well plates. After 24 h of culture, a pipette tip was used to make one scratch. The cells were washed thrice with PBS after which a complete medium was added. The cells were subsequently incubated with the culture medium at 37 C in 5% CO2 for another 48 hours. The migrating width was subsequently measured and the results were photographed. The experiment was repeated at least three times and the average value was used in subsequent calculations.
Immunoblotting
Cells were transfected for 48 h and lyzed with an appropriate amount of RIPA (contained PMSF) lysate. The total protein was extracted by centrifugation, total protein concentration was determined according to the BCA method, and the protein was separated using SDS-PAGE. The proteins were subsequently wet electro-transferred after electrophoresis. Membranes were blocked with 5% milk blocking solution for 1 h to avoiding non-specific bindings. The membranes were incubated with the following primary antibodies overnight at 4°C and wash 3 times with 0.05% TBST for 5 min each time: anti-ki67 (ab92742, Abcam, USA), anti-PCNA (10,205-2-AP, Proteintech, Wuhan, China), anti-HK2 (Catalogue #MBS475044, MyBioSource, San Diego, CA, USA), anti-PKM2 (ab137852; Abcam), and anti-β-actin (60,008-1-Ig, Proteintech). The membranes were then incubated with secondary antibodies (HRP-labelled goat anti-rabbit IgG and goat anti-mouse IgG) at room temperature for 1 h and washed 3 times with 0.05% TBST for 5 min each time. The signal was detected by the ECL chemiluminescence method.
Immunohistochemical staining (IHC)
The tumour and adjacent normal tissues were paraffin-embedded and cut into 4-μm cross-sections, and mounted on glass slides. After having been dewaxed, antigen repaired, and blocking, the sections were incubated with anti-HK2 (Catalogue #MBS475044, MyBioSource), anti-PKM2 (ab137852; Abcam) for 2 h at 37℃. Then, tissues were incubated with biotin-labelled goat anti-rabbit secondary antibody for 20 minutes, and then HRP labelled streptavidin for 10 minutes at 37℃. After washing with PBS, the slides were incubated with freshly prepared DAB reagent (Boster, China) for 10 min. Haematoxylin solution was used for nucleus staining.
Xenograft tumour model in BALB/C nude mice
Panc-1 cells (1 × 10⁷cells) were infected with Lsh-MIR210HG lentivirus or Lsh-NC lentivirus and then injected under the skin of the left flank of BALB/c nude mice (SLAC Laboratory Animal Center, Shanghai, China). Tumours were monitored once every three days for 27 days. On day 27, all animals were sacrificed and the tumour tissues were harvested for examining the weight and protein levels of ki67 and PCNA by Immunoblotting. All animal procedures gained the approval of the Zhongshan Hospital, Fudan University Ethics Committee (Approval No.2020–070).
Glucose and lactic acid levels measurement
Glucose levels in the culture medium were determined using a commercial glucose assay kit, Glucose Colorimetric assay kit II (K686-100, Bio Vision, Milpitas, CA, USA). The glucose uptake was calculated by deducting the detected glucose concentration in the medium from the initial glucose concentration (25 μM/L). The level of lactic acid secreted into the culture medium was analysed by colorimetry. According to the manufacturer’s instructions, the Lactate Assay Kit II (Eton Bioscience Inc., San Diego, CA, USA) was used for the determination.
ATP level
The ATP Assay Kit (S0026, Beyotime, China) was used for intracellular ATP levels determination according to the kit’s instructions. The intracellular ATP level was assessed by the bioluminescence method using a multi-function microreader.
PDH activity
A PDH activity assay kit (BC0380, Solarbio, China) was used as per the manufacturer’s instructions. 5 × 10⁶ target cells were lysed in PDH analysis buffer (1 ml reagent I plus 10 μl reagent II), and the volume of the cell lysate used for each reaction was 50 µl. The reaction mixture, which consisted of assay buffer and working solution, was added into cuvettes, and the 605 nm absorbance was measured immediately using a spectrophotometer (FUP-5600, China). During the measuring process, the samples were kept on ice. Only the measurement values within the linear range of the determination were used for PDH activity calculation, and blank samples were used for each sample calibration.
Dual-luciferase reporter assay
MIR210HG, HK2 3ʹ-UTR, or PKM2 3ʹ-UTR sequence containing the miR-125b-5p binding sites were cloned into psicheck2 luciferase reporter vector (Promega) to generate wild-type reporter vectors, wt-MIR210HG, wt-HK2 3ʹ-UTR, or wt-PKM2 3ʹ-UTR; meanwhile, site-directed mutagenesis of the miR-125b-5p binding sites in MIR210HG, HK2 3ʹ-UTR, or PKM2 3ʹ-UTR sequence was cloned into luciferase reporter vector to generate mutant-type reporter vectors, mut-MIR210HG, mut-HK2 3ʹ-UTR, or mut-PKM2 3ʹ-UTR. Then, 293 T cells were co-transfected with miR-125b-5p mimic/mimic NC or miR-125b-5p inhibitor/inhibitor NC together with these reporter vectors using Lipofectamine 3000. The luciferase activity was determined 24 h post-transfection using the Dual-Luciferase Reporter System (Promega) as directed by the manufacturer.
Statistical analysis
Statistical analyses were performed using GraphPad (GraphPad Software, Inc., La Jolla, CA, USA). Significant differences between groups were evaluated by a Student’s t-test (between two groups) or One-way ANOVA follows post hoc Turkey’s test (among more than two groups). The Long-Rank test was used in survival analysis. The results are reported as the means ± standard deviation (SD) based on at least three replicates.
Results
MIR210HG expression and its correlation with pancreatic cancer prognosis
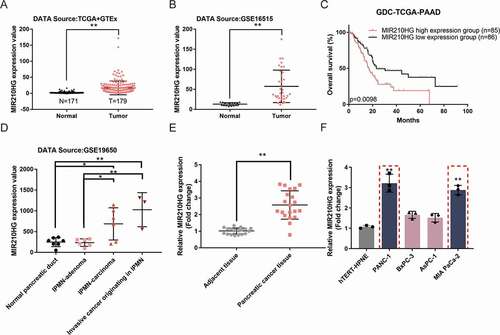
Before investigating the specific effects of MIR210HG upon pancreatic carcinoma, we further confirmed lncRNA MIR210HG expression between normal pancreas (n = 171, from Genotype-Tissue Expression (GTEx) database, grey dots) and tumour samples (n = 179, from GDC-TCGA-PAAD database, red dots) and found that the expression of MIR210HG showed to be effectively increased within tumour tissues than those within normal non-cancerous tissues ()). Also, according to Gene Expression Omnibus (GEO) database (GSE16515, gene expression in pancreatic ductal adenocarcinoma), the expression of lncRNA MIR210HG showed to be dramatically increased within pancreatic carcinoma tissue samples than that within the normal pancreas ()). Regarding the prognosis, cases from the GDC-TCGA-PAAD database were grouped by the 0.5 cut-off of MIR210HG expression into two groups. The relationship between the expression of MIR210HG and the pancreatic cancer patients’ overall survival was analysed. ) illustrated that high MIR210HG expression displayed a low survival percentage (HR is 1.836, p-value is 0.0098). MIR210HG expression also increased with the pathological process of pancreatic cancer, as manifested as MIR210HG upregulation IPMN-carcinoma and invasive cancer originating in IPMN than that within normal pancreatic duct and IPMN-adenoma, according to GSE19650 ()). lncRNA MIR210HG expression was then confirmed within 20 paired pancreatic carcinoma and adjacent non-cancerous tissue samples using RT-qPCR; as shown in ), MIR210HG was dramatically increased within pancreatic carcinoma tissue samples than that within non-cancerous control samples (). In cell lines, MIR210HG expression was examined in four pancreatic cancer cell lines, Panc-1, BxPC-3, AsPC-1, and MIA PaCa-2, and a normal hTERT-HPNE cell line, and was significantly upregulated in Panc-1 and MIA PaCa-2 cell lines than that within hTERT-HPNE cell line () and ). Therefore, MIR210HG expression in pancreatic cancer is abnormally upregulated and pancreatic cancer patients with higher MIR210HG might display worse prognoses.
Table 1. The relative expression of MIR210HG, HK-2, PKM2 and miR-125b-5p in tissues
Table 2. MIR210HG and miR-125b-5p expression in different human pancreatic cancer cells
Figure 1. MIR210HG expression and its correlation with pancreatic cancer prognosis (a) The expression of lncRNA MIR210HG between GTEx normal pancreas (n = 171) and GDC-TCGA-PAAD tumour samples (n = 179), according to The Genotype-Tissue Expression (GTEx) project and TCGA-PAAD database. logFC = 2.820. p-value = 5.06E-17. (b) The expression of lncRNA MIR210HG in pancreatic cancer and normal pancreatic tissues, according to GSE16515. LogFC = 1.837, p-value = 4.04E-09. (c) Cases from the GDC-TCGA-PAAD database were divided into two groups using the 0.5 cut-off of MIR210HG expression. The correlation between MIR210HG expression and the overall survival in patients with pancreatic cancer was analysed. (samples having an OS-time of less than 1 month were discarded from analysis to exclude other disease burdens caused death). (d) The expression of lncRNA MIR210HG in the normal pancreatic duct, IPMN-adenoma, IPMN-carcinoma, and invasive cancer originating in IPMN, according to GSE19650. IPMN-adenoma, logFC = 0.068, p-value = 8.89E-01, IPMN-carcinoma logFC = 1.545, p-value = 6.35E-03, invasive cancer originating in IPMN logFC = 2.012, p-value = 4.29E-03, compared to normal pancreatic duct. (e) The expression of lncRNA MIR210HG was examined in 20 paired pancreatic cancer and adjacent non-cancerous tissue samples using RT-qPCR. (f) The expression of lncRNA MIR210HG was examined in a normal hTERT-HPNE cell line and four pancreatic cancer cell lines, Panc-1, BxPC-3, AsPC-1, and MIA PaCa-2, using RT-qPCR. *P< 0.05, **P< 0.01
Tumour aggression is reduced by Knockdown MIR210HG
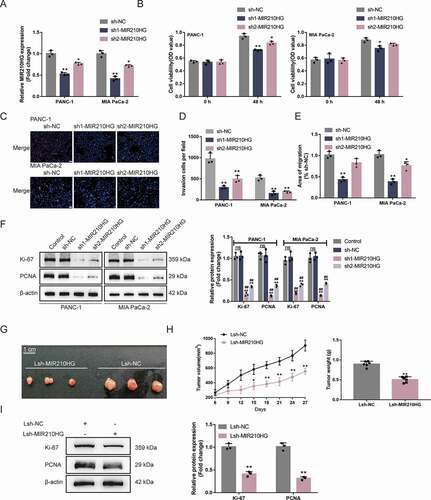
Considering MIR210HG upregulation within Panc-1 and MIA PaCa-2 cell lines, the study achieved MIR210HG knockdown within Panc-1 and MIA PaCa-2 cells by transfecting vectors containing short hairpin RNA targeting MIR210HG (sh1/2-MIR210HG); sh-NC was transfected as a negative control, as confirmed by RT-qPCR () and ). The specific effects of MIR210HG knockdown on Panc-1 and MIA PaCa-2 cell aggressiveness were subsequently examined. showed that MIR210HG knockdown significantly inhibited cell viability, DNA synthesis capacity, cell invasion, and cell migration of both Panc-1 and MIA PaCa-2 cell lines (The microscope images of invasion and migration assay were illustrated in Fig.S1A-B). As for the proliferating markers, sh-NC transfection did not affect the cellular protein levels of ki67 and PCNA, compared to no transfected cells (control). MIR210HG knockdown significantly decreased the cellular protein levels of ki67 and PCNA () and ). These data indicate that MIR210HG knockdown significantly inhibits the aggressive phenotypes of pancreatic cancer cells. Furthermore, we overexpressed MIR210HG in BxPC3 cells which was low expressed of MIR210HG. The empty vector was transfected as a negative control (Fig.S1C and Table S3). The specific effects of MIR210HG on BxPC-3 cell aggressiveness were then analysed. Fig.S1D-G shows that overexpression of MIR210HG significantly promotes cell viability, DNA synthesis ability, cell invasion and cell migration. As for proliferation markers, overexpression of MIR210HG can significantly up-regulate the cellular protein levels of ki67 and PCNA (Fig.S1H and Table S3). Next, for investigating the in vivo effects of MIR210HG on pancreatic cancer growth, lentivirus containing sh-MIR210HG infected Panc-1 cells were injected into nude mice to establish a xenograft tumour model. As shown in ), MIR210HG knockdown significantly repressed tumour growth. In the meanwhile, ki67 and PCNA proteins were also revealed to be markedly reduced within MIR210HG knockdown tumours () and ). These data indicate that MIR210HG knockdown can significantly reduce the aggressive phenotype of pancreatic cancer cells.
Table 3. Validation of MIR210HG knockdown in pancreatic cancer cells
Table 4. The relative expression of Ki-67 and PCNA in PANC-1 and MIA PaCa-2 cells in response to MIR210HG knockdown
Table 5. The relative protein levels of Ki-67 and PCNA in xenograft mice
Figure 2. Tumour aggression is reduced by knockdown MIR210HG (a) MIR210HG knockdown was achieved in Panc-1 and MIA PaCa-2 cells by transfecting vectors containing short hairpin RNA targeting MIR210HG (sh1/2-MIR210HG); sh-NC was transfected as a negative control. The transfection efficiency was confirmed by RT-qPCR. (b) Then, Panc-1 and MIA PaCa-2 cells were transfected with sh1/2-MIR210HG or sh-NC and examined for cell viability by CCK-8 assay; (c) DNA synthesis capacity (scale bar, 50 µm); (d) cell invasion by Transwell assay; (e) cell migration by Wound healing assay; (f) the cellular protein levels of ki67 and PCNA in no transfected cells (control) and sh1/2-MIR210HG or sh-NC transfected cells were determined by Immunoblotting. (g-h) xenograft mouse tumour model was established in BALB/C nude mice accordingly. sh-MIR210HG lentivirus infected Panc-1 cells were injected under the skin of the left flank of nude mice. Tumour size was measured every 3 days for 27 days; on day 27, mice were sacrificed and the tumour weight was measured (G-H); (i) the protein levels of ki67 and PCNA in xenograft tumour tissues were examined using Immunoblotting. *P< 0.05, **P< 0.01, compared to sh-NC. ## P< 0.01, compared to control
MIR210HG modulates glycolysis-related HK2 and PKM2 and pancreatic cancer cell glycolysis
The activation of glycolysis in pancreatic cancer has been shown to promote tumorigenesis [Citation35]. Four datasets (GSE55643, GSE16515, GSE15471 and GSE28735) were analysed to select differentially expressed genes between normal pancreatic and cancer tissues (|logFC|> 0.56, p < 0.05) and obtained a total of 403 genes. These differentially expressed genes were applied for KEGG signalling annotation. The differentially expressed genes such as PKM2, ENO2, HK1, and HK2 were enriched in Glycolysis/Gluconeogenesis-Homo sapiens (human) ()). Among them, the expression of HK2 and PKM2 showed to be dramatically increased within pancreatic carcinoma tissue samples than that within normal pancreatic tissue samples, according to GSE55643 ()). According to GSE16515, the expression of HK2 and PKM2 was remarkably increased within pancreatic carcinoma tissue samples rather than those within normal pancreatic tissue samples ()). Moreover, according to GDC-TCGA-PAAD and GTEx data, the expression of HK2 and PKM2 was remarkably increased within pancreatic carcinoma tissue samples as opposed to those within normal pancreatic tissue samples ()). MIR210HG was positively correlated with HK2/PKM2 (Fig.S2A). According to GETx data (normal pancreas tissues), MIR210HG was positively correlated with HK2/PKM2 (Fig.S2B). To further confirm this, the expression of HK2 and PKM2 showed to be dramatically increased within pancreatic carcinoma tissue samples than those within adjacent non-cancerous tissue samples () and ). The IHC staining results also confirmed that HK2 and PKM2 protein levels were increased within pancreatic carcinoma tissue samples than those within adjacent non-cancerous tissue samples (Fig.S2C).
Figure 3. MIR210HG modulates glycolysis-related HK2 and PKM2 and pancreatic cancer cell glycolysis (a) Four datasets, GSE55643, GSE16515, GSE15471 andGSE28735, were used to select differentially expressed genes between normal pancreatic and cancer tissues (|logFC|> 0.56, p < 0.05) and a total of 403 genes were obtained. These differentially expressed genes were applied for KEGG signalling annotation. The differentially expressed genes such as PKM2, ENO2, HK1, and HK2 were enriched in hsa00010 Glycolysis/Gluconeogenesis-Homo sapiens (human). (b) HK2 and PKM2 expression in normal pancreatic and cancer tissues, according to GSE55643. HK2: logFC = 2.037, p-value = 1.56E-05; PKM2: logFC = 1.264, p-value = 2.10E-04 (c) HK2 and PKM2 expression in normal pancreatic and cancer tissues, according to GSE16515. HK2: logFC = 0.166, p-value = 4.62E-02; PKM2: logFC = 1.757, p-value = 2.52E-08. (d) HK2 and PKM2 expression in normal pancreatic and cancer tissues, according to GDC-TCGA-PAAD and GTEx. HK2: logFC = 3.106, p-value = 3.67E-65; PKM2: logFC = 5.110, p-value = 4.51E-38. (e) The expression of HK2 and PKM2 was examined in 20 paired pancreatic cancer and adjacent non-cancerous tissue samples using RT-qPCR. (f) Panc-1 and MIA PaCa-2 cells were transfected with or without sh-MIR210HG and examined for the expression of HK2 and PKM2 using RT-qPCR. (g) Panc-1 and MIA PaCa-2 cells were transfected with or without sh-MIR210HG and examined for the protein levels of HK2 and PKM2 using Immunoblotting. Then, Panc-1 and MIA PaCa-2 cells were transfected with sh-MIR210HG and examined for glucose levels (h), lactic acid levels (i), ATP levels (j), and PDH activity (k). *P< 0.05, **P< 0.01, compared to normal or adjacent tissues group, or sh-NC group. ## P< 0.01, compared to control
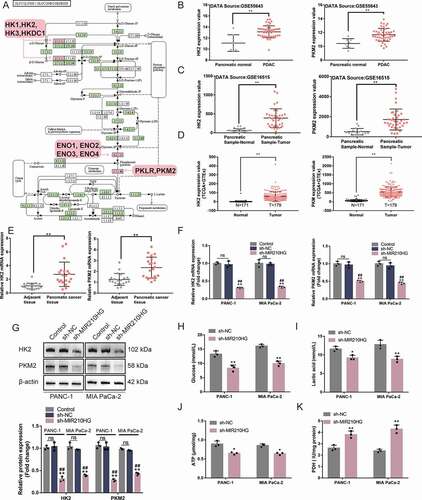
To investigate the MIR210HG regulation of HK2 and PKM2 Panc-1 and MIA PaCa-2 cell lines were transfected with sh-MIR210HG and examined for the levels of HK2 and PKM2. As depicted in ), sh-NC transfection did not affect the mRNA and protein levels of HK2 and PKM2, compared to no transfected cells (control). MIR210HG knockdown significantly downregulated HK2 and PKM2 mRNA expression and protein levels (). The IHC staining results of xenograft tumour shown that HK2 and PKM2 protein levels in MIR210HG knockdown group were significantly downregulated compared to the Lsh-NC group (Fig.S2D). As for the cellular effects of MIR210HG knockdown on the glycolysis of pancreatic carcinoma cells, Panc-1 and MIA PaCa-2 cell lines were transfected with sh-MIR210HG and examined for related indexes. In both cell lines, MIR210HG knockdown significantly reduced the glucose uptake ()), lactic acid release ()), intracellular ATP levels ()), whereas increased PDH activity ()). It is therefore concluded that MIR210HG knockdown in pancreatic cancer cells downregulates HK2 and PKM2 expression and inhibits cancer cell glycolysis.
Table 6. The relative mRNA and protein expression of HK2 and PKM2 in response to MIR210HG knockdown
miR-125b-5p directly targets MIR210HG, HK2, and PKM2
miRNAs could potentially mediate the crosstalk between lncRNAs and mRNAs, therefore participating in biological processes in cells [Citation36–38]; online tools were then used to search for miRNAs that might target MIR210HG and HK2 3ʹ-UTR/PKM2 3ʹ-UTR. miRcode (http://www.mircode.org/) [Citation31] was used to predict miRNAs that might target MIR210HG. miRwalk (http://mirwalk.uni-hd.de/) [Citation32] was used to predict miRNAs that might target HK2 3ʹ-UTR and PKM2 3ʹ-UTR. Three datasets intersected in miR-613, miR-129-5p, and miR-125b-5p ()). To choose one specific miRNA, miR-613, miR-129-5p, and miR-125b-5p expressions were examined within normal hTERT-HPNE and pancreatic carcinoma cell lines Panc-1 and MIA PaCa-2 cells. miR-613, miR-129-5p, and miR-125b-5p expression showed to be significantly decreased within tumour cells, the expression of miR-125b-5p more downregulated () and ). In Panc-1 and MIA PaCa-2 cell lines, sh-NC transfection did not affect the normal expression of those miRNAs. Transfection with sh-MIR210HG, only miR-125b-5p expression was dramatically upregulated in both cell lines () and ). As a further confirmation, the expression of miR-125b-5p showed to be markedly downregulated within pancreatic carcinoma tissue samples than that within adjacent non-cancerous tissue samples () and ). Similarly, in cell lines, miR-125b-5p was significantly downregulated in four pancreatic cancer cell lines than that within the hTERT-HPNE cell line, especially in Panc-1 and MIA PaCa-2 cell lines () and ). Thus, miR-125b-5p was chosen for further experiments.
Table 7. The relative expression of miRNAs in different human pancreatic cancer cells
Table 8. Verification of miRNA expression after MIR210HG knockdown
Figure 4. miR-125b-5p directly targets MIR210HG, HK2, and PKM2 (a) A schematic diagram showing the process of selecting miRNAs that might target MIR210HG, HK2 3ʹ-UTR, and PKM2 3ʹ-UTR. miRcode was used to predict miRNAs that might target MIR210HG and miRwalk was used to predict miRNAs that might target HK2 3ʹ-UTR and PKM2 3ʹ-UTR. Two datasets intersected in miR-613, miR-129-5p, and miR-125b-5p. (b) The expression of miR-613, miR-129-5p, and miR-125b-5p was examined in normal hTERT-HPNE and pancreatic cancer Panc-1 and MIA PaCa-2 cells by RT-qPCR. (c) Panc-1 and MIA PaCa-2 cells were transfected with or without sh-MIR210HG and examined for the expression of miR-613, miR-129-5p, and miR-125b-5p by RT-qPCR. (d) The expression of miR-125b-5p was examined in 20 paired pancreatic cancer and adjacent non-cancerous tissue samples using RT-qPCR. (e) The expression of miR-125b-5p was examined in a normal hTERT-HPNE cell line and four pancreatic cancer cell lines, Panc-1, BxPC-3, AsPC-1, and MIA PaCa-2, using RT-qPCR. (f) miR-125b-5p overexpression or inhibition was achieved in Panc-1 and MIA PaCa-2 cells by transfecting miR-125b-5p mimics or inhibitor. The transfection efficiency was confirmed by RT-qPCR. (g-i) Wild-type and mutant-type MIR210HG, HK2 3ʹ-UTR, and PKM2 3ʹ-UTR luciferase reporter vectors were constructed and co-transfected in 293 T cells with miR-125b-5p mimics or inhibitor. The luciferase activity was determined. *P< 0.05, **P< 0.01, compared to sh-NC or mimics NC. ##P< 0.01, compared to inhibitor NC
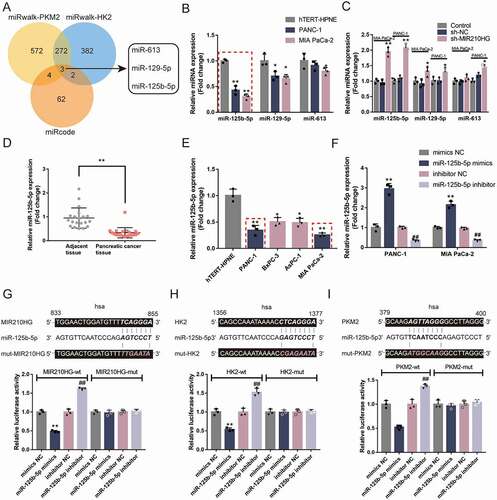
Secondly, miR-125b-5p mimics/inhibitor was transfected to achieve miR-125b-5p overexpression/inhibition within Panc-1 and MIA PaCa-2 cell lines, as confirmed by RT-qPCR () and ). To confirm the predicted miR-125b-5p binding site to MIR210HG, HK2 3ʹ-UTR, and PKM2 3ʹ-UTR, wild-type and mutant-type MIR210HG, HK2 3ʹ-UTR, and PKM2 3ʹ-UTR luciferase reporter vectors were constructed and co-transfected in 293 T cells with miR-125b-5p mimics/inhibitor. As shown in , the overexpression of miR-125b-5p repressed, whereas the inhibition of miR-125b-5p enhanced the luciferase activity of all wild-type vectors; when co-transfected with any of the mutant-type vectors, miR-125b-5p overexpression or inhibition failed to alter the luciferase activity. In summary, miR-125b-5p could directly bind MIR210HG, HK2 3ʹ-UTR, and PKM2 3ʹ-UTR.
Table 9. Verification of the transfection efficiency of miR-125b-5p knockdown and overexpression in pancreatic cancer cells
miR-125b-5p modulates HK2 and PKM2 expression and pancreatic cancer cell phenotypes
After confirming the direct bindings, the regulatory effects of miR-125b-5p on the expression of HK2 and PKM2 were examined. As illustrated in , in both Panc-1 and MIA PaCa-2 cells, miR-125b-5p overexpression downregulated, whereas miR-125b-5p inhibition upregulated HK2 and PKM2 mRNA expression and protein levels. More importantly, miR-125b-5p overexpression downregulated, whereas miR-125b-5p inhibition upregulated ki67 and PCNA mRNA expression and protein levels ( and ), suggesting that miR-125b-5p is potentially involved in pancreatic carcinoma aggressiveness.
Table 10. The relative mRNA and protein expression of HK2, PKM2, ki67, and PCNA in response to miR-125-5p overexpression or knockdown
Figure 5. miR-125b-5p modulates HK2 and PKM2 expression and pancreatic cancer cell phenotypes (a-b) Panc-1 and MIA PaCa-2 cells were transfected with miR-125b-5p mimics or inhibitor and examined for the mRNA expression and protein levels of HK2, PKM2, ki67, and PCNA by RT-qPCR and Immunoblotting. Then, Panc-1 and MIA PaCa-2 cells were transfected with miR-125b-5p mimics or inhibitor and examined for cell viability by CCK-8 assay (c); DNA synthesis capacity (scale bar, 50 µm) (d); cell invasion by Transwell assay (e); cell migration by wound healing assay (f); glucose levels (g), lactic acid levels (h), ATP levels (i), and PDH activity (j). *P< 0.05, **P< 0.01, compared to mimics NC. #P< 0.05, ##P< 0.01, compared to inhibitor NC
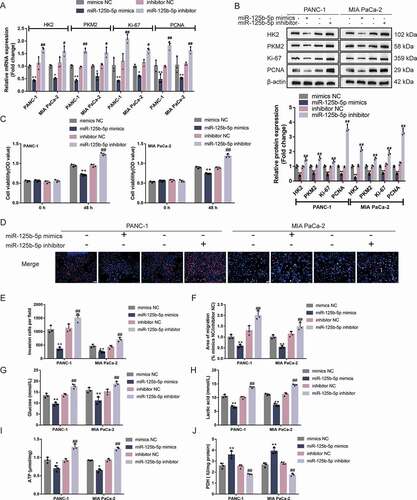
Regarding the cellular functions, Panc-1 and MIA PaCa-2 cell lines were transfected with miR-125b-5p mimics/inhibitor and examined for related indexes. The overexpression of miR-125b-5p inhibited, whereas the inhibition of miR-125b-5p promoted cell viability ()), DNA synthesis capacity ()), cell invasion (), microscope images were shown in Fig.S3A), and cell migration (), microscope images were shown in Fig.S3B). In summary, miR-125b-5p overexpression is shown to attenuate pancreatic cancer cell aggressiveness. Moreover, miR-125b-5p overexpression reduced glucose uptake ()), lactic acid release ()), and ATP levels ()), and increased PDH activity ()); on the contrary, miR-125b-5p inhibition increased glucose uptake ()), lactic acid release ()), and intracellular ATP levels ()), and reduced PDH activity ()). Taken together, the overexpression of miR-125b-5p could repress pancreatic cancer cell glycolysis.
MIR210HG plays a role in pancreatic carcinoma cells through miR-125b-5p
Then, Panc-1 and MIA PaCa-2 cell lines were subsequently co-transfected with sh-MIR210HG and miR-125b-5p inhibitor and examined for HK2 and PKM2 mRNA and protein expression. In both cell lines, MIR210HG knockdown decreased, whereas miR-125b-5p inhibition increased HK2 and PKM2 mRNA and protein expression; miR-125b-5p inhibition was shown to significantly attenuate the effects of MIR210HG knockdown on HK2 and PKM2 ( and ), suggesting that MIR210HG competes with HK2/PKM2 3ʹ-UTR for miR-125b-5p binding and counteracts miR-125b-5p-mediated repression upon HK2/PKM2. Notably, MIR210HG knockdown downregulated, whereas miR-125b-5p inhibition upregulated ki67 and PCNA levels; miR-125b-5p inhibition could significantly attenuate the effects of MIR210HG knockdown on ki67 and PCNA ( and ).
Table 11. The relative mRNA and protein expression of HK2, PKM2, ki67, and PCNA in response to knockdown of MIR210HG and miR-125b-5p
Figure 6. MIR210HG acts on pancreatic cancer cell through miR-125b-5p (a-b) Panc-1 and MIA PaCa-2 cells were co-transfected with sh-MIR210HG and miR-125b-5p inhibitor and examined for the mRNA expression and protein levels of HK2, PKM2, ki67, and PCNA by RT-qPCR and Immunoblotting. Then, Panc-1 and MIA PaCa-2 cells were co-transfected with sh-MIR210HG and miR-125b-5p inhibitor and examined for cell viability by CCK-8 assay (c); DNA synthesis capacity (scale bar, 50 µm) (d); cell invasion by Transwell assay (E); cell migration by wound healing assay (F); glucose levels (G), lactic acid levels (H), ATP levels (I), and PDH activity (J). *P< 0.05, **P< 0.01, compared to sh-NC +inhibitor NC. ##P< 0.01, compared to sh-MIR210HG+miR-125b-5p inhibitor
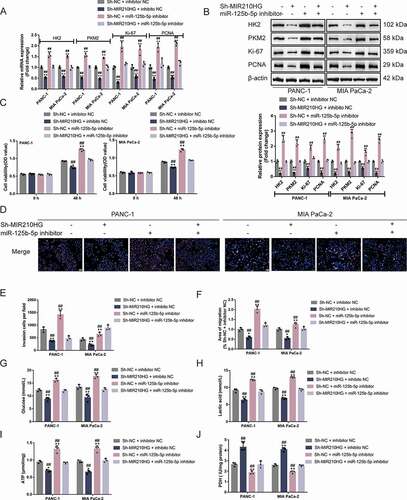
As for the cancer cell aggressiveness, MIR210HG knockdown was inhibited, whereas miR-125b-5p inhibition promoted cell viability ()), DNA synthesis capacity ()), cell invasion (), microscope images are shown in Fig.S3C), and cell migration (), microscope images are shown in Fig.S3D); miR-125b-5p inhibition could significantly attenuate the effects of MIR210HG knockdown upon cancer cell aggressiveness (). As for cancer cell glycolysis, MIR210HG knockdown reduced glucose uptake ()), lactic acid release ()), and ATP levels ()), and increased PDH activity ()), whereas miR-125b-5p inhibition exerted opposite effects; miR-125b-5p inhibition could significantly attenuate the effects of MIR210HG knockdown upon cancer cell glycolysis ()). In summary, MIR210HG modulates pancreatic cancer cell aggressiveness and glycolysis through miR-125b-5p/HK2/PKM2 axes.
Correlation of MIR210HG/miR-125b-5p/HK2/PKM2 expression in tissue samples
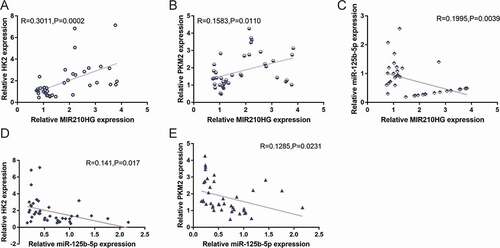
The correlation of expression of the included factors within tissues was analysed. showed that MIR210HG and HK2 expression were positively correlated ()), MIR210HG and PKM2 expression were positively correlated ()), MIR210HG and miR-125b-5p expression were negatively correlated ()), miR-125b-5p and HK2 expression exhibited a negative correlation ()), and miR-125b-5p and PKM2 expression revealed a negative correlation ()). These data suggest the MIR210HG/miR-125b-5p/HK2/PKM2 axis exists in pancreatic cancer tissues.
Figure 7. Correlation of MIR210HG/miR-125b-5p/HK2/PKM2 expression in tissue samples. The correlation between MIR210HG and HK2 expression (a), between MIR210HG and PKM2 expression (b), between MIR210HG and miR-125b-5p expression (c), between miR-125b-5p and HK2 expression (d), and between miR-125b-5p and PKM2 expression (e) was analysed using Pearson’s correlation analysis
Discussion
The study found that lncRNA MIR210HG was abnormally upregulated within pancreatic cancer as a critical oncogenic regulator of pancreatic cancer aggressiveness and glycolysis. MIR210HG knockdown dramatically represses pancreatic cancer cell aggressive phenotypes in vitro and xenograft in vivo. More importantly, MIR210HG positively modulates glycolysis-related HK2 and PKM2 and pancreatic cancer cell glycolysis. miR-125b-5p could target MIR210HG, HK2, and PKM2, and negatively regulate HK2 and PKM2 expression. In contrast to MIR210HG knockdown, miR-125b-5p inhibition promotes the aggressive phenotypes and glycolysis of pancreatic cancer cells. Furthermore, the effects of MIR210HG knockdown on HK2 and PKM2 expression, pancreatic cancer cell aggressive phenotypes, and glycolysis could be significantly reversed by miR-125b-5p inhibition.
As aforementioned, the abnormal upregulation and oncogenic role of lncRNA MIR210HG have been reported in the past. MIR210HG participates in almost all perspectives of cancer cell phenotypes through multiple mechanisms. MIR210HG serves as a competing endogenous RNAs (ceRNA) in invasive breast cancer, sponging miR-1226-3p, upregulating mucin1 expression, subsequently promoting invasion and metastasis of invasive breast carcinoma cells [Citation25]. In non-small cell lung carcinoma, MIR210HG binds to DNMT1 to upregulate CACNA2D2 promoter methylation, thus promoting cancer cell proliferation and invasion [Citation26]. Although Li et al. [Citation24] regarded MIR210HG as one of the top 15 upregulated lncRNAs within pancreatic carcinoma, the specific effects of MIR210HG on pancreatic carcinoma have never been validated. In pancreatic carcinoma, miR-210 has been proved to promote epithelial-mesenchymal transition of pancreatic cancer [Citation39]. MIR210HG is the host gene of miR-210, considering the abnormal upregulation of MIR210HG, we examined the specific effects of MIR210HG knockdown on cancer cells’ phenotypes. We reported that MIR210HG knockdown significantly suppressed the proliferation, invasion, and migration of pancreatic cancer cells for the first time. In vivo, MIR210HG knockdown significantly inhibited xenograft tumour growth. Thus, MIR210HG plays an oncogenic regulatory role in pancreatic carcinoma, with an unclear underlying mechanism.
The abnormal metabolism of tumour cells is recognized as one of the hallmarks of cancer, in which aerobic glycolysis gets significant attention [Citation40]. Within pancreatic carcinoma, in addition to providing nutrients needed for cell proliferation, aerobic glycolysis also modulates metastasis, immune escape, chemo-resistance and radio-resistance. Glycolysis has been regarded as a potential target within pancreatic carcinoma therapy. Further study of the molecules that modulate aerobic glycolysis may help discover new therapeutic strategies [Citation9]. In the present study, two key regulators of glycolysis, HK2 and PKM2, were positively correlated with MIR210HG; MIR210HG also positively affected the expression of HK2 and PKM2. BAG3 directly stabilizes HK2 mRNA, thereby accelerating glycolysis activity in pancreatic cancer cells [Citation41]. PKM2 promotes cell survival and invasion under metabolic stress by enhancing the Warburg effect in pancreatic ductal adenocarcinoma [Citation42]. Consistently, pancreatic cancer cells were found to suppress aerobic glycolysis by modulating the expression of MIR210HG. MIR210HG knockdown significantly reduced glucose uptake, lactic acid release, ATP levels, and increased PDH activity, suggesting that MIR210HG knockdown inhibits pancreatic cancer cell glycolysis.
So far, the specific effects of MIR210HG on pancreatic cancer cell proliferation, invasion, migration, and glycolysis have been demonstrated; moreover, in the mice model, MIR210HG could affect tumour growth. The molecular mechanism underlying the role of MIR210HG in pancreatic cancer was investigated. Although lncRNA could exert biological functions through multiple mechanisms, the ‘ceRNA hypothesis’ has attracted increasing attention because of the critical role of the reported lncRNA/miRNA/mRNA axis in diseases [Citation43,Citation44]. As previously reported, MIR210HG could de-repress the target genes of miRNAs via serving as a ceRNA sponge within breast cancer [Citation25], osteosarcoma [Citation28], and colorectal adenocarcinoma [Citation45]. MIR210HG was speculated to serve as a ceRNA within pancreatic cancer. Through online tools prediction and experimental validation, miR-125b-5p has been confirmed to target MIR210HG, HK2, and PKM2, respectively. Through direct binding, MIR210HG knockdown upregulated the expression of miR-125b-5p, whereas miR-125b-5p overexpression downregulated HK2 and PKM2 expression. Previously, pancreatic carcinoma patients with low miR-125b-5p levels could independently predict the lowest overall survival [Citation46]. Within gallbladder carcinoma [Citation47], breast carcinoma [Citation48], and bladder carcinoma [Citation49], miR-125b-5p serves as a tumour suppressor miRNA. Herein, the overexpression of miR-125b-5p not only inhibited pancreatic carcinoma cell aggressiveness but also repressed glycolysis. Conversely, the inhibition of miR-125b-5p exerted opposing effects, and significantly reversed the effects of MIR210HG on HK2 and PKM2 expression, pancreatic cancer cell aggressiveness, as well as glycolysis. Thus, MIR210HG, miR-125b-5p, and HK2 and PKM2 form a lncRNA-miRNA-mRNA axis, affecting pancreatic cancer cell phenotypes.
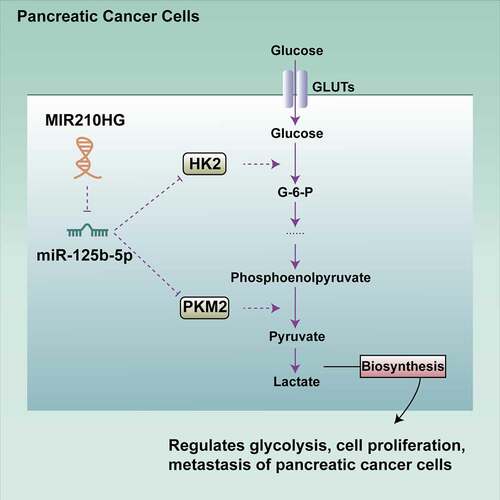
Furthermore, in the tissue samples, MIR210HG expression was positively correlated with HK2 and PKM2 expression. miR-125b-5p expression was negatively correlated with HK2 and PKM2 expression. In conclusion, MIR210HG could affect the pancreatic cancer cell phenotypes, including proliferation, invasion, migration, and glycolysis, through the miR-125b-5p/HK2/PKM2 axis ().
Figure 8. A schematic graph of possible mechanism. MIR210HG could affect the phenotypes of pancreatic cancer cells, including proliferation, invasion, migration, and glycolysis, through the miR-125b-5p/HK2/PKM2 axis
Disclosure of potential conflicts of interest
No potential conflict of interest was reported by the author(s).
Supplemental Material
Download Zip (13.1 MB)Supplementary material
Supplemental data for this article can be accessed here.
Additional information
Funding
Related Research Data
References
- Siegel RL, Miller KD, Jemal A. CA: a cancer journal for clinicians. Cancer Statistics. 2019;69(1).
- Neoptolemos JP, Kleeff J, Michl P, et al. Therapeutic developments in pancreatic cancer: current and future perspectives. Nat Rev Gastroenterol Hepatol. 2018;15(6):333–348.
- Dunne RF, Hezel AF. Genetics and biology of pancreatic ductal adenocarcinoma. Hematol Oncol Clin North Am. 2015;29(4):595–608.
- Ying H, Dey P, Yao W, et al. Genetics and biology of pancreatic ductal adenocarcinoma. Genes Dev. 2016;30(4):355–385.
- Icard P, Shulman S, Farhat D, et al. How the Warburg effect supports aggressiveness and drug resistance of cancer cells? Drug Resist Updat. 2018;38:1–11.
- Liberti MV, Locasale JW. The Warburg effect: how does it benefit cancer cells? Trends Biochem Sci. 2016;41(3):211–218.
- Ganapathy-Kanniappan S. Molecular intricacies of aerobic glycolysis in cancer: current insights into the classic metabolic phenotype. Crit Rev Biochem Mol Biol. 2018;53(6):667–682.
- Buscail L, Bournet B, Dufresne M, et al. [Advance in the biology of pancreatic of cancer]. Bull Cancer. 2015;102(6 Suppl 1):S53–61.
- Halbrook CJ, Lyssiotis CA. Employing metabolism to improve the diagnosis and treatment of pancreatic cancer. Cancer Cell. 2017;31(1):5–19.
- Lu H, Forbes RA, Verma A. Hypoxia-inducible factor 1 activation by aerobic glycolysis implicates the Warburg effect in carcinogenesis. J Biol Chem. 2002;277(26):23111–23115.
- Jin X, Dai L, Ma Y, et al. Implications of HIF-1α in the tumorigenesis and progression of pancreatic cancer. Cancer Cell Int. 2020;20:273.
- Yang J, Ren B, Yang G, et al. The enhancement of glycolysis regulates pancreatic cancer metastasis. Cell Mol Life Sci. 2020;77(2):305–321.
- Golias T, Kery M, Radenkovic S, et al. Microenvironmental control of glucose metabolism in tumors by regulation of pyruvate dehydrogenase. Int J Cancer. 2019;144(4):674–686.
- Mota Reyes C, Yurteri Ü, Friess H, et al. Future directions of neoadjuvant therapy in pancreatic cancer. Oncoscience. 2020;7(7–8):44–46.
- Anastasiadou E, Jacob LS, Slack FJ. Non-coding RNA networks in cancer. Nat Rev Cancer. 2018;18(1).
- Saw PE, et al., Non-coding RNAs: the new central dogma of cancer biology. Science China. Life sciences, 2020.
- Slack FJ, Chinnaiyan AM. The role of non-coding RNAs in oncology. Cell. 2019;179(5):1033–1055.
- Lv Y, Huang S. Role of non-coding RNA in pancreatic cancer. Oncol Lett. 2019;18(4):3963–3973.
- Chandra Gupta S, Nandan Tripathi Y. Potential of long non-coding RNAs in cancer patients: from biomarkers to therapeutic targets. Int J Cancer. 2017;140(9):1955–1967.
- Capula M, Mantini G, Funel N, et al. New avenues in pancreatic cancer: exploiting microRNAs as predictive biomarkers and new approaches to target aberrant metabolism. Expert Rev Clin Pharmacol. 2019;12(12):1081–1090.
- Li Z, Zhao X, Zhou Y, et al. The long non-coding RNA HOTTIP promotes progression and gemcitabine resistance by regulating HOXA13 in pancreatic cancer. J Transl Med. 2015;13(1):84.
- You L, Chang D, Du H-Z, et al. Genome-wide screen identifies PVT1 as a regulator of Gemcitabine sensitivity in human pancreatic cancer cells. Biochem Biophys Res Commun. 2011;407(1):1–6.
- Jiao F, et al. Elevated expression level of long noncoding RNA MALAT-1 facilitates cell growth, migration and invasion in pancreatic cancer. Oncol Rep. 2014;32(6):2485–2492.
- Li D, Qian X, Xu P, et al. Identification of lncRNAs and their functional network associated with chemoresistance in SW1990/GZ pancreatic cancer cells by RNA sequencing. DNA Cell Biol. 2018;37(10):839–849.
- Li X-Y, Zhou L-Y, Luo H, et al. The long noncoding RNA MIR210HG promotes tumor metastasis by acting as a ceRNA of miR-1226-3p to regulate mucin-1c expression in invasive breast cancer. Aging (Albany NY). 2019;11(15):5646–5665.
- Kang X, Kong F, Huang K, et al. <p>LncRNA MIR210HG promotes proliferation and invasion of non-small cell lung cancer by upregulating methylation of CACNA2D2 promoter via binding to DNMT1. Onco Targets Ther. 2019;12:3779–3790.
- Wang A-H, Jin C-H, Cui G-Y, et al. MIR210HG promotes cell proliferation and invasion by regulating miR-503-5p/TRAF4 axis in cervical cancer. Aging (Albany NY). 2020;12(4):3205–3217.
- Li J, Wu Q-M, Wang X-Q, et al. Long Noncoding RNA miR210HG Sponges miR-503 to facilitate osteosarcoma cell invasion and metastasis. DNA Cell Biol. 2017;36(12):1117–1125.
- Ata-Abadi NS, Mowla SJ, Aboutalebi F, et al. Hypoxia-related long noncoding RNAs are associated with varicocele-related male infertility. PloS One. 2020;15(4):e0232357.
- Du Y, Wei N, Ma R, et al. Long Noncoding RNA MIR210HG Promotes the Warburg Effect and Tumor Growth by Enhancing HIF-1α Translation in Triple-Negative Breast Cancer. Front Oncol. 2020;10:580176.
- Jeggari A, Marks DS, Larsson E. miRcode: a map of putative microRNA target sites in the long non-coding transcriptome. Bioinformatics. 2012;28(15):2062–2063.
- Sticht C, De La Torre C, Parveen A, et al. miRWalk: an online resource for prediction of microRNA binding sites. PLoS One. 2018;13(10):e0206239.
- Das MK, Andreassen R, Haugen TB, et al. Identification of endogenous controls for use in miRNA quantification in human cancer cell lines. Cancer Genomics Proteomics. 2016;13(1):63–68.
- Bu X-N, Qiu C, Wang C, et al. Inhibition of DACH1 activity by short hairpin RNA represses cell proliferation and tumor invasion in pancreatic cancer. Oncol Rep. 2016;36(2):745–754.
- Yan L, et al. Glucose metabolism in pancreatic cancer. 2019; 11(10)
- Yamamura S, Imai-Sumida M, Tanaka Y, et al. Interaction and cross-talk between non-coding RNAs. Cell Mol Life Sci. 2018;75(3):467–484.
- Weng W, Zhang Z, Huang W, et al. Identification of a competing endogenous RNA network associated with prognosis of pancreatic adenocarcinoma. Cancer Cell Int. 2020;20(1):231.
- Jiang J, Bi Y, Liu X-P, et al. To construct a ceRNA regulatory network as prognostic biomarkers for bladder cancer. J Cell Mol Med. 2020;24(9):5375–5386.
- Ni J, Zhou S, Yuan W, et al. Mechanism of miR-210 involved in epithelial-mesenchymal transition of pancreatic cancer cells under hypoxia. J Recept Signal Transduct Res. 2019;39(5–6):399–406.
- Counihan JL, Grossman EA, Nomura DK. Cancer metabolism: current understanding and therapies. Chem Rev. 2018;118(14):6893–6923.
- An M-X, Li S, Yao H-B, et al. BAG3 directly stabilizes Hexokinase 2 mRNA and promotes aerobic glycolysis in pancreatic cancer cells. J Cell Biol. 2017;216(12):4091–4105.
- Li C, Zhao Z, Zhou Z, et al. PKM2 Promotes Cell Survival and Invasion Under Metabolic Stress by Enhancing Warburg Effect in Pancreatic Ductal Adenocarcinoma. Dig Dis Sci. 2016;61(3):767–773.
- Zhou M, Diao Z, Yue X, et al. Construction and analysis of dysregulated lncRNA-associated ceRNA network identified novel lncRNA biomarkers for early diagnosis of human pancreatic cancer. Oncotarget. 2016;7(35):56383–56394.
- Wang W, et al. A novel mRNA-miRNA-lncRNA competing endogenous RNA triple sub-network associated with prognosis of pancreatic cancer. Aging (Albany NY). 2019;11(9):2610–2627.
- He Z, et al. Identification of LINC01234 and MIR210HG as novel prognostic signature for colorectal adenocarcinoma. J Cell Physiol. 2019;234(5):6769–6777.
- Zhou X, et al. Plasma miRNAs in diagnosis and prognosis of pancreatic cancer: a miRNA expression analysis. Gene. 2018;673:181–193.
- Yang D, et al. miR-125b-5p enhances chemotherapy sensitivity to cisplatin by down-regulating Bcl2 in gallbladder cancer. Sci Rep. 2017;7:43109.
- Li Y, et al. miR-125b-5p inhibits breast cancer cell proliferation, migration and invasion by targeting KIAA1522. Biochem Biophys Res Commun. 2018;504(1):277–282.
- Liu S, Chen Q, Wang Y. MiR-125b-5p suppresses the bladder cancer progression via targeting HK2 and suppressing PI3K/AKT pathway. Hum Cell. 2020;33(1):185–194.