
 ?Mathematical formulae have been encoded as MathML and are displayed in this HTML version using MathJax in order to improve their display. Uncheck the box to turn MathJax off. This feature requires Javascript. Click on a formula to zoom.
Abstract
Monitoring post-wildfire vegetation trends is key to the management and sustainability of forest ecosystems. The 2011 Bastrop Complex Wildfire provided a unique opportunity to study the effects of wildfire on vegetation in an infrequently studied locale for wildfire research. Using Landsat 5 Thematic Mapper and Landsat 8 Landsat Data Continuity Mission imagery, we investigated the relationship between burn severity and vegetation regeneration while exploring changes in spatial vegetation patterns resulting from the wildfire. Mean normalized difference vegetation index (NDVI) levels increased substantially in the three years after the fire, indicating that vegetation has recovered rapidly in the Bastrop forest, though the overall course of recovery is still uncertain at these early stages. At an aggregate level, the substantial vegetation regrowth in the early post-wildfire years was broadly consistent with previous research, but NDVI trajectories behaved divergently when evaluated by burn severity level. Heavy and moderate burn severity areas experienced a net decline in NDVI during the third year, while more lightly burned areas demonstrated the greatest degree of overall recovery. Continued research will be required to evaluate the long-term effects of the wildfire and determine whether these trends are temporary or lasting.
Introduction
Although the public may perceive of wildfires as massively destructive events, the reality is that most wildfires burn unnoticed. In forested environments, fire is an often beneficial phenomenon necessary for nutrient cycling and decomposition, but its effects on vegetation can be difficult to predict. In some cases, wildfires may decrease vegetation growth rate and productivity, but they can also stimulate more vigorous growth as a result of increased nitrogen availability, the removal of competing species, and the release of soluble minerals to the soil (Ahlgren and Ahlgren Citation1960; Whelan Citation1995). The effects of wildfire on vegetation response are highly variable and will depend upon fire intensity, size, and frequency, as well as a combination of ever-changing environmental determinants, including vegetation type, soil chemical composition, weather, and seed production and dispersal (Ahlgren and Ahlgren Citation1960; Whelan Citation1995).
In recent years, remote sensing techniques have proven to be an effective method of quantifying wildfire burn severity and monitoring post-wildfire vegetation dynamics (Wang et al. Citation2009; Lentile et al. Citation2006; White et al. Citation1996). For forest managers and researchers, remote sensing enables the collection of data at a scale that would otherwise be impractical using field-based methods. Using 5 years of prefire and 3 years of postfire Landsat imagery, we will analyze normalized difference vegetation index (NDVI) values to assess vegetation recovery following the 2011 Bastrop Complex Wildfire. By examining NDVI time-series data and their relationship to post-wildfire burn severity, this study aims to answer the following questions:
What is the trajectory of postfire vegetation regeneration during the early stages of forest recovery in Bastrop?
How is burn severity related to vegetation response?
Literature review
Postfire vegetation recovery
Spectral vegetation indices are frequently used to evaluate the abundance and vigor of green vegetation. In particular, their ability to remotely assess forest health (Lambert et al. Citation2013) over extended periods of time makes them well-suited for the study of post-wildfire vegetation dynamics. The NDVI is the most commonly used vegetation index found in the literature, although a number of others have also been successfully related to field-based measures of post-wildfire vegetation cover and density (Clemente, Cerrillo, and Gitas Citation2009; Potter et al. Citation2012; Vila and Barbosa Citation2010). For the purposes of this study, post-wildfire change in NDVI will serve as a proxy for the level of vegetation recovery in the forest.
The initial post-wildfire years tend to be characterized by the most rapid rate of vegetation recovery and dramatic changes in forest species composition. Using synthetic aperture radar data, Li and Potter (Citation2012) observed an increase in vegetation heterogeneity and patch size during the first two years following wildfires in 2008 on the central California coast. Along with changes in spatial patterns, the fire transformed the formerly pine, oak, and scrub forest into a primarily coastal scrub community.
Clemente, Cerrillo, and Gitas (Citation2009) used Landsat imagery to evaluate forest recovery in the 12 years following a 1993 wildfire in southern Spain. Only three postfire images were analyzed, but gradually increasing NDVI values and changes in vegetation density suggested that the forest was still in the initial stages of succession. Similarly, Vila and Barbosa (Citation2010) analyzed Landsat-derived NDVI following a wildfire in the Liguria region of Italy. NDVI recovery appeared to be inconsistent in the first year after the fire, with many burned areas experiencing a net decline. The largest gains occurred in the third year after the fire, but NDVI values appeared to plateau following the fifth year, never reaching prefire levels over the 8-year postfire study period.
Hope, Tague, and Clark (Citation2007) also used Landsat-derived NDVI values to monitor vegetation recovery following a 1985 wildfire in a southern California chaparral forest. They reported that the largest NDVI gains occurred in the initial post-wildfire year, after which NDVI increased relatively linearly before reaching prefire levels within 10 years. Pre- and postfire spatial vegetation patterns were similar, indicating the resilience of the chaparral forest to wildfire, although variation due to drought revealed the sensitivity of vegetation patterns to post-wildfire weather. Unlike the previous studies, the use of an unburned reference plot for comparison allowed the researchers to control for seasonal and climatic variation and better gauge the extent of forest recovery.
While most time-series studies tend to be conducted on an annual basis, van Leeuwen (Citation2008) took advantage of the Moderate Resolution Imaging Spectroradiometer’s (MODIS’s) 16-day repeat cycle to develop detailed seasonal NDVI trajectories following the 2002 Rodeo-Chediski fire in Arizona. Vegetation appeared to be gradually recovering, but mean NDVI values still lagged significantly behind prefire and control plot values after 5 years. The comprehensive time-series data also revealed differences in the start, end, and peak growing season times between the burned and control plots, suggesting postfire changes in species composition. Expanding on this work, van Leeuwen et al. (Citation2010) reported similar NDVI trajectories for the 1998 Gudalest fire in Spain, the 1999 and 2005 Mt. Carmel wildfires in Israel, and the 2002 Indian fire in Arizona. Overall, mean NDVI values remained below prefire and control plot levels for each site (up to 7 years post-wildfire) and vegetation heterogeneity progressively declined over time.
Due to a lack of historical satellite data, most studies of wildfire vegetation recovery have been limited to a postfire study period of up to about 10 years. Although the initial post-wildfire years tend to demonstrate the greatest degree of transformation, much longer periods of time are required to capture the entire cycle of forest recovery, particularly for slowly maturing tree species. NDVI trajectories tend to stabilize over time, but the wildfire effects can have long-lasting repercussions. Potter (Citation2014) observed the negative effects of wildfires up to 20 years prior on enhanced vegetation index (EVI) values in interior Alaska using MODIS imagery. Another long-term post-wildfire study used spectral vegetation indices to measure lodgepole pine density in Yellowstone National Park, nearly 20 years following 1998 wildfires (Potter et al. Citation2012). Similar to the findings of van Leeuwen et al. (Citation2010), sapling density tended to become more homogenous over time, and areas of low sapling density demonstrated the greatest increase in areal coverage. High-density patches were more slow to develop, although lower density patches may actually provide a more fertile opportunity for future sapling growth (Wilder, Holtzclaw, and Clebsch. Citation1999).
Burn severity
Beyond the presence or absence of wildfire, the degree of damage to the ecosystem caused by wildfire will have a significant impact on vegetation response, both in terms of composition and recovery rate. Johnstone and Chapin (Citation2006) tested the effects of soil burn severity on boreal forest regrowth at several burn sites in Alaska and the Yukon Territory, revealing the species-specific response to burn severity levels. High burn severity soils tended to favor the growth of herbaceous and deciduous species, while lower severity burns were more amenable to serotinous species such as spruce or pine. Similarly, Johnstone and Kasischke (Citation2005) demonstrated that aspen sapling density was positively related to fire severity, in contrast to black spruce density, which declined in the 8 years after a 1994 central Alaska wildfire. These findings were also consistent with those of Mitchell and Yuan (Citation2010), who used Landsat imagery to examine the effects of the 2000 Jasper fire on a South Dakota ponderosa pine forest. They reported the rapid regeneration of grasses and shrubs in more heavily burned areas, but no indication of pine saplings in the 5 years after the fire.
Burn severity will also influence the rate of vegetation regeneration. Higher levels of burn severity have been associated with greater postfire NDVI recovery for a 1994 wildfire in the Barcelona province of Spain (Díaz-Delgado, Lloret, and Pons Citation2003). Another study of the 2000 Jasper wildfire (Lentile, Smith, and Shepperd Citation2005) used unsupervised burn severity classification to reveal that high-severity areas had not yet exhibited any pine regrowth 3 years following the fire. In areas of low and moderate burn severity, tree mortality more than doubled between the second and third post-wildfire year (high-severity areas experienced 100% mortality). They also noted a dramatic modification to the spatial distribution of sapling density, suggesting potential long-term changes to the forest structure.
Other researchers have evaluated vegetation response using remotely sensed burn severity indices, which have been strongly correlated with field-based measures of severity in forested environments (Epting, Verbyla, and Sorbel Citation2005). Exploring vegetation effects immediately following a series of wildfires in California chaparral, Lentile et al. (Citation2007) found that grasses and shrubs established most quickly in the first year after fire. Overall, vegetation response was highly variable across burn severity levels, although it is possible that burn severity effects would become more apparent over a longer period of study.
Remotely sensed burn severity indices have also been examined in conjunction with vegetation indices. Jin et al. (Citation2012) explored time-series MODIS imagery to understand the effects of burn severity on vegetation regeneration following wildfire in western Canada. EVI values tended to follow a similar pattern: a decline in the first year, followed by a rapid increase over the next three years, and then a gradual leveling-off. The authors did not find a significant correlation between the differenced normalized burn ratio (dNBR) and EVI, although high burn severity areas had a significantly greater loss in initial EVI, as well as a greater postfire increase. Despite starting with lower initial postfire EVI, EVI levels in high-severity areas approached those in low-severity areas within approximately 6 years.
Similarly, Epting and Verbyla (Citation2005) analyzed the relationship between dNBR and NDVI after the 1986 Eureka Creek fire in Alaska. The authors reported that postfire NDVI reached its peak 14 years after the fire, though there were a number of years absent of data. Similar to Jin et al. (Citation2012), the authors found that higher burn severity areas exhibited the highest initial decrease in NDVI as well as the greatest long-term recovery. An examination of NDVI recovery by vegetation class revealed that the proportion of forested area declined over the course of the study period while woodlands and shrublands grew more prevalent.
Summary
A review of relevant research has revealed that the postfire recovery period in forested regions typically lasts at least 10–20 years, but vegetation response is highly variable. Because of the numerous environmental factors that can influence the nature of postfire vegetation dynamics, it is necessary to examine wildfire response across a variety of locales. In the wildfire literature, attention has predominantly been paid to Mediterranean environments and boreal forests, while studies in the United States tend to focus only on the western states. Little is currently known about wildfire response in the southern United States.
Remote sensing techniques are now commonly used to assess burn severity and vegetation recovery, but few studies have integrated field data to validate spectral measures. This is of particular importance in areas where wildfire research is not widespread. Additionally, a number of studies have assessed burn severity or postfire vegetation recovery independently, but fewer have attempted to examine their relationship, which could be invaluable to forest managers in the aftermath of a wildfire. This study aims to fill the gaps identified in the literature by using remotely sensed imagery to examine the link between burn severity and vegetation regeneration in a region where wildfire research is lacking.
Data and methods
Study area
Bastrop County is located in east-central Texas, where summers are typically hot and dry and winters are mild. The area is prone to extreme weather events including drought and flooding, and relief is mild with elevations ranging between approximately 90 and 180 m above sea level. Near the center of the county lies the “Lost Pines” forest, a 181 km2 stand of loblolly pines (Pinus taeda) disjunct from the Piney Woods over 160 km to the east. This unique population represents the westernmost extent of loblolly pine trees in the United States and is the primary habitat for the endangered Houston toad (Bufo houstonensis).
Loblolly pines tend to grow quickly and their post-wildfire establishment is beneficial for soil stabilization. Mature pines are somewhat fire-tolerant and can survive low- to moderate-severity fires thanks to their crown height and bark thickness (Carey Citation1992). At one time, loblolly pines extended as far west as the Edwards Plateau in Texas, but gradual warming and drought following the Pleistocene may have compressed the population into its current arrangement within Bastrop County (Al-Rabab’ah and Williams Citation2004). Although related to the loblolly pines found in East Texas, the pines in Bastrop are more resilient and better acclimated to drought with adaptations such as a shorter height and thicker waxy coating on their needles. Although pines comprise much of the fuel in the Lost Pines, other vegetation includes oaks (Quercus spp.), yaupon (Ilex vomitoria), ashe juniper (Juniperus ashei), shrubs, and grasses (Ridenour et al. Citation2012). Prior to human settlement, fires occurred on an approximate 35-year cycle in Central Texas (Al-Rabab’ah and Williams Citation2004).
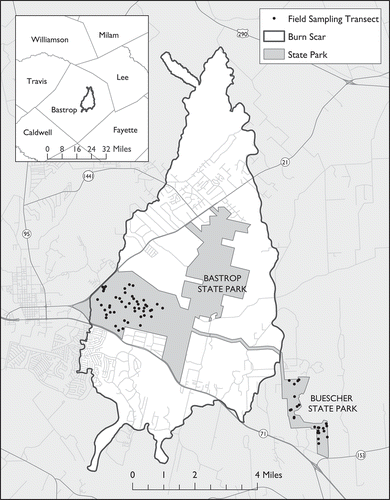
On 4 September 2011, three independent fires converged to form the 2011 Bastrop Complex Wildfire. The first fire ignited in the Circle D-KC neighborhood as a result of fallen power lines, 10 km northeast of Bastrop, while a second fire ignited to the north approximately 30 minutes later. The two fires merged within hours and spread south, passing through Bastrop State Park and crossing Highway 71. A third fire broke out south of the highway and merged with the larger fire, traveling as far south as the Colorado River. The fire was declared controlled on 10 October, 36 days after its original ignition. In total, the fire burned over 131 km2 (including 96% of the state park) (), resulted in two deaths, and destroyed 1696 homes and commercial buildings, ranking as the third worst in US history in terms of homes lost (Ridenour et al. Citation2012). Overall, drought and atypically hot weather resulted in the 2010–2011 Texas wildfire season (15 November 2010–31 October 2011) being the most destructive in state history (Texas Forest Service Citation2011).
Figure 1. Map of the study area with the burn scar and field sampling locations.
Data acquisition and preprocessing
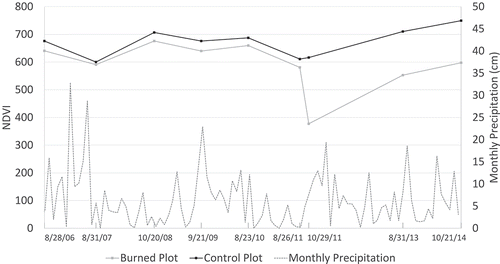
Nine Landsat images were acquired (path 27, row 39) spanning the period from 2006 to 2014 (). Six prefire cloud-free Landsat 5 Thematic Mapper (TM) images were selected between late August and late October due to their proximity to the fire’s anniversary date. Postfire data consisted of a Landsat 5 TM scene, dated 29 days after fire containment, and two Landsat 8 Landsat Data Continuity Mission (LDCM) scenes dated approximately 2 and 3 years after the fire. Unfortunately, no suitable cloud-free imagery was available near the fire’s anniversary date in 2012.
Table 1. Landsat imagery (path 27, row 39).
Following data acquisition, images were radiometrically calibrated and atmospherically corrected to permit multitemporal comparison. For radiometric calibration, digital numbers (DNs) were converted to at-sensor radiance using Equation (1) and the band-specific bias and gain coefficients provided by Chander, Markham, and Helder (Citation2009) for Landsat 5 imagery, and found within the image metadata for Landsat 8 imagery:
where Lλ is at-sensor spectral radiance, ML is the band-specific multiplicative rescaling factor, DN is quantized and calibrated standard pixel values, and AL is the band-specific additive rescaling factor. Images were then converted to surface reflectance and relatively atmospherically corrected using the dark object subtraction (DOS) method using Equation (2) provided by Song et al. (Citation2001):
where pλ is surface reflectance, Lλ is at-sensor spectral radiance, Lp1% is 1% corrected path radiance, d is earth–sun distance, ESUN is exo-atmospheric solar irradiance (Landsat 8 values provided by GIS Ag Maps [Citation2013]), z is solar zenith angle, Tv is atmospheric transmittance from the ground surface to the sensor, Tz is atmospheric transmittance from the sun to the ground surface and Edown is downwelling diffuse irradiance. Under the basic DOS model, atmospheric transmittance and downwelling are ignored, so Tv and Tz was assumed to be 1 and Edown 0. Atmospheric haze was accounted for by calculating path radiance adjusted by a 1% correction factor (as it is unlikely for a surface to be entirely spectrally black) using Equation (3):
where Lp1% is 1% corrected path radiance and Lp.low is the lowest, or darkest, DN with at least 1000 pixels, selected with the aid of band histogram analysis for the red and near infrared (NIR) bands. Correction was not applied to the shortwave infrared (SWIR) band, which is generally insensitive to atmospheric haze. Rather, this band was converted directly to top of atmosphere reflectance using Equation (4):
Field data
Field data were collected over the course of six different days between 15 September and 6 October 2013. Percent vegetation cover (PVC) was measured using the line-intercept method, which calculates the proportion of green vegetation intersecting a sample of transects. Vegetation measurements for the burned plot were gathered within Bastrop State Park; Buescher State Park was selected as a control plot due to its adjacency to the burn scar and similarity in terms of forest composition and environmental conditions. Forty-eight transects were randomly sampled within the burned plot, while 24 transects were sampled in the unburned control plot. Fewer transects were sampled in the unburned plot due to its smaller areal coverage and greater level of homogeneity. To capture the full range of variation in burn severity, transect locations in the burned plot were stratified by burn severity class, ensuring that all levels of severity were represented. Because significant portions of Bastrop State Park still remained closed to the public during the fall of 2013, burned plot sampling was restricted to the area west of Harmon Road.
After navigating to each sampling point with the aid of a Trimble GeoExplorer 6000 XH Global Position System (GPS) unit, transects were delineated using predetermined random azimuths. Due to practical considerations, 25 m transects were used, slightly shorter than the 30 m resolution of Landsat imagery. Transect start and end points were recorded with the GPS unit, after which the proportion of vegetation intersecting each transect was measured. Both understory and overstory vegetation were accounted for, with the aid of a right angle prism to assist in estimating the forest crown layer. Based on these measurements, PVC was calculated for each transect according to Equation (5):
where PVC is percent vegetation cover, V is the total distance intercepted by vegetation, and d is the length of the transect (25 m). Nonparametric Spearman’s correlation analysis was subsequently conducted to relate PVC to Landsat-derived NDVI.
Normalized difference vegetation index
The NDVI is the most widely employed spectral vegetation index for post-wildfire vegetation assessment, having been successfully used in a variety of diverse environments (e.g., Hope, Tague, and Clark Citation2007; Cuevas-González et al. Citation2009; van Leeuwen et al. Citation2010; Clemente, Cerrillo, and Gitas Citation2009; Díaz-Delgado, Lloret, and Pons Citation2003; Goetz, Fiske, and Bunn Citation2006; Hicke et al. Citation2003). It is calculated as a normalized ratio of the NIR and red bands (Landsat TM bands 4 and 3; Landsat LDCM bands 5 and 4) using Equation (6):
where NIR is the IR band and Red is the visible red band. For simpler interpretation, NDVI values were multiplied by a scalar of 1000 as is commonly done with the NBR. Before relating NDVI with field-measured PVC, the focal mean for each cell was calculated using a 3 × 3 neighborhood, which had the effect of smoothing the data and better accounting for pixel-to-pixel variation. PVC sampling points (generated at the center of each transect) were then associated with their respective NDVI focal means.
It should be noted that inconsistencies in bandwidth designations between Landsat 5 and Landsat 8 imagery make between-image comparisons not entirely analogous, though this is not expected to meaningfully impact the analysis. In order to reduce the effects of atmospheric absorption, Landsat 8 employs slightly narrower red and NIR bands than Landsat 5 TM (0.64–0.67 µm versus 0.63–0.69 µm for the red band; 0.85–0.88 µm versus 0.76–0.90 µm for the NIR band) (National Aeronautics and Space Administration (NASA) Citation2010). Li, Jiang, and Feng (Citation2014) conducted a comparison of Landsat 8 and Landsat 7 ETM+ NDVI values, reporting differences within the range of just ±0.05 and an average correlation coefficient value of R2 = 0.99. While our study employs Landsat 5 TM rather than Landsat 7 ETM+ imagery, it would be reasonable to conclude that the similarities would extend given the nearly identical bandwidth ranges for Landsat 5 TM and Landsat 7 ETM+ in the red and NIR bands.
Burn severity
The dNBR employs a bi-temporal approach to measure the change in NBR between pre- and postfire imagery. The NBR was initially developed for use in the western United States where it has been found to strongly correlate with the field-measured composite burn index (Van Wagtendonk, Root, and Key Citation2004). The dNBR has also been effective in evaluating burn severity in other regions including New Mexico (Kokaly et al. Citation2007) and a southern Appalachian pine-oak forest (Wimberly and Reilly Citation2007). The relative dNBR is a variant of dNBR that can potentially characterize burn impacts more accurately in less densely vegetated woodlands or grasslands (Miller and Thode Citation2007), but may be less suitable for forested areas (Hudak et al. Citation2007; Soverel, Perrakis, and Coops Citation2010). Based on its widespread use and demonstrated suitability across a variety of forested environments, we chose to use dNBR to estimate wildfire burn severity.
The dNBR first requires calculation of the NBR, which is a normalized ratio of the Landsat NIR and SWIR bands. Typically a multiplier of 1000 is applied as the results are simpler to interpret as larger whole numbers (Equation (7)):
where SWIR is the SWIR band (Landsat TM band 7). Upon computation of the NBR, dNBR is simply the difference between pre- and postfire NBR values (Equation (8)).
Due to the absence of immediate postfire field data, classes were calibrated according to the burn severity data for Bastrop State Park reported by Ridenour et al. (Citation2012), resulting in four severity classes: unburned/scorched, lightly burned, moderately burned, and heavily burned. Following Kolmogorov–Smirnov tests indicating non-normal distributions for NDVI (p < 0.0005), nonparametric Spearman’s correlation analysis was used to assess the relationship between NDVI and dNBR, along with Kruskal–Wallis and post hoc Mann–Whitney U tests to reveal differences in NDVI across burn severity classes.
Results
Burned and unburned PVC using field data
Mann–Whitney U testing revealed that mean PVC for the burned plot (PVCburned) was significantly lower than the control plot (U = 205.5, p < 0.0005, n = 72), with measurements of 57.2% and 85.5%, respectively. Sample transects within the burned plot ranged from 6.2% to 95.6% PVC and exhibited higher variance than the control plot (SDburned = 27.3; SDcontrol = 17.8), indicating an increase in spatial heterogeneity following wildfire. Within the control plot, PVC values ranged from 37.6% to 100%, with one-third of transects assessed as being 100% intersected by vegetation. A follow-up bivariate correlation analysis between PVC and NDVI revealed a moderate linear relationship (Spearman’s rho = 0.73, p < 0.0005), indicating that NDVI served as a reasonable representation of the forest’s vegetation cover.
Pre- and postfire NDVI
Prefire imagery indicated that despite annual fluctuations in NDVI the between-plot differences were minimal. NDVIburned consistently ranged between 1.6% and 5.5% below NDVIcontrol for the 5 years of imagery preceding the fire ( and ), and the mean difference of −4.3% was used to normalize NDVIburned in order to more accurately represent wildfire vegetation loss. Immediately following the fire NDVIburned declined substantially to 377.2 (65.0% of prefire levels), representing a scaled loss of −36.2% relative to the control plot. Within just 3 years, rapid recovery resulted in NDVIburned actually surpassing prefire levels, though this was partially indicative of an overall increase in NDVI throughout the area; despite considerable vegetation regrowth, normalized NDVIburned still lagged behind NDVIcontrol by −16.8%. Like van Leeuwen et al. (Citation2010), the coefficient of variation (CV) of NDVI was used to approximate vegetation heterogeneity. Heterogeneity was highest immediately following the fire (0.30), with CV declining in the second and third year to near prefire levels.
Table 2. Mean NDVI: burned plot and control plot.
Figure 2. Mean NDVI for the burned and control plots and monthly precipitation totals (NOAA Citation2014), 2006–2014. Burned plot NDVI initially decreased by 35% following the fire, but exhibited rapid recovery levels in the ensuing years.
Burn severity (dNBR)
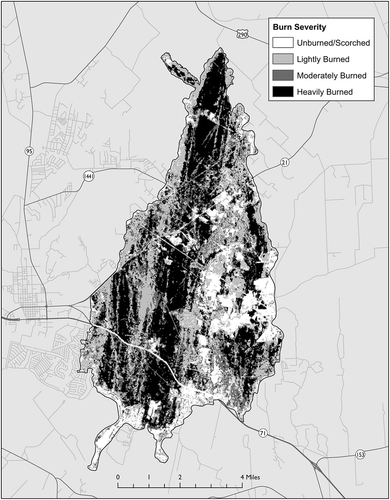
Burn severity class thresholds were calibrated using the data reported by Ridenour et al. (Citation2012), resulting in four classes: unburned/scorched (dNBR values ranging from 0 to 119), lightly burned (120–278), moderately burned (279–568), and heavily burned (569–1000). The heavily burned class comprised the largest proportion of the burned area at 32.6%, followed by lightly burned (28.5%), moderately burned (22.0%), and unburned/scorched (16.9%) (). Based on field estimates, nearly every tree was lost in moderately and heavily burned areas while understory vegetation was entirely consumed in lightly, moderately, and heavily burned areas (see Ridenour et al. (Citation2012) for further description of burn severity classes).
Figure 3. Burn severity map based on pre- and postfire dNBR classification. Heavily burned areas were most prevalent (32.6%), followed by lightly burned (28.5%), moderately burned (22.0%), and unburned/scorched areas (16.9%).
Burn severity and NDVI
and present NDVI by burn severity class, revealing the effects of fuel characteristics on wildfire severity. Areas categorized as heavily burned had a mean NDVI of 640.1 immediately preceding the fire compared with just 440.5 for unburned/scorched areas. Prefire mean NDVI for lightly burned and moderately burned areas was similar at 588.0 and 596.0, respectively. Along with higher NDVI, the groups exhibited decreased variance with greater levels of burn severity, suggesting that fire was likelier to occur in densely vegetated stands. Initial postfire imagery revealed that NDVI declined sharply for the lightly, moderately, and heavily burned classes, but increased slightly in unburned/scorched areas. Heavily burned areas were most affected by the fire with a decrease in mean NDVI of 54.1% compared with 40.4% and 24.2% for moderately and lightly burned areas, respectively. Pairwise Mann–Whitney U at each severity level confirmed that pre- and postfire NDVI differed significantly at the 0.0005 level.
Table 3. Mean NDVI by burn severity class.
Figure 4. Mean NDVI by burn severity class, 2006–2014. Unburned/scorched and lightly burned areas demonstrated consistently positive post-wildfire NDVI gains, in contrast to moderately and heavily burned forest that lost NDVI in the third post-wildfire year.
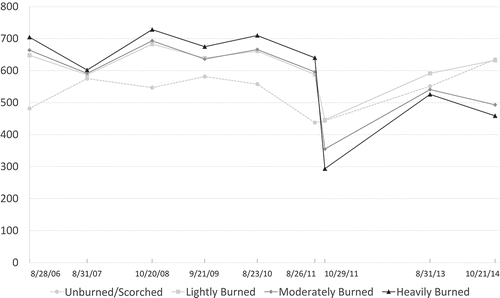
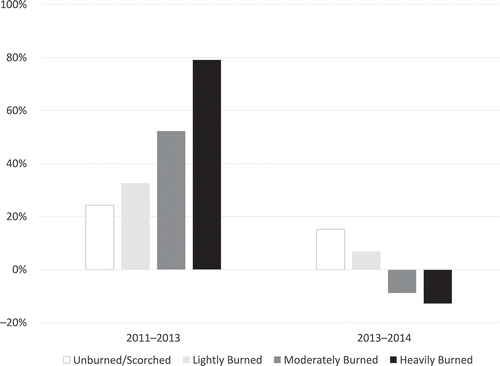
The 2013 image revealed an overall increase in postfire NDVI of 46.6%, with greater levels of vegetation recovery in higher severity areas both in terms of absolute and relative change. Interestingly, this trend abruptly changed direction the following year (i.e., 2014). The greatest growth in NDVI occurred in unburned/scorched areas, while moderately and heavily burned areas experienced a net decline (). Also, changing directionality was the association between NDVI and burn severity. Bivariate Spearman’s correlation analysis between NDVI and dNBR (evaluated as a continuous variable) indicated that higher burn severity was positively associated with NDVI for each year before the fire (p < 0.0005). In contrast, a significant inverse relationship was found for all postfire pairings (p < 0.0005), indicating higher levels of NDVI in the least fire-damaged areas. Despite having the lowest absolute NDVI, heavily burned areas still demonstrated the greatest relative increase in NDVI over the 3-year postfire period.
Figure 5. Postfire change in NDVI by burn severity class, 2011–2013 and 2013–2014. NDVI growth initially favored more heavily burned areas between 2011 and 2013, but the relationship reversed in the following year.
Findings/discussion
Postfire vegetation recovery
An overall increase in NDVI of 58.5% revealed rapid vegetation recovery in the first three years after the fire as shrubs and forbs began to take hold following the stand-replacing fire. These findings contrast those of some earlier studies that have reported that vegetation indices are initially depressed or declining for the first 1–2 years following wildfire (Epting and Verbyla Citation2005; Jin et al. Citation2012; van Leeuwen Citation2008; van Leeuwen et al. Citation2010), although the lack of 2012 imagery makes it difficult to know with certainty. It may have been the case that higher than average rainfall contributed to more favorable growing conditions in the year after the fire (), but climatic changes alone cannot account for the significant decrease in NDVI observed in some areas. It should also be noted that the high recovery rate over the first two years may partially reflect phenological differences between image dates. While 2011 and 2014 postfire images were both acquired in late October, a lack of suitable imagery in 2013 due to cloud cover necessitated the acquisition of an image from 31 August of that year. Care should be taken when interpreting NDVI changes using the 2013 data as mismatches in image dates make it difficult to accurately characterize vegetation trajectories. Despite this limitation, the closely matched 2011 and 2014 images still allow for reasonable estimates of overall recovery in the first three post-wildfire years.
Consistent with the findings of van Leeuwen et al. (Citation2010), vegetation heterogeneity peaked immediately following the wildfire and will likely continue as the landscape stabilizes. NDVI was also related to field-measured PVC through bivariate correlation analysis, validating the spectral data within the study area. The Spearman’s rho value of 0.73 indicated a moderately strong linear association, making it a reasonable proxy for PVC, although the relationship was somewhat weaker than the findings of previous researchers. Because NDVI is sensitive to variations in vegetation density, this disparity may have resulted from the aggregation of crown and understory layers when field sampling transects; for ease of data collection, single and overlapping vegetation layers were not distinguished. The somewhat lower-than-expected correlation may also reflect phenological variation, given that field sampling that took place over a 3-week period was associated with a single Landsat image.
At this point it is still too early to predict the length of the recovery period, and ongoing loblolly pine restoration efforts by volunteers and the Texas Parks and Wildlife Department make forecasting even more difficult. Even characterizing what constitutes “recovery” is problematic, as a full NDVI recovery does not necessarily indicate that past forest conditions have returned; it will likely take much longer before newly established postfire loblolly pine seedlings fully mature. As it stands now, NDVI has returned to 2011 prefire levels but still lags behind the unburned control plot, revealing the degree of vegetation loss still to be overcome. Rapid regrowth in the initial postfire years made up much of that difference, but slowed growth in the third year suggests that it may be many more years before the forest will return to its prior form.
Burn severity and vegetation response
dNBR was positively related to prefire NDVI, which was unsurprising given the greater opportunity for vegetation loss in heavily vegetated areas. More heavily burned areas experienced the greatest initial postfire decline in NDVI, supporting postfire field observations suggesting that understory vegetation was top-killed in lightly burned areas, but completely killed in more heavily burned areas (Ridenour et al. Citation2012). In the three years following the fire, the relationship between burn severity and vegetation response was somewhat more complex. Heavily and moderately burned forest exhibited the most dramatic postfire NDVI growth from 2011 to 2013 (79.1% and 52.2%, respectively), while gains in the unburned/scorched and light severity classes were more moderate. In the subsequent year (2013–2014), overall growth in NDVI slowed to 8.1%, primarily driven by an unexpected decline in heavy and moderate burn severity areas. A longer-term longitudinal analysis will be required to determine whether the downward trajectory for these classes is merely an anomaly or indicative of a lasting trend.
Previous research has indicated that higher burn severity can promote the regeneration of deciduous or herbaceous species (Epting and Verbyla Citation2005; Jin et al. Citation2012; Johnstone and Kasischke Citation2005; Johnstone and Chapin Citation2006) by increasing the exposure of mineral soils and humus and improving soil moisture content (Johnstone and Chapin Citation2006). Conversely, higher severity may actually be detrimental to the reestablishment of coniferous species (Johnstone and Kasischke Citation2005; Lentile, Smith, and Shepperd Citation2005; Mitchell and Yuan Citation2010). In the case of this study, higher severity appeared to promote growth in the mixed Bastrop forest only during the first two postfire years. Examining the entire study period, unburned/scorched and lightly burned areas exhibited the greatest absolute change in NDVI followed by heavy and moderate burn severity areas, although heavily burned areas had the largest relative growth (56.3%). Unburned/scorched areas appeared to be the greatest beneficiary of the wildfire, being the only class with a higher postfire NDVI than in any of the prefire years.
Within burn severity groups, there were significant differences in pre- and postfire NDVI for all pairings. The moderate and heavy burn severity classes appear to be following comparable postfire trajectories, with large gains over the first two years and a decline in the third. Mean NDVI for lightly and moderately burned areas were nearly the same before the fire, but their divergent postfire behavior suggests that their differences in burn severity may be better explained by spatial variance rather than vegetation characteristics.
Overall, mean NDVI returned to 2011 prefire levels within 3 years – much quicker than previous studies have reported – but forest recovery is far from complete as much of this growth is indicative of favorable growing conditions in recent years. Compared to the unburned control plot, scaled NDVI values were still 16.8% lower in 2014. Wildfire has also altered the forest landscape dramatically, especially in higher severity areas where total pine mortality has led to increased understory vegetation diversity (Brown et al. Citation2014). Because densely vegetated areas were most heavily impacted by the wildfire, they now represent areas with the lowest NDVI as the pattern of vegetation flipped.
Conclusion
This study sought to both characterize post-wildfire vegetation regeneration following the 2011 Bastrop Complex Wildfire, as well as better understand the relationship between burn severity and vegetation response. Overall, we found that vegetation has rapidly recovered in the first three years following the devastating wildfire. Grasses and forbs appear to be taking advantage of more favorable growing conditions during this initial stage of forest succession. Mean NDVI within the burned plot returned to 2011 prefire levels, but still lagged significantly behind the control plot. Even as the gap narrows over the coming years, changes in forest composition and spatial vegetation patterns make it uncertain whether the forest will ever return to its former state.
With regard to the relationship between burn severity and vegetation response, analysis of NDVI by burn severity class demonstrated the complexities inherent to postfire vegetation dynamics. Initially, heavily burned areas appeared to be recovering most quickly, but the most recent data contradict that trend. The largest post-wildfire increase in NDVI after 3 years occurred in unburned/scorched areas, which had a higher NDVI in 2014 than was measured in any prefire year, suggesting that low-severity burns stimulated growth in sparsely vegetated areas. While burn severity impacted post-wildfire vegetation recovery, the relationship does not appear to be unidirectional. Higher-severity burns were associated with more densely vegetated areas, suggesting that prefire vegetation characteristics were a driver of burn severity.
Some limitations should be considered when interpreting the results of this study. Although an effort was made to acquire annual images as close as possible to the fire’s anniversary date, the lack of suitable imagery in some cases due to cloud cover resulted in phenological errors. Absolute changes in NDVI, particularly when involving 2013 data, should be evaluated with this point in mind. Relative within-image differences calculated between the burned plot and control plot, or between burn severity classes, are insensitive to phenological errors and likely provided more reliable results. Additionally, due to the relatively short 3-year postfire study period there is still great uncertainty regarding the rate of forest recovery. Continued NDVI time-series analysis will be able to capture the secondary stages of forest succession and allow for greater predictive confidence. Future researchers may also wish to collect species-specific field data to monitor the reemergence of loblolly pines and to determine the effectiveness of recent replanting efforts.
This study contributes to the literature by integrating 8 years of Landsat imagery validated with field data to assess the early effects of a notable Texas wildfire. Wildfire dynamics are infrequently studied in this area of the United States and already interesting trends have been observed. Continued monitoring of this unique study area is warranted as it will likely be many years before the forest recovers and the consequences of the fire are fully understood.
Disclosure statement
No potential conflict of interest was reported by the authors.
Acknowledgements
The authors would like to thank Dr. Jennifer Jensen (Texas State University) for her guidance and review of an earlier version of this paper. The authors would also like to acknowledge the wildfire assessment conducted by Karen Ridenour and her group at the Texas Forest Service that facilitated this research. The authors appreciate three anonymous reviewers for their constructive comments.
References
- Ahlgren, I. F., and C. E. Ahlgren. 1960. “Ecological Effects of Forest Fires.” The Botanical Review 26 (4): 483–533. doi:10.1007/BF02940573.
- Al-Rabab’ah, M. A., and C. G. Williams. 2004. “An Ancient Bottleneck in the Lost Pines of Central Texas.” Molecular Ecology 13 (5): 1075–1084. doi:10.1111/j.1365-294X.2004.02142.x.
- Brown, D. J., W. H. Nowlin, E. Ozel, I. Mali, D. Episcopo, M. C. Jones, and M. R. J. Forstner. 2014. “Comparison of Short Term Low, Moderate, and High Severity Fire Impacts to Aquatic and Terrestrial Ecosystem Components of a Southern USA Mixed Pine/Hardwood Forest.” Forest Ecology and Management 312: 179–192. doi:10.1016/j.foreco.2013.10.006.
- Carey, J. 1992. Pinus Taeda. Missoula, MT: Forest Service, Rocky Mountain Research Station, Fire Sciences Laboratory.
- Chander, G., B. L. Markham, and D. L. Helder. 2009. “Summary of Current Radiometric Calibration Coefficients for Landsat MSS, TM, ETM+, and EO-1 ALI Sensors.” Remote Sensing of Environment 113 (5): 893–903. doi:10.1016/j.rse.2009.01.007.
- Clemente, R. H., R. M. N. Cerrillo, and I. Z. Gitas. 2009. “Monitoring Post-Fire Regeneration in Mediterranean Ecosystems by Employing Multitemporal Satellite Imagery.” International Journal of Wildland Fire 18 (6): 648–658.
- Cuevas-González, M., F. Gerard, H. Balzter, and D. Riaño. 2009. “Analysing Forest Recovery after Wildfire Disturbance in Boreal Siberia Using Remotely Sensed Vegetation Indices.” Global Change Biology 15 (3): 561–577. doi:10.1111/j.1365-2486.2008.01784.x.
- Díaz-Delgado, R., F. Lloret, and X. Pons. 2003. “Influence of Fire Severity on Plant Regeneration by Means of Remote Sensing Imagery.” International Journal of Remote Sensing 24 (8): 1751–1763. doi:10.1080/01431160210144732.
- Epting, J., and D. Verbyla. 2005. “Landscape-Level Interactions of Prefire Vegetation, Burn Severity, and Postfire Vegetation over a 16-Year Period in Interior Alaska.” Canadian Journal of Forest Research 35 (6): 1367–1377. doi:10.1139/X05-060.
- Epting, J., D. Verbyla, and B. Sorbel. 2005. “Evaluation of Remotely Sensed Indices for Assessing Burn Severity in Interior Alaska Using Landsat TM and ETM+.” Remote Sensing of Environment 96 (3–4): 328–339. doi:10.1016/j.rse.2005.03.002.
- GIS Ag Maps. 2013. “Landsat 8 ESUN (for Atmospheric Correction), Radiance, and TOA Reflectance.” http://www.gisagmaps.com/landsat-8-atco/.
- Goetz, S. J., G. J. Fiske, and A. G. Bunn. 2006. “Using Satellite Time-Series Data Sets to Analyze Fire Disturbance and Forest Recovery across Canada.” Remote Sensing of Environment 101 (3): 352–365. doi:10.1016/j.rse.2006.01.011.
- Hicke, J. A., G. P. Asner, E. S. Kasischke, N. H. F. French, J. T. Randerson, G. J. Collatz, B. J. Stocks, C. J. Tucker, S. O. Los, and C. B. Field. 2003. “Postfire Response of North American Boreal Forest Net Primary Productivity Analyzed with Satellite Observations.” Global Change Biology 9 (8): 1145–1157. http://onlinelibrary.wiley.com/doi/10.1046/j.1365-2486.2003.00658.x/full
- Hope, A., C. Tague, and R. Clark. 2007. “Characterizing Post-Fire Vegetation Recovery of California Chaparral Using TM/ETM+ Time-Series Data.” International Journal of Remote Sensing 28 (6): 1339–1354. doi:10.1080/01431160600908924.
- Hudak, A. T., P. Morgan, M. J. Bobbitt, A. M. S. Smith, S. A. Lewis, L. B. Lentile, P. R. Robichaud, J. T. Clark, and R. A. McKinley. 2007. “The Relationship of Multispectral Satellite Imagery to Immediate Fire Effects.” Fire Ecology 3 (1): 64–90. doi:10.4996/fireecology.0301064.
- Jin, Y., J. T. Randerson, S. J. Goetz, P. S. A. Beck, M. M. Loranty, and M. L. Goulden. 2012. “The Influence of Burn Severity on Postfire Vegetation Recovery and Albedo Change During Early Succession in North American Boreal Forests.” Journal of Geophysical Research: Biogeosciences 117 (G1): 1–15. doi:10.1029/2011JG001886.
- Johnstone, J. F., and F. S. Chapin. 2006. “Effects of Soil Burn Severity on Post-Fire Tree Recruitment in Boreal Forest.” Ecosystems 9 (1): 14–31. doi:10.1007/s10021-004-0042-x.
- Johnstone, J. F., and E. S. Kasischke. 2005. “Stand-Level Effects of Soil Burn Severity on Postfire Regeneration in a Recently Burned Black Spruce Forest.” Canadian Journal of Forest Research 35 (9): 2151–2163. doi:10.1139/X05-087.
- Kokaly, R. F., B. W. Rockwell, S. L. Haire, and T. V. V. King. 2007. “Characterization of Post-Fire Surface Cover, Soils, and Burn Severity at the Cerro Grande Fire, New Mexico, Using Hyperspectral and Multispectral Remote Sensing.” Remote Sensing of Environment 106 (3): 305–325. doi:10.1016/j.rse.2006.08.006.
- Lambert, J., C. Drenou, J.-P. Denux, G. Balent, and V. Cheret. 2013. “Monitoring Forest Decline through Remote Sensing Time Series Analysis.” GIScience & Remote Sensing 50 (4): 437–457. doi:10.1080/15481603.2013.820070.
- Lentile, L. B., Z. A. Holden, A. M. S. Smith, M. J. Falkowski, A. T. Hudak, P. Morgan, S. A. Lewis, P. E. Gessler, and N. C. Benson. 2006. “Remote Sensing Techniques to Assess Active Fire Characteristics and Post-Fire Effects.” International Journal of Wildland Fire 15 (3): 319–345. doi:10.1071/WF05097.
- Lentile, L. B., P. Morgan, A. T. Hudak, M. J. Bobbitt, S. A. Lewis, A. M. S. Smith, and P. R. Robichaud. 2007. “Post-Fire Burn Severity and Vegetation Response Following Eight Large Wildfires Across the Western United States.” Fire Ecology 3 (1): 91–108. doi:10.4996/fireecology.0301091.
- Lentile, L. B., F. W. Smith, and W. D. Shepperd. 2005. “Patch Structure, Fire-Scar Formation, and Tree Regeneration in a Large Mixed-Severity Fire in the South Dakota Black Hills, USA.” Canadian Journal of Forest Research 35 (12): 2875–2885. doi:10.1139/X05-205.
- Li, P., L. Jiang, and Z. Feng. 2014. “Cross-Comparison of Vegetation Indices Derived from Landsat-7 Enhanced Thematic Mapper Plus (ETM+) and Landsat-8 Operational Land Imager (OLI) Sensors.” Remote Sensing 6 (1): 310–329. doi:10.3390/rs6010310.
- Li, S., and C. Potter. 2012. “Patterns of Aboveground Biomass Regeneration in Post-Fire Coastal Scrub Communities.” GIScience & Remote Sensing 49 (2): 182–201. doi:10.2747/1548-1603.49.2.182.
- Miller, J. D., and A. E. Thode. 2007. “Quantifying Burn Severity in a Heterogeneous Landscape with a Relative Version of the Delta Normalized Burn Ratio (dNBR).” Remote Sensing of Environment 109 (1): 66–80. doi:10.1016/j.rse.2006.12.006.
- Mitchell, M., and F. Yuan. 2010. “Assessing Forest Fire and Vegetation Recovery in the Black Hills, South Dakota.” GIScience & Remote Sensing 47 (2): 276–299. doi:10.2747/1548-1603.47.2.276.
- NASA (National Aeronautics and Space Administration). 2010. “Landsat Data Continuity Mission [Pdf File].” http://landsat.gsfc.nasa.gov/pdf_archive/20101119_LDCMbrochure.pdf
- NOAA (NOAA National Climatic Data Center). 2014. “Monthly Summaries of the Global Historical Climatology Network - Daily (GHCN-D).” Asheville, NC.
- Potter, C. 2014. “Regional Analysis of MODIS Satellite Greenness Trends for Ecosystems of Interior Alaska.” GIScience & Remote Sensing 51 (4): 390–402. doi:10.1080/15481603.2014.933606.
- Potter, C., S. Li, S. Huang, and R. L. Crabtree. 2012. “Analysis of Sapling Density Regeneration in Yellowstone National Park with Hyperspectral Remote Sensing Data.” Remote Sensing of Environment 121 (June): 61–68. doi: 10.1016/j.rse.2012.01.019.
- Ridenour, K., S. Rissel, W. Powell, R. Gray, M. Fisher, and J. Sommerfield. 2012. Bastrop Complex Wildfire Case Study. College Station, TX: Texas Forest Service.
- Song, C., C. E. Woodcock, K. C. Seto, M. P. Lenney, and S. A. Macomber. 2001. “Classification and Change Detection Using Landsat TM Data: When and How to Correct Atmospheric Effects?” Remote Sensing of Environment 75 (2): 230–244. doi:10.1016/S0034-4257(00)00169-3.
- Soverel, N. O., D. D. B. Perrakis, and N. C. Coops. 2010. “Estimating Burn Severity from Landsat dNBR and RdNBR Indices across Western Canada.” Remote Sensing of Environment 114 (9): 1896–1909. doi:10.1016/j.rse.2010.03.013.
- Texas Forest Service. 2011. “2010-2011 Fire Season Statistics [Pdf File].” http://ticc.tamu.edu/Documents/Home/tx_sitrep.pdf.
- van Leeuwen, W. J. D. 2008. “Monitoring the Effects of Forest Restoration Treatments on Post-Fire Vegetation Recovery with MODIS Multitemporal Data.” Sensors 8 (3): 2017–2042. doi:10.3390/s8032017.
- van Leeuwen, W. J. D., G. M. Casady, D. G. Neary, S. Bautista, J. A. Alloza, Y. Carmel, L. Wittenberg, D. Malkinson, and B. J. Orr. 2010. “Monitoring Post-Wildfire Vegetation Response with Remotely Sensed Time-Series Data in Spain, USA and Israel.” International Journal of Wildland Fire 19 (1): 75–93. doi:10.1071/WF08078.
- van Wagtendonk, J. W., R. R. Root, and C. H. Key. 2004. “Comparison of AVIRIS and Landsat ETM+ Detection Capabilities for Burn Severity.” Remote Sensing of Environment 92 (3): 397–408. doi:10.1016/j.rse.2003.12.015.
- Vila, J., and P. Barbosa. 2010. “Post-Fire Vegetation Regrowth Detection in the Deiva Marina Region (Liguria-Italy) Using Landsat TM and ETM+ Data.” Ecological Modelling 221 (1): 75–84. doi:10.1016/j.ecolmodel.2009.03.011.
- Wang, Y. Q., Y. Zhou, J. Yang, H. S. He, Z. Zhu, and D. Ohlen. 2009. “Simulation of Short-Term Post-Fire Vegetation Recovery by Integration of LANDFIRE Data Products, DNBR Data and LANDIS Modeling.” Annals of GIS 15 (1): 47–59. doi:10.1080/19475680903271083.
- Whelan, R. J. 1995. The Ecology of Fire. Cambridge: Cambridge University Press.
- White, J. D., K. C. Ryan, C. C. Key, and S. W. Running. 1996. “Remote Sensing of Forest Fire Severity and Vegetation Recovery.” International Journal of Wildland Fire 6 (3): 125–136. doi:10.1071/WF9960125.
- Wilder, C. M., F. W. Holtzclaw Jr., and E. E. C. Clebsch. 1999. “Succession, Sapling Density and Growth in Canopy Gaps Along a Topographic Gradient in a Second Growth East Tennessee Forest.” The American Midland Naturalist 142 (2): 201–212. doi:10.1674/0003-0031(1999)142[0201:SSDAGI]2.0.CO;2.
- Wimberly, M., and M. Reilly. 2007. “Assessment of Fire Severity and Species Diversity in the Southern Appalachians Using Landsat TM and ETM+ Imagery.” Remote Sensing of Environment 108 (2): 189–197. doi:10.1016/j.rse.2006.03.019.