
Abstract
Monitoring soil moisture with satellite sensors is an effective approach for agricultural drought assessment. Currently, large quantities of sensor-derived observation data with different observation metadata models exist, and they require efficient and accurate methods of discovery. In this study, an earth observation (EO) metadata ontology with a spatiotemporal-spectral-enhanced structure is designed to solve this problem. The ontology is based on the proposed EO metadata model, which is composed of nonfunctional and functional sub-modules and supports the Open Geospatial Consortium EO profile of observations and measurements. Using EO metadata ontology, an application for soil moisture monitoring in Hubei Province in China is tested. The results indicate that metadata retrieval with a spatiotemporal-spectral-enhanced method can efficiently achieve fine-grained discovery of qualified EO metadata and obtain soil moisture monitoring information from sensor images. In summary, the spatiotemporal-spectral semantics in the proposed ontology demonstrate the use of EO metadata in the context of a soil moisture monitoring application, improving the efficiency and accuracy of EO metadata discovery.
Introduction
Soil moisture, which is the water stored in the upper soil layer, is a crucial parameter for a large number of applications, including flood forecasting, agricultural drought assessment, and water resource management (Darilek et al. Citation2011; Komma, Bloschl, and Reszler Citation2008; Lekshmi, Singh, and Baghini Citation2014; Ochsner et al. Citation2013). Monitoring soil moisture with sensors, commonly those that are on satellites, is an active area of research (Finn et al. Citation2011; Kim and Yeom Citation2015; Parida et al. Citation2008; Zhang, Chen, and Chen Citation2014). Recently, there has been a significant increase in the number of satellite sensors that are available for soil moisture (Zeng et al. Citation2015). Up to 120 satellite-based sensors are available for monitoring soil moisture, according to the statistics of the World Meteorological Organization (WMO Citation2015). If one sensor captures 1000 images per year, there are 120,000 images in total. This is too many images for applications. Besides, observation metadata are rarely used as an end product (Blanchart and Datcu Citation2010). Deep information is difficult to derive from the original and raw observation data (Kulkarni and McCaslin Citation2004; Bratasanu, Nedelcu, and Datcu Citation2012). We analyze these characteristics as follows:
The characteristics of large quantity and different structures will produce low precision and inefficient discovery of observation metadata. Modeling observation metadata is, therefore, a promising area of research.
The characteristics of syntactic description and unclear description of thematic information in the observation metadata will make some available data loss. This means that obtaining the information from satellite observations with keywords matching cannot meet the users’ requirements (Li and Bretschneider Citation2007; Lienou, Maitre, and Datcu Citation2010; Li et al. Citation2012; Luo et al. Citation2014). By means of semantic technology, mining the temporal, spatial, and spectral information behind the thematic information is a useful method.
They can, therefore, identify two promising areas of research: (1) the semantic modeling of metadata and (2) how to use the semantic information of observation metadata in discovery.
With regard to the first research area, mainstream studies have explored methods of modeling earth observation (EO) metadata. For example, the encoding of EO metadata defined by Open Geospatial Consortium (Gasperi et al. Citation2012) includes the acquisition time and location, as well as features depending on sensors. However, there are two limitations: (1) the description of time and space is fragmented; and (2) the representation of spectrum is fuzzy. The limitations are caused by the structural rigidity of the model, which make discovery difficult. In cases of this kind, it is necessary to build an ontology to model the observation metadata.
With regard to the second research area, the discovery of association between observation resources and applications still needs redundant manual intervention; machines cannot interpret the information about observations for specific applications. Many authors have tackled the problem in Sensor Web (Gray et al. Citation2011; Bröring et al. Citation2011; Jirka, Bröring, and Stasch Citation2009).
Objectives
In summary, regarding observation metadata, a fine-precision ontology is needed to enable discovery. The aim of this paper is to provide an ontology for describing EO metadata to support the discovery of products from sensors aboard satellites. The ontology will enable modeling of multiple heterogeneous observation metadata as provided by the WMO or other agencies. The ontology of EO metadata can be used to represent key characteristics of observations and to find more useful EO products.
Study area and data
Regional analysis
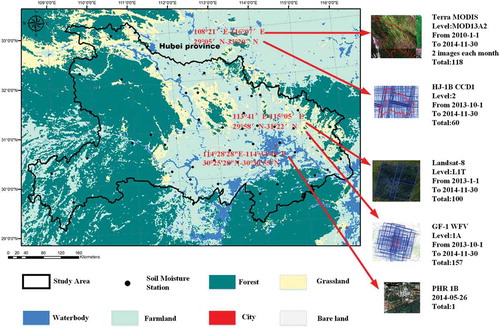
Hubei Province in China lies in the middle reach of the Yangtze River (108°21′–116°07′E and 29°05′–33°20′N, ). The study area has a subtropical, humid, and monsoon climate and a variety of landforms, lying in the central and southern parts are the Jianghan Plain. Agriculture is well developed in Hubei, but soil moisture-related disasters (droughts and flood) affect agriculture and have caused great economic losses. For example, it has been experiencing serious drought since August 2014, creating a serious water shortage in one-third of its cities. The area of farmland under drought conditions has reached 669,000 ha2, and 4.91 million individuals are suffering from drought. The resultant economic losses are approximately 2 billion yuan. The distribution of soil moisture is, therefore, an important factor for guiding agricultural development.
Figure 1. The study region land use and remote sensing images. The black points represent in situ stations for monitoring soil moisture. For full color versions of the figures in this paper, please see the online version.
For field measurement of soil moisture and verification of inversion results by remote sensing images, the Hubei Bureau of Meteorology built many in situ stations and our research group at Wuhan University in China built the Baoxie scientific experiment field (Chen, Zhang, and Wang Citation2015). The Baoxie field locates in 30.47° north latitude and 114.53° east longitude, and includes one soil temperature and moisture monitoring station. The main soil type of experimental sites is cinnamon-colored yellow soil (Clapp and Hornberger Citation1978), and the organic matter content of that in Hubei is generally less than 2%, the average is 1.5% (Hong, Zheng, and Chen Citation2001), which is relatively small. Therefore, we carried out the soil moisture experiment without taking into account the organic matter or salt in soil. Besides, in order to ensure that the soil hygrometer has a stable and high-accuracy (the error is less than 3%) characteristics, we carried out the calibration of sensor (soil hygrometer) for reducing the error. In short, the measured data with time series are reliable, which could be used for the verification of results provided by the query service in the “Discussion” section.
Study data
The aim of this paper is to find the adequate EO data for various applications through their metadata description, so up to 400 metadata (xml) of the region of interest (ROI) were collected from 2010 to 2014. The metadata with xml data format would be transformed into instances through the earth observation metadata ontology (described in the “Methodology” section), which are used in the experiment. The related images only are used in verification of results. According to the area of the images, the ROI is divided into multiscale. The ROI of the MODIS and HJ-1B is Hubei Province; the ROI of Landsat-8 and GF-1 is Wuhan City; the ROI of the PHR 1B is shown in . In the experiments, the data were made up of the first four sensors. We list the some examples of observation metadata in . The MODIS 1 km–16 day and Landsat-8 30 m data were acquired from the websites http://e4ftl01.cr.usgs.gov/MOLT/MOD13A2.005/ and http://ids.ceode.ac.cn/query.html, respectively. The HJ-1B 30 m and GF-1 16 m data were acquired from the website http://www.cresda.com/n16/index.html.
Table 1. Samples of observation metadata.
Methodology
Overview
This section aims at building an EO metadata ontology based on descriptions of spatiotemporal-spectral characteristics. As shown in , from the bottom up, it will be achieved in two steps: (1) creating the EO metadata model to describe the observation metadata information; and (2) building the ontology by the Web Ontology Language (OWL)-based description based on the metadata model. The classes of the ontology are inherited from a variety of top classes in Descriptive Ontology for Linguistic and Cognitive Engineering (DOLCE) (W3C Citation2011), which captures the ontological categories underlying natural language and human common sense. The proposed ontology acts as a broker between users and satellite observation resources for metadata discovery. The customers will effectively discover the available observation resources through the ontology model-based service.
Figure 2. The framework of the EO metadata ontology model. The model include nonfunctional and functional metadata model, which could be formalized by following the OWL-based ontology schema.
Earth observation metadata model
The metadata model comprises the nonfunctional and functional modules. The nonfunctional one refers to the observation property, which includes the identification, temporal, spatial, and spectrum semantics of observation metadata. The functional module describes the metadata from observation process.
Nonfunctional module in metadata model
The module includes the key characteristics of information relevant to the discovery of EO metadata. These characteristics can be decomposed into two segments: observation tag and observation feasibility management (). Here, the different observation information types can be formalized by different data types. We define the data types as a six-tuple, expressed as ObservationMetadataType (OMT) = {OMTI,OMTC,OMTT,OMTST,OMTF, OMTSR}, that represents “Identification,” “Classification,” “Observation Time,” “Spatiotemporal Reference,” “FootPrint,” and “SpectrumRange” information, respectively. For ontology, each of the six-tuple data types can be attributed to a specific metadata class. For example, the “Identification” DataType is attributed to the ObjectClass metadata type as defined in the DOLCE. The feasibility and availability of observation data mainly depend on this part.
Figure 3. Nonfunctional module of EO metadata model.
Functional module in metadata model
The characteristics of observation process in metadata are important to measurements of observation resources. The core of functional module lies in the stages (observation acquisition, processing, and results) of observation process. The part has a specific relationship to the information from the nonfunctional metadata model. For example, the “Spectrum Range” (OMTSR) inside the nonfunctional model are required in the functional model. The related contents could be described in EventClass metadata type for ontology ().
Figure 4. Functional module of EO metadata model.
The contents of the metadata model
The proposed satellite earth observation metadata (SEO_Metadata) model represents the essential contents of the observation metadata. shows that the SEO_Metadata can be divided into three parts:
Figure 5. UML diagram for the contents of the satellite earth observation metadata model.
The SEO_NonFunctional class includes two subclasses: SEO_ObservationTag and SEO_ObservationFeasibility. SEO_Identification and SEO_Classification belong to the observation tag, which is used to describe the features of identifying observation data and the types of metadata, respectively. SEO_ObservationFeasibility includes temporal, spatial, and spectral characteristics, which are mapped to the contents of earth observation product (EOP) as shown in .
Table 2. Spatiotemporal-spectral characteristics and the mapping to file name in OM and EOP.
SEO_Functional can be partitioned into the SEO_ObservationAcquisition, SEO_ObservationProcessing, and SEO_ObservationResult subclasses. The first one is related to the information from the orbit, angle, and archiving; the second one refers to the processor and process mode; and the third one includes coverage area information and product, etc.
SEO_MetadataExtension can be extended for future requirements.
EO metadata ontology
This section aims to build the classes of the ontology based on the proposed metadata model. For example, the information in SEO_ObservationFeasibility () can be represented in the “observation spatiotemporal-spectral characteristics” module of the ontology. As shown in , the EO metadata ontology contains seven modules: observation identification, classification, spatiotemporal-spectral characteristics, acquisition, processing, result, and observed property. The detailed OWL files refer to the website http://gsw.whu.edu.cn:9002/ontology/gswontology.owl. The ontology can be used for the discovery of observation metadata.
Table 3. The inherited relationship between classes of EO metadata ontology and classes of DOLCE.
Spatiotemporal-spectral classes of ontology
This subsection analyzes the characteristics behind the thematic application, which will be emphasized in the ontology, for improving the precision of discovery. In applications, most users would like to request the resources that can sense and observe an object or phenomenon at a certain time and in a certain region. Such a request can be analyzed on three points: time, space, and characteristics of the observed object. The last point mainly depends on the spectrum of the observed object. The spatiotemporal-spectral properties are therefore the key features of optical sensors equipped with satellites.
The thematic application has the connection with the required observation period. The temporal characteristics behind the application can be formalized with semantics: (observed object in application, temporal semantics) = (OOA, T-S), which could be represented in the ontology as “OOATemporalResolution” class. Accordingly, we choose the temporal frequency (hours, days, months, years, and decades) as the key temporal characteristic of the metadata (Joyce et al. Citation2004; Koster et al. Citation2004; Petitjean, Inglada, and Gancarski Citation2014; Xu et al. Citation2014), which could be described as (EO metadata, temporal semantics) = (EOM, T-S) and could be represented in the ontology as “EOMTemporalResolution” class.
For spatial characteristics, the thematic applications in multiscale require different spatial resolutions (Wardlow and Callahan Citation2014; Wang et al. Citation2015). Take soil moisture monitoring as an example: for area of nearly 1,000,000 km2, the resolution should be approximately 250 m to 1 km; for 200,000 km2, resolution of 30–250 m; and for 10,000 km2, resolution of 10–30 m. Similar to the representation of temporal semantics, the (OOA, S-S) and (EOM, S-S) describe the spatial semantics (S-S) of observed object in application and EO metadata, respectively. The corresponding classes are the “OOASpatialResolution” and “EOMSpatialResolution” classes in ontology.
Different observed objects respond different wavelengths, according to their spectral characteristics (Electromagnetic spectrum Citation2015). The spectrum of the object in application is an important criterion for choosing the sensors (Al-Hamdan et al. Citation2010; Cavalli et al. Citation2008). The (OOA, SP-S) and (EOM, SP-S) represents the spectral semantics (SP-S) of observed object and metadata, respectively. The related classes in ontology are “OOABandRange,” “OOAStartWaveLength,” “OOAEndWaveLength,” “EOMSpectralRange,” “EOM StartWaveLength,” and “EOMEndWaveLength” classes.
The ontology with the temporal, spatial, and spectral classes of application and observation metadata could decrease the possibility of data loss. For example, one sensor only has the description “drought” of application. When the user required the “soil moisture” application, the nonenhanced query will miss the sensor. However, the enhanced query will get the sensor through the matching of three aspects behind the thematic application. Assuming that, for a certain area, the “drought” application requires the temporal resolution should be “1–16 days,” the range of spatial resolution is “30–250 m,” and spectral range is 0.38–0.78 μm. The related information of thematic application will be found in the classes of “observed property” module, through the query service.
Experiments and results
This section presents the queries and results in our prototype. As shown in , the experiments follow the flow (2), and the steps are 1–3–4–5, using the spatiotemporal-spectral characteristics-enhanced matching called enhanced discovery (EOmetadataSemQuery prototype). Because of limited space, the results of the flow (1) (called nonenhanced discovery) are not shown in this paper. The performance of the two flows is compared in the “Discussion” section.
Figure 6. An overview of the discovery flow with spatiotemporal-spectral nonenhanced and enhanced matching.
The search request
Our goal is to retrieve appropriate EO remote sensing metadata and sensors for soil moisture monitoring, based on the proposed ontology. In the EOmetadataSemQuery prototype, the user can also use the following function: discovery of EO metadata and related data. The discovery module consists of three request conditions for matching qualified EO metadata (left part in ): temporal and spatial parameters, thematic semantics, and semantic association. The search request by Semantic Web Rule Language in Jena is shown in right part of .
Figure 7. Search request in EOmetadataSemQuery prototype.
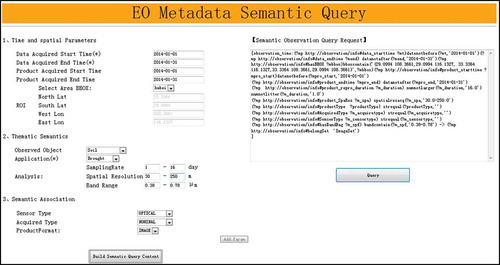
In the “temporal and spatial parameters” conditions, the customers can choose the data acquisition time interval and the ROI. The search criteria “Data Acquired Start Time,” “Data Acquired End Time,” and “ROI” match the value of “AcquisitionBeginPosition,” “AcquistionEndPosition,” and “multiExtentOf” classes in the ontology, respectively.
In the “thematic semantics” request criteria, the listed value of “Observed Object” and “Application” is collected from the class “ObservedObject” and from the application type defined in WMO, respectively. Here, we selected “Observed Object = Soil” and “Application = Drought.” After that, the values of “SamplingRate,” “SpatialResolution,” and “BandRange” will come from the classes of “Observed Property” module in ontology. They will match the instances of EOMTemporalResolution, EOMSpatialResolution, and EOMSpectralRange classes, respectively. This component provides the thematic semantics analysis between request criteria and the metadata elements. It will extract the hidden information behind the users’ thematic requirements for better observation metadata discovery.
In the “Semantic Association” search criteria, the listed value of “Sensor Type,” “AcquiredType” are collected from the classes in “Observation Classification” module of ontology. The users can also choose other search criteria by using the button “Add Param.”
The search results
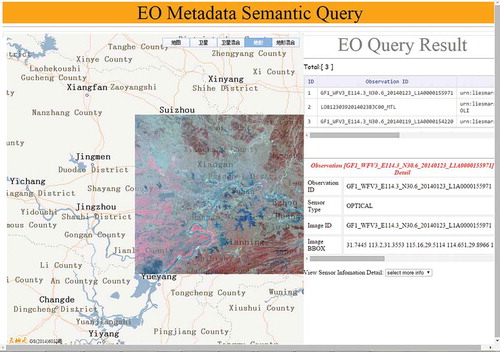
A query for Hubei Province was conducted where “Data Acquired Start Time = 2014-01-01T00:00:00” and “Data Acquired End Time = 2014-02-01T00:00:00.” shows the result of the search request. Four results were targeted from the constructed metadata library. Using the same temporal request criteria, the other query was conducted for Wuhan City. Three results of EO metadata will feed back to users, as shown in . In search results, the observation information representation can aid in (1) viewing the observation results (e.g., images) in the map, (2) browsing the enriched observation metadata properties of all retrieved results in a table, and (3) viewing the observation metadata information.
Figure 8. Discovery results of a given application for the ROI of Hubei Province in China.
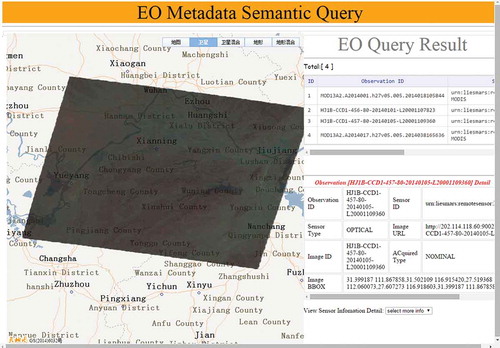
Figure 9. Discovery results of a given application for the ROI of Wuhan City in China.
Discussion
Verification of query results
In this subsection, seven results of the search request, which are queried in “the search results” subsection and shown in and , will be verified. According to the regional characteristics and inversion model of soil moisture, the enhanced vegetation index (EVI) is used for MODIS (Cubaa et al. Citation2013), and the modified perpendicular drought index (MPDI) (Owe, de Jeu, and Walker Citation2001) is used for other sensors. The reasons for selecting the models are as follows:
For EVI: Motohka et al. (Citation2009) evaluated the quality of satellite remote sensing of paddy phenology using daily satellite data taken by MODIS with regard to the agreement with the in situ data. The EVI was the best vegetation index in terms of agreement with in situ data. The results show that the data set for monitoring rice paddy in monsoon Asia would be daily EVI.
For MDPI: According to the experiments by Ghulama et al. (Citation2007), the MPDI has highly correlation with in situ soil moisture values, and the study concludes the MPDI demonstrates a much better performance in measuring vegetated surfaces since it takes into account both soil moisture and vegetation growth in the modeling process. And we (Chen, Li, and Zhang Citation2015) have used the optical sensors (GF-1 WFV, Landsat-8 OLI and MODIS) to verify the feasibility of MDPI. The verification in this paper is based on the work in our previous research.
The mathematical expression for calculating the MPDI is represented in formula 1, where RRed and RNIR refer to the atmospherically corrected surface reflectances of the red and NIR bands, respectively; M is the slope of the soil line. fv is the fraction of vegetation; Rv,Red and Rv,NIR are the pure vegetation spectral reflectances in the red and NIR bands, respectively.
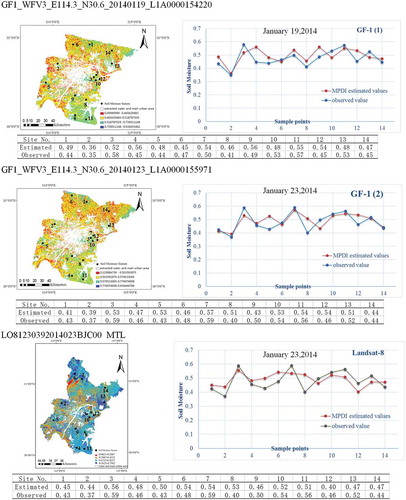
and show the trend of the values from the inverted images and the corresponding observed soil moisture. The results demonstrate that the inverted values from the images had a positive correlation with the values from in situ stations. The estimated soil moisture data is not only consistent with the field data, but also with the trend of results in Li, Ma, and Niu (Citation2011) and Li and Ma (Citation2013). The results show these data can be used for high values of soil moisture. In the future, we will validate highly dry soils in the study area.
Figure 10. The soil moisture thematic maps and validation of linear models of sensor data in the query results when ROI is Hubei Province in China.
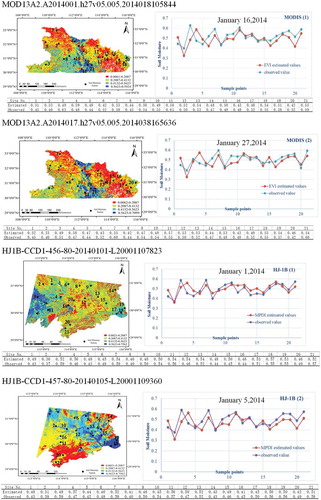
Figure 11. The soil moisture thematic maps and validation of linear relationship models based on sensor data in the query results when the ROI is Wuhan City in China.
Accurately discovering the satellite observation metadata
In this subsection, we use the precision, recall and F-measure to evaluate the accuracy of our proposed query, and the time required to judge the efficiency. Precision is the fraction of retrieved instances that are relevant, and recall is the fraction of relevant instances that are retrieved (Ma and Tian Citation2015). The F-measure includes both the precision (P) and the recall (R) of the test in computing the accuracy of the search engine (Hripcsak and Rothschild Citation2005). The balanced F-measure (F) is the harmonic mean of precision and recall:
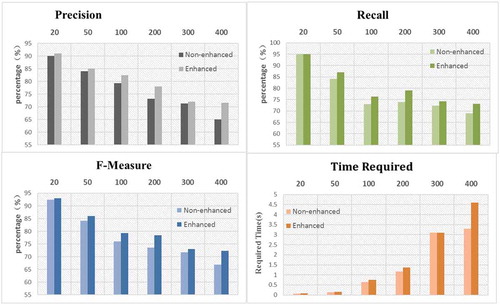
As shown in and , we tested spatiotemporal-spectral-enhanced and nonenhanced service, when the data set came from one type of satellite and all satellites, respectively. The two figures show that the precision, recall, and F-measure of the enhanced query were better than that of the nonenhanced query, while the enhanced query was more time-consuming. Because the numbers of images and the metadata information are different for each satellite, the values are slightly different. In the experiment, the TERRA MODIS and HJ-1B CCD1 has more detailed description of thematic application than the GF1-WFV3 and Landsat. Therefore, the precision, recall, F-measure, and time required of previous two is slightly different between the nonenhanced and enhanced query. For better precision, the enhanced query added the matching of spatiotemporal-spectral characteristics, so it consumes more time than nonenhanced query.
Figure 12. The precision, recall, F-measure, and time required for nonenhanced and enhanced queries when the data source comes from one type of satellite.
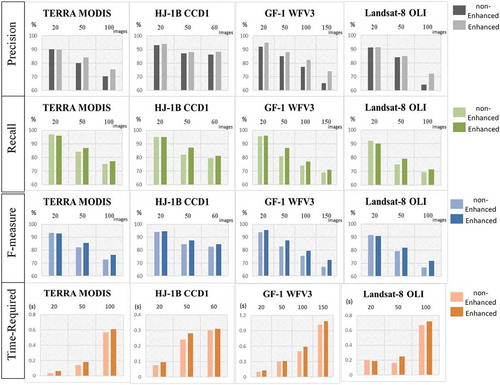
Figure 13. The precision, recall, F-measure, and required time for nonenhanced and enhanced queries when the data are all experimental data.
Compared to other related methods
Many researchers intend to use ontology to achieve a clear and detailed expression of sensors and observations. The following are the comparison with the related ontologies:
The comparison with upper-level ontology, for example, the NASA’s Semantic Web for Earth and Environmental Terminology (SWEET) ontology (DiGiuseppe, Pouchard, and Noy Citation2014). For specific application, the new classes based on SWEET would be extended, while our ontology only needs to add the instances of classes. The proposed ontology is more suitable for thematic application than upper-level ontology.
The comparison with sensor metadata-centered ontology, such as the W3C-developed Semantic Sensor Network (SSN) ontology (Compton et al. Citation2012), is more oriented toward broadly identifying the sensor devices and metadata, whereas our proposed ontology is more targeted to the descriptions of observation metadata. And the Marine Metadata Interoperability (MMI) (Rueda, Bermudez, and Fredericks Citation2009) develops an ontology of oceanographic devices, while our ontology is used for soil moisture. But most of all, the existing ontologies are suitable to describe the in situ sensors, which are inappropriate for representing satellite sensors. Our ontology well made up for it with the metadata description of optical sensors equipped with satellites.
The comparison with observation metadata-centered ontology. For example, Sharing Environmental Education Knowledge Extensible Observation Ontology (Madin et al. Citation2007) focuses the description of observed property and result, whereas we emphasize the spatiotemporal-spectral characteristics and add the metadata of observation process in the ontology. As another example, a functional ontology of OM (Kuhn Citation2009) specifies observation as a process involved in observations from in situ sensors, while our ontology is suitable for satellite sensors.
Besides, there are some observation models. For example, the observation capability metadata model (OCMM) (Hu et al. Citation2014) has well-defined information on observation capability of EO sensors, which lacks detailed information on the observation process with the comparison to our ontology. In conclusion, the comparison with the proposed ontology and similar models is shown in .
Table 4. The comparison with related models.
The query based on our proposed method is different from other retrieval engines. Some researchers (Fernandez et al. Citation2013; Roda and Musulin Citation2014) developed a means of aligning different ontologies that are insufficient for discovery of observation metadata. Other scholars built inference rules for discovery, which would include term similarity and simple relations, for example, Kim, Cha, and Cho (Citation2013) and Sensor Observable Registry (SOR) (Jirka, Bröring, and Nüst Citation2010). Here, we compare two services with our EOmetadataSemQuery.
First, we refine the search criteria with “thematic semantics” in the EOmetadataSemQuery prototype instead of the search criteria with “Thematic_of_geoevent,” “ObservationStartingTime,” “ObservationEndingTime,” and “ObservedBoundingBox” in the Geosensor Query prototype (Hu et al. Citation2014). The Geosensor Query implementation supports specific keyword matching, while our prototype can mine the hidden information of time, space, and theme behind the thematic query. Therefore, the proposed method breaks the limitation of keywords matching.
Second, the SIR (Jirka and Nuest Citation2010) incorporates a SensorML discovery profile that defines a minimum set of sensor metadata supporting multiple search criteria, but the internal metadata can only address sensor discovery, not observation data discovery. It will lead to search bias and constraints. Our service, with a spatiotemporal-spectral semantic-enhanced structure, is formalized from an ontology consisting of a suite of clear hierarchical metadata about observations. Compared with the SOR, the proposed query focuses on mining the deeper relation between search criteria and observation metadata instead of parent, child, or equivalent relationship.
Merits and limitation
The proposed ontology can play a fundamental role in the scenario where satellite sensors with sufficient accessibility provide available observation data (images) during specific observation tasks. The characteristics of our approach are shown in the following aspects:
We take into account the observation process and key factors of observation metadata, especially for spatiotemporal-spectral characteristics. The ontology enables an observation data query system that can be used to support sensory interoperability scenarios in applications.
We also take into account the close connection between application and observation data through spatiotemporal-spectral semantics to filter the information received by the consumers. It will help nonprofessionals use the data. And it takes advantage of spatiotemporal-spectral-enhanced metadata descriptions and provides more valuable information for applications, which will assist automated raw data analysis in the EO Sensor Web for higher-precision discovery.
However, the method has three limitations. First, the time required for potential queries begins to increase when the number of images is more than 400. Therefore, the next development phase for this search engine is to identify the quantity of observation data that can provide users with quick response. Second, the available metadata could be queried, but there is no comparison among the results, when their time and domain are overlapped. In the future, the query results would be sorted by the monitoring precision of observation metadata. Third, the search criteria with thematic semantics are fixed parameters. Technically speaking, the ontology could be applied to other domain, not limited to soil moisture. Here, we only make the case study of soil moisture monitoring. Diverse thematic information will be tested. Consequently, our future research will focus on providing more qualified data and mining other characteristics to support various observation task for improving the feasibility of our method.
Conclusion
In this study, we determined how to represent the observation metadata to improve the precision of discovery. An observation metadata ontology with seven submodules was proposed to describe the well-defined observation metadata of EO sensors. The methodology for creating the ontology is divided into two steps: the development of an observation metadata model and the formalization of the proposed model-based ontology. Using the ontology, the experiment worked in areas of Hubei Province for monitoring soil moisture; we used four sensors to test the efficiency of the query mechanism. The results confirm that it performed as an observation metadata descriptive model with a spatiotemporal-spectral-enhanced structure that aids high-precision discovery of satellite observations. The proposed ontology is expected to be extensible for users’ requirements. The metadata ontology of sensors for a microwave/optical synergistic observation and high sensitivity to soil moisture monitoring will be the focus of future research.
Disclosure statement
No potential conflict of interest was reported by the authors.
Additional information
Funding
References
- Al-Hamdan, M., J. Cruise, D. Rickman, and D. Quattrochi. 2010. “Effects of Spatial and Spectral Resolutions on Fractal Dimensions in Forested Landscapes.” Remote Sensing 2 (3): 611–640. doi:10.3390/rs2030611.
- Blanchart, P., and M. Datcu. 2010. “A Semi-Supervised Algorithm for Auto-Annotation and Unknown Structures Discovery in Satellite Image Databases.” IEEE Journal of Selected Topics in Applied Earth Observations and Remote Sensing 3 (4): 698–717. doi:10.1109/JSTARS.2010.2058794.
- Bratasanu, D., I. Nedelcu, and M. Datcu. 2012. “Interactive Spectral Band Discovery for Exploratory Visual Analysis of Satellite Images.” IEEE Journal of Selected Topics in Applied Earth Observations and Remote Sensing 5 (1): 207–224. doi:10.1109/JSTARS.2011.2169772.
- Bröring, A., P. Maué, K. Janowicz, D. Nüst, and C. Malewski. 2011. “Semantically-Enabled Sensor Plug & Play for the Sensor Web.” Sensors 11 (8): 7568–7605. doi:10.3390/s110807568. http://www.mdpi.com/1424-8220/11/8/7568
- Cavalli, R. M., L. Fusilli, S. Pascucci, S. Pignatti, and F. Santini. 2008. “Hyperspectral Sensor Data Capability for Retrieving Complex Urban Land Cover in Comparison with Multispectral Data: Venice City Case Study (Italy).” Sensors 8 (5): 3299–3320. doi:10.3390/s8053299.
- Chen, N., J. Li, and X. Zhang. 2015. “Quantitative Evaluation of Observation Capability of GF-1 Wide Field of View Sensors for Soil Moisture Inversion.” Journal of Applied Remote Sensing 9 (1): 097097-1–097097-18. doi:10.1117/1.JRS.9.097097.
- Chen, N., X. Zhang, and C. Wang. 2015. “Integrated Open Geospatial Web Service enabled Cyber-physical Information Infrastructure for Precision Agriculture Monitoring.” Computers and Electronics in Agriculture 111: 78–91. doi:10.1016/j.compag.2014.12.009.
- Clapp, R. B., and G. M. Hornberger. 1978. “Empirical Equations for Some Soil Hydraulic Properties.” Water Resources Research 14 (4): 601–604. doi:10.1029/WR014i004p00601.
- Compton, M., P. Barnaghi, L. Bermudez, R. Garcia-Castro, O. Corcho, S. Cox, J. Graybeal, et al. 2012. “The SSN Ontology of the W3C Semantic Sensor Network Incubator Group.” Web Semantics: Science, Services and Agents on the World Wide Web 17: 25–32. doi:10.1016/j.websem.2012.05.003.
- Cubaa, N., J. Rogana, Z. Christmanb, C. A. Williamsa, L. C. Schneiderc, D. Lawrenced, and M. Millonesa. 2013. “Modelling Dry Season Deciduousness in Mexican Yucatán Forest Using MODIS EVI Data (2000–2011).” GIScience & Remote Sensing 50 (1): 26–49. doi:10.1080/15481603.2013.778559.
- Darilek, J. L., W. Sun, B. Huang, Z. Wang, Y. Qi, and D. C. Weindorf. 2011. “Effect of Moisture Conditions in Rice Paddies on Phosphorus Fractionation in Agriculture Soils of Rapidly Developing Regions of China.” Communications in Soil Science and Plant Analysis 42 (14): 1752–1764. doi:10.1080/00103624.2011.584599.
- DiGiuseppe, N., L. C. Pouchard, and N. F. Noy. 2014. “SWEET Ontology Coverage for Earth System Sciences.” Earth Science Informatics 7 (4): 249–264. doi:10.1007/s12145-013-0143-1.
- Electromagnetic spectrum. 2015. Accessed 18 January 2015. http://en.wikipedia.org/wiki/Electromagnetic_spectrum
- Fernandez, S., I. Marsa-Maestre, J. R. Velasco, and B. Alarcos. 2013. “Ontology Alignment Architecture for Semantic Sensor Web Integration.” Sensors 13 (9): 12581–12604. doi:10.3390/s130912581.
- Finn, M. P., M. D. Lewis, D. D. Bosch, M. Giraldo, K. Yamamoto, D. G. Sullivan, R. Kincaid, et al. 2011. “Remote Sensing of Soil Moisture Using Airborne Hyperspectral Data.” GIScience & Remote Sensing 48 (4): 522–540. doi:10.2747/1548-1603.48.4.522.
- Gasperi, J., F. Houbie, A. Woolf, and S. Smolders. 2012. Earth Observation Metadata Profile of Observations & Measurements (Version 1.0). Wayland, MA: Open Geospatial Consortium.
- Ghulama, A., Q. M. Qin, T. Teyip, and Z.-L. Li. 2007. “Modified Perpendicular Drought Index (MPDI): A Real-Time Drought Monitoring Method.” ISPRS Journal of Photogrammetry and Remote Sensing 62 (2): 150–164. doi:10.1016/j.isprsjprs.2007.03.002.
- Gray, A. J. G., J. Sadler, O. Kit, K. Kyzirakos, M. Karpathiotakis, J.-P. Calbimonte, K. Page, et al. 2011. “A Semantic Sensor Web for Environmental Decision Support Applications.” Sensors 11 (9): 8855–8887. doi:10.3390/s110908855. http://www.mdpi.com/1424-8220/11/9/8855
- Hong, S., Z. Zheng, and J. Chen. 2001. “Environmental Geochemical Characteristics of Some Microelements in the Yellow Brown Soil of Hubei Province.” Acta Pedologica Sinica 38 (1): 89–95. (in Chinese).
- Hripcsak, G., and A. S. Rothschild. 2005. “Agreement, the F-Measure, and Reliability in Information Retrieval.” Journal of the American Medical Informatics Association 12 (3): 296–298. doi:10.1197/jamia.M1733.
- Hu, C., Q. Guan, N. Chen, J. Li, X. Zhong, and Y. Han. 2014. “An Observation Capability Metadata Model for EO Sensor Discovery in Sensor Web Enablement Environments.” Remote Sensing 6 (11): 10546–10570. doi:10.3390/rs61110546.
- Jirka, S., A. Bröring, and D. Nüst. 2010. Sensor Observable Registry Discussion Paper. Wayland, MA: Open Geospatial Consortium.
- Jirka, S., A. Bröring, and C. Stasch. 2009. “Discovery Mechanisms for the Sensor Web.” Sensors 9 (4): 2661–2681. doi:10.3390/s90402661.
- Jirka, S., and D. Nuest. 2010. OGC Discussion Paper 10-171: Sensor Instance Registry. Wayland, MA: Open Geospatial Consortium.
- Joyce, R. J., J. E. Janowiak, P. A. Arkin, and P. P. Xie. 2004. “CMORPH: A Method that Produces Global Precipitation Estimates from Passive Microwave and Infrared Data at High Spatial and Temporal Resolution.” Journal of Hydrometeorology 5: 487–503. doi:10.1175/1525-7541(2004)005<0487:CAMTPG>2.0.CO;2.
- Kim, D., S. Cha, and K. Cho. 2013. “Ontology-Based Methodology for Managing Heterogeneous Wireless Sensor Networks.” International Journal of Distributed Sensor Networks 2013 (2013): 1–9. doi:10.1155/2013/610684.
- Kim, H.-O., and J.-M. Yeom. 2015. “Sensitivity of Vegetation Indices to Spatial Degradation of Rapideye Imagery for Paddy Rice Detection: A Case Study of South Korea.” GIScience & Remote Sensing 52 (1): 1–17. doi:10.1080/15481603.2014.1001666.
- Komma, J., G. Bloschl, and C. Reszler. 2008. “Soil Moisture Updating by Ensemble Kalman Filtering in Real-Time Flood Forecasting.” Journal of Hydrology 357 (3–4): 228–242. doi:10.1016/j.jhydrol.2008.05.020.
- Koster, R. D., P. A. Dirmeyer, Z. Guo, G. Bona, E. Chan, P. Cox, C. T. Gordon, et al. 2004. “Regions of Strong Coupling between Soil Moisture and Precipitation.” Science 305: 1138–1140. doi:10.1126/science.1100217.
- Kuhn, W. 2009. “A Functional Ontology of Observation and Measurement.” In GeoSpatial Semantics, Lecture Notes in Computer Science, Vol. 5892, edited by K. Janowicz, M. Raubal, and S. Levashkin, 26–43. Berlin: Springer-Verlag. doi:10.1007/978-3-642-10436-7_3.
- Kulkarni, A., and S. McCaslin. 2004. “Knowledge Discovery from Multispectral Satellite Images.” IEEE Geoscience and Remote Sensing Letters 1 (4): 246–250. doi:10.1109/LGRS.2004.834593.
- Lekshmi, S. U. S., D. N. Singh, and M. S. Baghini. 2014. “A Critical Review of Soil Moisture Measurement.” Measurement: A Review 54: 92–105. doi:10.1016/j.measurement.2014.04.007.
- Li, M., and Z. Ma. 2013. “Soil Moisture-Based Study of the Variability of Dry-Wet Climate and Climate Zones in China.” Chinese Science Bulletin 58 (4–5): 531–544. doi:10.1007/s11434-012-5428-0.
- Li, M., Z. Ma, and G. Niu. 2011. “Modeling Spatial and Temporal Variations in Soil Moisture in China.” Chinese Science Bulletin 56 (17): 1809–1820. doi:10.1007/s11434-011-4493-0.
- Li, Y. K., and T. R. Bretschneider. 2007. “Semantic-Sensitive Satellite Image Retrieval.” IEEE Transactions on Geoscience and Remote Sensing 45 (4): 853–860. doi:10.1109/TGRS.2007.892008.
- Li, Y. K., S. W. Yang, T. Liu, and X. Y. Dong. 2012. “Comparative Assessment of Semantic-Sensitive Satellite Image Retrieval: Simple and Context-Sensitive Bayesian Networks.” International Journal of Geographical Information Science 26 (2): 247–263. doi:10.1080/13658816.2011.585138.
- Lienou, M., H. Maitre, and M. Datcu. 2010. “Semantic Annotation of Satellite Images Using Latent Dirichlet Allocation.” IEEE Geoscience and Remote Sensing Letters 7 (1): 28–32. doi:10.1109/LGRS.2009.2023536.
- Luo, W., H. Li, G. Liu, and L. Zeng. 2014. “Semantic Annotation of Satellite Images Using Author–Genre–Topic Model.” IEEE Transactions on Geoscience and Remote Sensing 52 (2): 1356–1368. doi:10.1109/TGRS.2013.2250978.
- Ma, S., and L. Tian. 2015. “Ontology-Based Semantic Retrieval for Mechanical Design Knowledge.” International Journal of Computer Integrated Manufacturing 28 (2): 226–238. doi:10.1080/0951192X.2013.874593.
- Madin, J., S. Bowers, M. Schildhauer, S. Krivov, D. Pennington, and F. Villa. 2007. “An Ontology for Describing and Synthesizing Ecological Observation Data.” Ecological Informatics 2 (3): 279–296. doi:10.1016/j.ecoinf.2007.05.004.
- Motohka, T., K. N. Nasahara, A. Miyata, M. Mano, and S. Tsuchida. 2009. “Evaluation of Optical Satellite Remote Sensing for Rice Paddy Phenology in Monsoon Asia Using a Continuous in Situ Dataset.” International Journal of Remote Sensing 30 (17): 4343–4357. doi:10.1080/01431160802549369.
- Ochsner, T. E., M. H. Cosh, R. H. Cuenca, W. A. Dorigo, C. S. Draper, Y. Hagimoto, Y. H. Kerr, E. G. Njoku, E. E. Small, and M. Zreda. 2013. “State of the Art in Large-Scale Soil Moisture Monitoring.” Soil Science Society of America Journal 77 (6): 1888–1919. doi:10.2136/sssaj2013.03.0093.
- Owe, M., R. de Jeu, and J. Walker. 2001. “A Methodology for Surface Soil Moisture and Vegetation Optical Depth Retrieval Using the Microwave Polarization Difference Index.” IEEE Transactions on Geoscience and Remote Sensing 39 (8): 1643–1654. doi:10.1109/36.942542.
- Parida, B. R., W. B. Collado, R. Borah, M. K. Hazarika, and L. Samarakoon. 2008. “Detecting Drought-Prone Areas of Rice Agriculture Using a MODIS-Derived Soil Moisture Index.” GIScience & Remote Sensing 45 (1): 109–129. doi:10.2747/1548-1603.45.1.109.
- Petitjean, F., J. Inglada, and P. Gancarski. 2014. “Assessing the Quality of Temporal High-Resolution Classifications with Low-Resolution Satellite Image Time Series.” International Journal of Remote Sensing 35 (7): 2693–2712. doi:10.1080/01431161.2014.883092.
- Roda, F., and E. Musulin. 2014. “An Ontology-Based Framework to Support Intelligent Data Analysis of Sensor Measurements.” Expert Systems with Applications 41 (17): 7914–7926. doi:10.1016/j.eswa.2014.06.033.
- Rueda, C., L. Bermudez, and J. Fredericks. 2009. “The MMI Ontology Registry and Repository: A Portal for Marine Metadata Interoperability.” OCEANS 2009, MTS/IEEE Biloxi – Marine Technology for Our Future: Global and Local Challenges, Biloxi, MS, October 26–29, 1854–1859.
- W3C. 2011. “DUL Ssn.” World Wide Web Consortium. Accessed January 14, 2015. http://www.w3.org/2005/Incubator/ssn/wiki/DUL_ssn
- Wang, F., Z. Qin, W. Li, C. Song, A. Karnieli, and S. Zhao. 2015. “An Efficient Approach for Pixel Decomposition to Increase the Spatial Resolution of Land Surface Temperature Images from MODIS Thermal Infrared Band Data.” Sensors 15 (1): 304–330. doi:10.3390/s150100304.
- Wardlow, B. D., and K. Callahan. 2014. “A Multi-Scale Accuracy Assessment of the MODIS Irrigated Agriculture Data-Set (Mirad) for the State of Nebraska, USA.” GIScience & Remote Sensing 51 (5): 575–592. doi:10.1080/15481603.2014.952546.
- WMO. 2015. “Measurement Timeline for Soil Moisture at Surface.” World Meteorological Organization. Accessed May 11, 2015. http://www.wmo-sat.info/oscar/gapanalyses?view=149
- Xu, Z., X. Luo, S. Zhang, X. Wei, L. Mei, and C. Hu. 2014. “Mining Temporal Explicit and Implicit Semantic Relations between Entities Using Web Search Engines.” Future Generation Computer Systems 37: 468–477. doi:10.1016/j.future.2013.09.027.
- Zeng, J. Y., Z. Li, Q. Chen, H. Y. Bi, J. X. Qiu, and P. F. Zou. 2015. “Evaluation of Remotely Sensed and Reanalysis Soil Moisture Products over the Tibetan Plateau Using In-Situ Observations.” Remote Sensing of Environment 163: 91–110. doi:10.1016/j.rse.2015.03.008.
- Zhang, X., N. Chen, and Z. Chen. 2014. “Spatial Pattern and Temporal Variation Law-Based Multi-Sensor Collaboration Method for Improving Regional Soil Moisture Monitoring Capabilities.” Remote Sensing 6 (12): 12309–12333. doi:10.3390/rs61212309.