
Abstract
Urbanization processes challenge the growth of orchards in many cities in Iran. In Maragheh, orchards are crucial ecological, economical, and tourist sources. To explore orchards threatened by urban expansion, this study first aims to develop a new model by coupling cellular automata (CA) and artificial neural network with fuzzy set theory (CA–ANN–Fuzzy). While fuzzy set theory captures the uncertainty associated with transition rules, the ANN considers spatial and temporal nonlinearities of the driving forces underlying the urban growth processes. Second, the CA–ANN–Fuzzy model is compared with two existing approaches, namely a basic CA and a CA coupled with an ANN (CA–ANN). Third, we quantify the amount of orchard loss during the last three decades as well as for the upcoming years up to 2025. Results show that CA–ANN–Fuzzy with 83% kappa coefficient performs significantly better than conventional CA (with 51% kappa coefficient) and CA–ANN (with 79% kappa coefficient) models in simulating orchard loss. The historical data shows a considerable loss of 26% during the last three decades, while the CA–ANN–Fuzzy simulation reveals a considerable future loss of 7% of Maragheh’s orchards in 2025 due to urbanization. These areas require special attention and must be protected by the local government and decision-makers.
1. Introduction
One of the key ecological pressures impacting on the environment and ecosystem is land-use change (LUC) due to rapid urbanization (Czamanski et al. Citation2008; Grimm et al. Citation2008; Haase and Nuissl Citation2010; Shafizadeh Moghadam and Helbich Citation2015). Big cities in Iran face tremendous urban expansion, resulting in degradation of natural areas in favor of built-up areas (Jarnagin Citation2004; Tayyebi, Pijanowski, and Tayyebi Citation2011a). The urbanization levelFootnote1 increased from 31% in 1956 to 70% in 2011 (Iran Statistical Center Citation2013). Rural–urban migration and rapid population growth are two essential causes of this urban expansion. In addition, macroeconomic policies in the real estate sector interfere with these urban growth processes. From 1990 to 2008, house prices increased by approximately 330% (Meidani, Zabihi, and Ashena Citation2011). As the prices of orchard products increased slightly compared to business or construction land prices (Khiabani Citation2004), it is monetarily more beneficial for farmers to sell their property for business and construction purposes. Therefore, due to limited unoccupied lands for urbanization, several fast-growing Iranian cities urbanized toward orchard lands (Tayyebi, Pijanowski, and Pekin Citation2011b; Zadeh Citation2008), causing an excessive shrinkage of orchard lands. While knowledge about the rate of orchard conversion is of significance for policy-makers and urban planners (Su et al. Citation2012; Zadeh Citation2008), no study has quantified the past and future orchard loss in Iran.
In this regard, LUC models (Verburg et al. Citation2004; Estoque and Murayama Citation2014) are valuable tools to detect ecological areas that are threatened due to urban growth (Shafizadeh Moghadam and Helbich Citation2015; Jokar Arsanjani, Helbich, and Mousivand Citation2014). Even though several LUC models have been proposed in the literature, including, for example, statistical approaches (Shafizadeh Moghadam and Helbich Citation2015) and geometrical approaches (Tayyebi, Pijanowski, and Pekin Citation2011b; Jokar Arsanjani, Helbich, and Mousivand Citation2014), among these models, cellular automata (CA; Santé et al. Citation2010) and linguistic approaches (Mantelas et al. Citation2012) such as fuzzy logic-based approaches (Grekousis, Manetos, and Photis Citation2013) and ANNs (Tayyebi, Tayyebi, and Khanna Citation2014; Basse et al. Citation2014) have received considerable attention due to their dynamic nature, being explicitly spatial with a highly flexible structure.
CA is widely used to simulate urban dynamics (Batty, Xie, and Sun Citation1999). CA calibration obtains a set of transition rules. However, extensive search strategies are required to explore appropriate combinations of transition rules during model calibration; otherwise, the process results in inaccurate predictions. The determination of transition rules is even more complex when additional spatial variables are considered. As a consequence, the calibration of CA models is challenging due to the determination of optimal weights for a large number of involved factors (Dietzel and Clarke Citation2006). Therefore, computer search algorithms such as ANNs (Li and Yeh Citation2002) are valuable to be coupled with CA to significantly reduce the model calibration time. For example, Li and Yeh (Citation2001) used an ANN embedded in a CA model to simulate urbanization in China. Similarly, Almeida et al. (Citation2008) combined ANN with CA for modeling intra-urban land-use dynamics. Finally, Shafizadeh Moghadam and Helbich (Citation2013) utilized Markov chains and CA to simulate spatiotemporal urbanization processes in Mumbai, India. In the present study, we made use of this body of knowledge and integrated a CA model with ANN to enhance the model calibration time.
A limitation of conventional CA is the determination of complex relationships between the driving forces and their weights. ANNs allow modeling complex nonlinear relationships (Pijanowski et al. Citation2002, Citation2009) and weight estimation of individual driving forces in CA simulation (Lio and Yeh Citation2001; Tayyebi et al. Citation2014b). For example, a comparison among ANN, classification tree, and multivariate adaptive regression splines by Tayyebi et al. (Citation2014b) found that ANN outperformed the other models in the short run (e.g. 5 years) and for coarse-resolution data (e.g. 1 km); however, similar accuracies are achieved by all models in the long run (e.g. 20 years) and for fine-resolution data (e.g. 30 m). A follow-up study (Tayyebi and Pijanowski Citation2014) reconfigured these three data mining models to concurrently simulate multiple land-use classes (agriculture, forest, and urban areas) in Wisconsin and Michigan, United States.
However, most of the recent LUC studies have mainly focused on the development of complex models while ignoring uncertainty in data and models (Tang and Pannell Citation2009). As highlighted by Tayyebi, Tayyebi, and Khanna (Citation2014), uncertainty in LUC modeling originating from data is greater than other uncertainty dimensions (e.g. model parameter and model outcome). To take uncertainty into account, Wu (Citation1996) proposed transition rules based on heuristics and fuzzy set theory to capture uncoordinated land development. Others, such as Pijanowski et al. (Citation2007), coupled a back-cast ANN with groundwater models to quantify the contribution of land uses to the groundwater signal arriving at streams. Results showed that uncertainty in models and back-cast ANN affected the modeling outcome as well as their reliability for natural resource and land-use planning. Therefore, LUC models may not exactly represent the relationship between the dependent and independent drivers due to inherent uncertainties observed in existing data (Yeh and Li Citation2006; Christman et al. Citation2015). Based on these findings, we also integrated CA and ANN models with fuzzy set theory to capture the uncertainty associated with data as well as transition rules.
Based on these identified methodological research gaps and the importance for policy-makers to protect orchards from ongoing urbanization in Maragheh, Iran, the prime objectives of this paper are as follows: first, the development of a CA with ANN and utilizing fuzzy set theory for urban analysis, virtually not yet employed in empirical studies so far, second, to compare the power of the CA–ANN–Fuzzy model with two existing approaches, namely basic CA and CA–ANN, and third, to explore the extent of threatened orchards during the last three decades as well as for the upcoming year 2025 by predicting threatened locations. The remainder of the paper is structured as follows. While Section 2 introduces the model integration, Section 3 describes the study area and data. Next, Section 4 discusses the empirical results, and finally Section 5 highlights major conclusions.
2. Methods
This section introduces the existing models, including CA and CA-ANN, as well as the newly developed CA–ANN–Fuzzy model. This section also presents how three models were calibrated using historical data and details description of the questionnaire used to identify significant drivers of urbanization.
2.1. Conventional CA
CA encompasses the following components (Clarke, Hoppen, and Gaydos Citation1997; Arun and Katiyar Citation2013): spatial arrangement of cells having a specific state, neighborhood associations, and transition rules (Barredo et al. Citation2003). Time in CA is considered to be discrete while space is frequently represented using two-dimensional grid cells (Shafizadeh Moghadam and Helbich Citation2013). Each cell has a finite number of states, representing different land-use types. A state of a cell depends on the landscape transitions in the immediate neighborhood. At any point in time, each cell has a probability of being converted form one land use type to another, where the probability is given by means of a neighborhood function defined by a priori-determined transition rules that involve both adjacent cells as well as several contributing driving forces (Qi et al. Citation2004; He et al. Citation2008).
2.2. Artificial neural network
ANNs are machine-learning techniques capable of capturing nonlinear associations underlying land-use transformations by formulating the relationships between input and output variables (Pijanowski et al. Citation2002; Grekousis and Photis Citation2014). The multilayer perceptron, as used in this paper, typically includes an input layer, a hidden layer, and an output layer. These three layers are connected to each other in a feed-forward manner (Pijanowski et al. Citation2009; Tayyebi, Perry, and Tayyebi Citation2014a, Citation2014b). Neurons in the hidden layer assign the relationships between the input and output nodes and pass the result through a nonlinear activation function to the output neuron or adjacent neuron of the corresponding hidden layer.
ANNs learn through training processes, which find the relations between the input variables and the output variables (Pijanowski et al. Citation2002). During the training, the initial model parameters are modified repeatedly until model outcomes represent the observed output as accurately as possible (Liu Citation2009). The most popular learning algorithm used in geospatial simulation is backpropagation (Hagenauer and Helbich Citation2012). This learning algorithm is essentially a search procedure that attempts to minimize an error function (Wang and Li Citation2011). ANNs start by randomly assigning the weightings and calculating the mean squared error (MSE), after which the cycle continues until a terminating criterion is met. The MSE is measured by calculating the difference between the output from the network and the actual output presented in the training phase (Pijanowski et al. Citation2014). If the level of MSE is not attained, the error is distributed back to the neurons in the hidden layer, thus allowing them to update the weightings and mitigate the error (Wang and Li Citation2011). A suitability map is then produced using an activation function that applies a neuron which receives the weighted output from connected neurons of the preceding layers.
2.3. Integrating CA, ANN, and fuzzy set theory
CA–ANN–Fuzzy is a multi-model approach developed in this study. This approach comprises the following four steps: (1) fuzzy membership functions are applied to quantify the uncertainty associated with the driving forces; (2) an ANN captures the complex relationships between the normalized driving forces that encourage urbanization to encroach on the orchards and determines CA transition weights; (3) the normalized driving forces and their optimized weights (obtained from ANN) input to a fuzzy CA model to identify orchard conversion potential for built-up areas; and 4) to estimate the amount of threatened orchards through mean and standard deviation normalization. An overview of the methodological workflow is given in .
Figure 1. Data preparation and modeling steps for simulating and predicting orchard loss.
2.3.1. Integrating fuzzy set theory into CA
As land-use transformations are complicated due to uncertainties (i.e. human decision-making behavior), fuzzy set theory is an attractive methodological extension to incorporate fuzziness in the development of CA transition rules and LUC monitoring (Santé et al. Citation2010). In a fuzzy CA, the transition of a cell state to another one is defined by means of a set of fuzzy logic-constrained rules, which are defined in a nondeterministic and probabilistic manner (Wu Citation1999). A fuzzy set is characterized by a fuzzy membership grade that scales from 0.0 to 1.0, where a value of 0 refers to nonmembership and a value of 1 represents complete membership (Zadeh Citation1992). Eastman (Citation2009) argues that fuzzy sets provide a standardized measure and avoid the selection of a priori unknown Boolean constraints or cut-off values. The following fuzzy membership function has been applied:
where is the state of cell
having a value between 0 and 1,
is the variable for which the membership function is defined, and
as well as
are the lower (0) and higher (1) values for a cell.
In accordance with fuzzy set theory (Zadeh Citation1992), LUC is a continuous process where the state of a cell is defined by a membership function. Fuzzy CA uses the LUC probability between two cells (ij) as shown in Equation (2) (Li et al. Citation2011, Citation2013):
where is the state of cell
at time
,
is the conversion possibility at time t for cell
,
is land-use conversion force of a cell
at time
,
is the force weight of cell
(calculated with ANN in this study: see Section 2.2),
is the stochastic disturbance factor,
is a uniform random variable within the range [0,1] in accordance with fuzzy membership function, and
is the dispersion parameter to control the size of the stochastic perturbation.
The result of fuzzy CA is a nondeterministic output that shows the degree of cell conversion. However, it is required that the cells having high potential for conversion are shown as real values, such as threatened sites. To achieve this, a mean and standard deviation normalization are used to normalize fuzzy CA as shown in Equation (3):
where is the output value of
or the fuzzy CA that ranges between −1 and 1 for cell
and
is the standard deviation for cells of
at time
. When all values are transformed in this fashion, the threatened sites are determined as given in the following Equation (4):
where 1 refers to threatened sites and 0 to unchanged areas.
2.3.2. Integration of fuzzy CA and ANN
The objective of CA calibration is to find the best combination of transition rules to model LUC (Batty, Xie, and Sun Citation1999). Transition rules have an important role in calibrating CAs, which might result in different simulation outputs (Yeh and Li Citation2001). It is challenging to define the best combinations of transition rules when there are many variables, because LUC patterns are complex (Luo, Yu, and Xin Citation2008). The variations are due to many possible ways of defining the transition rules. Land-change modelers usually integrate CA with other data mining tools to perform CA calibration. ANNs are appropriate algorithms for the calibration of CA parameters (Li and Yeh Citation2002) and usually have a higher overall accuracy than other models (e.g. logistic regression) for calibrating LUC models (Lin et al. Citation2011). It has been shown that ANNs as mathematical models are robust in calibrating CA models (Li et al. Citation2011; Wang and Li Citation2011; Li et al. Citation2013; Lee, Wu, and Lei Citation2013). Thus, in this study, we used ANN with a multilayer perceptron (see Section 2.2 for more details) to calibrate the fuzzy CA model.
2.4. Questionnaire survey to obtain driving forces
To identify the driving forces that encourage urbanization of the orchards in Maragheh, we distributed a questionnaire among farmers, housebuilders, real estate agents, natural resource conservation organization (NRCO), and city authorities who worked in the garden protection sector. The sample was selected according to the following criteria: age (50 years older and above), continually resided in Maragheh for the last 15–40 years and considered by the locals to have sufficient knowledge about the orchards’ destruction and their correlation with urbanization. The questionnaire focused on 31 socioeconomic and spatial factors. The respondents were clustered to 30 farmers, 15 housebuilders, 12 real estate agents, 13 NRCO employees, and 20 employees of Maragheh municipality.
We used personal interviews guided by the questionnaire, which were answered by ticking on a 5-point Likert scale. The interview-based survey provided an in-depth understanding of the local actors’ knowledge about the driving forces and details about the main causes for the mentioned forces. Three essential questions of survey were: (1) Which factors are important in the conversion of orchards to built-up areas? (2) What is the logic behind these factors? 3) What is the relative importance of factors in orchards conversion to urban areas? Questions 1 and 3 were covered by the questionnaire and we interviewed the respondents for question 2.
After the questionnaire survey was carried out, factor analysis was used in SPSS to extract important factors. Factor analysis is a statistical method to explain the correlations between the observations in terms of the underlying factors, which are not directly observable (Yu et al. Citation2003). It is often applied to identify a small number of latent variables that describe most of the variance embedded in a larger number of observed variables (Thompson Citation2004).
2.5. Model calibration
It is necessary to calibrate the LUC model with reliable historic data before using the model for prediction purposes (Pijanowski et al. Citation2014). To calibrate the three models (CA, CA–ANN, and CA–ANN–Fuzzy), training data was used, and the test set was used to evaluate the performance of the three models. We used Kappa statistic to determine how well the model outputs matched the reference change maps. Kappa calculates the percentage success of a model relative to chance between two categorical datasets (Doswell, Davies-Jones, and Keller Citation1990). Since many LUC model outputs are categorical, Kappa is useful for comparing model outcome and reference change map using Equation (5) (Monserud and Leemans Citation1992; Hagen-Zanker and Martens Citation2008).
where is the percent correct for modeling output,
the expected correct due to chance, and
the percent correct when modeling is perfect, which is 100 or 1. It is generally considered (Tayyebi, Pijanowski, and Pekin Citation2015) that Kappa values for map agreement are as follows: >80% is excellent; 60–80% is very good; 40–60% is good; 20–40% is poor and <20% is very poor.
3. Study area, data preparation, and model implementation
3.1. Study area
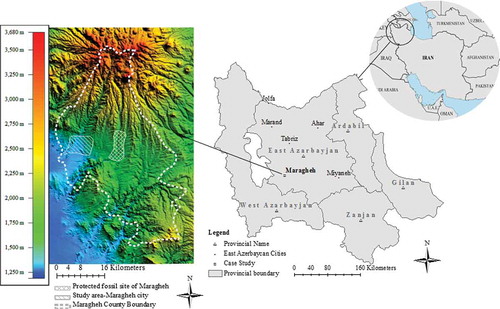
The study area is Maragheh city, one of the oldest cities in Iran. It is located on the northwest side of the country (). The area of the city is approximately 18.66 km2. In terms of population, it is a mid-sized city and situated in the northeast of Ourmieh Lake and west of the protected fossil site. Maragheh is well-known for its favorable climate and attractive orchard landscape. The Safi Chay River crosses the east of Maragheh and creates a cultivated plain that makes Maragheh famous as a “Garden City” in Iran. In addition to valuable ecological features, orchards are important for the following reasons: (1) products of the orchards are an essential part of Maragheh’s economy; (2) the orchards are main landscape features and a key symbol of urban identity; and (3) the orchards are a crucial tourism attraction in Maragheh.
Figure 2. Study area located in northwest of Iran. For full color versions of the figures in this paper, please see the online version.
3.2. Data preparation
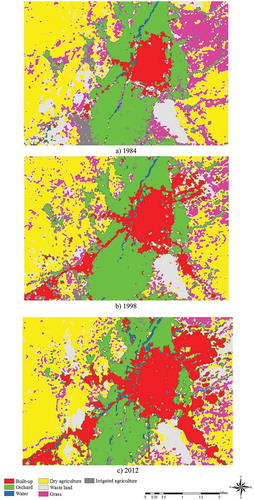
Three Landsat TM and ETM+ images (30 × 30 m) in 1984, 1998, and 2012 were used to extract land-use maps. The selection of the years was based on data availability as well as the following characteristics: the reduction of sessional effects, regular time intervals between the images, and cloud-free images. The three Landsat images (1984, 1998, and 2012) were classified using fuzzy ARTMAP algorithm (Carpenter, Grossberg, and Reynolds Citation1991), since this method usually provides a higher accuracy compared to alternative classification methods (Tong and Pern Citation2000; Muchoney and Williamson Citation2001; Azari and Reveshty Citation2013). We used stratified random sampling with 500 points over the entire landscape for training sites. These 500 points represented seven land-use classes, including: built-up areas, orchards, water, dry farming, grassland, irrigated agriculture land, regolith, and wasteland (; Universal Transverse Mercator WGS 1984 zone 39 N). Reference data for the accuracy assessment of the classification outputs originate from the following sources: field observation, topographic maps, and aerial photos. The Kappa statistics were 88%, 93%, and 90% for 1984, 1998, and 2012, respectively.
Figure 3. Land-use maps of Maragheh in (a) 1984, (b) 1998, and (c) 2012.
The questionnaire focused on 31 socioeconomic and spatial factors. Factor analysis revealed that the following variables were relevant: (1) vegetation; (2) land prices; (3) distance to central business district (CBD); (4) slope; and (5) accessibility to transportation networks.
3.2.1. Vegetation
The normalized difference vegetation index (NDVI) based on Landsat data was computed to reveal the variety of vegetation characteristics that include quantity, productivity, biomass, etc. (Equation (5); Myneni et al. Citation1995):
where are the band 4 and band 3 of Landsat ETM+ data, respectively. The NDVI varies between –1 and 1. Areas containing dense vegetation usually show values close to 1, indicating a reduced potential for orchard conversion to housing. In contrast, areas containing sparse vegetation show NDVI values closer to −1, indicating that these areas have a high potential for the orchard conversion to urban areas (Myneni et al. Citation1995).
3.2.2. Land prices
Land prices in the neighborhoods as well as the rate of price changes in the last 10 years were extracted from the database of a real estate agency. The major purpose was to have general knowledge of land prices in the neighborhoods and the rate of price changes over the last 10 years. The questionnaire respondents were selected according to their willingness to provide information and whether they continually worked in real estate businesses in the last 10 years and had sufficient knowledge about land price changes. Land prices and their intensity changes in the last 10 years were mapped at local neighborhoods and rasterized at a 30 m resolution.
3.2.3. Distance to the central business district
To create CBD layer, buffer function was used in GIS to calculate the distance from the closest CBD ().
Table 1. Data sources and types.
3.2.4. Slope
Slope values were extracted from Aster digital elevation map (DEM) dataset. The DEM has a 15 × 15 m spatial resolution.
3.2.5. Accessibility to main transport networks
To create accessibility to the main transport network layer, the buffer function was used in GIS to calculate the distance from the closest transport networks.
3.3. Model implementation
ANN was used to obtain optimized weights of CA parameters using the MATLAB software. Two groups of data were used to build ANN: (1) historical LUCs between 1984, 1998, and 2012; and (2) land-use conversion forces. Before training the ANN, three primary tasks were carried out: First, the data were converted to the same spatial resolution (the spatial resolution of 30 m because Landsat TM and ETM+ data were used). Second, as the data had different ranges, we normalized them into the range between 0 and 1 using a linear membership function in fuzzy set theory. Third, the data were divided into training and testing data (Tayyebi and Pijanowski Citation2014). We randomly selected 70% of the entire data as training data and the remaining data was reserved as testing data (Tayyebi, Tayyebi, and Khanna Citation2014).
The ANN consists of an input layer, one hidden layer, and an output layer (Tayyebi et al. Citation2013). In this study, we used five inputs (i.e. land-use types and spatial variables mentioned before) and one output (representing the orchards change and no-change in the historical LUC in and ). We also combined water and protected areas in a new layer called “exclusionary zone” and masked these areas out of the simulation and further analysis. After obtaining the optimal weights for the three models in the training run, the whole data were used to simulate conversion of the orchards. IDRISI Selva version (Clark Labs, Clark University, Worcester, MA, USA) was utilized for CA simulation. We verified the predictive ability of the three models through the simulation of orchard conversion in 2012 based on their status in 1998 and comparison with reference land-use map.
Table 2. LUC between 1984 and 2012. The numbers of cells and percent values are given.
Table 3. LUC between 1998 and 2012. The numbers of cells and percent values are given.
4. Results
4.1. Analysis of data from interviews
To select the potential driving forces for orchard conversion to built-up areas, questionnaire data were analyzed using factor analysis. The five driving forces described in could explain 74.6% of the total variation.
Table 4. Factor analysis statistics for elicited forces.
To assess the main reasons stated by the respondents, to extract the driving forces, interviews were carried out with the selected sample. Vegetation factor explained 21.14% of variation in the orchard conversion to built-up areas. In Maragheh, the key reasons for orchard destruction were found to be monetary benefits. Land regulations prohibit orchard conversion for construction purposes; the orchards are kept dried by owners who can then receive the permit to build houses for their wasted lands. Therefore, the orchards with low-density vegetation have a high potential to be changed to built-up areas.
Land prices in the neighborhoods are an essential factor in tendency of landowners to sell their lands for construction. This factor explained 17.54% of variations. According to the land price survey, the north and northwest neighborhoods had the highest land prices and farmers were more likely to sell their orchards for built-up purposes in these areas. Several factors potentially led to urbanization and orchard conversion, including distance to CBD, slope, and accessibility to transportation networks. Slope variable explained 14.21% of variation. Steep slopes were found to be less attractive for urban expansion, and the cells showing a pronounced slope have a low potential for urban development compared to lower slopes. Therefore, the orchards which are located in the steep and irregular slopes have a less potential for urbanization.
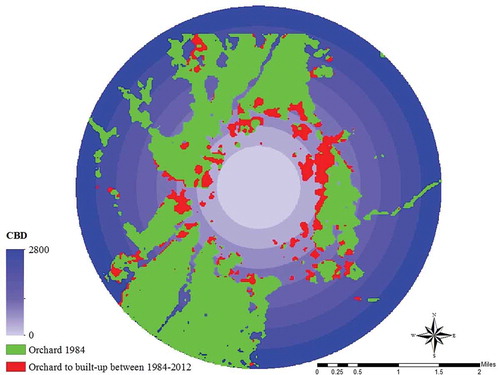
Most of the respondents mentioned that new settlements are more probable to be built near transport networks. Therefore, the orchards that have a small distance to transport links have a high potential of conversion to built-up areas. This variable explained 12.14% of variation. The orchards near the CBD have a higher destruction potential than the orchards that are further apart. This variable explained 9.57% of variation. Seventeen percent of the orchards that were converted to built-up areas lie in the first 400 m, 39% lie in the second 400 m, and 24% lie in the third 400 m. The amount of the orchard conversion to built-up areas reduced in the following rings. shows the CBD influence on orchard conversion to built-up areas in 1984–2012.
Figure 4. CBD influence on orchards conversion to built-up areas between 1984 and 2012.
4.2. Historical LUC
We used a contingency table (Christman et al. Citation2015) to summarize the temporal and spatial changes in Maragheh. , and show the LUC in three time periods: 1984–1998, 1984–2012, and 1998–2012. Also, the tables show gains and losses of each land-use class. In the time period 1984–1998, 36.95% of the land uses changed to other land-use classes. This amount increased to 41.87% in 1998–2012. Water, dry farming, and wasteland were the classes that showed higher stability in 1984–2012. The proportion of built-up areas increased notably compared to other classes from 1984 to 2012 (16.62% increased). The proportion of built-up areas increased by 7.98% and 8.64% in the first (1984–1998) and the second periods (1998–2012), respectively. In contrast, orchards, irrigated agriculture, and grassland reduced, with a loss of more than 6% for each category in 1984–2012. Most losses of grassland occurred in the first time period (1984–1998), but orchards and irrigated losses intensified in second period (1998–2012). Between 1998 and 2012, more than 5721 cells (6.78%) of the orchards were converted to gain other categories, especially built-up areas (1543 cells) and dry farming (2593 cells).
Table 5. LUC between 1984 and 1998. The numbers of cells and percent values are given.
4.3. Simulation of orchard loss
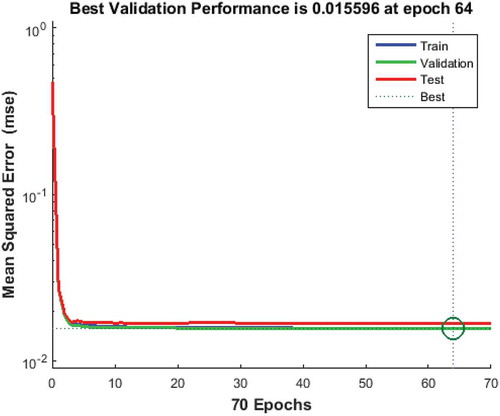
shows the MSE across the training cycles of ANN. The MSE starts at around 0.05 and drops linearly thorough three cycles. We stopped training at 70 cycles, where the MSE was 0.015 at epoch 64. After factor weights were optimized by ANN, we obtained the neighborhood size through empirically testing the model accuracy. The CA, CA–ANN, and CA–ANN–Fuzzy were run in different neighborhood sizes with the same combination of input data. The comparison revealed that a 7 × 7 neighborhood size had the highest accuracy (). Kappa coefficients were 0.51, 0.79, and 0.83 for CA, CA–ANN, and CA–ANN–Fuzzy, respectively. The simulation results were acceptable for CA–ANN and CA–ANN–Fuzzy since overall Kappa statistics for these models were over 0.80. However, we used CA–ANN–Fuzzy with the best performance to simulate future orchard conversion.
Table 6. Accuracy for CA, CA–ANN, and CA–ANN–Fuzzy with different neighborhood sizes.
Figure 5. Training run of ANN MSE and MSE value across cycles.
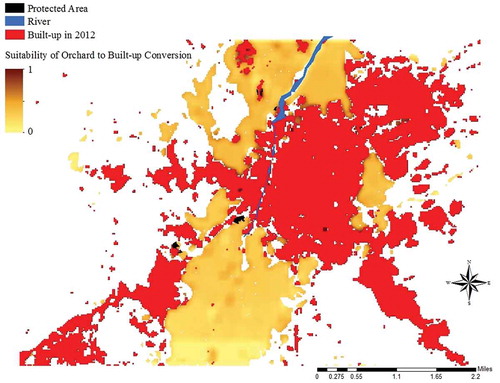
After model verification, we simulated urban developments for the year 2025 to estimate the quantity of potential orchard loss due to urbanization. We used CA–ANN–Fuzzy to simulate urbanization in 2025 since this model had the best performance compared to other models. This simulation is based on spatial variables, land-use map for 2012, data combination based on ANN results, and a 7 × 7 neighborhood size. The first output of the model is a suitability map showing the locations that are more likely to be converted from orchards to urban areas. A pixel value closer to 1 indicates a higher change probability to urban areas while values closer to 0 are more likely to stay as orchards. shows orchard conversion potential obtained by fuzzy CA–ANN modeling.
Figure 6. Suitability map of orchard conversion to built-up areas obtained by fuzzy CA–ANN.
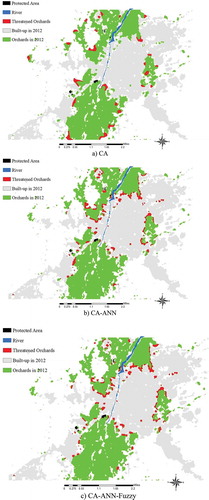
We specifically identified the threatened sites or the orchards that are more endangered and require protection by authorities. Since CA models lack the ability to determine the actual amount of change, mean and standard deviation normalization were utilized to convert fuzzy CA output to simulated change. According to the CA–ANN–Fuzzy model, 0.963 km2 or 7.34% of Maragheh orchards will be destructed as a consequence of urbanization processes in 2025 (). Results also showed that the threatened sites are located along the edge of urban and suburban areas (in less than 1 km from the edge of the built-up area).
Figure 7. Predicting and comparing the threatened orchard in 2025 using (a) CA, (b) CA–ANN, and (c) CA–ANN–Fuzzy.
5. Discussion and conclusions
Orchards of Maragheh play a significant role from ecological, economical, and tourist perspectives. In the recent years, however, the demand for built-up areas caused encroachment on the orchards and damaged ecological resources. This study attempted to determine the impacts of urbanization on orchard areas and identify areas at risk, to preserve the orchards. Assessment of the historical land-use data revealed a substantial decline in orchard areas. The historical data showed a considerable loss of 25.65% during the last three decades. The predicted map indicated that other 7.34% of Maragheh orchards will be replaced by urban constructions by 2025.
This study also compared the power of three land-use models (CA, CA–ANN, and CA–ANN–Fuzzy) for simulating orchard loss. This study showed the flexibility of CA to be integrated with other models, such as fuzzy set theory and ANN, to identify areas that are at risk and need to be protected. Results also showed that both CA–ANN and CA–ANN–Fuzzy performed better than conventional CA. This is due to the fact that conventional CA cannot detect nonlinear spatial and temporal patterns in land-use data, while CA–ANN and CA–ANN–Fuzzy both use ANN to identify nonlinear patterns in data. While both CA–ANN and CA–ANN–Fuzzy were able to simulate complex patterns of orchard loss, CA–ANN–Fuzzy performed slightly better than CA–ANN. This is due to the fact that fuzzy set theory captured the uncertainty associated with transition rules.
This study also demonstrated that incorporating questionnaires in spatial LUC models can provide better simulation results. The results of factor analysis conducted on survey data showed that human-induced forces such as house prices are highly influential and drive the urbanization to encroach on the orchards. Generally, more pronounced land prices increase the tendency to sell orchards for housing purposes. According to Azari and Reveshty (Citation2013), there has been a moderate correlation (42%) between accessibility to main transport links and built-up areas in Maragheh during 1984–2011. Therefore, the orchards, being highly accessible, are facing high conversion potential for urban construction. Jadidyan (Citation2012) argues that accessibility and building commercial areas are essential factors for the construction of built-up areas near the transportation network.
Results showed that the threatened orchards located in suburban areas are next to the existing built-up areas. Besides ecological, economical, and tourist issues, the suburban orchards function as a green belt. Suburban orchards also reduce air pollution caused by factories located in the surroundings of Maragheh. Therefore, these areas require more attention from authorities to ensure the ecological integrity of such landscapes. For future research, we suggest the use of high-resolution remote-sensing images to explore changes on a more detailed scale.
Disclosure statement
No potential conflict of interest was reported by the authors.
ORCID
Mehdi Azari ![]() http://orcid.org/0000-0002-4156-6022
http://orcid.org/0000-0002-4156-6022
Notes
1. It reflects the ratio of urban population to total population.
References
- Almeida, C. M., J. M. Gleriani, E. F. Castejon, and B. S. Soares-Filho. 2008. “Using Neural Networks and Cellular Automata for Modelling Intra-urban Land-use Dynamics.” International Journal of Geographical Information Science 22 (9): 943–963.
- Arun, P. V., and S. K. Katiyar. 2013. “An Intelligent Approach Towards Automatic Shape Modelling and Object Extraction from Satellite Images Using Cellular Automata-Based Algorithms.” GIScience & Remote Sensing 50 (3): 337–348.
- Azari, M., and M. A. Reveshty. 2013. “Interference of Human Impacts in Urban Growth Modelling with Transition Rules of Cellular Automata, GIS and Multi-Temporal Satellite Imagery: A Case Study of Maraghe Iran.” Journal of the Indian Society of Remote Sensing 41 (4): 993–100. doi:10.1007/s12524-013-0275-2.
- Barredo, J. I., M. Kasanko, N. M. Cormick, and C. Lavalle. 2003. “Modelling Dynamic Spatial Processes: Simulation of Urban Future Scenarios through Cellular Automata.” Landscape and Urban Planning 64 (3): 145–160. doi:10.1016/S0169-2046(02)00218-9.
- Basse, R. M., H. Omrani, O. Charif, P. Gerber, and K. Bódis. 2014. “Land Use Changes Modelling Using Advanced Methods: Cellular Automata and Artificial Neural Networks. the Spatial and Explicit Representation of Land Cover Dynamics at the Cross-Border Region Scale.” Applied Geography 53: 160–171. doi:10.1016/j.apgeog.2014.06.016.
- Batty, M., Y. C. Xie, and Z. L. Sun. 1999. “Modeling Urban Dynamics through GIS-Based Cellular Automata.” Computers, Environment and Urban Systems 23 (3): 205–233. doi:10.1016/S0198-9715(99)00015-0.
- Carpenter, G. A., S. Grossberg, and J. H. Reynolds. 1991. “ARTMAP: Supervised Real-Time Learning and Classification of Nonstationary Data by a Self-Organizing Neural Network.” Neural Networks 4: 565–588. doi:10.1016/0893-6080(91)90012-T.
- Christman, Z., J. Rogan, J. R. Eastman, and B. L. Turner. 2015. “Quantifying Uncertainty and Confusion in Land Change Analyses: A Case Study from Central Mexico Using MODIS Data.” GIScience & Remote Sensing 52 (5): 543–570.
- Clarke, K. C., S. Hoppen, and L. J. Gaydos. 1997. “A Self-Modifying Cellular Automaton Model of Historical Urbanization in the San Francisco Bay Area.” Environment and Planning B 24: 247–261. doi:10.1068/b240247.
- Czamanski, D., I. Benenson, D. Malkinson, M. Marinov, R. Roth, and L. Wittenberg. 2008. “Urban Sprawl and Ecosystems E Can Nature Survive?.” International Review of Environmental and Resource Economics 2 (4): 321–366. doi:10.1561/101.00000019.
- Dietzel, C., and K. Clarke. 2006. “The Effect of Disaggregating Land Use Categories in Cellular Automata during Model Calibration and Forecasting.” Computers, Environment and Urban Systems 30 (1): 78–101. doi:10.1016/j.compenvurbsys.2005.04.001.
- Doswell, C. A. III, R. Davies-Jones, and D. L. Keller. 1990. “On Summary Measures of Skill in Rare Event Forecasting Based on Contingency Tables.” Weather and Forecasting 5 (4): 576–585. doi:10.1175/1520-0434(1990)005<0576:OSMOSI>2.0.CO;2.
- Eastman, J. R. 2009. IDRISI 16: The Andes Edition. Worcester: Clark University.
- Estoque, R. C., and Y. Murayama. 2014. “A Geospatial Approach for Detecting and Characterizing Non-Stationarity of Land-Change Patterns and Its Potential Effect on Modeling Accuracy.” GIScience & Remote Sensing 51 (3): 239–252. doi:10.1080/15481603.2014.908582.
- Grekousis, G., P. Manetos, and Y. N. Photis. 2013. “Modeling Urban Evolution Using Neural Networks, Fuzzy Logic and GIS: The Case of the Athens Metropolitan Area.” Cities 30: 193–203. doi:10.1016/j.cities.2012.03.006.
- Grekousis, G., and Y. N. Photis. 2014. “Analyzing High-Risk Emergency Areas with GIS and Neural Networks: The Case of Athens, Greece.” The Professional Geographer 66 (1): 124–137. doi:10.1080/00330124.2013.765300.
- Grimm, N. B., S. H. Faeth, N. E. Golubiewski, C. L. Redman, J. Wu, X. Bai, and J. M. Briggs. 2008. “Global Change and the Ecology of Cities.” Science 319 (5864): 756–760. doi:10.1126/science.1150195.
- Haase, D., and H. Nuissl. 2010. “Assessing the Impacts of Land Use Change on Transforming Regions.” Journal of Land Use Science 5 (2): 67–72. doi:10.1080/1747423X.2010.481074.
- Hagenauer, J., and M. Helbich. 2012. “Mining Urban Land-Use Patterns from Volunteered Geographic Information by Means of Genetic Algorithms and Artificial Neural Networks.” International Journal of Geographical Information Science 26 (6): 963–982. doi:10.1080/13658816.2011.619501.
- Hagen-Zanker, A., and P. Martens. 2008. “Map Comparison Methods for Comprehensive Assessment of Geosimulation Models.” In Paper presented at the Computer Science, Proceedings of the 2008 International Conference on Computational Science and Its Applications ICCSA 2008, edited by O. Gervasi, B. Murgante, A. Lagana, D. Taniar, Y. Mun, and M. Gavrilova, 194–209. Berlin, Germany: Springer.
- He, C., N. Okada, Q. Zhang, P. Shi, and J. Li. 2008. “Modelling Dynamic Urban Expansion Processes Incorporating a Potential Model with Cellular Automata.” Landscape and Urban Planning 86 (1): 79–91. doi:10.1016/j.landurbplan.2007.12.010.
- Iran Statistical Center. 2013. Iran Population Statistical Yearbook. Tehran: Iran Statistical Press.
- Jadidyan, A. 2012. An analysis on gardens and green spaces destroying in urban growth process and strategies to confronted with them: The Case; City of Maragheh. MA dissertation, Tabriz: Tabriz University.
- Jarnagin, S. T. 2004. “Regional and Global Patterns of Population, Land Use, and Land Cover Change: An Overview of Stressors and Impacts.” GIScience & Remote Sensing 41 (3): 207–227. doi:10.2747/1548-1603.41.3.207.
- Jokar Arsanjani, J., M. Helbich, and A. Mousivand. 2014. “A Morphological Approach to Predicting Urban Expansion.” Transactions in GIS 18 (2): 219–233. doi:10.1111/tgis.2014.18.issue-2.
- Khiabani, N. 2004. “Determinant Factors of Price of House in Iran.” The Quartely Journal of Housing Economy- Autumn 34 (8): 46–53.
- Lee, S.-T., C.-W. Wu, and T.-C. Lei. 2013. “CA-GIS Model for Dynamic Simulation of Commercial Activity Development by the Combination of ANN and Bayesian Probability.” Procedia Computer Science 18: 651–660. doi:10.1016/j.procs.2013.05.229.
- Li, X., C. Lao, Y. Liu, X. Liu, Y. Chen, S. Li, and B. Ai. 2011. “Concepts, Methodologies, and Tools of an Integrated Geographical Simulation and Optimization System.” International Journal of Geographical Information Science 25 (4): 633–655. doi:10.1080/13658816.2010.496370.
- Li, X., C. Lao, Y. Liu, X. Liu, Y. Chen, S. Li, B. Ai, and Z. He. 2013. “Early Warning of Illegal Development for Protected Areas by Integrating Cellular Automata with Neural Networks.” Journal of Environmental Management 130: 106–116. doi:10.1016/j.jenvman.2013.08.055.
- Li, X., and A. G. O. Yeh. 2001. “Zoning Land for Agricultural Protection by the Integration of Remote Sensing, GIS and Cellular Automata.” Photogrammetric Engineering & Remote Sensing 67 (4): 471–477. doi:00099-111z/01/6704471$3.0.
- Li, X., and A. G. O. Yeh. 2002. “Neural-Network-Based Cellular Automata for Simulating Multiple Land Use Changes Using GIS.” International Journal of Geographical Information Science 16 (4): 323–343. doi:10.1080/13658810210137004.
- Lin, Y. P., H. J. Chu, C. F. Wu, and P. H. Verburg. 2011. “Predictive Ability of Logistic Regression, Auto-Logistic Regression and Neural Network M Odels in Empirical Land-Usechange Modeling - a Case Study.” International Journal Geograph 25 (1): 65–87. doi:10.1080/13658811003752332.
- Lio, X., and A. G. O. Yeh. 2001. “Calibration of Cellular Automata by Using Neural Networks for the Simulation of Complex Urban Systems.” Environment and Planning A 33 (8): 1445–1462. doi:10.1080/13658810210157769.
- Liu, Y. 2009. Modelling Urban Development with Geographical Information Systems and Cellular Automata. New York: Taylor & Francis Group.
- Luo, J., D. Yu, and M. Xin. 2008. “Modeling Urban Growth Using GIS and Remote Sensing.” GIScience & Remote Sensing 45 (4): 426–442. doi:10.2747/1548-1603.45.4.426.
- Mantelas, L., P. Prastacos, T. Hatzichristos, and K. Koutsopoulos. 2012. “A Linguistic Approach to Model Urban Growth.” International Journal of Agricultural and Environmental Information Systems (IJAEIS) 3 (2): 35–53. doi:10.4018/IJAEIS.
- Meidani, A. N., M. Zabihi, and M. Ashena. 2011. “House prices, Economic Output, and Inflation Interactions in Iran.” Research in Applied Economics 3 (1): 1–13. doi:10.5296rae.v3i1.664.
- Monserud, R. A., and R. Leemans. 1992. “Comparing Global Vegetation Maps with the Kappa Statistic.” Ecological Modelling 62 (4): 275–293. doi:10.1016/0304-3800(92)90003-W.
- Muchoney, D., and J. Williamson. 2001. “A Gaussian Adaptive Resonance Theory Neural Network Classification Algorithm Applied to Supervised Land Cover Mapping Using Multi Temporal Vegetation Index Data.” IEEE Transactions on Geoscience and Remote Sensing 39: 1969–1977. doi:10.1109/36.951087.
- Myneni, R. B., F. G. Hall, P. J. Sellers, and A. L. Marshak. 1995. “The Interpretation of Spectral Vegetation Indexes.” IEEE Transactions on Geoscience and Remote Sensing 33 (2): 481–486. doi:10.1109/36.377948.
- Pijanowski, B. C., D. G. Brown, B. A. Shellito, and G. A. Manik. 2002. “Using Neural Networks and GIS to Forecast Land Use Changes: A Land Transformation Model.” Computers Environment and Urban Systems 26 (6): 553–575. doi:10.1016/S0198-9715(01)00015-1.
- Pijanowski, B. C., A. Tayyebi, M. R. Delavar, and M. J. Yazdanpanah. 2009. “Urban Expansion Simulation Using Geographic Information Systems and Artificial Neural Networks.” International Journal of Environmental Research 3 (4): 493–502.
- Pijanowski, B. C., A. Tayyebi, J. Doucette, B. K. Pekin, D. Braun, and J. Plourde. 2014. “A Big Data Urban Growth Simulation at A National Scale: Configuring the GIS and Neural Network Based Land Transformation Model to Run in A High Performance Computing (HPC) Environment.” Environmental Modelling & Software 51: 250–268. doi:10.1016/j.envsoft.2013.09.015.
- Pijanowski, B., D. K. Ray, A. D. Kendall, J. M. Duckles, and D. W. Hyndman. 2007. “Using Backcast Land-use Change and Groundwater Travel-time Models to Generate Land-use Legacy Maps for Watershed Management.” Ecology and Society 12 (2): 25.
- Qi, Y., M. Henderson, M. Xu, J. Chen, P. Shi, C. He, and W. Skinner. 2004. “Evolving Core–Periphery Interactions in a Rapidly Expanding Urban Landscape: The Case of Beijing.” Landscape Ecology 19 (4): 375–388. doi:10.1023/B:LAND.0000030415.33172.f5.
- Santé, I., A. M. García, D. Miranda, and R. Crecente. 2010. “Cellular Automata Models for the Simulation of Real-World Urban Processes: A Review and Analysis.” Landscape and Urban Planning 96 (2): 108–122. doi:10.1016/j.landurbplan.2010.03.001.
- Shafizadeh Moghadam, H., and M. Helbich. 2013. “Spatiotemporal Urbanization Processes in the Megacity of Mumbai, India: A Markov Chains-Cellular Automata Urban Growth Model.” Applied Geography 40: 140–149. doi:10.1016/j.apgeog.2013.01.009.
- Shafizadeh Moghadam, H., and M. Helbich. 2015. “Spatiotemporal Variability of Urban Growth Factors: A Global and Local Perspective on the Megacity of Mumbai.” International Journal of Applied Earth Observation and Geoinformation 35: 187–198. doi:10.1016/j.jag.2014.08.013. ( (in press)).
- Su, S., R. Xiao, Z. Jiang, and Y. Y. Zhang. 2012. “Characterizing Landscape Pattern and Ecosystem Service Value Changes for Urbanization Impacts at an Eco-Regional Scale.” Applied Geography 34: 295–305. doi:10.1016/j.apgeog.2011.12.001.
- Tang, Y., and C. W. Pannell. 2009. “A Hybrid Approach for Land Use/Land Cover Classification.” GIScience & Remote Sensing 46 (4): 365–387. doi:10.2747/1548-1603.46.4.365.
- Tayyebi, A., B. K. Pekin, B. C. Pijanowski, J. D. Plourde, J. S. Doucette, and D. Braun. 2013. “Hierarchical Modeling of Urban Growth across the Conterminous USA: Developing Meso-Scale Quantity Drivers for the Land Transformation Model.” Journal of Land Use Science 8 (4): 422–442. doi:10.1080/1747423X.2012.675364.
- Tayyebi, A., P. C. Perry, and A. H. Tayyebi. 2014a. “Predicting the Expansion of an Urban Boundary Using Spatial Logistic Regression and Hybrid Raster–Vector Routines with Remote Sensing and GIS.” International Journal of Geographical Information Science 28 (4): 639–659. doi:10.1080/13658816.2013.845892.
- Tayyebi, A., and B. C. Pijanowski. 2014. “Modeling Multiple Land Use Changes Using ANN, CART and MARS: Comparing Tradeoffs in Goodness of Fit and Explanatory Power of Data Mining Tools.” International Journal of Applied Earth Observation and Geoinformation 28: 102–116. doi:10.1016/j.jag.2013.11.008.
- Tayyebi, A., B. C. Pijanowski, M. Linderman, and C. Gratton. 2014b. “Comparing Three Global Parametric and Local Non-Parametric Models to Simulate Land Use Change in Diverse Areas of the World.” Environmental Modelling & Software 59: 202–221. doi:10.1016/j.envsoft.2014.05.022.
- Tayyebi, A., B. C. Pijanowski, and B. Pekin. 2011b. “Two Rule-Based Urban Growth Boundary Models Applied to the Tehran Metropolitan Area, Iran.” Applied Geography 31 (3): 908–918. doi:10.1016/j.apgeog.2011.01.018.
- Tayyebi, A., B. C. Pijanowski, and B. K. Pekin. 2015. “Land Use Legacies of the Ohio River Basin: Using a Spatially Explicit Land Use Change Model to Assess past and Future Impacts on Aquatic Resources.” Applied Geography 57: 100–111. doi:10.1016/j.apgeog.2014.12.020.
- Tayyebi, A., B. C. Pijanowski, and A. H. Tayyebi. 2011a. “An Urban Growth Boundary Model Using Neural Networks, GIS and Radial Parameterization: An Application to Tehran, Iran.” Landscape and Urban Planning 100 (1–2): 35–44. doi:10.1016/j.landurbplan.2010.10.007.
- Tayyebi, A. H., A. Tayyebi, and N. Khanna. 2014. “Assessing Uncertainty Dimensions in Land-Use Change Models: Using Swap and Multiplicative Error Models for Injecting Attribute and Positional Errors in Spatial Data.” International Journal of Remote Sensing 35 (1): 149–170. doi:10.1080/01431161.2013.866293.
- Thompson, B. 2004. Book Title: Exploratory and Confirmatory Factor Analysis: Understanding Concepts and Applications. Washington, DC: American.
- Tong, H. T. H., and M. D. Pern. 2000. “New Shape Classifier by Using Image Projection and a Neural Network.” International Journal of Pattern Recognition and Artificial Intelligence 14 (2): 225–242. doi:10.1142/S0218001400000155.
- Verburg, P. H., P. Schot, M. Dijst, and A. Veldkamp. 2004. “Land Use Change Modelling: Current Practice and Research Priorities.” GeoJournal 61 (4): 309–324. doi:10.1007/s10708-004-4946-y.
- Wang, Y., and S. Li. 2011. “Simulating Multiple Class Urban Land-Use/Cover Changes by RBFN-Based CA Model.” Computers & Geosciences 37 (2): 111–121. doi:10.1016/j.cageo.2010.07.006.
- Wu, F. 1996. “A Linguistic Cellular Automata Simulation Approach for Sustainable Land Development in A Fast Growing Region.” Computers, Environment and Urban Systems 20 (6): 367–387. doi:10.1016/S0198-9715(97)00003-3.
- Wu, F. 1999. “GIS-Based Simulation as an Exploratory Analysis for Space-Time Processes.” Journal of Geographical Systems 1 (3): 199–218. doi:10.1007/s101090050012.
- Yeh, A. G., and X. Li. 2006. “Errors and Uncertainties in Urban Cellular Automata.” Computers, Environment and Urban Systems 30 (1): 10–28. doi:10.1016/j.compenvurbsys.2004.05.007.
- Yeh, A. G. O., and X. Li. 2001. “A Constrained CA Model for the Simulation and Planning of Sustainable Urban Forms by Using GIS.” Environment and Planning B: Planning and Design 28 (5): 733–753. doi:10.1068/b2740.
- Yu, S., J. Shang, J. Zhao, and H. Guo. 2003. “Factor Analysis and Dynamics of Water Quality of the Songhua River Northeast China.” Water, Air, and Soil Pollution 144: 159–169. doi:10.1023/A:1022960300693.
- Zadeh, L. A. 1992. “Fuzzy Logic and the Calculus of Fuzzy If-Then Rules.” In Proceedings of 22nd International Symposium on Multiple-Valued Logic. Los Alamitos, CA: IEEE Computer Society Press. 480–480.
- Zadeh, R. M. 2008. “Assessing Environment Impacts of Rapid Urban Growth in Tehran and Tabriz.” Geography and Development Journal 9 (3): 94–112.