
Abstract
In North Korea, reliable and timely information on crop acreage and spatial distribution is hard to obtain. In this study, we developed a fast and robust method to estimate crop acreage in North Korea using time-series normalized difference vegetation index (NDVI) derived from the Moderate Resolution Imaging Spectroradiometer (MODIS) data. We proposed a method to identify crop type based on NDVI phenology features using data collected in other areas with similar agri-environmental conditions to mitigate the shortage of ground truth data. Eventually the classification map (MODIScrop) was assessed using the Food and Agriculture Organization (FAO) statistical data and high-resolution crop classification maps derived from one Landsat scene (LScrop). The Pareto boundary method was used to assess the accuracy and crop distribution of the MODIScrop maps. Results showed that acreage derived from the MODIScrop maps was generally consistent with that reported in the FAO data (a relative error <4.1% for rice and <6.1% for maize, and <9.0% for soybean except for in 2004, 2008, and 2009) and the maps derived from the LScrop (a relative error about 5% in 2013, and 7% in 2008 and 2014). The classification accuracy reached 74.4%, 69.8%, and 73.1% of the areas covered by the Landsat images in 2008, 2013, and 2014, respectively. This indicates that features derived from NDVI profiles were able to characterize major crops, and the approaches developed in this study are feasible for crop mapping and acreage estimation in regions with limited ground truth data.
1. Introduction
Agriculture plays an important role in North Korea’s economy, accounting for 23.4% of its total gross domestic product (GDP) (CIA Citation2015). The country has been suffering from frequent natural disasters since the 1990s, and the shortage of grains is estimated to be around 3 million tons each year largely due to declining agricultural productivity (Ireson Citation2006; Ahn Citation2005). Thus the country relies heavily on food import, bilateral assistance and multilateral international food aid, primarily from China and the Russian Federation (FAO Citation2013). Fast and accurate annual crop-type mapping and production estimation in North Korea become increasingly needed for the grain aid organizations to determine the quantity of food shortage. In-season crop acreage estimation is an important starting point in planning the grain and food trade in the world market. It is even more important for developing countries relying heavily on international aid to relieve feminine. The deterioration of natural environment and decline of agricultural productivity in North Korea have been the topic of many recent researches (Kang and Choi Citation2013; Kim, Jeong, and Park Citation2007; Ireson Citation2006; Haggard and Noland Citation2005; Kim Citation2005; Smith and Huang Citation2000; Kim Citation1999). Remote sensing provides an important tool for crop classification, crop acreage estimation, crop growth condition monitoring, and yield forecast. In the past two decades, large area crop mapping has advanced greatly at the regional and global scales (Atzberger Citation2013). However, cropland layers in existing remote-sensing-based global or national scale land cover and land use datasets do not provide crop-specific information. Despite of the importance of crop-type information, only a limited number of studies dealt with land-cover mapping of the country using remote-sensing data (Lee, Joung, and Yoon Citation1999), and crop identification is hardly found in the literature. A few studies were carried out in small regions (Lee Citation1994), or all cultivated areas were treated as a single class at the national level (Tang et al. Citation2010).
Crop classification in North Korea faces many challenges. One of the difficulties is the ground inaccessibility, due to political reasons, to collect ground truth data needed for training the classifiers and assess classification results. Ground truth data can be obtained from various sources such as field survey, or interpretation of aerial photographs, airborne video, and satellite imageries. In many countries, aerial photographs have been used as a data source from which training and validation data are derived through interpretation. Yet, this type of data is still scarce in many developing countries (Sydenstricker-Neto, Parmenter, and DeGloria Citation2004). For example, historical aerial photographs are not publically available to civilian researchers in North Korea, and ground visit with GPS receivers is also prohibited (Cha and Park Citation2007). Consequently, many attempts for crop identification and validation in the country has to rely on various historical or statistic data (Lee Citation1994; Lee, Joung, and Yoon Citation1999; Lee, SongHak, and JangHo Citation1998). To circumvent this problem, Kim, Jeong, and Park (Citation2007) used ground truth data collected in areas from neighboring countries (China, Russia, and South Korea) close to the borders to North Korea as a surrogate. Although this was a big step forward, their study presented two limitations. First, no data from within North Korea were used for image classification and result validation. This severely affects the fair representation of targets in the country under study, although we assume crop growth conditions are similar between North Korea and the nearby areas in the neighboring countries. Second, only a general cropland class was considered in their study, without identification of different crop types. Cha and Park (Citation2007) investigated the possibility of using QuickBird high-resolution imagery from Google Earth to obtain reference data in their land-cover classification study in North Korea. This also provides information suitable only for land-cover classification, as different crop types cannot be distinguished through visual interpretation.
Another difficulty for national scale crop mapping is the selection of remote-sensing data. To date, images are available from more and more sensors, with different capability for crop identification. Images with higher spatial resolution tend to achieve better classification accuracies, as finer fragments of crop land can be captured. However, the use of high-resolution data is hindered by data costs and infrequent acquisitions, making operational delivery of regional-scale crop cover maps difficult. Thus, large scale crop mapping or acreage/yield estimation tends to rely on freely available, low-resolution images (e.g. NOAA-AVHRR, SPOT-VEGETATION, Terra/Aqua MODIS), or medium resolution images (Landsat TM) (Gómez, White, and Wulder Citation2016; Atzberger Citation2013; De Oliveira et al. Citation2014). The medium resolution Landsat images is also challenging for crop identification at the national scales (Liu et al. Citation2016; Zhong et al. Citation2011), as successful acquisition of cloud-free images over a crop growth cycle can be limited. For example, in North Korea, only 12 Landsat images can be used (under 10% cloud cover) in 2013, and only three regions were covered twice in the year (path/row = 115/32, 115/33, and 116/31). Besides, six of the images were acquired in late September and two in early October. These images were not a good choice for crop classifications as they were acquired near or after harvest. In order to achieve fast and accurate crop mapping and acreage estimation in consecutive years for determination on food shortage in North Korea, MODIS data, with an opportunity for large area land use characterization by providing global coverage, high temporal resolution (1–2 days) and low spatial resolution (250 m) (Zhang et al. Citation2015a; Pan et al. Citation2012; Yang et al. Citation2007), could be an invaluable data source for crop identification in the country. The MODIS data are free, feature daily acquisitions above 30° latitude (Wolfe et al. Citation1999), and undergo standard processing to surface reflectance that enables regional, continental, and global scale mapping (Vermote et al. Citation1997a) or agricultural monitoring (Chen et al. Citation2016; Zeng et al. Citation2016; Galvão et al. Citation2016; Brown et al. Citation2013; Arvor et al. Citation2011; Wardlow and Egbert Citation2008). Different crops have distinct phenological patterns, which can be derived from time-series vegetation indices (Grzegozewski, Johann, and Mercante Citation2016; De Souza et al. Citation2015; Yagci, Liping, and Deng Citation2015; Chen, Chen, and Son Citation2012) for crop classification or identification, as they were more intrinsic than the conventional features extracted from multispectral remote-sensing data, and is useful when training data is limited or not available (Liu et al. Citation2016; Pan et al. Citation2012).
For accuracy assessment of a thematic map, an error matrix is usually used (Story and Congalton Citation1986; Congalton, Oderwald, and Mead Citation1983) using ground truth samples. However, when evaluating global or national products, large amount of reference samples is required and difficult to obtain. In this case, the best interpretation of higher spatial resolution multispectral imagery (such as Landsat-TM or SPOT-HRV) can be used as reference data (Mohler and Goodin Citation2016; Sun, Jiaqi, and Xinchao Citation2016; Tsela et al. Citation2014; Dong et al. Citation2016; Foody Citation2002; Gallego et al. Citation2008; Janssen and Vanderwel Citation1994). However, bias can be introduced when using high-resolution reference thematic map to assess low-resolution products (Plourde and Congalton Citation2003; Foody Citation2002). The bias is associated with different representations of ground targets on images of different spatial resolutions, as ground targets are characterized with different shape, size and fragmentation (Eva and Lambin Citation1998; Mayaux and Lambin Citation1995; Smith et al. Citation2003). Boschetti, Brivio, and Flasse (Citation2004) proposed the Pareto boundary approach to analyze the influence of the low spatial resolution on the accuracy of the final thematic map products, highlighting the presence of a trade-off between omission error (OE) and commission error (CE) in the error matrix using a hard classification scheme. It is a method originated from economics theory that is applied to decisions with multiple conflicting objectives (Boschetti et al. Citation2014; Vintrou et al. Citation2012). The method is useful to evaluate the classification effect of low spatial resolution images (Pepe et al. Citation2010; Boschetti, Flasse, and Brivio Citation2004), and will be adopted in this study.
The objective of this study was to develop a robust approach for classification and acreage estimation of major crops in North Korea annually. To mitigate the difficulties presented above, ground truth data were collected from nearby areas in China, as well as from geo-tagged photos taken in North Korea and published on Google Earth. Samples for three major crop types (rice, maize, and soybean) were identified and collected. Signatures derived from MODIS 250-m time-series NDVI were used for identification of the three major crops, and validation was made using crop statistical data and high-resolution crop classification maps generated from Landsat images depending on Pareto boundary method. The developed approach for ground truth data collection in areas with limited accessibility was assessed, and the changes and trends of crop acreage in North Korea in recent 10 years were also performed based on the classification.
2. Materials and methods
2.1. Study area
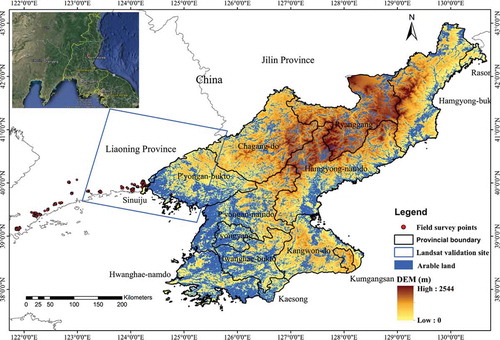
North Korea resides in northeastern Asia, neighboring to China, the Russia Federation and South Korea. The latitude is between 37° N and 43° N, and the longitude is between 124° E and 131° E (). It has a continental climate with a relatively short growing season. Winters are long and very cold, particularly in the northern mountainous regions. Summers are short, hot, humid and rainy. On average, approximately 60% of all precipitation occurs between June and September (FAO Citation2013). The number of frost-free days varies between 140 and 170 days. Due to the temperature limitation, single cropping system dominates the country. The total area of the country is 12.0 Mha, mainly hilly or mountainous. About 1.96 Mha (16.3%) of the area is arable, with 0.32 Mha of perennial crops such as mulberry and fruit (Wang and Liu Citation2011). Two-thirds of the arable land is in the four western provinces (North Pyongan, South Pyongan, North Hwanghae, and South Hwanghae) and one-fourth in the three eastern provinces (North Hamgyong, South Hamgyong, and Kangwon). The interior region (the provinces of Chagang and Ryanggang) is mountainous, dry, and cold, not suitable for farming but rich in forest resources (Kang and Choi Citation2013).
Figure 1. Arable land distribution in North Korea with DEM as background. Province boundaries, field survey points, and validation site are also illustrated. For full color versions of the figures in this paper, please see the online version.
Rice is the most important food crop in the country, followed by maize in terms of planting area. Soybean is the principal source of protein and has been added to the food balance sheet in the Crop and Food Security Assessment Mission (CFSAM) report since 2010 (FAO Citation2011). A few other minor crops are also grown in small quantities, including wheat, barley, potato, sugar beet, vegetables, fruits, mulberry, sorghum, millet, and buckwheat. Rice is usually sown at the beginning (between May and June) and harvested at the end of the rainy season (from September to October), with a growing season length between 150 and 180 days. Maize is usually sown between April and May and harvested in September. Soybean is not considered as a major field crop, and is normally planted in home gardens, on ridges and embankments around the paddy fields, or on any available open areas. Although fragmented, historical records showed that approximately 0.1 Mha of soybean is grown every year (FAO Citation2015a).
2.2. Remote-sensing data and processing
2.2.1. MODIS data
MODIS data is available from the NASA Land Process Distributed Active Archive Center (LP DAAC). In this study, MODIS Terra and Aqua 16-day 250-m vegetation indices product (MOD13Q1/MYD13Q1) was obtained for the growing season from 1 April to 30 November, for the years from 2004 to 2014. Four NDVI tiles (h27v04/h27v05/h28v04/h28v05) covering the whole country were mosaicked and then re-projected to the UTM projection (datum WGS 84). Afterwards, the 32 images (from 81st to 329th day of the year) from the MOD13Q1 and MYD13Q1 products were stacked sequentially to form one image cube for each year. Eventually, the time-series NDVI images were subset to cover the whole country, as well as the areas where field data were collected in Liaoning Province, China.
2.2.2. Landsat data
In this study, 30-m multispectral images acquired by the Landsat-5 Thematic Mapper (TM) and the Landsat-8 Operational Land Imager (OLI), were used to derive crop-type information for validating the classification and acreage estimation results from the MODIS time-series data (Ke et al. Citation2015). The Landsat scenes with path/row = 118/32 were selected as they cover both the ground truth points in China and in Pyonganbukto districts, western part of North Korea (). Images during the growing seasons were searched and acquired for 2008, 2013, and 2014 when ground truth surveys were carried out. One cloud free Landsat image for each of the 3 years was acquired, on 13 June 2008, 30 September 2013, and 1 September 2014, respectively. The images were radiometrically calibrated and then atmospherically corrected using the 6S model (Vermote et al. Citation1997b).
2.3. Other data
2.3.1. Land-cover map
Phenological patterns of annual crops are different from that of natural vegetation and other land-cover types. To reduce the CE of annual crop identification, the Land Cover-SHARE (http://www.glcn.org/databases/lc_glcshare_en.jsp) product was used to generate an initial cropland mask for subsequent use. The validation procedure showed that the overall class accuracy of cropland with about 88% (Latham et al. Citation2014) is quite satisfactory for our study. shows the distribution of arable land derived from the product, overlaid with provincial boundaries. The majority of the cultivated area is located in southwest regions.
2.3.2. Ground truth data
Due to ground inaccessibility in North Korea, field surveys were carried out in regions close to the national border in Liaoning Province, China, with about the same latitude and climate conditions as the neighboring areas in North Korea (). shows the growth calendars of the three major crops growing in North Korea and in Liaoning Province of China. Rice and maize in the two areas have largely synchronous phenological cycles. Soybeans in North Korea start to grow about 15 days later than that in China, with about the same growing length in time. We assume that the similar growth cycles of the three crops in the two regions would allow field data collected in Liaoning Province to be used in North Korea. Quantitative comparison between NDVI profiles from the two regions for the three crops will be presented later to validate this assumption. The field data were collected in three growing seasons in 2008, 2013, and 2014, with a total of 95 GPS waypoints each year, including 40 for maize, 30 for rice, and 25 for soybean. As an example, samples collected in Liaoning Province in 2013 are shown in .
Figure 2. Crop calendar in North Korea and Liaoning Province of China.
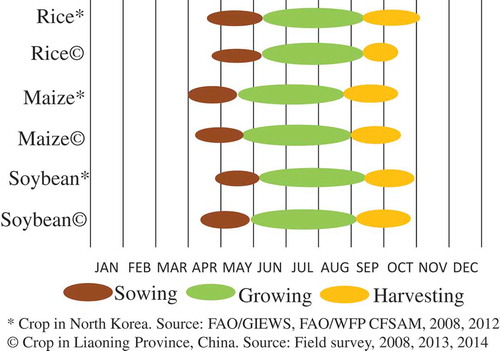
Figure 3. Field survey in 2013 and Google Earth crop points. NK and LN represents North Korea and Liaoning province, respectively. Landsat image as background was acquired on 30 September 2013, RGB: NIR/red/green.
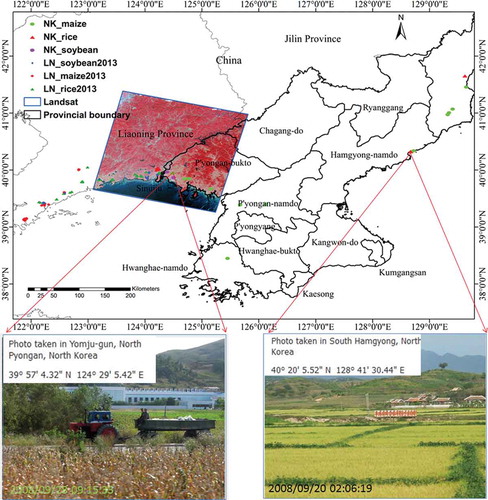
No sample was collected in North Korea through field observation or through visual interpretation of high-resolution images. For validating their paddy rice classification maps, Dong et al. (Citation2016) utilized field photos from the National Geospatial-Intelligence Agency (NGA), managed in a Google Maps-based scientific field photos management platform (www.eomf.ou.edu/photos/). Unfortunately no photo in that collection was found for our study area; however, we found 18 photos from the Google Earth Engine for our study area. The photos were uploaded with geographical coordinates, collecting time, and shooting direction useful for interpretation of crop types for the year the photos were taken (photographs in ). This leads to 13 maize fields, 3 rice fields, and 2 soybean fields (). These sample fields were used to derive crop phenological patterns from MODIS time-series NDVI, to be compared to that derived from Liaoning Province.
Table 1. Geographical coordinates and collecting date of the photos obtained from Google Earth Engine for North Korea.
2.3.3. FAO statistical data
The national total acreage of the three major crops (rice, maize, and soybean) were obtained from the statistical data published by the FAO, in FAO/WFP Crop and Food Security Assessment Mission to the Democratic People’s Republic of Korea (http://www.fao.org/publications/en/), and was used for assessing the national scale crop acreage estimation. The data for years from 2004 to 2014 are given in . Data for maize and soybean in 2005, 2006, and 2007 were only available unofficially, so they were not used for validation due to its unknown reliability (http://faostat3.fao.org/download/Q/QC/E).
Table 2. Planting acreage of the three major crops in North Korea, 2004–2014 (1000 ha).
2.3.4. Other auxiliary data
In addition to the aforementioned data, other auxiliary data were also obtained. Polygons for administration units were used for raster data extraction, and digital elevation model (DEM) downloaded from http://www.gscloud.cn/was used to assist in identifying crop distribution based on knowledge of cropping practices in North Korea ().
2.4. MODIS NDVI profiles and phenological parameter extraction
The intention of this study is to develop a method for mapping crops and estimating their acreages at the national scale in North Korea, where ground truth data is not readily available. Annual crops have distinct phenological development patterns, which offer opportunities for their discrimination from natural vegetation types (Sakamoto et al. Citation2005; Xin et al. Citation2002). We hypothesize that phenological features extracted from time-series remote-sensing data in a region can be used for crop discrimination in a different region and year as long as agri-environmental conditions and agricultural practices are similar, such as that in North Korea and the neighboring areas in Liaoning Province, China.
In this study, MODIS time-series NDVI was processed to extract phenological features for crop classification. First, time-series NDVI were extracted for all the sample sites, which include field survey samples obtained in Liaoning Province in 2008, 2013, and 2014, and samples interpreted from Google Earth photos in North Korea (). In total, the numbers of samples are 120, 90, and 75 in Liaoning, and 13, 3, and 2 in North Korea for maize, rice, and soybean, respectively. To reduce noise on NDVI profiles due to interferences by atmospheric conditions or snow cover, the harmonic analysis of time-series (HANTS) algorithm was applied (Roerink, Menenti, and Verhoef Citation2000; Verhoef Citation1996; Menenti et al. Citation1993). The algorithm was found to be effective (Wen, Zhongbo, and Yaoming Citation2004).
shows a typical NDVI profile from which six features can be defined to characterize the shape of the profile: Max peak value, Max growing rate, and Max fading rate and their corresponding dates (Zhang et al. Citation2015b; Tan et al. Citation2011) (). These features jointly characterize the representative crop-specific phenological patterns, enabling the discrimination between the crops. For rice, the flooding period at the early stages has been exploited for its identification from time-series remote-sensing data (Dong et al. Citation2016; Kim and Yeom Citation2015; Boschetti et al. Citation2014; Xiao et al. Citation2002; Le Toan et al. Citation1997). Although these features can also be used to improve classification, they may be year specific and needs training samples each year. And from the histogram analysis of the phenological features in Section 3.1, the difference between rice and soybean can be exploited, thus, the feature for flooding was not selected in our study.
Table 3. Six features included in MODIS phenology product.
Figure 4. Signatures characterizing an NDVI profile.
2.5. Classification of MODIS NDVI time-series images
Classification of MODIS NDVI time-series images consists of two steps. The first is a clustering step using the Iterative Self Organizing Data Analysis (ISODATA) algorithm (Ball and Hall Citation1965). ISODATA is a popular unsupervised classification algorithm to group samples into spectrally homogeneous clusters, requiring few parameters, such as the number of classes to be derived, the number of iterations, and the threshold value (Pradhan, Tehrany, and Jebur Citation2016). In our study, the algorithm was initialized with 160 classes, a threshold of 5% and maximum iteration of 30. The second step is identification of the classes according to their average NDVI profiles. Each average profile was compared with that of the ground truth samples for the four predefined classes (maize, rice, soybean, and other types) in order to assign the cluster to one of these classes to produce a final classification map. The comparison was made on the six signatures extracted in Section 2.4.
2.6. Classification of Landsat images
Landsat data is not suitable as the main data source to deliver annual crop classification in the study area, as data acquisition is severely limited by clouds. However, the 30-m resolution of Landsat data is suitable for capturing detailed information on the heterogeneous cropland. In this study, crop maps for 2008, 2013, and 2014 were derived from classification of the single Landsat image for each of the year. The three high-resolution maps were then used to assess and validate the spatial distribution and crop acreage of the three major crops derived from the MODIS classification (MODIScrop) maps. The field survey points in Liaoning Province and the Google Earth points in North Korea covered by the Landsat scenes are shown in .
Table 4. Ground survey and Google Earth points covered by Landsat scene.
To avoid the effect of uneven distribution and the relatively fewer number of samples, other visual interpreted samples, according to analysis of the spectral features of the ground survey samples, were also included from other regions of the image. In our study, a non-parametric supervised classification algorithm, the Support Vector Machine (SVM) (Platt Citation1999; Suykens and Vandewalle Citation1999), was used to classify the Landsat images. The SVM algorithm is based on structural risk minimization and exploits a margin-based criterion. It tries to find an optimal hyperplane that maximizes the margin between classes using a small number of training samples, the support vectors (Pal and Foody Citation2010). In addition, it can separate multimodal class distributions in high-dimensional feature space by using nonlinear kernel functions. The SVM is particularly attractive for classification since key parameters (penalty parameter C and kernel parameter γ) need only to be defined once rather than for each binary analysis and, as fewer support vectors may be required, it may be possible to reduce the number of training samples required (Hsu and Lin Citation2002). In our study, the SVM approach with a radial basis function (RBF) kernel, C = 1 and γ = 0.167 was used to classify the data.
In our study, to compare the results obtained by SVM, we also used Random Forest (RF) classifier as validation test. RF, proposed by Breiman (Citation2001), is a type of ensemble learning algorithm that does not require information on data distribution and is not sensitive to noise and overtraining. The classifier requires the definition of only two parameters to generate a prediction model: the number of classification trees desired (k) and the number of prediction variables (m) used in each node to grow the tree. In our study, RF model was constructed with k and m separately equaling to 500 and the square root of the number of the input variables. For classification of the Landsat images, the non-arable land areas were masked out first using the land-cover map. Half of the ground truth samples were randomly selected for training and the remaining samples were used for validation. Confusion matrix was created using validation samples to assess crop identification accuracy based on the two classifiers. The overall accuracies (OAs) are all higher than 95% in all 3 years between the two classifiers, with the maximum difference was just 1.7% in 2008. The classification map resulted from TM/OLI images using SVM classifier is named as LScrop hereafter.
2.7. Accuracy assessment
The accuracy of acreage and the spatial distribution of the major crops derived from the MODIScrop maps were evaluated using the FAO’s statistical data and the LScrop. Crop acreage was derived from the MODIScrop maps at both the national and regional scales. The national-scale acreage was assessed by comparing with the FAO’s statistical data (), and the regional-scale acreage was assessed by comparing with the acreage derived from the LScrop maps for the 3 years (2008, 2013, and 2014). It was clarified that the comparison was intended to use LScrop as reference for evaluating crop distribution derived from the MODIScrop maps. We used the Pareto boundary approach to assess MODIScrop maps. The Pareto boundary helps understanding the cause of the poor accuracy of a low spatial-resolution map, due to either a poor performance of classification or a low resolution of the images. The Pareto boundaries are dependent on the levels of image fragmentation. In general, the higher the fragmentation, the lower the accuracy that can be achieved and the higher the proportion of the OE and CE bi-dimensional space that is not reachable (Boschetti, Flasse, and Brivio Citation2004). To create the boundary, the methods introduced by Boschetti, Brivio, and Flasse (Citation2004) were used. The procedure to generate the Pareto boundary for each crop type is as following: (1) the reference map of a land-cover type should be obtained (e.g. usually it can be substituted by the classified results using a high-resolution image, and the results were regarded as reference data approximately in this study), and the coarse resolution map to be assessed desired spatial resolution grid (e.g. MODIScrop 250-m resolution was used in this study) was overlaid on the reference map; (2) the purity image (could be considered as a soft classification of the low spatial resolution) of the coarse resolution map was derived based on the correspondent high-resolution reference map; (3) the hard classification results were calculated for a discrete set of threshold values covering the range [0, 1], and then calculated the OE and CE in each case; (4) the OE and CE pairs for all threshold values were derived and plotted in the OE/CE space, and the line linking the corresponding points is the Pareto boundary in discrete form (Boschetti, Brivio, and Flasse Citation2004; Boschetti, Flasse, and Brivio Citation2004; Boschetti et al. Citation2014; Vintrou et al. Citation2012). The Pareto boundary represents the best classification for the hard classifiers, and the OE and CE are the widely used the producer’s accuracy (PA) and the user’s accuracy (UA), respectively, so they can reveal the positional accuracy of the classified results in a region (Sun, Jiaqi, and Xinchao Citation2016; Boschetti, Flasse, and Brivio Citation2004). Based on this, the error matrix for each of the 3 years was calculated.
3. Results
3.1. NDVI profile derived from ground survey samples
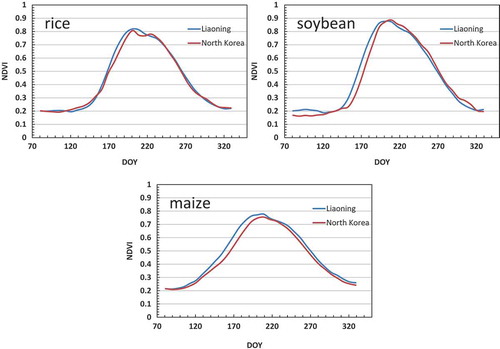
The smoothed NDVI profiles for all crop survey samples in Liaoning Province are shown in . As a comparison, the average NDVI profiles for each type of crop in Liaoning Province and in North Korea are shown in . It is observed that the date for crop to start growing is earlier for maize than for rice and soybean, and peak NDVI of soybean (near 0.9) is higher than rice (almost 0.8), and maize (below 0.8). Besides, the dates to reach peak NDVI are also different among the three crops. It is observed that NDVI profiles from the two regions are similar for each of the crops, which allows for crop identification in North Korea using the phenological signatures extracted from the crop fields in Liaoning Province.
Figure 5. Smoothed NDVI profiles for ground samples in Liaoning Province. The numbers of samples are 120, 90, and 75 for maize, rice, and soybean, respectively.
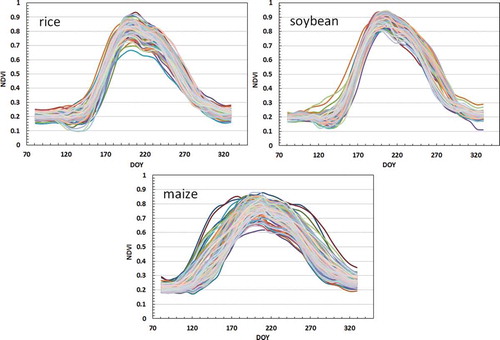
Figure 6. Averaged NDVI profiles for each type of crops in North Korea and Liaoning Province.
Histograms of the selected phenological features (as shown in and ) were derived for the three types of crops from all ground survey samples in the 3 years (–). Maize has a distinguishably slower max growing and fading rates and an earlier date to achieve the max growing rate than the other two crops. These differences could be exploited for the differentiation of maize from soybean and rice using a threshold. Although soybean had approximately the same max growing and fading rates as rice, it has a higher peak value than the other two crops (). Generally, the date for rice to achieve peak NDVI value is later than the other two crops (). The date of max fading rate did not show significant difference among the three crops, but it probably could contribute to differentiating rice from the other two crops, as it was relatively later ().
Figure 7. (a–f) Histograms of the selected phenology features.
According to above analysis on the histograms, the final average reference value and the tolerance threshold for each feature were derived for each crop and were given in . For classification of the MODIS images, the average NDVI profile of a cluster derived from the ISODATA procedure was compared with the profiles of the three major crop types. If the differences between the six signatures for a MODIS cluster and that of a major crop type are all smaller than the given tolerance values in , the cluster is considered similar to the crop type and is classified as this crop. If the cluster is not similar to any of the three crops, it is classified as the “other types.” All of these steps were accomplished by programing using Interactive Data Language (IDL). Eventually a three-class map of maize, rice, and soybean was generated for each year, and the maps are referred to as MODIScrop hereafter.
Table 5. Averages of the phenological features and their tolerance difference for each crop.
3.2. Results of crop classification using MODIS data
Annual crop distribution for the 11 years given by the MODIScrop maps is shown in . Paddy rice is grown mainly in the central, southwestern, and southeastern parts of the country and on the narrow eastern coastal strip comprising parts of Kangwon, and North and South Hamgyong Provinces. Rice is also found in small areas in Chagang and Ryanggang provinces. Maize is more uniformly distributed than paddy rice and can be found in both hilly and plain areas across the country. The area for soybean is relatively small compared with the other two crops, and is mainly distributed in southeastern regions (South Pyongan, Pyongyang, and North Hwanghae) and on the narrow eastern coastal strip of the country.
Figure 8. Spatial distribution of crops in North Korea from 2004 to 2014; red circles mark areas with great increase of soybean since 2011.
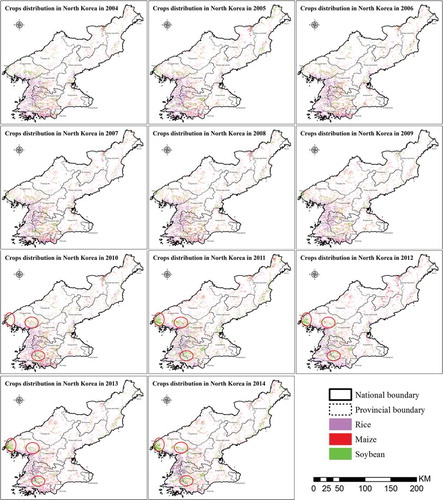
The rice is grown mainly in the central, southwestern, and southeastern parts of the country (includes the lowland parts of North and South Pyongan, North and South Hwanghae, Pyongyang, Nampo, and Kaesong) and on the narrow eastern coastal strip comprising parts of Kangwon, and North and South Hamgyong Provinces. The spatial distribution of rice did not change much from 2004 to 2014, except for a sudden change in 2011 in a few regions such as the west of Hwanghae-bukto and east of Hangyong-namdo. The sudden change in these regions may be due to government decision or unfavorable weather conditions in 2011, in which there were intense rainstorms from end-June to July, causing floods and waterlog for a long time leading to plant death in many paddy rice fields (FAO Citation2011). Maize is more universally distributed than rice and is located in almost all regions, including both hilly and plain areas. The distribution of maize varied from year to year particularly in mountainous areas, such as in northern Ryanggang, northern Hamgyong, and other hilly regions. Those changes might be due to farmers’ decision and variable climatic conditions (FAO Citation2011, Citation2012). Soybean is mainly distributed in southeastern regions and on the narrow eastern coastal strip of the country. Starting from 2011, the distribution of soybean increased significantly in southern and eastern Pyongan and central Hwanghae (, red circles marked the changes since 2011 compared with 2010), consistent with FAO’s national statistical data.
Regardless of the varying climatic conditions, the acreage of maize generally remained stable at about 520,000 ha, except for an observable increase to 550,930 ha in 2012 (). A small amount of this increase could be attributed to growing maize in some of the paddy fields that were difficult to irrigate in 2012, as North Korea experienced the worst drought in the year, with the western coast rice growing regions impacted the most (FAO Citation2012). The increase of acreage for maize was mostly due to switching from soybean to maize in pursuit of higher gross yields by farmers. North Korea is the only country in the world that transplant maize on a wide scale in order to accommodate double-cropping and to give the crop a good early start under the condition of a relatively short growing season.
Figure 9. Crop acreage derived from MODIScrop maps.
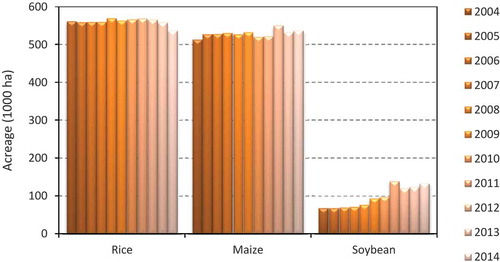
The acreage of rice remained an average of about 570,000 ha, with very little change during the years (). The acreage was estimated to be 537,061 ha in 2014, a 4% decrease compared to 2013. Much of this reduction was attributed to a limited availability of irrigation water during the sowing time, hence, many paddy fields were seeded with alternative crops (FAO Citation2015b).
The acreage of soybean increased continuously from 68,000 ha in 2004 to 139,000 ha in 2011 (), more than doubled. We tried to understand the changes by resorting to visual verifications through Google Earth, Landsat images, climate, and disaster events. There are two possible reasons for this large increase in soybean acreage. First, there has been continuous pressure on increasing the acreage of legume break crop in conservation agriculture, as soybean plays an important role in crop rotation to help improving nitrogen levels in the soil (FAO Citation2015a). Government policy for a more nutritious diet may also have played a role in the increase (FAO Citation2015a). Second, soybean is commonly used as a replacement crop when there is a risk (unfavorable weather conditions) to seed other crops (such as potatoes, spring wheat, and barley) as originally planned in double cropping (FAO Citation2011). In 2012, the acreage of soybean decreased significantly (by 13%) from 139,000 ha in previous year to 120,000 ha. This reduction could be attributed to the unusual dry condition at the seeding time in May in 2012 (FAO Citation2013). In 2014, the acreage of soybeans recovered to 133,000 ha.
3.3. Assessment of the estimated crop acreage
Comparisons of crop acreage estimated from MODIScrop and that derived from (1) the FAO statistical data at the national scale, and (2) LScrop (2008, 2013, and 2014) at the regional scale were conducted. The results are reported in and , and scatter-plots are shown in .
Table 6. National scale crop acreage estimated from MODIScrop and reported in FAO statistic data, and their relative difference.
Figure 10. (a–c) Comparison of crop acreage derived from MODIS classification and the FAO statistical data at the national scale.
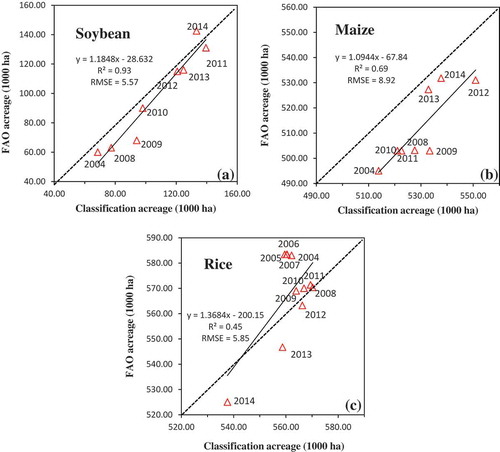
At the national scale, acreage derived from the MODIScrop and the FAO statistical data are approximately the same ( and (a–c)). Although the relative difference of soybean acreage was larger than 10% in 2004, 2008, and 2009, it was low (<9%) for the other years. This was associated with a relatively smaller total acreage in those 3 years (<68,000 ha) than the other years (>90,000 ha). For maize compared with FAO data, there was a consistent overestimation from MODIScrop (about 20,000 ha and 4%). Overall, the absolute relative difference for rice was low (<4.1%), with an observable underestimation by the MODIScrop from 2004 to 2007 (~4%) and overestimation in 2013 and 2014 (~2%). The above results show that national scale crop acreage can be estimated from the MODIScrop with satisfaction.
At the regional scale for the acreage covered by the Landsat scene, the relative difference between acreages derived from the MODIScrop and LScrop was about 5% for the three crops in 2013, with an overestimation by MODIScrop. The relative difference was about 3.4%, 6.8%, and 9.5% in 2008, and 6.0%, 7.4%, and 6.0% in 2014 for rice, maize, and soybean, respectively (). Acreage for rice and maize was underestimated by the MODIScrop in 2008 and overestimated in 2014, and reverse for soybean.
Table 7. Regional scale crop acreage estimated from MODIScrop and LScrop, and their relative difference.
3.4 Analysis on crop spatial distribution
For the three validation years, error matrices were generated for the MODIScrop, using high-resolution LScrop as reference map. Results are given in . It can been seen that the OAs among the 3 years are rather comparable. For 2008 and 2014, the absolute difference of OA between the 2 years is only 1.1%. The largest difference occurs between 2008 (74.4%) and 2013 (69.8%), but the absolute difference of OA is only 4.6%. These results suggest that the methodology used in the classification has consistent performance. For crop-specific accuracies, rice had the smallest CE and OE compared with the other two crops. Two factors might have contributed to the good performance: (1) rice has a distinct seasonal development profile that is less confused with other crops; (2) rice is the leading crop in the country and grows on flat lowland and is more spatially concentrated, hence is least affected by topographic effects and mixed pixels (). Maize, on the other hand, has the highest CE and OE, ranging from 39.8% to 51.2% (). Unlike rice, maize has a much broader spatial distribution across the country and can be found in both hilly and plain areas. The fragmented distribution and topography pose challenges in capturing representative spectral signals and spatial patterns for classification, which can lead to increased CE and OE.
Table 8. Overall accuracy (OA) and omission error/commission error (OE/CE) of MODIScrop in 2008, 2013, and 2014.
The quality of the MODIScrop maps was further assessed using the Pareto boundary method as shown in . The point in each graph in the figure represents CE and OE of the MODIScrop map with reference to the LScrop map, the solid line is the Pareto boundary representing the best results obtainable from classification of a low-resolution image, and the dashed lines are isolines of linear cost functions (Boschetti, Flasse, and Brivio Citation2004). Of the three crops, OE and CE of rice was the closest to the Pareto boundaries in the three years (~20% and ~15% in 2008; ~22% and ~16% in 2013, and ~27% and ~21% in 2014). OE and CE of maize were the largest among the three crops, and the point in the Pareto space had the largest distance to the Pareto boundary, indicating that identification of maize pixels was the most affected by low spatial resolution of the MODIS data. This was because the areas seeded with maize were spatially fragmented with respect to MODIS pixel size. However, the comparable OE and CE for maize () indicates that acreage estimation for maize would still be acceptable even at the regional scale represented by the analyzed Landsat area. The performance for identification of soybean and its acreage estimation was in between maize and rice.
Figure 11. The performance of each crop in the OE/CE space with the Pareto boundaries provided at each reference year.
4. Discussion and conclusions
In this study, we performed major crop identification and acreage estimation in North Korea for the period from 2004 to 2014 using 250-m time-series MODIS NDVI. Due to difficulties in field access for collecting training and validation samples, an approach was developed to collect ground dataset in nearby areas in China and use it for major crop classification in North Korea. Results obtained from classification of MODIS images were assessed using national crop acreage derived from FAO statistical data, and high accurate maps obtained from classification of Landsat images using the Pareto boundary method. The developed approaches to crop classification using coarse resolution satellite data and phenological features, and accuracy assessment using the Pareto boundary method, could be applied and tested in other regions.
Several important conclusions can be drawn from this study. First, our results show that the three major crops, soybean, maize, and rice, have distinctive phenological growth patterns as revealed by the MODIS NDVI profiles. NDVI profiles for the three crops in North Korea were found to be similar to those in nearby areas in Liaoning Province, China. This provides a possibility to collect field data from an area of easy ground access, and apply the data for crop classification in areas with similar agri-environmental conditions but difficult ground access, such as in North Korea. Furthermore, since phenological growth patterns are intrinsic to specific crops and determined by climate conditions, features derived from the phenological patterns could be applied across different years. In our study, we collected field samples in 2008, 2013 and 2014, extracted features to characterize the 250-m MODIS time-series NDVI of the three major crops in North Korea, and used the features for crop classification in the years from 2004 to 2014. It is noted that the ground truth samples in our study were collected mostly in northern Liaoning Province of China, with a latitude roughly corresponding to the middle to southern part of North Korea. Although the arable land in the country extends in a relatively wider latitude range, crop phenological features derived from the ground truth samples may be distributed close to the middle part of their dynamic ranges, and the phenology-based classification criteria should be applicable to the majority crop areas. Future studies could be improved by collecting ground truth samples from other accessible regions to increase sampling representativeness, such as in the northern part of South Korea and the southern boundaries with Russia.
Studies show that using remote-sensing imagery of a given spatial resolution, classification accuracy is dependent on the mean patch size (MPS) of crop fields (Zhang, Qiangzi, and Zhang Citation2014; Smith et al. Citation2003). Vintrou et al. (Citation2012) found that the accuracy of crop classification using MODIS data will be low with a smaller MPS, because of the prevalence of mixed pixels. This is the case in northeast of North Korea where the fields are more fragmented with smaller MPS than in the southern major cropping areas. Subpixel-based classification methods should be developed in future if coarse resolution imagery is used.
Second, we found that crop acreage derived from the 250-m classification maps was in conformity with the statistical data reported by the FAO at the national scale, with a relative difference smaller than 4.1% for rice and lower than 6.0% for maize. A larger relative difference (>10%) was obtained for soybean in a few years when the total area of the crop was small. Using high accuracy crop classification maps (OA about 95%) resulted from classification of Landsat images as reference for the three field survey years, the acreage derived from the 250-m MODIS classification maps at the regional scale was also satisfactory, with an OA of about 74.4% in 2008, 69.8% in 2013, and 74.0% in 2014. Assessed using the Pareto boundary approach (Boschetti, Flasse, and Brivio Citation2004), pixel level crop identification was the least affected for rice and the most affected for maize by the coarse pixel resolution of MODIS data; however, crop acreage estimation was less affected due to a comparable commission and OEs.
Third, we found that the changes of the crop acreage from 2004 to 2014 were associated with the changes in climatic conditions. The acreage of rice changed little (average 570,000 ha) during these years except for 2014 and the acreage of maize remained stable (520,000 ha) except for a 5.9% increase in 2012 (550,930 ha). However, the study has revealed a significant increase in soybean area since 2011 (from 68,000 ha in 2004 to 139,000 ha in 2011). The European Commission’s Joint Research Center (JRC) indicates the climatic conditions in these years. The start of the 2014 growing season in April was characterized by dry weather throughout the country, which delayed the planting operations of the main annual crops, (FAO Citation2015b) such as the rice and the acreage is reduced in 2014. In 2012, unusual dry condition happened in May and June, which resulted in re-planting of maize in most regions. Serious flooding was recorded in July mainly in the intensive agriculture provinces of North and South Pyongan (FAO Citation2012). This resulted in loss of cropped area, such as soybean. So, the area of maize was increased but the area of soybean is reduced in 2012. In 2011, intensive rainstorms from end June to July led to severe floods and waterlog so that much of the paddy fields was inundated for a long time enough to kill the plants (FAO Citation2011). Both the crop acreage and climatic conditions would be useful to forecast the crop production and food price changes, two key factors to determine food imports and exports.
Acknowledgements
This study was supported by the National Natural Science Foundation of China (Grant No. 41571422) and the E-government Program of Gao Fen (Grant No. 00-Y30B15-9001-14/16-2)
Disclosure statement
No potential conflict of interest was reported by the authors.
Additional information
Funding
References
- Ahn, C. 2005. “Policy Brief No. 11: Famine and the Future of Food Security in North Korea.” Oakland CA: Food First/Institute for Food and Development Policy.
- Arvor, D., M. Jonathan, M. S. P. Meirelles, V. Dubreuil, and L. Durieux. 2011. “Classification of MODIS EVI Time Series for Crop Mapping in the State of Mato Grosso, Brazil.” International Journal of Remote Sensing 32 (22): 7847–7871. doi:10.1080/01431161.2010.531783.
- Atzberger, C. 2013. “Advances in Remote Sensing of Agriculture: Context Description, Existing Operational Monitoring Systems and Major Information Needs.” Remote Sensing 5 (2): 949–981. doi:10.3390/rs5020949.
- Ball, G. H., and D. J. Hall. 1965. “ISODATA, a Novel Method of Data Analysis and Pattern Classification.”. In DTIC Document. Stanford, CA: Stanford Research Institute.
- Boschetti, L., P. A. Brivio, and S. Flasse, and ieee. 2004. Pareto Boundary: A Useful Tool in the Accuracy Assessment of Low Spatial Resolution Thematic Products, Igarss 2004: Ieee International Geoscience and Remote Sensing Symposium Proceedings, Vols 1-7: Science for Society: Exploring and Managing a Changing Planet.
- Boschetti, L., S. P. Flasse, and P. A. Brivio. 2004. “Analysis of the Conflict between Omission and Commission in Low Spatial Resolution Dichotomic Thematic Products: The Pareto Boundary.” Remote Sensing of Environment 91 (3): 280–292. doi:10.1016/j.rse.2004.02.015.
- Boschetti, M., F. Nutini, G. Manfron, P. A. Brivio, and A. Nelson. 2014. “Comparative Analysis of Normalised Difference Spectral Indices Derived from MODIS for Detecting Surface Water in Flooded Rice Cropping Systems.” PLoS One 9 (2): e88741. doi:10.1371/journal.pone.0088741.
- Breiman, L. 2001. “Random Forests.” Machine Learning 45 (1): 5–32. doi:10.1023/A:1010933404324.
- Brown, J. C., J. H. Kastens, A. C. Coutinho, D. D. C. Victoria, and C. R. Bishop. 2013. “Classifying Multiyear Agricultural Land Use Data from Mato Grosso Using Time-Series MODIS Vegetation Index Data.” Remote Sensing of Environment 130: 39–50. doi:10.1016/j.rse.2012.11.009.
- Cha, S.-Y., and C.-H. Park. 2007. “The Utilization of Google Earth Images as Reference Data for the Multitemporal Land Cover Classification with MODIS Data of North Korea.” Korean Journal of Remote Sensing 23 (5): 483–491.
- Chen, C. F., C. R. Chen, and N. T. Son. 2012. “Investigating Rice Cropping Practices and Growing Areas from MODIS Data Using Empirical Mode Decomposition and Support Vector Machines.” Giscience & Remote Sensing 49 (1): 117–138. doi:10.2747/1548-1603.49.1.117.
- Chen, Y., X. Song, S. Wang, J. Huang, and L. R. Mansaray. 2016. “Impacts of Spatial Heterogeneity on Crop Area Mapping in Canada Using MODIS Data.” ISPRS Journal of Photogrammetry and Remote Sensing 119: 451–461. doi:10.1016/j.isprsjprs.07.007.
- CIA, U. S. 2015. The World Factbook. Retrieved August 20. Central Intelligence Agency. The website is: http://www.cia.gov/cia/publications/factbook/geos/in.html.
- Congalton, R. G., R. G. Oderwald, and R. A. Mead. 1983. “Assessing Landsat Classification Accuracy Using Discrete Multivariate-Analysis Statistical Techniques.” Photogrammetric Engineering and Remote Sensing 49 (12): 1671–1678.
- De Oliveira, J. C., K. Trabaquini, J. C. N. Epiphanio, A. R. Formaggio, L. S. Galvao, and M. Adami. 2014. “Analysis of Agricultural Intensification in a Basin with Remote Sensing Data.” Giscience & Remote Sensing 51 (3): 253–268. doi:10.1080/15481603.2014.909108.
- De Souza, C., H. Wachholz, E. Mercante, J. A. Johann, and R. A. C. Lamparelli, Rand Miguel Angel Uribe-Opazo. 2015. Mapping and Discrimination of Soya Bean and Corn Crops Using Spectro-Temporal Profiles of Vegetation Indices. International Journal of Remote Sensing 36 (7): 1809–1824.10.1080/01431161.2015.1026956.
- Dong, J., X. Xiao, M. A. Menarguez, G. Zhang, Y. Qin, D. Thau, C. Biradar, and B. Moore. 2016. “Mapping Paddy Rice Planting Area in Northeastern Asia with Landsat 8 Images, Phenology-Based Algorithm and Google Earth Engine..” Remote Sensing of Environment.. doi:10.1016/j.rse.2016.02.016.
- Eva, H., and E. F. Lambin. 1998. “Remote Sensing of Biomass Burning in Tropical Regions: Sampling Issues and Multisensor Approach.” Remote Sensing of Environment 64 (3): 292–315. doi:10.1016/s0034-4257(98)00006-6.
- FAO. 2011. FAO/WFP Crop and Food Security Assessment Mission to the Democratic People’s Republic of Korea. Rome: Food and Agriculture Organizations of the United Nations.
- FAO. 2012. FAO/WFP Crop and Food Security Assessment Mission to the Democratic Peopleís Republic of Korea. Rome: Food and Agriculture Organizations of the United Nations.
- FAO. 2013. FAO/WFP Crop and Food Security Assessment Mission to the Democratic Peopleís Republic of Korea. Rome: Food and Agriculture Organizations of the United Nations.
- FAO. 2015a. “GIEWS Country Brief: The Democratic People’s Republic of Korea.”. Rome: Food and Agriculture Organizations of the United Nations.
- FAO. 2015b. “Outlook for Food Supply and Demand in 2014/15 to the Democratic People’s Republic of Korea.” Rome, Italy: Food and Agriculture Organizations of the United Nations.
- Foody, G. M. 2002. “Status of Land Cover Classification Accuracy Assessment.” Remote Sensing of Environment 80 (1): 185–201. doi:10.1016/s0034-4257(01)00295-4.
- Gallego, J., M. Craig, J. Michaelsen, B. Bossyns, and S. Fritz. 2008. (Eds.) “Best Practices for Crop Area Estimation with Remote Sensing.” In GEOSS Community of Practice: Ispra, Italy.
- Galvão, L. S., F. M. Breunig, T. S. Teles, W. Gaida, and R. Balbinot. 2016. “Investigation of Terrain Illumination Effects on Vegetation Indices and VI-Derived Phenological Metrics in Subtropical Deciduous Forests.” Giscience & Remote Sensing 53 (3): 360–381. doi:10.1080/15481603.2015.1134140.
- Gómez, C., J. C. White, and M. A. Wulder. 2016. “Optical Remotely Sensed Time Series Data for Land Cover Classification: A Review.” ISPRS Journal of Photogrammetry and Remote Sensing 116: 55–72. doi:10.1016/j.isprsjprs.2016.03.008.
- Grzegozewski, D. M., J. A. Johann, and E. Mercante, Alexandre Camargo Coutinho. 2016. Mapping Soya Bean and Corn Crops in the State of Paraná, Brazil, Using EVI Images from the MODIS Sensor. International Journal of Remote Sensing37(6): 1257–1275. 10.1080/01431161.2016.1148285.
- Haggard, S., and M. Noland. 2005. “Famine, Marketization, and Economic Reform in North Korea”. University of California, San Diegoo: The Graduate School of International Relations and Pacific Studies.
- Hsu, C. W., and C. J. Lin. 2002. “A Comparison of Methods for Multiclass Support Vector Machines.” Ieee Transactions on Neural Networks 13 (2): 415–425. doi:10.1109/72.991427.
- Ireson, R. 2006. “Food Security in North Korea: Designing Realistic Possibilities.” In the Walter H. shorenstein asia-pacific research center.
- Janssen, L. L. F., and F. J. M. Vanderwel. 1994. “Accuracy Assessment of Satellite Derived Land-Cover Data: A Review.” Photogrammetric Engineering and Remote Sensing;(United States) 60 (4): 419–426.
- Kang, S., and W. Choi. 2013. “Forest Cover Changes in North Korea since the 1980s.” Regional Environmental Change 14 (1): 347–354. doi:10.1007/s10113-013-0497-4.
- Ke, Y., I. Jungho, J. Lee, H. Gong, and Y. Ryu. 2015. “Characteristics of Landsat 8 Oli-Derived NDVI by Comparison with Multiple Satellite Sensors and In-Situ Observations.” Remote Sensing of Environment 164: 298–313. doi:10.1016/j.rse.2015.04.004.
- Kim, D.-H., S.-G. Jeong, and C.-H. Park. 2007. “Comparison of Three Land Cover Classification Algorithms-ISODATA, SMA, and SOM-for the Monitoring of North Korea with MODIS Multi-Temporal Data.” Korean Journal of Remote Sensing 23 (3): 181–188.
- Kim, H.-O., and J.-M. Yeom. 2015. “Sensitivity of Vegetation Indices to Spatial Degradation of Rapideye Imagery for Paddy Rice Detection: A Case Study of South Korea.” Giscience & Remote Sensing 52 (1): 1–17. doi:10.1080/15481603.2014.1001666.
- Kim, U.-G. 1999. The Agricultural Situation of North Korea: Food & Fertilizer Technology Cente.Taipei: Food and Fertilizer Technology Center, Korea Rural Economic Institute. The website is: http://www.fftc.agnet.org/library/article/eb475.html. URL accessed March 8, 2005.
- Kim, Y. H. 2005. “A Study on Ecological Restoration Measures for the Degraded Land in North Korea: Focusing on South Korea’s Restoration Policy.” Northern Korean Studies Reviews 9: 21–48.
- Latham, J., R. Cumani, I. Rosati, and M. Bloise. 2014. Global Land Cover Share (GLC-SHARE) Database Beta-Release Version 1.0-2014. Rome: FAO (Food and Agriculture Organizations).
- Le Toan, T., F. Ribbes, L.-F. Wang, N. Floury, K.-H. Ding, J. A. Kong, M. Fujita, and T. Kurosu. 1997. “Rice Crop Mapping and Monitoring Using ERS-1 Data Based on Experiment and Modeling Results.” Ieee Transactions on Geoscience and Remote Sensing 35 (1): 41–56. doi:10.1109/36.551933.
- Lee, K.-S. 1994. “Vegetation Cover Type Mapping over the Korean Peninsula Using Multitemporal AVHRR Data.” Journal of Korean Forestry Society (Korea Republic). 83(4):441–449.
- Lee, K.-S., M. Joung, and J. Yoon. 1999. “Content and Characteristics of Forest Cover Changes in North Korea.” Journal Korean Forest Social 88: 352–363.
- Lee, S., C. SongHak, and S. JangHo. 1998. “Forest Resources Inventory of North Korea Using Satellite Remote Sensing Data.” FRI Journal of Forest Science (Seoul) 58 (58): 1–13.
- Liu, J., T. Huffman, J. Shang, B. Qian, T. Dong, and Y. Zhang. 2016. “Identifying Major Crop Types in Eastern Canada Using a Fuzzy Decision Tree Classifier and Phenological Indicators Derived from Time Series MODIS Data.” Canadian Journal of Remote Sensing 42 (3): 259–273. doi:10.1080/07038992.2016.1171133.
- Mayaux, P., and E. F. Lambin. 1995. “Estimation of Tropical Forest Area from Coarse Spatial Resolution Data: A Two-Step Correction Function for Proportional Errors Due to Spatial Aggregation.” Remote Sensing of Environment 53 (1): 1–15. doi:10.1016/0034-4257(95)00038-3.
- Menenti, M., S. Azzali, W. Verhoef, and R. Van Swol. 1993. “Mapping Agroecological Zones and Time Lag in Vegetation Growth by Means of Fourier Analysis of Time Series of NDVI Images.” Advances in Space Research 13 (5): 233–237. doi:10.1016/0273-1177(93)90550-U.
- Mohler, R., and D. Goodin. 2016. “An Assessment of the Accuracy of the MCA45A1 Burned Area Product in Tallgrass Prairie.” Papers in Applied Geography:1-8. doi:10.1080/23754931.2015.1115368.
- Pal, M., and G. M. Foody. 2010. “Feature Selection for Classification of Hyperspectral Data by SVM.” Geoscience and Remote Sensing, IEEE Transactions On 48 (5): 2297–2307. doi:10.1109/TGRS.2009.2039484.
- Pan, Y., J. Le Li, S. L. Zhang, X. Zhu, and S.-M. Damien. 2012. “Winter Wheat Area Estimation from MODIS-EVI Time Series Data Using the Crop Proportion Phenology Index.” Remote Sensing of Environment 119: 232–242. doi:10.1016/j.rse.2011.10.011.
- Pepe, M., L. Boschetti, P. A. Brivio, and A. Rampini. 2010. “Comparing the Performance of Fuzzy and Crisp Classifiers on Remotely Sensed Images: A Case of Snow Classification.” International Journal of Remote Sensing 31 (23): 6189–6203. doi:10.1080/01431160903401395.
- Platt, J. 1999. “Fast Training of Support Vector Machines Using Sequential Minimal Optimization.” Advances in Kernel Methods—Support Vector Learning 3: 185–208.
- Plourde, L., and R. G. Congalton. 2003. “Sampling Method and Sample Placement.” Photogrammetric Engineering & Remote Sensing 69 (3): 289–297. doi:10.14358/PERS.69.3.289.
- Pradhan, B., M. S. Tehrany, and M. N. Jebur. 2016. “A New Semiautomated Detection Mapping of Flood Extent from Terrasar-X Satellite Image Using Rule-Based Classification and Taguchi Optimization Techniques.” Ieee Transactions on Geoscience and Remote Sensing 54 (7): 4331–4342. doi:10.1109/tgrs.2016.2539957.
- Roerink, G. J., M. Menenti, and W. Verhoef. 2000. “Reconstructing Cloudfree NDVI Composites Using Fourier Analysis of Time Series.” International Journal of Remote Sensing 21 (9): 1911–1917. doi:10.1080/014311600209814.
- Sakamoto, T., M. Yokozawa, H. Toritani, M. Shibayama, N. Ishitsuka, and H. Ohno. 2005. “A Crop Phenology Detection Method Using Time-Series MODIS Data.” Remote Sensing of Environment 96 (3–4): 366–374. doi:10.1016/j.rse.2005.03.008.
- Smith, H., and Y. Huang. 2000. Achieving Food Security in North Korea. Paper presented at the Conference on Korean Peninsula: Enhancing Stability and International Dialogue.
- Smith, J. H., S. V. Stehman, J. D. Wickham, and L. M. Yang. 2003. “Effects of Landscape Characteristics on Land-Cover Class Accuracy.” Remote Sensing of Environment 84 (3): 342–349. doi:10.1016/s0034-4257(02)00126-8.
- Story, M., and R. G. Congalton. 1986. “Accuracy Assessment-A User\’S Perspective.” Photogrammetric Engineering and Remote Sensing 52 (3): 397–399.
- Sun, H., W. Jiaqi, and X. Xinchao. 2016. “A Method to Determine Appropriate Spatial Resolution for Hard Image Classification.” Journal of the Indian Society of Remote Sensing 44 (1): 11–19. doi:10.1007/s12524-015-0471-3.
- Suykens, J. A. K., and J. Vandewalle. 1999. “Least Squares Support Vector Machine Classifiers.” Neural Processing Letters 9 (3): 293–300. doi:10.1023/A:1018628609742.
- Sydenstricker-Neto, J., A. W. Parmenter, and S. D. DeGloria. 2004. “Participatory Reference Data Collection Methods for Accuracy Assessment of Land-Cover Change Maps..” In Remote Sensing and GIS Accuracy Assessment, edited by R.S. Lunetta and J.G. Lyon, 75–90, Boca Raton: CRC Press.
- Tan, B., J. T. Morisette, R. E. Wolfe, F. Gao, G. A. Ederer, J. Nightingale, and J. A. Pedelty. 2011. “An Enhanced TIMESAT Algorithm for Estimating Vegetation Phenology Metrics from MODIS Data.” IEEE Journal of Selected Topics in Applied Earth Observations and Remote Sensing 4 (2): 361–371. doi:10.1109/JSTARS.2010.2075916.
- Tang, L., G. Shao, Z. Piao, L. Dai, M. A. Jenkins, S. Wang, W. Gang, W. Jianguo, and J. Zhao. 2010. “Forest Degradation Deepens around and within Protected Areas in East Asia.” Biological Conservation 143 (5): 1295–1298. doi:10.1016/j.biocon.2010.01.024.
- Tsela, P., K. Wessels, J. Botai, S. Archibald, D. Swanepoel, K. Steenkamp, and P. Frost. 2014. “Validation of the Two Standard MODIS Satellite Burned-Area Products and an Empirically-Derived Merged Product in South Africa.” Remote Sensing 6 (2): 1275–1293. doi:10.3390/rs6021275.
- Verhoef, W. 1996. “Application of Harmonic Analysis of NDVI Time Series (HANTS).” Fourier Analysis of Temporal NDVI in the Southern African and American Continents 108: 19–24.
- Vermote, E. F., N. El Saleous, C. O. Justice, Y. J. Kaufman, J. L. Privette, L. Remer, J. C. Roger, and D. Tanre. 1997a. “Atmospheric Correction of Visible to Middle‐Infrared EOS‐MODIS Data over Land Surfaces: Background, Operational Algorithm and Validation.” Journal of Geophysical Research: Atmospheres 102: (D14):17131-41. doi:10.1029/97JD00201.
- Vermote, E. F., D. Tanré, J. L. Deuzé, M. Herman, and -J.-J. Morcette. 1997b. “Second Simulation of the Satellite Signal in the Solar Spectrum, 6S: An Overview.” Geoscience and Remote Sensing, IEEE Transactions On 35 (3): 675–686. doi:10.1109/36.581987.
- Vintrou, E., A. Desbrosse, A. Bégué, S. Traoré, C. Baron, and D. L. Seen. 2012. “Crop Area Mapping in West Africa Using Landscape Stratification of MODIS Time Series and Comparison with Existing Global Land Products.” International Journal of Applied Earth Observation and Geoinformation 14 (1): 83–93. doi:10.1016/j.jag.2011.06.010.
- Wang, J., and J. Liu. 2011. “The Change of Agricultural Policy’s Effect and the Importance of Developing Environment-Friendly Agriculture - A Case in Republic of Korea.” Energy Procedia 5: 2246–2251. doi:10.1016/j.egypro.2011.03.388.
- Wardlow, B. D., and S. L. Egbert. 2008. “Large-Area Crop Mapping Using Time-Series MODIS 250 M NDVI Data: An Assessment for the US Central Great Plains.” Remote Sensing of Environment 112 (3): 1096–1116. doi:10.1016/j.rse.2007.07.019.
- Wen, J., S. Zhongbo, and M. Yaoming. 2004. “Reconstruction of a Cloud-Free Vegetation Index Time Series for the Tibetan Plateau.” Mountain Research and Development 24 (4): 348–353. doi:10.1659/0276-4741(2004)024[0348:ROACVI]2.0.CO;2.
- Wolfe, R. E., A. J. Masahiro Nishihama, A. Fleig, and D. P. Roy. 1999. The MODIS Operational Geolocation Error Analysis and Reduction Methodology. Paper presented at the Geoscience and Remote Sensing Symposium, 1999. IGARSS’99 Proceedings. IEEE 1999 International.
- Xiao, X., L. He, W. Salas, C. Li, B. Moore Iii, R. Zhao, S. Frolking, and S. Boles. 2002. “Quantitative Relationships between Field-Measured Leaf Area Index and VEGETATION Index Derived from VEGETATION Images for Paddy Rice Fields.” International Journal of Remote Sensing 23 (18): 3595–3604. doi:10.1080/01431160110115799.
- Xin, J., Z. Yu, L. Van Leeuwen, and P. M. Driessen. 2002. “Mapping Crop Key Phenological Stages in the North China Plain Using NOAA Time Series Images.” International Journal of Applied Earth Observation and Geoinformation 4 (2): 109–117. doi:10.1016/S0303-2434(02)00007-7.
- Yagci, A. L., D. Liping, and M. Deng. 2015. “The Effect of Corn–Soybean Rotation on the NDVI-Based Drought Indicators: A Case Study in Iowa, USA, Using Vegetation Condition Index.” Giscience & Remote Sensing 52 (3): 290–314. doi:10.1080/15481603.2015.1038427.
- Yang, X., W. Zhu, Y. Pan, and B. Jia. 2007. “Spatial Sampling Design for Crop Acreage Estimation.” Transactions of the Chinese Society of Agricultural Engineering 2007 23(12): 150–155. doi:10.3969/j.issn.1002-6819.2007.12.029.
- Zeng, L., B. D. Wardlow, R. Wang, J. Shan, T. Tadesse, M. J. Hayes, and L. Deren. 2016. “A Hybrid Approach for Detecting Corn and Soybean Phenology with Time-Series MODIS Data.” Remote Sensing of Environment 181: 237–250. doi:10.1016/j.rse.2016.03.039.
- Zhang, G., X. Xiao, J. Dong, W. Kou, C. Jin, Y. Qin, Y. Zhou, J. Wang, M. A. Menarguez, and C. Biradar. 2015a. “Mapping Paddy Rice Planting Areas through Time Series Analysis of MODIS Land Surface Temperature and Vegetation Index Data.” ISPRS Journal of Photogrammetry and Remote Sensing 106: 157–171. doi:10.1016/j.isprsjprs.2015.05.011.
- Zhang, H., X. Cao, L. Qiangzi, M. Zhang, and X. Zheng. 2015b. “Research on Crop Identification Using Multi-Temporal NDVI HJ Images.” Remote Sensing Technology and Application 30 (2): 304–311.
- Zhang, H., L. Qiangzi, and M. Zhang. 2014. The Effects of Spatial Resolution on the Maize Acreage Estimation by Remote Sensing. Paper presented at the IOP Conference Series: Earth and Environmental Science.
- Zhong, L., T. Hawkins, G. Biging, and P. Gong. 2011. “A Phenology-Based Approach to Map Crop Types in the San Joaquin Valley, California.” International Journal of Remote Sensing 32 (22): 7777–7804. doi:10.1080/01431161.2010.527397.