
Abstract
The proper management of solid waste (SW) is a global environmental challenge. A major issue is the proper disposal of SW while balancing a wide range of criteria and working with different spatial data. In this study, we used geographic information system as a tool to perform multi-criteria decision analysis with an analytical hierarchy process to develop an environmental impact susceptibility model (EISM) for landfills. The model was applied to the state of California, USA and results are presented herein. In particular, the EISM considers factors such as geology, pedology, geomorphology, water resources, and climate as represented by 13 associated environmental indicators. The results of the EISM indicate that more than 75% of California’s territory is situated in areas with very low, low, and medium environmental impact susceptibility categories. However, in the remaining 25% of the state’s land, 61 landfills are located in the high and very high categories. These results are alarming because during the period from 2000 to 2015, these 61 landfills received approximately 308 million tons of SW, which corresponds to more than 57% of all SW disposed in California. The model results can be used toward mitigating the environmental impacts of these facilities.
Introduction
Anthropogenic activities are usually associated with the generation of solid waste (SW) (Adamović et al. Citation2016). Even if the capacity of different means of waste management approaches and facilities such as recycling, composting, and incineration is increased, landfills are still necessary and remain a common method for SW disposal in many regions of the world, including the USA (OECD Citation2015; Townsend et al. Citation2015; USEPA Citation2015). Data from 2013 indicate that 64.7 million tons of municipal SW was recovered through recycling and 22 million tons were recovered through composting in the USA. Subtracting out what was recycled and composted, the remaining 167 million tons of waste were placed in landfills (USEPA Citation2015). For the near future, landfilling is expected to be the dominant method to manage SW in the USA (Qian, Koerner, and Gray Citation2002; Powell, Townsend, and Zimmerman Citation2015; USEPA Citation2015).
The most significant potential environmental threats associated with landfill disposal are release of gases and leachate (Tchobanoglous, Theisen, and Vigil Citation1993). The main landfill gases are methane and carbon dioxide, which are greenhouse gases. In addition, many trace gas components in the landfill gas are also ozone-depleting substances (USEPA Citation2017). Furthermore, migration of leachate to surface or underground water has potential for contamination of these water resources. Geotechnical instability and failure of the waste mass or containment system components also can pose significant environmental risks due to the uncontrolled release of landfilling by-products of gas and leachate as well as the waste materials (Koerner and Soong Citation2000; Qian, Koerner, and Gray Citation2002). The scale of the environmental impact depends on the composition and quantity of SW involved, the quality of the landfill’s operation and management, and the physical characteristics of the local area.
The lack of more sustainable waste management is a major environmental problem (Mishra et al. Citation2016). Sustainable management of SW is required to achieve low environmental impact (Adamović et al. Citation2016), and an essential part in this process is the proper disposal of waste. Disposal sites are usually permanent facilities that pose risks to the environment and population, and need to be monitored for extended periods of time (Leão, Bishop, and Evans Citation2004).
For these reasons, the environmental impact of landfills needs to be considered to avoid potential negative effects. In order to develop a comprehensive model for assessing the environmental impact susceptibility of landfills, multiple issues must be taken into consideration: value, scale, and uncertainty. In this process, the models are usually built to satisfy one or more of five main purposes: (i) prediction; (ii) forecasting; (iii) management and decision-making under uncertainty; (iv) social learning; and (v) developing system understanding and enabling experimentation (Letcher et al. Citation2013).
The overall objective of this study is to spatially assess the environmental susceptibility of landfill sites. An improvement in understanding how physical factors such as geology, pedology, geomorphology, climate, and surface and underground water resources connect and influence the environmental susceptibility is essential to avoid any negative impacts of SW disposal sites. In this study, we developed an environmental impact susceptibility model (EISM) for landfill sites considering at least three of the five main modeling purposes of prediction, management decision-making under uncertainty, and developing system understanding and enabling experimentation. To accomplish this task, we used multi-criteria decision analysis (MCDA) with the analytical hierarchy process (AHP) method coupled with geographic information system (GIS) to apply the model to the state of California, USA
Study area
The state of California, on the west coast of the US, is located between 32° and 42° north latitude and 114° and 124° west longitude. It borders the states of Oregon to the north, Nevada to the northeast, Arizona to the southeast, Baja California, Mexico to the south, and the Pacific Ocean to the west (). California is the most populous state in the USA with a population of approximately 39.2 million in July 2016 (CALIFORNIA Citation2016). Moreover, the state is also one of the biggest producers of SW in the USA, generating approximately 31.3 million tons of SW in 2014 (CalRecycle Citation2015).
Figure 1. Map of the state of California, USA (Color figure online).
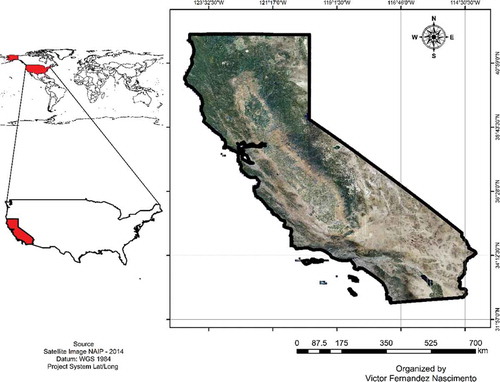
California is also the third largest state by land area in the USA, with an area approximately of 408,000 km2, and a diverse geography from forests to deserts and several large cities, including the nation’s second largest, Los Angeles. Furthermore, the state is considered to be the most crowded subnational entity in the Western Hemisphere and the Americas, with a population second only to that of São Paulo State in Brazil. Generally, densely populated areas are subject to more concerns associated with SW disposal that is widely practiced through the landfill method in both developed and developing countries (Ahmad et al. Citation2016). For these reasons, we chose the state of California to assess the environmental impact susceptibility and to analyze the susceptibility of the existing and new landfill sites in its territory.
Methods
To build the EISM for landfill sites, six major steps were considered: (1) selection of environmental decision criteria; (2) data acquisition and integration into a GIS database; (3) definition of classes and assignment of ratings; (4) standardization of environmental indicators to a common scale of measurement; (5) calculation of relative criteria weights using the AHP technique; and (6) derivation of the final model map using the weighted linear combination (WLC) aggregation method. Each step is described as follows.
Step 1: selection of environmental decision criteria
In this study, the environmental factors and indicators selected were based on literature that took into account environmental impact susceptibility associated with landfill sites (Leão, Bishop, and Evans Citation2004; Butt, Lockley, and Oduyemi Citation2008; Eskandari, Homaee, and Mahmodi Citation2012; Gbanie et al. Citation2013; Butt et al. Citation2014; Khan and Samadder Citation2015; Maanifar and Fataei Citation2015; Motlagh and Sayadi Citation2015; Eskandari et al. Citation2015; Bahrani et al. Citation2016; Chabuk et al. Citation2016; Chonattu, Prabhakar, and Harikumar Citation2016a; Demesouka, Vavatsikos, and Anagnostopoulos Citation2016; Chonattu, Prabhakar, and Harikumar Citation2016a and Citation2016b; Kharat et al. Citation2016; Eskandari, Homaee, and Falamaki Citation2016; Yıldırım and Güler Citation2016; Zhang et al. Citation2016). In addition, existing guidelines, relevant legislation and regulations, experts’ opinions obtained in informal meetings, and available relevant data were considered in the development of the EISM. Overall, a total of six environmental factors – geology, pedology, geomorphology, climate, surface, and underground water resources – as 13 associated environmental indicators were transformed into layers and used in the model (). This list is not exhaustive; the most important criteria as indicated in previous studies and deemed significant by the authors were used to develop the EISM for landfill sites.
Figure 2. Factors and environmental indicators used to develop the environmental impact susceptibility model for landfill sites.
Geology
Geological features influence the environmental susceptibility of landfill sites because they can cause land instability in an earthquake region (Qian, Koerner, and Gray Citation2002; Akyol, Kaya, and Alkan Citation2016). The geological features can also influence water infiltration if the rock formations are porous or include faults (Deepa et al. Citation2016). For this reason, when SW is disposed of above susceptible geological formations, instability of the containment systems and the waste mass may occur resulting in potential contamination of the surrounding surface and subsurface soils and water. Geological criteria were considered in previous studies that investigated environmental impacts caused by SW in landfills (Aydi et al. Citation2016; Bahrani et al. Citation2016; Chonattu, Prabhakar, and Harikumar Citation2016a; Yıldırım and Güler Citation2016; Zhang et al. Citation2016). However, these studies did not consider simultaneously the three geological environmental indicators used in the current study, which were (i) distance to faults; (ii) seismic hazard zones; and (iii) distance to karstic areas. Karst areas are limestone landforms subject to rapid ground erosion by dissolution, with potential release of wastes and leachates into the subsurface water bodies.
Pedology
Soil parameters, such as depth and physical characteristics, also affect the environmental susceptibility related to siting of landfills, because permeability of the soil underlying and overall surrounding a landfill facility can influence the infiltration process, which in turn can cause contamination of groundwater (Sharma and Reddy Citation2004). Multiple studies on landfilling issues have included pedologic aspects in their assessments (Leão, Bishop, and Evans Citation2004; Maanifar and Fataei Citation2015; Motlagh and Sayadi Citation2015; Zhang et al. Citation2016). Of great importance is the rate of soil water infiltration, indeed often landfills are lined with clays that saturate quickly and prevent water percolation (Talalaj and Biedka Citation2016). In particular, we used (i) drainage class and (ii) hydrologic soil group as pedologic environmental indicators in this study.
Geomorphology
Geomorphology is related to terrain features and the influence of these characteristics on the topography. For example, the increase of slope steepness also increases the terrain instability (Qian, Koerner, and Gray Citation2002; Sharma and Reddy Citation2004). In addition, landfills should not be located in areas susceptible to stream erosion or landslides. Many previous studies have taken topographical aspects into consideration (Gbanie et al. Citation2013; Khan and Samadder Citation2015; Kharat et al. Citation2016; Zhang et al. Citation2016). In particular, we used the geomorphological environmental indicators of (i) landslide risk and (ii) slope.
Water resources
Another significant aspect that affects environmental susceptibility is associated with surface and underground water resources. It is not appropriate to have landfills close to surface water sources or in areas where the water table level is shallow due to the higher contamination risk (Qian, Koerner, and Gray Citation2002; Sharma and Reddy Citation2004). Several studies have taken into consideration these aspects (Gbanie et al. Citation2013; Eskandari et al. Citation2015; Khan and Samadder Citation2015; Maanifar and Fataei Citation2015; Motlagh and Sayadi Citation2015; Bahrani et al. Citation2016; Chabuk et al. Citation2016; Chonattu, Prabhakar, and Harikumar Citation2016a; Yıldırım and Güler Citation2016). In this study, we used the surface water resource environmental indicators of (i) distance to rivers and lakes and (ii) flood frequency, while, for underground water resources we used the environmental indicators of (i) distance to wells and (ii) depth to water table.
Climate
Climate factors, which are the average and succession of meteorological conditions, also need to be considered in modeling the environmental impact susceptibility for landfills. Climatic conditions significantly influence SW decomposition and degradation process, which control the generation of the three main by-products of SW landfilling which are leachate, gas, and heat (Tchobanoglous, Theisen, and Vigil Citation1993; Yesiller, Hanson, and Liu Citation2005). Climatic aspects were also considered in previous investigations (Maanifar and Fataei Citation2015; Chonattu, Prabhakar, and Harikumar Citation2016a and Citation2016b; Eskandari, Homaee, and Falamaki Citation2016; Kharat et al. Citation2016). In this study, we used the most significant climatic environmental indicators of (i) precipitation and (ii) temperature. Data for the 30-year period from 1981 to 2010 were used in the analysis.
Step 2: data acquisition and integration into a GIS database
The use of GIS is one of the most promising approaches for investigating complex spatial phenomena, because GIS has the advantage of storing, retrieving, and analyzing a considerable amount of disaggregated data from various sources and displaying the results on maps (Gbanie et al. Citation2013; Kallel, Serbaji, and Zairi Citation2016). MCDA techniques combined with GIS have been successfully used in environmental studies (Huang, Keisler, and Linkov Citation2011; Guarnieri Citation2015) including investigations related to landfill suitability analysis (Demesouka, Vavatsikos, and Anagnostopoulos Citation2014). Coupling MCDA with GIS is crucial for spatial analysis for two reasons, first because the coupled analysis informs the spatial decision (Carver Citation1991), and second because the analysis can support the participation of experts and decision makers improving the confidence in the results (Malczewski Citation2006).
The spatial database used in the EISM for landfill sites applied to the state of California was created using a variety of sources including geologic, pedologic, geomorphologic, hydrologic, and climate data at different scales (). The table provides the data used to create the layers. All data used were available in digital format and dated between the years 2001 and 2016. Furthermore, all data used to develop the EISM are available for downloading online with specific references to the relevant websites provided under the references.
Table 1. Spatial data used in the environmental impact susceptibility model for landfills in the state of California.
The spatial data used to develop the EISM were the most recent and highest resolution data available for the study area. In some cases, better resolution or more recent data were identified for a specific municipality or county, but not for the entire state of California. In such cases, the data available for the entire state were used to prevent bias that may have resulted from using different resolutions in the analysis.
All the data layers were collected, stored, projected, manipulated, analyzed, and visualized using ArcGIS version 10.2 ModelBuilder as a starting point for the MCDA. ModelBuilder is a GIS extension that encodes complex sequences of GIS operations into a simple graphic model from which the steps can be executed (Allen Citation2011). The data were georeferenced using the Universal Transverse Mercator (UTM) system and the North American Datum of 1983 (NAD83) (Zones 10 and 11 North).
Step 3: definition of class and rating
Each of the 13 environmental indicators used in the EISM for landfill sites was divided into classes. Each class was rated on a scale from 1 to 10, where 1 represents the lowest level of susceptibility and 10 represents the highest level of susceptibility for environmental impact (). The rating interval from 1 to 10 was selected based on similar scales used by comparable studies (Alavi et al. Citation2013; Zakerian, Mokhtari, and Almodaresi Citation2015; Chonattu, Prabhakar, and Harikumar Citation2016a; Rahmat et al. Citation2016) and based on the experience and judgment of the authors. The specific classes in were assigned considering the relevant conditions in California. Other classes could be used in applications to different study areas.
Table 2. Environmental impact susceptibility model classes and associated ratings.
Step 4: standardization of environmental indicators to a common scale of measurement
In order to overlay the spatial information to calculate the environmental impact susceptibility, it was necessary to standardize the data to a common measurement scale. Therefore, the 13 environmental indicators data were converted into raster grid format consisting of 50 m cells resulting in an image of 19,311 columns and 21,769 rows.
Step 5: criteria weight assignment using AHP
In this study, we used the analytical hierarchy process (AHP), which is a component of the MCDA method. The AHP was developed by Saaty in the 1970s and consists of an assessment theory through pairwise comparison to help decision makers set priorities and choose the best decision (Kharat et al. Citation2016). The AHP in combination with GIS has been widely used in the field of natural resources and environmental management (Jothibasu and Anbazhagan Citation2016), first because it is easy to implement using map algebra operations and cartographic models, and second because the approaches are intuitively appealing to decision makers (Malczewski Citation2006). The comparisons in the AHP were made using a scale of absolute judgments ranging from 1–9, where 1 represents equal importance and 9 represents the highest importance from one element to another. In addition, a reciprocal value is used to express the inverse comparison (Saaty Citation2008).
The process of AHP determination involves these sequential steps: (i) compute the sum of values in each column of a pairwise comparison matrix, (ii) normalize the matrix by dividing each element by its column total, and (iii) compute the mean of the elements in each row of the normalized matrix (Khan and Samadder Citation2015).
Subsequent to determination of the AHP, a consistency ratio (CR) needs to be calculated. The CR is acceptable if its value is less than 10%. However, if this number is higher than 10%, the judgments may be inconsistent and should be reevaluated or excluded (Yıldırım and Güler Citation2016).
The construction of a comparison matrix and the derivation of weights were conducted using the web-based tool developed by Goepel (Citation2013). First, the AHP methodology was applied to the factors () and environmental indicators (). Then, by multiplying the factor weights by the environmental indicator weights, the global weighting for each criterion was obtained ().
Table 3. Pairwise comparison matrix, ranking, and weights for factors.
Table 4. Pairwise comparison matrix, ranking, and weights for environmental indicators.
Table 5. Global weighting for the criteria.
Step 6: weight linear combination method
After checking the reliability of the pairwise comparisons for factors and indicators, the EISM for landfill sites in California was built using a WLC method. The final score was obtained for each raster cell as a sum of the products of ratings assigned to each of the classes () and the global weights obtained by AHP () (). The results varied from 1.93 to 8.01, the minimum and maximum values, respectively. This interval was classified by the natural breaks method (Jenks and Caspall Citation1971) and then grouped into five categories of environmental impact susceptibility for landfill sites: very low (S1), low (S2), medium (S3), high (S4), and very high (S5).
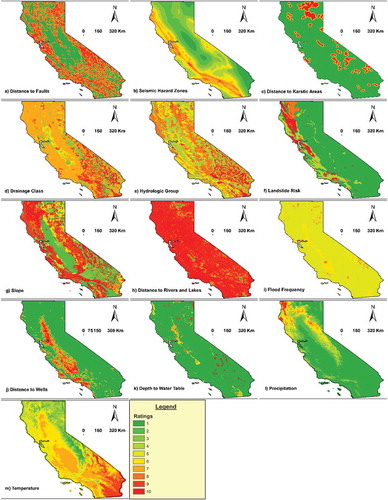
Figure 3. Maps for all selected environmental indicators in the state of California (Color figure online).
Results and discussion
Through the development of the EISM for landfill sites using MCDA and the AHP coupled with GIS, it was possible to identify the most and least environmentally susceptible areas. With the application of the model, it was also possible to assess the current susceptibility of landfill sites in the state of California, USA.
The geographical coordinates of 207 landfill sites in the state of California were obtained from spreadsheets used for the landfill tonnage reports between the years of 2000 and 2015. Of these 207 landfills, 133 were classified as active, 10 as inactive, 8 as closing, 1 as planned, and 55 as closed (CalRecycle Citation2016).
A spatial analysis was performed by overlaying the results of the EISM and the locations of SW landfill sites in the state of California. This analysis allowed identification of the specific landfills included in each of the environmental impact susceptibility categories and the amount of SW disposed of during the period of 2000–2015 in each class of susceptibility.
Environmental impact susceptibility model for landfills
The results of applying the EISM to landfill sites in California are presented in . The area for each susceptibility category indicated that almost half of California’s land, 47.4%, is classified under very low (S1) and low (S2) environmental impact susceptibility categories, 28.3% is under medium (S3) category, and 24.3% is under the high (S4) and very high (S5) categories ().
Table 6. Environmental susceptibility for landfills in California.
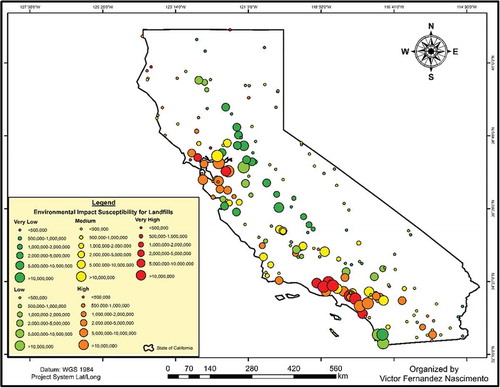
Figure 4. Environmental impact susceptibility for landfill sites in California (Color figure online).
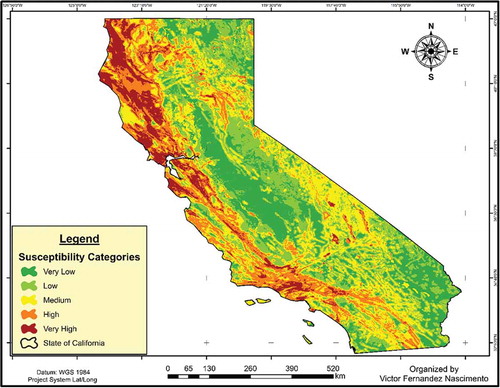
The very high class alone has an area of 30,492 km2, which represents 7.5% of the land area of California. This area is located mainly less than 100 km from the ocean, on the North Coast, in the San Francisco Bay Area and near the city of Los Angeles. This can be explained by a combination of geographical variables. On the North Coast, the highest rate of precipitation was observed, which is the environmental indicator with the highest level of importance in the EISM. The very high environmental impact susceptibility observed near the San Francisco Bay Area and near the city of Los Angeles, resulted mainly from the geologic environmental indicators of seismic hazard zones and distance to faults, the third and fourth most important environmental indicators in this study.
The development of EISM for landfills in California proceeded well due to the availability and reliability of spatial data for the state. Overall, the 6 factors – geology, pedology, geomorphology, climate, surface, and underground water resources – with 13 corresponding environmental indicators selected in this study provided an improvement over previous models for 3 main reasons: (i) a higher number of factors used, (ii) more environmental indicators used, and (iii) a more extensive set of combined factors and environmental indicators used. Therefore, the framework of this model can provide an effective tool to policymakers and landfill designers and operators as well as urban planners to avoid the environmental impacts caused by susceptible landfill sites.
Analysis of susceptibility for landfill sites in California
In order to evaluate the environmental impact susceptibility for each landfill site in California, a spatial analysis () and a statistical summary () were developed. The number of landfills included in each environmental impact susceptibility category has a positive correlation with the extent of each category in the state of California. Approximately 70% of the landfills are located in very low, low, and medium environmental impact susceptibility categories (S1, S2, and S3, respectively). Even though only 30% of the landfills are located in the high and very high categories (S4 and S5, respectively), a large amount of SW (307,991,749 tons) was disposed of in these facilities over the last 15 years (). The list with the information about the landfills and the quantity of SW disposed in the two highest susceptibility categories is provided in .
Table 7. Environmental susceptibility category for landfill sites in the state of California.
Table 8. Solid waste landfills in high and very high categories (S4 and S5).
Figure 5. Categorization of environmental impact susceptibility for landfill sites in California (Color figure online).
From the 13 landfills located in the very high category, 3 did not receive SW during the period 2000–2015. Among the remaining 10 landfills, 8 are active, 1 is closing, and 1 is closed. These landfills received in total 142,122,911 tons, which represent more than 26% of the total SW disposed of in the state of California.
From 48 landfills located in the high environmental impact susceptibility category, 6 did not receive SW during the period of 2000–2015. Among the remaining 42 landfills, 29 are active, 1 is inactive, 1 is closing, and 11 are closed. These landfills received in total 165,868,838 tons of SW, which represented more than 30% of the total SW disposed of in the state of California.
When the amount of SW in the 12 largest landfills located in the high and very high environmental impact susceptibility categories are added, the total SW disposed is more than 238 million tons, which represents more than 77% of the total SW disposed in landfills located in these higher categories.
Conclusions
The results obtained using the EISM indicated that even though more than 75% of California’s land is situated in very low, low, and medium susceptibility categories, 29% (61 of 207) of the landfills in the state are located in the high and very high susceptibility categories. In these 61 landfills, approximately 308 million tons of SW was disposed of during 2000–2015, which indicates that more than 57% of SW disposed of in California was placed in environmentally susceptible areas. The results of this study can help decision makers, landfill managers, and local governments develop control and mitigation measures against the occurrence of negative environmental impacts from these landfills.
The development of this model included three main modeling purposes, prediction, management decision-making under uncertainty, and developing system understanding and enabling experimentation. This type of spatial analysis can help decision makers mitigate environmental impacts and also assist in the process of identifying areas for new landfills. For future studies, the authors suggest adding: (i) forecasting, using different climate scenarios that influence leachate generation and emission of greenhouse gases, which can improve the assessment of the environmental impact susceptibility, and (ii) social learning, coupling a social model with the EISM, which could result in a greater understanding of global susceptibility for the siting and management of landfills.
Acknowledgments
The authors thank Fundação de Amparo a Pesquisa no Estado de São Paulo (FAPESP) for Victor Fernandez Nascimento’s doctoral fellowships (No. 13/09039-7) and (No. 15/24344-6), the Earth System Science Center (CCST), the National Institute for Space Research (INPE), and the Global Waste Research Institute at California Polytechnic State University, for the support provided during this research. The authors also thank Dr. Marie Rosenwasser for English review.
Disclosure statement
No potential conflict of interest was reported by the authors.
Additional information
Funding
References
- Adamović, V. M., D. Z. Antanasijević, M. Đ. Ristić, A. A. Perić-Grujić, and V. V. Pocajt. 2016. “Prediction of Municipal Solid Waste Generation Using Artificial Neural Network Approach Enhanced by Structural Break Analysis.” Environmental Science and Pollution Research 1–13. doi:10.1007/s11356-016-7767-x.
- Ahmad, A., U. Javaid, M. A. Javed, S. R. Ahmad, M. A. Jaffri, and M. Ashfaq. 2016. “Landfill Sites Identification Using GIS and Multi-Criteria Method : A Case Study of Intermediate City of Punjab, Pakistan.” Journal of Geographic Information System 8: 40–49. doi:10.4236/jgis.2016.81004.
- Akyol, E., A. Kaya, and M. Alkan. 2016. “Geotechnical Land Suitability Assessment Using Spatial Multi-Criteria Decision Analysis.” Arabian Journal of Geosciences 9 (7): 498. doi:10.1007/s12517-016-2523-6.
- Alavi, N., G. Goudarzi, A. A.Babaei, N. Jaafarzadeh, and M. Hosseinzadeh. 2013. “Municipal Solid Waste Landfill Site Selection with Geographic Information Systems and Analytical Hierarchy Process: A Case Study in Mahshahr County, Iran.” Waste Management & Research 31 (1): 98–105. doi:10.1177/0734242X12456092.
- Allen, D.W. 2011. Getting to Know Arcgis Modelbuilder. California: ESRI Press.
- Aydi, A., T. Abichou, I.H. Nasr, M. Louati, and M. Zairi. 2016. “Assessment of Land Suitability for Olive Mill Wastewater Disposal Site Selection by Integrating Fuzzy Logic, AHP, and WLC in a GIS.” Environmental Monitoring and Assessment 188 (1): 59. doi:10.1007/s10661-015-5076-3.
- Bahrani, S., T. Ebadi, H. Ehsani, H. Yousefi, and R. Maknoon. 2016. “Modeling Landfill Site Selection by Multi-Criteria Decision Making and Fuzzy Functions in GIS, Case Study: Shabestar, Iran.” Environmental Earth Sciences 75 (4): 14. doi:10.1007/s12665-015-5146-4.
- Butt, T.E., H. M. Gouda, M. I. Baloch, P. Paul, A. Javadi, and A. Alam. 2014. “Literature Review of Baseline Study for Risk Analysis - the Landfill Leachate Case.” Environment International 63: 149–162. doi:10.1016/j.envint.2013.09.015.
- Butt, T. E., E. Lockley, and K. O. Oduyemi. 2008. “Risk Assessment of Landfill Disposal Sites – State of the Art.” Waste Management 28 (6): 952–964. doi:10.1016/j.wasman.2007.05.012.
- CALIFORNIA. 2016. “Demographic Information.” In Governor’s Budget Summary, 139–143. http://www.ebudget.ca.gov/2015-16/pdf/budgetsummary/demographicinformation.pdf.
- CalRecycle. 2015. 2014 Landfill Summary Tonnage Report. http://www.calrecycle.ca.gov/SWFacilities/Landfills/Tonnages/.
- CalRecycle. 2016. “Solid Waste Information System (SWIS).” http://www.calrecycle.ca.gov/SWFacilities/Directory/Search.aspx#DOWNLOAD.
- Carver, S. J. 1991. “Integrating Multi-Criteria Evaluation with Geographical Information Systems.” International Journal of Geographical Information System 5 (3): 321–339. doi:10.1080/02693799108927858.
- Chabuk, A., N. Al-Ansari, H. M. Hussain, S. Knutsson, and R. Pusch. 2016. “Landfill Site Selection Using Geographic Information System and Analytical Hierarchy Process: A Case Study Al-Hillah Qadhaa, Babylon, Iraq.” Waste Management & Research 1–11. doi:10.1177/0734242X16633778.
- Chonattu, J., K. Prabhakar, and P. S. P. Harikumar. 2016a. “Application of GIS and DRASTIC Modeling for Evaluation of Groundwater Vulnerability near a Solid Waste Disposal Site.” International Journal of Geosciences 7: 558–571. doi:10.4236/ijg.2016.74043.
- Chonattu, J., K. Prabhakar, and P. S. P. Harikumar. 2016b. “Geospatial and Statistical Assessment of Groundwater Contamination Due to Landfill Leachate — A Case Study.” Journal of Water Resource and Protection 8: 121–134. doi:10.4236/jwarp.2016.82010.
- Deepa, S., S. Venkateswaran, R. Ayyandurai, R. Kannan, and M. Vijay Prabhu. 2016. “Groundwater Recharge Potential Zones Mapping in Upper Manimuktha Sub Basin Vellar River Tamil Nadu India Using GIS and Remote Sensing Techniques.” Modeling Earth Systems and Environment 2 (137): 1–13. doi:10.1007/s40808-016-0192-9.
- Demesouka, O. E., A. P. Vavatsikos, and K. P. Anagnostopoulos. 2014. “GIS-Based Multicriteria Municipal Solid Waste Landfill Suitability Analysis: A Review of the Methodologies Performed and Criteria Implemented.” Waste Management & Research 32 (4): 270–296. doi:10.1177/0734242X14526632.
- Demesouka, O. E., A. P. Vavatsikos, and K. P. Anagnostopoulos. 2016. “Using MACBETH Multicriteria Technique for GIS-Based Landfill Suitability Analysis.” Journal of Environmental Engineering 114 (10): 1–11. doi:10.1061/(ASCE)EE.1943-7870.0001109.
- Eskandari, M., M. Homaee, and A. Falamaki. 2016. “Landfill Site Selection for Municipal Solid Wastes in Mountainous Areas with Landslide Susceptibility.” Environmental Science and Pollution Research 23 (12): 12423–12434. doi:10.1007/s11356-016-6459-x.
- Eskandari, M., M. Homaee, and S. Mahmodi. 2012. “An Integrated Multi Criteria Approach for Landfill Siting in a Conflicting Environmental, Economical and Socio-Cultural Area.” Waste Management 32 (8): 1528–1538. doi:10.1016/j.wasman.2012.03.014.
- Eskandari, M., M. Homaee, S. Mahmodi, E. Pazira, and M. Th, Van Genuchten. 2015. “Optimizing Landfill Site Selection by Using Land Classification Maps.” Environmental Science and Pollution Research 22 (10): 7754–7765. doi:10.1007/s11356-015-4182-7.
- Gbanie, S. P., P. B. Tengbe, J. S. Momoh, J. Medo, and V. T. S. Kabba. 2013. “Modelling Landfill Location Using Geographic Information Systems (GIS) and Multi-Criteria Decision Analysis (MCDA): Case Study Bo, Southern Sierra Leone.” Applied Geography 36: 3–12. doi:10.1016/j.apgeog.2012.06.013.
- Goepel, K. D. 2013. “Implementing the Analytic Hierarchy Process as A Standard Method for Multi-Criteria Decision Making in Corporate Enterprises – A New AHP Excel Template with Multiple Inputs.” Proceedings of the International Symposium on the Analytic Hierarchy Process, 1–10. http://bpmsg.com/wp-content/uploads/2013/06/ISAHP_2013-13.03.13.Goepel.pdf.
- Guarnieri, P. 2015. Decision Models in Engineering and Management. New York, N.Y: Springer.
- Huang, I. B., J. Keisler, and I. Linkov. 2011. “Multi-Criteria Decision Analysis in Environmental Sciences: Ten Years of Applications and Trends.” The Science of the Total Environment 409 (19): 3578–3594. doi:10.1016/j.scitotenv.2011.06.022.
- Jenks, G. F., and F. C. Caspall. 1971. “Error on Choropleth Maps: Definition, Measurement, Reduction.” Annals of the Association of American Geographers 61 (2): 217–244. doi:10.1111/j.1467-8306.1971.tb00779.x.
- Jothibasu, A., and S. Anbazhagan. 2016. “Modeling Groundwater Probability Index in Ponnaiyar River Basin of South India Using Analytic Hierarchy Process.” Modeling Earth Systems and Environment 2 (3): 109. doi:10.1007/s40808-016-0174-y.
- Kallel, A., M. Serbaji, and M. Zairi. 2016. “Using GIS-Based Tools for the Optimization of Solid Waste Collection and Transport: Case Study of Sfax City, Tunisia.” Journal of Engineering 2016: 1–7. doi:10.1155/2016/4596849.
- Khan, D., and S. R. Samadder. 2015. “A Simplified Multi-Criteria Evaluation Model for Landfill Site Ranking and Selection Based on AHP and GIS.” Journal of Environmental Engineering and Landscape Management 6897: 1–12. doi:10.3846/16486897.2015.1056741.
- Kharat, M. G., S. J. Kamble, R. D. Raut, S. S. Kamble, and S. M. Dhume. 2016. “Modeling Landfill Site Selection Using an Integrated Fuzzy MCDM Approach.” Modeling Earth Systems and Environment 2 (2): 53. doi:10.1007/s40808-016-0106-x.
- Koerner, R. M., and T.-Y. Soong. 2000. “Stability Assessment of Ten Large Landfill Failures.” Advances in Transportation and Geoenvironmental Systems Using Geosynthetics 1–38. ASCE. doi:10.1061/40515(291)1#sthash.co6cUujw.dpuf.
- Leão, S., I. Bishop, and D. Evans. 2004. “Spatial–Temporal Model for Demand and Allocation of Waste Landfills in Growing Urban Regions.” Computers, Environment and Urban Systems 28 (4): 353–385. doi:10.1016/S0198-9715(03)00043-7.
- Letcher, R. A. K, A. J. Jakeman, O. Barreteau, M. E. Borsuk, S. ElSawah, S. H. Hamilton, H. J. Henriksen, et al. 2013. “Selecting among Five Common Modelling Approaches for Integrated Environmental Assessment and Management.” Environmental Modelling & Software 47 :159–181. doi:10.1016/j.envsoft.2013.05.005.
- Maanifar, M. R., and E. Fataei. 2015. “Environmental Assessment of Municipal Landfills (Case Study: East Azerbaijan Province/Iran).” Advances En Bioresearch 6: 52–58. doi:10.15515/abr.0976-4585.6.3.5258.
- Malczewski, J. 2006. “GIS Based Multicriteria Decision Analysis: A Survey of the Literature.” International Journal of Geographical Information Science 20: 703–726. doi:10.1080/13658810600661508.
- Mishra, H., S. Karmakar, R. Kumar, and J. Singh. 2016. “A Framework for Assessing Uncertainty Associated with Human Health Risks from MSW Landfill Leachate Contamination.” Risk Analysis. doi:10.1111/risa.12713.
- Motlagh, Z. K., and M. H. Sayadi. 2015. “Siting MSW Landfills Using MCE Methodology in GIS Environment (Case Study: Birjand Plain, Iran).” Waste Management 46: 322–337. doi:10.1016/j.wasman.2015.08.013.
- OECD. 2015. Environment at a Glance 2015: OECD Indicators. http://www.oecd.org/env/environment-at-a-glance-19964064.htm.
- Powell, J. T., T. G. Townsend, and J. B. Zimmerman. 2015. “Estimates of Solid Waste Disposal Rates and Reduction Targets for Landfill Gas Emissions.” Nature Climate Change 6: 1–19. doi:10.1038/nclimate2804.
- Qian, X., R.. M. Koerner, and D. H. Gray. 2002. Geotechnical Aspects of Landfill Design and Construction. Prentice Hall. Upper Saddle River, NJ.: Prentice Hall.
- Rahmat, Z. G., M. V. Niri, N. Alavi, G. Goudarzi, A. A. Babaei, Z. Baboli, and M. Hosseinzadeh. 2016. “Landfill Site Selection Using GIS and AHP: A Case Study: Behbahan, Iran.” KSCE Journal of Civil Engineering 20: 1–8. doi:10.1177/0734242X16633777.
- Saaty, T. L. 2008. “Decision Making with the Analytic Hierarchy Process.” International Journal of Services Sciences 1 (1): 83. doi:10.1504/IJSSCI.2008.017590.
- Sharma, H. D., and K. R. Reddy. 2004. Geoenvironmental Engineering: Site Remediation, Waste Containment, and Emergency Waste Management Technologies. Hoboken, New Jersey: John Wiley & Sons.
- Talalaj, I. A., and P. Biedka. 2016. “Use of the Landfill Water Pollution Index (LWPI) for Groundwater Quality Assessment near the Landfill Sites.” Environmental Science and Pollution Research 23: 1–13. doi:10.1007/s11356-016-7622-0.
- Tchobanoglous, G., H. Theisen, and S. Vigil. 1993. Integrated Solid Waste Management : Engineering Principles and Management Issues. New York: McGraw Hill.
- Townsend, T. G., J. Powell, P. Jain, X. Qiyong, T. Tolaymat, and D. Reinhart. 2015. “The Landfill’s Role in Sustainable Waste Management.” Sustainable Practices for Landfill Design and Operation 1–12. doi:10.1007/978-1-4939-2662-6.
- USEPA. 2015. Advancing Sustainable Materials Management : 2013 Fact Sheet. Assessing Trends in Material Generation, Recycling and Disposal in the United States. https://www.epa.gov/sites/production/files/2015-09/documents/2013_advncng_smm_fs.pdf.
- USEPA. 2017. “Landfill Methane Outreach Program (LMOP).” https://www.epa.gov/lmop/frequent-questions-about-landfill-gas.
- Yesiller, N., J. L. Hanson, and W.-L. Liu. 2005. “Heat Generation in Municipal Solid Waste Landfills.” Journal of Geotechnical and Geoenvironmental Engineering 131 (11): 1330–1344. doi:10.1061/(ASCE)1090-0241(2005)131:11(1330).
- Yıldırım, Ü., and C. Güler. 2016. “Identification of Suitable Future Municipal Solid Waste Disposal Sites for the Metropolitan Mersin (SE Turkey) Using AHP and GIS Techniques.” Environmental Earth Sciences 75 (2): 101. doi:10.1007/s12665-015-4948-8.
- Zakerian, S., M. Mokhtari, and S. A. Almodaresi. 2015. “Evaluation of A Landfill Site Using AHP and TOPSIS Models: A Case Study of Ardakan Landfill, Iran.” Avicenna Journal of Environmental Health Engineering 2 (1): 11–12. doi:10.17795/ajehe754.
- Zhang, B., L. Guoxiu, P. Cheng, T.-C. J. Yeh, and M. Hong. 2016. “Landfill Risk Assessment on Groundwater Based on Vulnerability and Pollution Index.” Water Resources Management 30 (4): 1465–1480. doi:10.1007/s11269-016-1233-x.