?Mathematical formulae have been encoded as MathML and are displayed in this HTML version using MathJax in order to improve their display. Uncheck the box to turn MathJax off. This feature requires Javascript. Click on a formula to zoom.
Abstract
Developing a robust drought monitoring tool is vital to mitigate the adverse impacts of drought. A drought monitoring system that integrates multiple agrometeorological variables into a single drought indicator is lacking in areas such as Ethiopia, which is extremely susceptible to this natural hazard. The overarching goal of this study is to develop a combined drought indicator (CDI-E) to monitor the spatial and temporal extents of historic agricultural drought events in Ethiopia. The CDI-E was developed by combining four satellite-based agrometeorological input parameters – the Standardized Precipitation Index (SPI), Land Surface Temperature (LST) anomaly, Standardized Normalized Difference Vegetation Index (stdNDVI) and Soil Moisture (SM) anomaly – for the period from 2001 to 2015. The method used to combine these indices is based on a quantitative approach that assigns a weight to each input parameter using Principal Component Analysis (PCA). The CDI-E results were evaluated using satellite-based gridded rainfall (3-month SPI) and crop yield data for 36 intra-country crop growing zones for a 15-year period (2001 to 2015). The evaluation was carried out for the main rainfall season, Kiremt (June-September), and the short rainfall season, Belg (February-May). The results showed that moderate to severe droughts were detected by the CDI-E across the food insecure regions reported by FEWS NET during Kiremt and Belg rainfall seasons. Relatively higher correlation coefficient values (r > 0.65) were obtained when CDI-E was compared with the 3-month SPI across the majority of Ethiopia. The spatial correlation analyses of CDI-E and cereal crop yields showed relatively good correlations (r > 0.5) in some of the crop growing zones in the northern, eastern and southwestern parts of the country. The CDI-E generally mapped the spatial and temporal patterns of historic drought and non-drought years and hence the CDI-E could potentially be used to develop an agricultural drought monitoring and early warning system in Ethiopia. Moreover, decision makers and donors may potentially use CDI-E to more accurately monitor crop yields across the food-insecure regions in Ethiopia.
1. Introduction
Drought is an integral part of the environment and a recurrent feature of climates that occurs in the different parts of the world (Kogan Citation2007; Dai Citation2013). It is one of the most complex natural hazards given the fact that it can cause considerable devastation over very large areas (and across long periods of time), particularly in developing and food-insecure regions (Wilhite Citation2000; Wilhite, Svoboda, and Hayes Citation2007). The primary driver of drought is the shortfall of annual rainfall sustained for a prolonged period. Besides rainfall, the persistent decline in other water cycle components such as soil moisture, ground water, streamflow and surface water storage is also associated with the occurrence of drought (Wilhite Citation2000; Mishra and Singh Citation2010; Narasimhan and Srinivasan Citation2005; Valliyodan and Nguyen Citation2006; Wilhite and Buchanan-Smith Citation2005; Padhee et al. Citation2017).
In Ethiopia, drought is a frequently recurring phenomenon that affects many sectors, including agriculture. More than 85% of the population depends on income generated from agricultural products (Berg and Kumbi Citation2006; Bayissa et al. Citation2015). Agricultural practices in across the majority of the country are primitive and dependent on annual rainfall (Gebregziabhera Citation2006). Often the shortfall and mistimed periods of rainfall significantly affect the agricultural sector, resulting in crop yield reductions, food security concerns and other economic losses. In Ethiopia, severe historic droughts have occurred in the past few decades (Ellen, Diriba, and Asgeir Citation2013). The 2015 drought was one of the worst events over the past 30 years, covering a large area of the country and exacerbating food insecurity (WFP Citation2016). According to the Humanitarian Response of the United States Government report, the U.S. Agency for International Development (WFP Citation2016) has mobilized more than 680,000 metric tons of food to support about 4 million people since 2015 (WFP Citation2016). This drought has persisted in recent years in drought-prone parts of the country. Other notable severe droughts have occurred in the country during the past few decades. Notable drought events occurred in 1984/1985, 1994/1995, 2003/2004, and 2009, with some of these events covering the majority of the country (Bayissa et al. Citation2015; Ellen, Diriba, and Asgeir Citation2013; Tagel, Van Der Veen, and Maathuis Citation2011; Edossa, Babel, and Gupta Citation2009). Droughts have become more frequent in recent decades, with events occurring every two to five years in the drought-prone regions, as compared to more decadal intervals in the past (Bewket and Conway Citation2007). Hence, developing an effective drought monitoring and early warning system is a very crucial component used to mitigate its adverse impacts and to plan and prepare for future droughts.
Developing drought monitoring tools are highly dependent on hydro-meteorological variables measured with reasonable temporal and spatial coverage (Wu et al. Citation2005). The availability of reliable high-resolution measured in situ data is one of the main challenges in developing countries like Ethiopia (Bayissa et al. Citation2015). However, satellite-based data are increasingly becoming an alternative source of information that provides spatially continuous measurements and relatively longer record length on almost a routine, near-real time basis appropriate for drought monitoring and forecasting systems in data-scarce regions (Senay et al. Citation2015; Rojas, Vrieling, and Rembold Citation2011). Several studies have been conducted on using satellite-based input variables (e.g., rainfall, land surface temperature, soil moisture, vegetation condition) to study drought and other water resources related natural hazards (Senay et al. Citation2015; Rojas, Vrieling, and Rembold Citation2011).
The shortfalls of the climatic variables are often the primary source for the depletion of soil moisture that eventually affects the vegetation condition and reduction of the crop yield (Wilhite Citation2000; Wilhite, Svoboda, and Hayes Citation2007). Many researchers have conducted studies in Ethiopia on drought assessment and forecasting based on drought indices that use climatic and other variables such as rainfall, temperature, vegetation, and soil moisture (Bayissa et al. Citation2015; Tagel, Van Der Veen, and Maathuis Citation2011; Edossa, Babel, and Gupta Citation2009). However, an integrated approach that combines many hydro-climatic and biophysical input variables into a single indicator to characterize drought severity in Ethiopia is still lacking. Balint et al. (Citation2013) attempted to develop a combined drought indicator using rainfall, temperature and vegetation condition-based indices for Kenya. The study showed the potential usefulness of combining drought indicators to identify drought conditions in Kenya. Sepulcre et al. (Citation2012) developed a combined drought indicator to detect agricultural drought in Europe. They followed a “cause and effect” relationship approach between the Standardized Precipitation Index (SPI), the anomalies of soil moisture and the anomalies of the fraction of Absorbed Photosynthetically Active Radiation (fAPAR). In this approach, the “cause and effect” relationship between the input variables was utilized to determine a classification scheme composed of three warning levels: “Watch,” “Warning,” and “Alert.” The results demonstrated the applicability and importance of combining drought indices in developing operational drought monitoring and early warning systems (Sepulcre et al. Citation2012). Another comparative study of three drought indices was carried out in the Yarra River catchment in Australia (Barua, Perera, and Ng Citation2009). It was reported that an aggregate drought index (ADI), which integrates hydro-climatic data, outperformed other indices in detecting historical drought events in the region. Other similar studies have been conducted in the United States, Europe, and other parts of the world (Sepulcre et al. Citation2012; Keyantash and Dracup Citation2004; Enenkel et al. Citation2016; Hao and AghaKouchak Citation2013; Xia et al. Citation2014; Hazaymeh and Hassan Citation2017; Svoboda, Hayes, and Wilhite Citation2001; Bijaber et al. Citation2018). A majority of the studies support the potential usefulness of combined drought indicators for developing more integrated drought monitoring and early warning systems. Bayissa et al. (Citation2015) recently conducted a remote sensing study based on meteorological drought monitoring for the Upper Blue Nile Basin in Ethiopia using the Climate Hazards Group InfraRed Precipitation with Stations (CHIRPS) rainfall product. The main focus of the study was to identify the best satellite rainfall product and to leverage its application in meteorological drought monitoring. However, no effort was made to combine several hydro-climatic variables into a single drought indicator in their study.
Combining traditional climate and satellite-based drought indices could help in producing a simple and more comprehensive picture of drought, which can then be used to identify the intensity and spatial distribution of meteorological, agricultural and hydrological droughts. However, an effective integration of these indices requires identifying the contribution of each indicator. Different approaches can be applied to combine these variables, including expert judgment (subjective approach) and statistical (objective approach) (e.g. PCA). In this study, we used an objective statistical approach using PCA. Principal component analyses have been applied in hydrologic and atmosphere science to distill the influential parameters in the observational data (Keyantash and Dracup Citation2004; Hidalgo, Piechota, and Dracup Citation2000; Barnston and Livezey Citation1987). The PCA approach can also be applied in developing a drought monitoring tool through the aggregation of several hydro-climatic input variables that represent all forms of drought (meteorological, hydrological, and agricultural) into a single drought indicator. For example, PCA based aggregate drought index was developed to monitor historic drought events for three climatic divisions in California (Keyantash and Dracup Citation2004). Other similar study was conducted in Yarra river catchment in Australia (Barua, Perera, and Ng Citation2009). These studies support the potential application of a PCA approach in aggregating several input variables into a single aggregate drought index.
Developing a robust drought monitoring tool that integrates several hydro-climatic variables is crucial in Ethiopia to mitigate drought impacts and resulting disasters (Bayissa Citation2018). The combined use of climatic and hydrologic input data has benefits for potential characterization of both meteorological and agricultural droughts. The main objective of this study was to develop a grid-based combined drought indicator for Ethiopia (CDI-E) by integrating satellite-based hydro-climatic variables (i.e., rainfall and land surface temperature) and agricultural variables (i.e., soil moisture and vegetation condition) using an objective approach to assigning weights to each input variable. The CDI-E model was developed for the main rainfall season locally called “Kiremt” (June–September) and the short rainfall season called “Belg” (February–May). The resulting CDI-E was evaluated using grid-based 3-month SPI and detrended cereal crop yield.
2. Study area
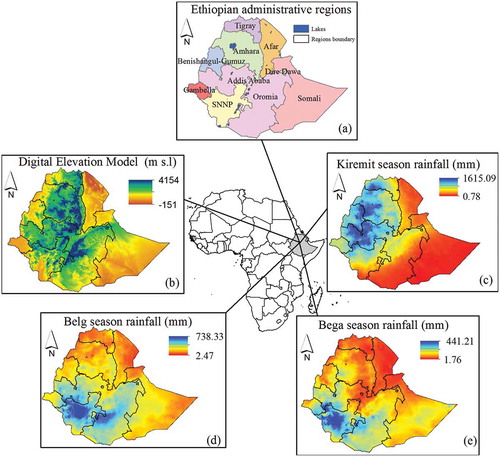
Ethiopia is located between 3°24´36´´ – 14°54´00´ N latitude, 32°59´24´´ – 47°58´48´´ E longitude, in the eastern part of Africa (). The country is divided into nine national regional states (Tigray, Afar, Amhara, Oromia, Somali, Benishangul-Gumuz, Southern Nations Nationalities and People Region (SNNPR), Gambella, and Harari) and two administrative states (Addis Ababa City Administration and Dire Dawa city council) (). The country is further divided into 72 administrative zones with areas ranging from 300 km2 (Hareri zone) to 45,000 km2 (Bale zone) (GeoHive Citation2014). The elevation varies from 150 m below sea level in Afar regions (Danakil depression) to 4150 m above sea level (a.s.l) in the Ethiopian highlands (). The country experiences three climatological rainfall seasons: Kiremt (June–September), Belg (February–May) and Bega (October–January) (Korecha and Barnston Citation2007; Shanko and Camberlin Citation1998; Sileshi and Demarée Citation1995; Gissila et al. Citation2004). Kiremt is the main rainfall season, accounting for 50–80% of annual rainfall and covering most of the country (Korecha and Barnston Citation2007; Gissila et al. Citation2004). The annual water budget and agricultural production are highly dependent on the amount and distribution of Kiremt rainfall. The failure of Kiremt rainfall often leads to devastating drought and an inability to meet the annual water demand of many sectors in Ethiopia. Belg is a short rainfall season that covers the southern and southeastern parts of the country. These areas are inhabited largely by pastoralists whose livelihoods depend on the water harvested during Belg rainfall season (Fekadu Citation2015). Bega is the dry season, except for rain in the southern part of the country during October, November, and December (OND). The north-south movement of the intertropical convergence zone (ITCZ) modulated by seasonal changes of large-scale circulation controls the rainfall climatology in Ethiopia. Kiremt rainfall mainly covers Tigray, Amhara, and West Oromia regions and some parts of the northern SNNP and East Oromia (). Belg and Bega season rainfall covers mainly the SNNP and South Oromia regions, as well as small areas in the central and other regions (). The Afar and Somali regions get less annual rainfall than other regions. Based on the elevation, there are three different climatic divisions (zones) in Ethiopia. These climatic zones are the Kolla (Tropical zone, elevation < 1830 m), Woina Dega (subtropical zone, elevation ranges between 1830-2440 m), and Dega (cool zone, elevation >2440 m). The average annual temperatures for Kolla, Woina Dega, and Dega are 27, 22, and 16 degree Celsius respectively (Fikadu 2015).
Figure 1. Ethiopian administrative regions (a), topography (b) and seasonal rainfall distribution of Kiremt (c), Belg (d) and Bega (e). Note: seasonal rainfall is calculated using long-term CHIRPS rainfall data from 1983 to 2015.
3. Materials and methods
3.1. Data used to develop CDI-E
Four input parameters were chosen to develop an objective based CDI-E. These parameters were the Climate Hazards Group InfraRed Precipitation with Stations (CHIRPS) rainfall, land surface temperature (LST), soil moisture (SM) and the Standardized Normalized Difference Vegetation Index (stdNDVI). A description of each dataset is presented in the following sections.
3.1.1. CHIRPS rainfall
The CHIRPS satellite rainfall product is used to represent the meteorological components of drought. CHIRPS was developed by the U.S. Geological Survey (USGS) and the Climate Hazards Group at the University of California, Santa Barbara (UCSB). It is a blended product combining a pentadal precipitation climatology, quasi-global geostationary thermal infrared (TIR) satellite observations from the Climate Prediction Center and the National Climate Forecast System version 2 (CFSv2) (Saha et al. Citation2011), and in situ precipitation observations (Funk Citation2014). We used CHIRPS because of its high accuracy and best performance in Ethiopia (Bayissa et al. Citation2017). Additionally, CHIRPS data have relatively higher spatial resolution (~5 km) and longer periods of records (1982-present) than other products. For example, the Tropical Rainfall Measuring Mission (TRMM) products have relatively coarse spatial resolution (~27 km) and relatively shorter record length (1998–present). The monthly time series data of CHIRPS rainfall were acquired for the period 2001–2015. However, to maintain the seasonal (longer time) effect of rainfall on vegetation, a 3-month SPI (SPI-3) was calculated using the long-term monthly time series data (1982–2015).
3.1.2. Land surface temperature
Land Surface Temperature (LST) is an important variable in the surface-atmosphere interaction that plays an important role in controlling evapotranspiration and eventually extreme events such as drought. Integrating LST in drought monitoring provides useful information for better characterizing and monitoring drought (Sruthi and Aslam Citation2015). Moderate Resolution Imaging Spectroradiometer (MODIS level 3 product) Terra LST data (MOD11B3) were used in this study. The LST data were obtained from Land Processes Distributed Active Archive Center (LA DAAC) at a spatial resolution of ~5 km and monthly temporal resolution for the period from 2001 to 2015.
3.1.3. Soil moisture
In this study, the NOAH soil moisture (SM) model was used to account for the readily available water at the plant root zone level. NOAH is a land surface model that simulates soil moisture for the middle of four soil layers: 0–10, 10–40, 40–100, and 100–200 cm. The soil moisture at a depth of 25 cm (middle of 10-40 cm) was considered in this study since cultivated land (root depth: 40 to 100 cm) is the dominant land use type in the majority of Ethiopia (TECSULT Citation2004). The accuracy of the NOAH soil moisture was tested using soil moisture observations from seven observational networks in the United States (Xia Citation2015). It was reported that NOAH captured the seasonal variation of soil moisture in the majority of states. The time series values of NOAH soil moisture were obtained from the Early Warning Systems Network (FEWS NET) Land Data Assimilation System (FLDAS) (USGS Citation2013; McNally et al. Citation2017). The monthly time series data at a spatial resolution of ~10 km × 10 km were considered for the period from 2001 to 2015. The anomaly of the soil moisture was calculated using the Z-Score technique to maintain similar drought categories with the other drought indices considered in this study.
3.1.4. Normalized difference vegetation index (NDVI)
NDVI is used to monitor vegetation condition by measuring the density of chlorophyll contents of the vegetation cover (Sepulcre et al. Citation2012; Yagci, Di, and Deng Citation2015; Mondal et al. Citation2017). It has a wide application in developing drought monitoring systems since it reflects the collective effects of water stress during the growing period of plants. The time series values of NDVI data were obtained from the USGS Earth Resources Observation and Science (EROS) Center for the period from 2001 to 2015 (USGS Citation2013). The spatial and temporal resolutions of the data were 250 m × 250 m and at dekadal time scale. The monthly values of e-MODIS NDVI data were calculated by taking the mean value of the dekads in a given month.
3.2. Data used for validation of CDI-E
3.2.1. Using gridded rainfall
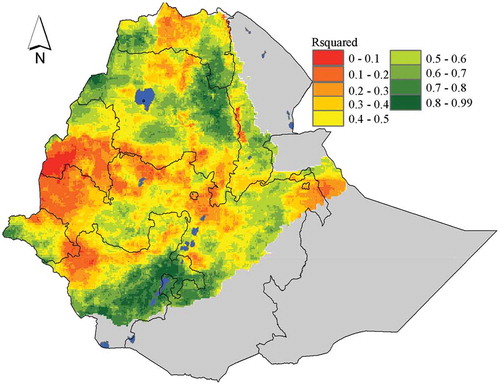
In this study, we used an independent dekadal gridded (~4 km × 4 km) rainfall data set to evaluate CDI-E. The data were obtained from the National Meteorological Agency (NMA) of Ethiopia for the period from 1983 to 2014 (Dinku et al. Citation2008). This data was developed through a joint partnership between the NMA, the International Research Institute for Climate and Society (IRI), and the University of Reading (UoR) under the Enhancing National Climate Services (ENACTSS) project (Dinku et al. Citation2008). This gridded dataset (ENACTS rainfall) merges rainfall data from more than 600 rain gauge stations with a locally calibrated version of Tropical Applications of Meteorology Using Satellite Data and Ground-Based Observations (TAMSAT). The evaluation of the ENACTS data using independent weather stations data in Ethiopia showed that the product has a better quality than the available data including CHIRPS (Dinku et al. Citation2014). However, the ENACTS data is not operationally available. ENACTS is compared with CHIRPS and the resulting coefficient of determination (r2) map is shown in . In general, these two products are independent to each other and show weak correlation in several parts of the country.
Figure 2. The coefficient of determination (r2) map between ENACTS and CHIRPS rainfall products for Kiremt (June – September) season.
3.2.2. Using crop yield data
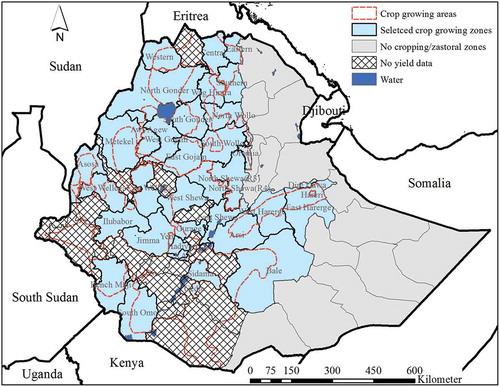
The crop yield data were obtained from the Central Statistical Agency (CSA) of Ethiopia. The data were in administrative zonal scale, and the spatial distribution of each administrative zone is shown in . CSA uses a standard statistical data collection and analysis approach to estimate crop production for each administrative zone (CSA Citation2014). In this study, cereal crops (i.e., teff, barley, sorghum, wheat, and maize) were considered and used to evaluate CDI-E. Cereals are major food and principal staple crops in terms of area planted and volume of production (CSA Citation2014; Tadesse et al. Citation2015). The crop yield data collected during the main rainfall season (Kiremt) represent 90–95% of the annual total crop production in Ethiopia (FEWSNET Citation2003). Crop yield data for 36 administrative zones were used in this study for the period 2001 to 2015. However, three years of data (2002, 2009, and 2012) were missing and therefore discarded. Since all zones are not crop growing areas, only 36 zones (out of a total of 68 zones in Ethiopia) that are crop producing were selected for comparison with crop yield. The crop growing area map was obtained from USGS/FEWSNET.
Figure 3. The spatial locations of selected crop growing zones (light blue). The red broken line shows the crop growing area of each crop growing zone (adapted from Tadesse et al. Citation2015).
4. Methods
In this study, four input variables were used (i.e., CHIRPS based 3-month SPI, LST, soil moisture and NDVI) to develop PCA based CDI-E for two main rainfall seasons (Kiremt and Belg). Each input variable has different spatial resolution that ranges from finer, 250 m (NDVI) to coarser, 10 km (soil moisture) resolution. The data pre-processing that mainly aimed the resampling of the input variables into the same pixel size (1 km × 1 km) were carried out using the Inverse Distance Weighted (IDW) technique. The IDW is widely used technique that gives a better representation of a variable over the heterogeneous topographic terrain because of the inverse proportionality with distance (Bayissa et al. Citation2015). Resampling coarser resolution input variables into the finer resolutions implicitly assumes a homogenous spatial distribution within the original grid-cell values. The CDI-E has a spatial resolution of 1 km × 1 km. Next, the anomalies of the four input variables were calculated and used in the determination and computation of the percentage contribution within the CDI-E. The details of the other methods followed in this study are described in the subsequent sections.
4.1. Developing CDI-E using PCA
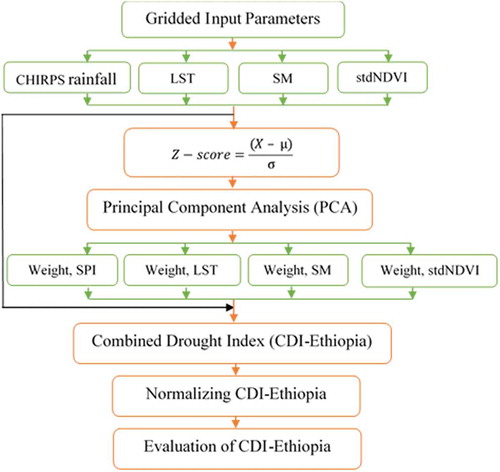
In this study, a PCA-based combined drought indicator (CDI-E) was developed to monitor drought in Ethiopia using satellite-based input parameters that include CHIRPS rainfall, LST, soil moisture, and stdNDVI monthly data from 2001 to 2015. These variables represent climatic (rainfall and LST) and agricultural (soil moisture and NDVI) components. Since rainfed agriculture is sensitive to the seasonal variability of the climatic components, integrating multiple variables representing different climatic and agricultural components may provide useful information with a more complete view of drought conditions for more robust agricultural drought monitoring and early warning (Sepulcre et al. Citation2012). An objective approach was followed in order to quantify the contribution of each input parameter in the process of developing CDI-E. The contribution of each input parameter, which is used as the weight/coefficient, was estimated using a PCA-based approach for each month. A similar method (i.e., PCA approach) was used in other areas/countries/basins to develop a CDI-based drought monitoring system (Balint et al. Citation2013; Sepulcre et al. Citation2012; Barua, Perera, and Ng Citation2009; Keyantash and Dracup Citation2004). summarizes the method followed in this study. The grid value of each input parameter was standardized to avoid any problems with different units of measurement and to enhance the spatial comparison of each parameter. The standardization process (Z-score) involves the use of long-term mean and standard deviation of each parameter, as shown in equation 1. The values of the Z-score of each input variable are similar in scale with CDI-E, and we adopted similar drought categories, as shown in .
Table 1. The average variability accommodated in the first principal axis for each month. The average value was derived by averaging the pixel values over all of Ethiopia.
Table 2. CDI-E drought classification based on SPI (McKee, Doesken, and Kleist (Citation1993)).
Figure 4. The workflow and summary of the method used in this study.
where X is the value of a particular event
µ is the long-term mean
σ is the long-term standard deviation
The computation of the principal components involves constructing a square (p × p, where p is the number of input parameters) symmetric correlation coefficient matrix for each grid (total of ~ 45,839). Accordingly, a 4 × 4 correlation coefficient matrix was developed using the standardized time-series values of the four input parameters. This matrix was used to compute the eigenvectors that were eventually used to transform the input variables into different orthogonal principal components (PCs) (equivalent to the number of the input parameters – four in this case). The eigenvectors are unit vectors that establish the relationship between the principal components and the original data. The PCs are orthogonal vectors, and it is impossible to combine them into a single vector by applying mathematical expressions (Keyantash and Dracup Citation2004). Thus, the first principal component axis (PC1) that accommodates the larger variability of the input data analyzed in this study was used to develop CDI-E (Keyantash and Dracup Citation2004). shows the average variability accommodated in the first principal axis for each month in Ethiopia. The values show the pixel averages over the entire country. The highest variance is shown in March (60%) and the lowest variance is observed in September (46%). The values of the variance obtained in this study were comparable with the result reported in the previous studies by Keyantash and Dracup (Citation2004), and Barua, Perera, and Ng (Citation2009). Thus, the eigenvector along the first principal axis is the base to derive the percentage contribution that was used as a weight to combine the four variables into a single combined index. The percentage contribution of each variable was estimated by taking the squared value of the eigenvectors, and was used as a weight to develop CDI-E. The weights are different values at each 1 km grid cell and each month based on the historical values of each input variable at each grid. The main advantage of considering the percentage contribution is to minimize some of the peak or spike values observed in the process of developing CDI-E. This resulted in a total of 48 different weight/coefficient maps, one for each month and each input parameter (12 × 4 = 48).
Equation 2 shows the mathematical representation of CDI-E and represents the general form in establishing the relationship between the percentage contributions and the original data.
where Z is the n × p matrix of principal components, X is the n × p matrix of standardized observational data, and E is the p × p matrix of eigenvectors (percentage contributions).
Equation 3 shows the other form of Equation 2, and the weight of each parameter is used to combine the standardized values of the four input variables and for each grid.
where z and i are the year (2001 to 2015) and month (January to December), respectively.
CDIZ, i is the combined drought indicator for a particular year and month.
wpcp, wLST, wSM, and wNDVI are the weights (percentage contribution) derived based on the Z-score values of CHIRPS rainfall, LST, SM and NDVI, respectively.
PCP is Z-score values of CHIRPS rainfall.
LST is Z-score values of the land surface temperature.
SM is Z-score values of soil moisture.
NDVI is Z-score values of Normalized Difference Vegetation Index.
The CDI values were normalized by its standard deviation since CDI at the first PC (PC1) was considered in this study (Equation 4). The normalization is required to avoid a higher jump in the time series values of CDI posed by the month that possesses a higher degree of variability.
where stdCDIz,i is the normalized CDI value for month i in year z,
CDIZ,i is the combined drought indicator at the first PC of year z for month, i
σi is the standard deviation of CDIZ,i over all year for month i.
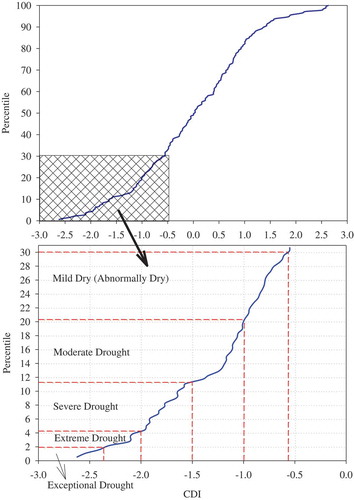
The threshold of CDI-E was determined based on McKee classifications of SPI drought categories () that were developed for stations across Colorado in the United States (McKee, Doesken, and Kleist Citation1993; WMO Citation2012). According to McKee, mild drought occurs 24% of the time, moderate drought occurs 9.2% of the time, severe drought occurs 4.4% of the time, and extreme drought occurs 2.3% of the time. The percentile and drought categories may vary from one climatic region to another. For example, Keyantash and Dracup (Citation2004) developed a different drought classification that corresponds to the 2.3th, 6.7th, 16.0th and 84th percentiles for the aggregated drought index for California. In this study, we developed a percentile ranking through constructing cumulative distribution of the time series of CDI-E across Kiremt regions in Ethiopia, as shown in . The percentile at the corresponding drought categories of CDI-E is shown in .
Figure 5. Percentile ranking and the corresponding drought category values, based on the SPI.
4.2. Spatial and temporal assessment of drought
The time-series values of CDI-E were evaluated to determine the index’s ability to capture the spatial and temporal patterns of agricultural drought in Ethiopia. The drought categories developed by McKee, Doesken, and Kleist (Citation1993) were adapted to classify CDI-E into eight drought categories () that correspond to different ranges of percentiles. The spatial drought patterns were assessed for the Kiremt and Belg rainfall regions in Ethiopia. These two rainfall regions were selected to demonstrate the utility of the CDI-E for two reasons. First, these regions cover the majority of Ethiopia, except for the Afar and Somalia regions where the amount of annual rainfall is minimal and agriculture is a less dominant practice when compared to the other regions of Ethiopia (Fekadu Citation2015). Secondly, more than 95% of the country’s agricultural products are produced in these regions, and the regions are characterized by heterogeneous topography. Rainfall above 200 mm was used as one of the criteria to delineate regions that are getting rainfall during these seasons. This threshold value was adapted to account for the pastoral areas in the eastern and southern parts of the country that are often affected by historic drought. Moreover, we referred to and adapted previously delineated rainfall regions from other studies. For example, the Belg rainfall-receiving region delineated by Rosell and Holmer (Citation2007) was used to fix the threshold values (200 mm). The spatial patterns of CDI-E were compared with the food-security map for the most recent drought in 2015.
4.3. Evaluation of CDI-E with other observed variables
CDI-E was evaluated using two independent datasets (i.e., ENACTS-based 3-month SPI and cereals crop yield) for both the Kiremt and Belg seasons. The rainfall seasons covered different parts of the country where crop production was a predominant practice. The SPI value was calculated for each grid (0.04° × 0.04°) using the ENACTS rainfall data for 1983–2014. However, the gridded SPI values for 2001–2014 were used to generate the spatial correlation coefficient maps for Kiremt and Belg rainfall seasons. The correlation coefficient measures how well CDI-E corresponds with the ENACTS-based 3-month SPI. In this study, a 3-month SPI was considered because it is comparable to the agricultural drought indices, as indicated by other studies (Narasimhan and Srinivasan Citation2005; Sepulcre et al. Citation2012; Trambauer et al. Citation2014).
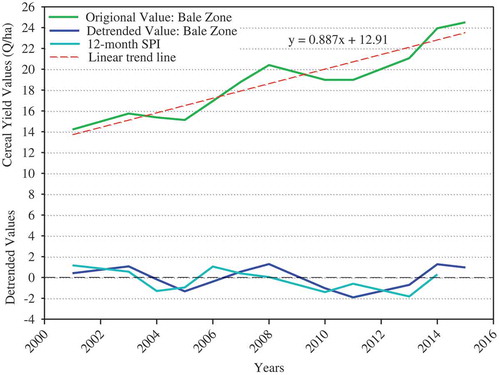
Crop yield data were used to evaluate CDI-E. Five major cereals (teff, barley, sorghum, wheat, and maize) were used to investigate the relationship between crop yield and CDI-E. These cereals account for 29% of the agricultural gross domestic product (GDP) and 64% of calories consumed (14% of total GDP) in 2005/06 (Taffesse, Dorosh, and Gemessa Citation2011).The crop yield data that correspond to each administrative zone are calculated by taking the ratio of the crop production (Quintal) to the total cultivable land (hectare). The annual crop yield depends not only on pseudo-cyclic patterns of climate but also on other factors such as technology advancement and management trends, policy changes that affect management decisions, and so forth (FAO Citation1999). In this study, however, the evaluation of CDI-E using crop yield data is focused mainly on the effect of climate on crop yield. Hence, the upward linear trend as a result of other factors has been eliminated from the time series of crop yield. The process of removing the upward linear trend is called detrending. Details about the detrending process can be found in Tadesse et al. (Citation2015), Tadesse et al. (Citation2017), and FAO (Citation1999). Accordingly, crop yield data for the 36 selected zones were detrended (MathWorks Citation2009), and the time series plot obtained for Bale zone is shown in . The spatial correlation coefficient map was generated between the detrended crop and CDI-E for each month within the main rainfall season (June to September). However, the vegetation condition reaches its maximum during September in most areas, and hence the time series values of CDI-E for September were correlated with the annual crop yield data. A grid-to-zonal scale correlation coefficient map was generated to identify the relationship between CDI-E and cereal crop yield.
Figure 6. Crop yield pattern before (green line) and after (blue line) detrending, and 12-month SPI for Bale Zone. The data in the year 2002, 2009, and 2012 are missing.
5. Results and discussions
5.1. Contribution of input parameters
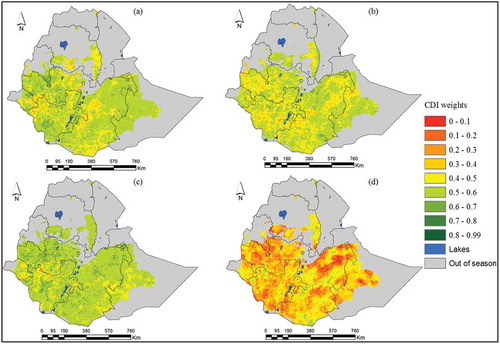
shows the pixel-based weight/coefficient of each input parameter during Kiremt ()) and Belg ()) rainfall seasons. The average values of the weights/coefficients for each grid cell were developed by averaging the weights for each rainfall season. The result shows relatively lower weights assigned to soil moisture (compared to other input parameters) for the Kiremt and Belg seasons in most areas. This indicate that soil moisture correlates less with the other input data and needs further investigation. Relatively higher weights were assigned for SPI, LST, and stdNDVI. Hence, the contribution of these three parameters was relatively significant and dominant in developing CDI-E. further shows that the central parts toward the east were assigned relatively larger weights of LST, stdNDVI, and SPI and smaller weights of SM during Kiremt and Belg seasons. Analyzing the contribution of each input parameter helps to identify the influential parameters in the process of developing the CDI-E.
Figure 7a. The spatial patterns of weights/coefficients for (a) LST, (b) stdNDVI, (c) SPI and (d) SM during the main rainy season (Kiremt).
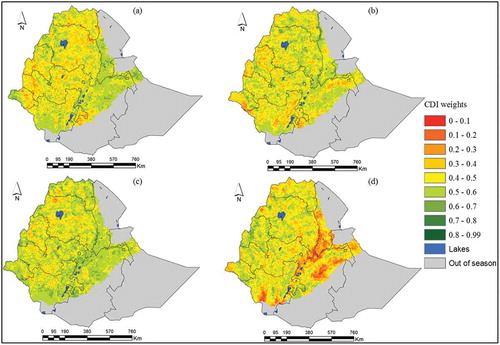
Figure 7b. The spatial patterns of weights/coefficients for (a) LST, (b) stdNDVI, (c) SPI and (d) SM during Belg season.
5.2. Spatial drought assessment using CDI-E
The time series values of CDI-E were calculated for each grid cell for the period 2001 to 2015. The results obtained for selected wet (2006) and drought (2009 and 2015) years, for both the Kiremt and Belg rainfall seasons, are discussed in the following sections. Both 2009 and 2015 were noted for severe drought that was relatively widespread across many parts of Ethiopia.
5.2.1. Kiremt season
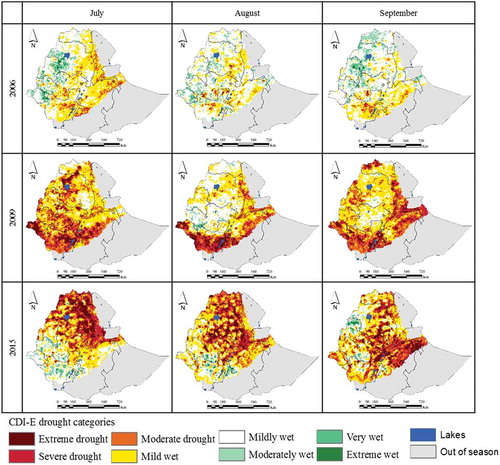
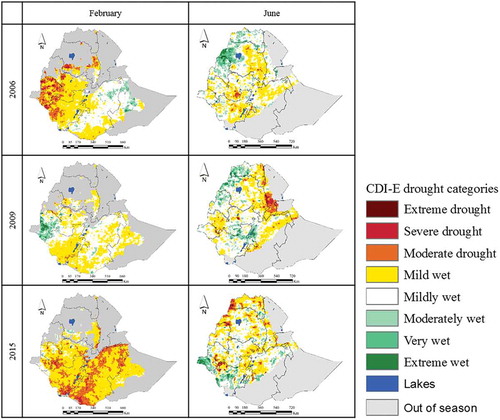
shows the spatial extents of drought for regions that are receiving Kiremt rainfall. In 2006, mildly wet to extremely wet conditions were observed in many areas, except for some small localized pockets in the eastern and southern parts that revealed severe drought conditions. For the years of 2009 and 2015, severe drought conditions were observed and the CDI clearly depicted those conditions in the time series of CDI maps in . shows the percent area of Kiremt rainfall-receiving regions experiencing moderate to extreme drought conditions during July, August, and September for the selected drought and wet years. In 2006, moderate to severe drought conditions affected 3–8% of the total area. However, more than 92% of the total area showed normal conditions in 2006. The affected area was significant during the selected drought years. In 2015, for example, 41–45% of the total area was affected by moderate to extreme drought conditions. Similar results were observed during 2009 (29–49%) except for a relatively minimum value (29%) in August. This decrease of the drought area is possibly because of the heavy precipitation during August 2009 over the western and northern highlands of Ethiopia. However, the deficiency of rainfall as compared to normal continued in September 2009 that prolonged the drought condition. Kiremt rainfall often begins in mid-June, so a well-developed drought condition was not observed in this month in 2009 and 2015 (Appendix 1). The east and northeast parts were historically associated with drought and the CDI-E indicated the severity of drought in these regions.
Table 3. The area affected (%) by moderate to extreme drought conditions for July, August and September.
Figure 8. The spatial extent of drought as indicated by the CDI-E during the Kiremt season (July- September) for selected wet (2006) and drought (2009 and 2015) years.
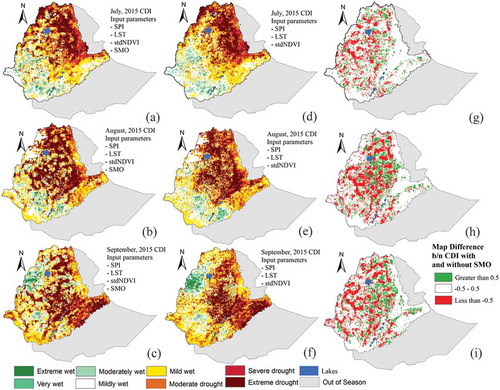
The sensitivity analysis of the soil moisture (relatively less contributing variables in CDI-E) is conducted to assess its contribution in developing CDI-E. CDI-E with and without considering the soil moisture as an input for the months of July, August, and September 2015 is shown in Appendix 2. The three figures in the left side (a-c) show the CDI-E using soil moisture as one of the input variable, whereas the figures in the middle column (d-f) show the CDI-E without soil moisture. The figures in the extreme right column (g-i) show the difference maps of CDI-E with and without considering the soil moisture. The difference maps show the impact of the soil moisture in the western part of Ethiopia. This also confirms the importance of additional inputs (in this case, the soil moisture) to get a comprehensive information on drought.
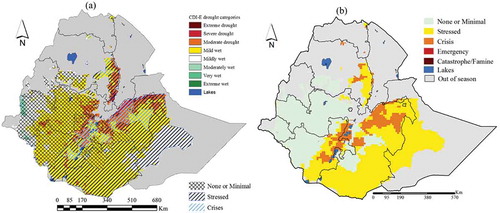
The CDI-E output maps for the Kiremt rainfall season in 2015 were compared with the food-insecurity situation map obtained from USAID and the Famine Early Warning Systems Network (FEWSNET). shows food-secure and insecure regions in 2015. According to FEWS (FEWSNET Citation2015), the eastern, northern, northeastern, and southern regions were highly food-insecure in 2015. The shortfall (below average) and late starting date of the main rainfall season (as a result of the El Niño) were the main causes for the food-insecurity in Ethiopia that year (Keyantash and Dracup Citation2004). Visual comparison of the CDI-E and food-security maps shows strong spatial agreement between the core drought areas in the CDI and the reported food-insecure regions.
Figure 9. Average CDI-E for July to September 2015 (a) and food-security situation for July to September 2015 (b) according to USAID and the Famine Early Warning Systems Network (FEWSNET Citation2015). The average CDI-E map (a) is masked with the food-security status.
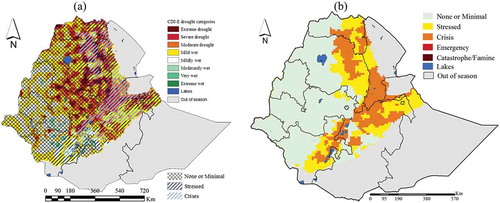
The average values of the CDI-E for the referenced food-secure status regions of FEWSNET were extracted to assess the drought severity ranges in these regions. shows the average CDI-E values for three categories of food-security status during the Kiremt season in 2015. The results show that relatively minimum negative CDI-E values (reflecting drought conditions) were observed during “crisis” compared to “stress” and “minimal” food-security status regions. According to the Integrated Food Security (IPC) Phase 3 report (IPC Citation2016), most of the Amhara, Oromia, and SNNPR regions were under a “crisis” food-security condition, as 75% of the crop production was lost in the Kiremt season. This indicates a strong linkage between drought and food-security in Ethiopia. Drought poses a more significant threat to staple crops than any other factors. Hence, the CDI-E can potentially be used to monitor and provide early warning in identifying food-insecure regions, helping decision makers to trigger action in terms of planning for future drought and mitigating its adverse impact on crop yields.
Table 4. CDI-E values for different categories of food security status during the Kiremt season (June–September) in 2015.
5.2.2. Belg season
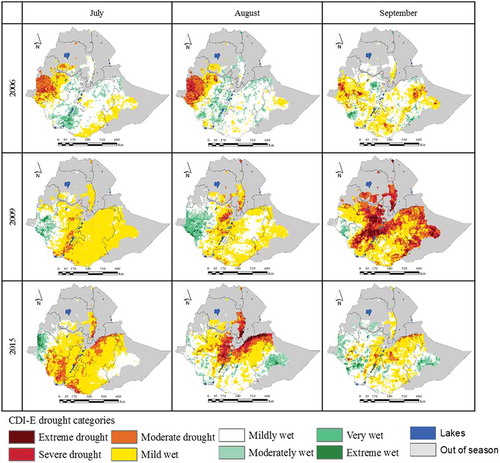
The results obtained for the Belg rainy season are shown in . The southern and southwestern parts of the country received an excess amount of rainfall, while the central and eastern parts received lesser amounts of rainfall during this season (). In 2006, mild to extreme wet conditions were observed in the central, southern and eastern parts of the country, whereas severe drought was indicated in the western part. Overall, a dry bias was observed in Belg during this year as compared to Kiremt during the same year. The severity of the drought during 2009 and 2015 was indicated in April and May in the central and eastern parts of Ethiopia. In general, mild wet to extreme wet conditions dominated in these years. This result supports the wetter condition in the Belg season when compared to the drought conditions that occurred during the Kiremt season. El Niño perturbed the reduction of the Kiremt rainfall, whereas wetter conditions persisted during the Belg rainfall season (Gleixner Citation2016).
Figure 10. The spatial extent of drought as indicated by CDI-E during the Belg season (March–May) for the selected wet (2006) and drought (2009 and 2015) years. The CDI-E maps for the month February can be referred from appendix 1.
CDI-E and food-security status maps were compared to identify similarities and/or differences between the two maps during the Belg season in 2015. A similar approach was followed for the Kiremt season. A similar pattern was observed between CDI-E and food-security status maps during the Belg season. A severe drought occurred in the central and eastern part of the country, which supported the reported “crisis” food-secure status in the same regions, as shown in . However, there is a disagreement between the CDI-E and food-security status in the southeastern part of the Belg rainfall region in Ethiopia. In this region, CDI-E depicted wet to extreme wet conditions while the food-security status was categorized as being under “stress” condition.
Figure 11. Average CDI-E for April to June 2015 (a) and food-security situation for April to June 2015 (b) according to USAID and the Famine Early Warning Systems Network (FEWSNET Citation2015). The average CDI-E map (a) is masked with the food-security status.
shows the average CDI values at the corresponding food-security status area for Belg season. Similar results were observed as of Kiremt season that shows the severity of drought in crises food-security status area.
Table 5. CDI-E values for different categories of food security status during the Belg season (February–May) in 2015.
5.3. Evaluation of CDI-E
5.3.1. Using grid-based SPI
The CDI-E was validated with a grid-based SPI that was developed using ENACTS rainfall. The evaluation was carried out for Kiremt and Belg rainfall seasons for the years 2001 to 2014. The resulting correlation coefficient maps are shown in . Good agreement between CDI-E and ENACTS-based 3-month SPI was obtained over most of Ethiopia with a correlation coefficient r greater than 0.6. During the Kiremt season (), a slightly lower correlation coefficient (r > 0.5) was observed with a weak correlation coefficient (r < 0.5) in some localized areas in the western, central and northeast parts of the country. For the Belg season (), a good correlation coefficient (r > 0.5) was observed in almost all areas except for a small area in the southwestern part that showed weak correlation (r < 0.5). The correlation coefficient results for both rainfall seasons revealed good agreement of CDI-E with ENACTS-based 3-month SPI in Ethiopia. The possible explanation for the good agreement between CDI-E and the SPI is that perhaps rainfall was more significant than other parameters in developing CDI-E in the majority of the growing zones. The strong correlation of CDI-E with SPI indicates the potential use of CDI-E for developing a drought monitoring and early warning system in Ethiopia.
Figure 12. The spatial correlation coefficient map produced during the Kiremt (a) and the Belg (b) seasons.
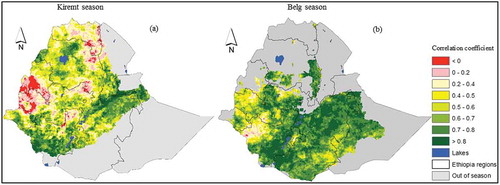
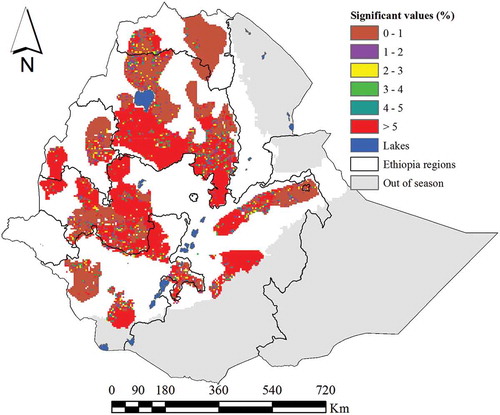
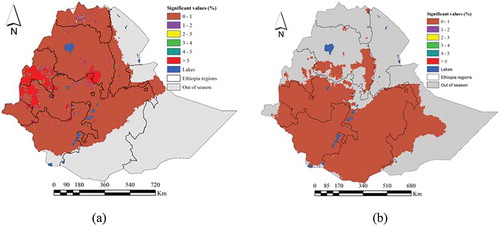
The significance of the correlation coefficient values of each grid at the corresponding significant level (0.05) were tested using t-test distribution. The resulting maps are shown in Appendix 3 for Kiremt and Belg seasons. The result shows the correlation coefficient values are statistically significant for both seasons except some pocket area in the western and central parts (lower correlation coefficient values) that showed statistically insignificant at 0.05 significant level during Kiremt season.
5.3.2. Using crop yield
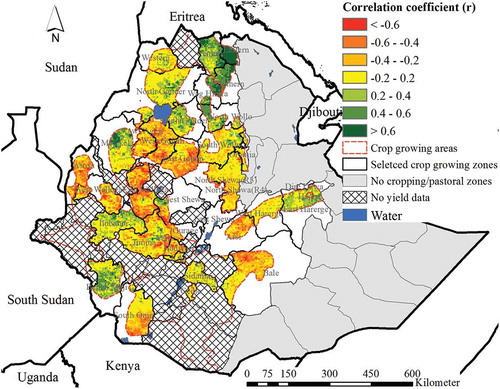
The spatial and temporal relationships between the detrended crop yield and CDI-E were investigated using a correlation coefficient analysis. Year-to-year comparisons were first carried out using crop yields and the CDI-E values of all selected zones together to assess the applicability of a one-size-fits-all CDI for the zones, collectively. The analysis showed that weak correlation coefficient values (r < 0.3) were obtained for year-to-year comparison, which indicates the inapplicability of the CDI for collective zones. shows the spatial correlation coefficient values between the CDI-E and the detrended cereal crop yield for the 36 selected crop growing zones for the main rainfall season (June-September). The CDI-E at the end month of the Kiremt rainfall season (September) was used to correlate with the cereal crop yield. The vegetation cover reaches its maximum during this month in the majority of the study area during this period (Daba and Oromia Citation2016). The crop growing areas that were identified by USGS (FEWSNET Citation2015) for each crop growing zone were used to produce the correlation coefficient map. Generally, higher correlation coefficient values (r > 0.5) were observed in the northern highlands and eastern and southwestern parts of the country. Lower correlation coefficient values (r < 0.5) were observed in the majority of the crop growing area. The spatial correlation coefficient pattern obtained in this study is consistent with the pattern noted in Tadesse et al. (Citation2015), which attempted to evaluate evapotranspiration products with cereal crop yield. In both studies, a higher correlation (r > 0.5) was obtained in the northern and central regions whereas lower correlations (r < 0.5) were observed in the southern and eastern parts of the country. However, there is disagreement in the northwest and central parts; lower correlation (r < 0.5) is reported in this study whereas a relatively higher correlation was reported in the previous study by Tadesse et al. (Citation2015). In general, the CDI-E has a lower correlation with the detrended crop yield anomalies in the majority of crop growing areas. There are several possible reasons for this, and some of them might be associated with the shorter data length (13 years) used in developing the correlation coefficient map. Moreover, the assumption of using the zonal crop yield data for each grid within the particular zone might affect the correlation coefficient values. The quality of the crop yield data also needs to be investigated in future studies.
Figure 13. The spatial correlation coefficients between CDI-E and detrended cereal crop yield in the crop growing areas.
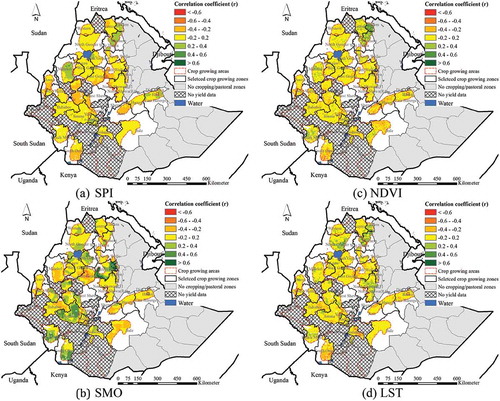
The correlation of the crop yield data with the input variables (i.e., SPI, NDVI, SMO, and LST) was analyzed to investigate its relationship with any of the input variables, and to assess any improvement of CDI-E as compared to the input variables. The resulting correlation coefficient maps shows (Appendix 4) the poor correlation of crop yield anomalies with the input variables in the majority of Ethiopia except some pocket area that shows a correlation coefficient values ranging between 0.5–0.98. This result indicates that each input variable has no skill to predict the crop yield and thus CDI-E is not expected to show a high performance in predicting crop yield anomalies.
The significance of the correlation coefficient values of CDI-E and crop yield was shown in Appendix 5. The result shows the significance of the correlation coefficient values at the corresponding locations of relatively higher correlation coefficient values, for example, in the northern, and central towards northwestern parts of the country at 0.05 significant level. The result further shows the insignificance of the correlation coefficient values at the locations of lower correlation coefficient values.
5.4. Limitations and future recommendations
In this study, the percentage contributions (weights) of the four input variables were estimated through decomposing the input variables into four linearly uncorrelated principal component axes. These principal axes are orthogonal vectors and mathematically impossible to combine into a single expression. Each axis accommodates certain degree of the variability in the input data. The first principal axis (PC1) accommodates the larger variability in the data, and the percentage contribution of each input variable corresponding to this axis (PC1) was considered in developing the combined drought index. However, this axis often accommodates the larger variability but not all the variability in the data set which can be considered as one of the main limitations of this study.
Because of lack of the long-term time series of some of the input variables (i.e., NDVI, and LST), the analysis period was restricted from 2001 to 2015. This might significantly affect the proper estimation of the long-term reference mean values that were used in standardizing each input variable.
6. Conclusion
In this study, a combined drought indicator for Ethiopia (CDI-E) was developed to monitor agricultural drought conditions. Four input variables representing climate (i.e., Standardized Precipitation Index (SPI), Land Surface Temperature (LST) anomaly), and hydrologic (Standardized Normalized Difference Vegetation Index (stdNDVI), and soil moisture (SM) anomaly) were combined to characterize agricultural drought in Ethiopia. Combining these parameters is crucial in terms of developing a single drought index that gives concise information that will facilitate the decision-making process. A qualitative numerical approach was used in assigning relative weight for each parameter using principal component analysis (PCA). The CDI-E was evaluated using the grid-based SPI for the Kiremt and Belg rainfall seasons in Ethiopia. The time series of the 3-month SPI values were calculated using an ENACTS rainfall product that blended station data with TAMSAT satellite rainfall. The CDI-E was also evaluated using cereal crop (i.e., teff, wheat, barley, maize, and sorghum) yield estimates during the main rainfall season (Kiremt) for the 36 selected crop growing zones in Ethiopia. The newly developed CDI-E generally mapped the spatial and temporal patterns of historic drought and non-drought years in Ethiopia. The results showed that moderate to severe droughts were detected by the CDI-E across the food scarce/insecure regions reported by FEWS NET both during the Kiremt and Belg rainfall seasons.
The seasonal CDI-E maps were also compared with the ENACTS-based 3-month SPI to investigate the spatial and temporal relationship and correspondence for each grid. The result showed a strong linkage between rainfall and CDI-E in the majority parts of the country. This offers an advantage for agricultural drought monitoring since the majority of crop production in Ethiopia were rainfed agricultural. The failure of seasonal rainfall is often the precursor for the occurrence of agricultural drought in Ethiopia. The comparison of CDI-E with the detrended crop yield anomaly showed a weaker correlation in the majority except for some zones located in the northern, eastern and southwestern parts of Ethiopia. Hence, CDI-E can be used in developing a drought forecasting model for Ethiopia to enhance preparedness for future drought and its associated impacts. In addition, CDI-E can be used to develop a crop prediction model for some crop growing zones in Ethiopia.
The results further indicate that the CDI-E can potentially be used to improve agricultural drought monitoring and early warning system in Ethiopia. In addition, local decision makers and non-governmental organizations could use the CDI-E model and products to identify food-insecure regions for actionable information and future drought planning to mitigate drought’s adverse impacts on human and socioeconomic sectors. Investigation of the potential usefulness of CDI-E at a finer temporal resolution (e.g. weekly) using additional input parameters (i.e., ground water, stream flow, lake level, evapotranspiration, etc.) and its evaluation with other ground observation data will be considered in future studies. The resulting PCA percentages indicate that research into other input variables and further improvement of the earth observation techniques to estimate the variable values is still needed to further improve drought monitoring.
Acknowledgements
The main concept of this manuscript was derived from the doctoral dissertation of the first author (Bayissa Citation2018). This research was financially supported by NASA Project NNX14AD30G. We are also indebted to the National Meteorological Agency (NMA) of Ethiopia for providing the long-term climate data. We acknowledge John Swigart of the NDMC for his contribution during PCA calculation, and Deborah Wood of the NDMC for her editorial comments.
Disclosure statement
No potential conflict of interest was reported by the authors.
Additional information
Funding
References
- Balint, Z., F.M. Mutua P. Muchiri and C.T. Omuto. 2013. “Monitoring Drought with the Combined Drought Index in Kenya.” In Developments in Earth Surface Processes, Elsevier, 16, pp. 341–356.
- Barnston, G., and R. E. Livezey. 1987. “Classification, Seasonality and Persistence of Low-Frequency Atmospheric Circulation Patterns.” Monthly Weather Review 115: 1083–1126. doi:10.1175/1520-0493(1987)115<1083:CSAPOL>2.0.CO;2.
- Barua, S., B. J. C. Perera, and A. W. M. Ng. 2009. “A Comparative Drought Assessment of Yarra River Catchment in Victoria, Australia.” In 18th World IMACS/MODSIM Congress, 13–17. Cairns, Australia.
- Bayissa, Y. 2018. “Developing an impact-based combined drought index for monitoring crop yield anomalies in the Upper Blue Nile Basin, Ethiopia.” Doctoral diss., Delft University of Technology, Delft, Netherlands.
- Bayissa, Y., A. Semu, X. Yunqing, A. Schalk Jan, M. Shreedhar, S. Dimitri, A. Griensven, and T. Tadesse. 2015. “Spatio-Temporal Assessment of Meteorological Drought under the Influence of Varying Record Length: The Case of Upper Blue Nile Basin, Ethiopia.” Hydrological Sciences Journal 60 (11): 1927–1942.
- Bayissa, Y., T. Tadesse, G. Demisse, and A. Shiferaw. 2017. “Evaluation of Satellite-Based Rainfall Estimates and Application to Monitor Meteorological Drought for the Upper Blue Nile Basin, Ethiopia.” Remote Sens 9 (7): 669. doi:10.3390/rs9070669.
- Berg, M., and G. Kumbi. 2006. “Poverty and the Rural Nonfarm Economy in Oromia, Ethiopia.” International Association of Agricultural Economists 35 (supplement): 469–475.
- Bewket, W., and D. Conway. 2007. “A Note on the Temporal and Spatial Variability of Rainfall in the Drought‐Prone Amhara Region of Ethiopia.” International Journal of Climatology 27: 1467–1477. doi:10.1002/(ISSN)1097-0088.
- Bijaber, N., D. El Hadani, M. Saidi, M. D. Svoboda, B. D. Wardlow, C. R. Hain, C. C. Poulsen, M. Yessef, and A. Rochdi. 2018. “Developing a Remotely Sensed Drought Monitoring Indicator for Morocco.” Geosciences 8 (2): 55. doi:10.3390/geosciences8020055.
- CSA. 2014. “Annual Agricultural Sample Survey. Addis Ababa, Central Statistical Agency of Ethiopia (CSA).” http://www.csa.gov.et/index.php/2013-02-20-13-43-35/2013-02-20-13-45-32/annual-agricultural-sample-survey
- Daba, M., and E. Oromia. 2016. “Studies on Temporal Relationship between Normalized Difference Vegetation Index and Rainfall in the Southern Part of Ethiopia.” Studies 6: 6.
- Dai, A. 2013. “Increasing Drought under Global Warming in Observations and Models.” Nature Climate Change 3 (1): 52–58. doi:10.1038/nclimate1633.
- Dinku, T., S. Chidzambwa, P. Ceccato, S. Connor, and C. Ropelewski. 2008. “Validation of High-Resolution Satellite Rainfall Products over Complex Terrain.” International Journal of Remote Sensing 29 (14): 4097–4110. doi:10.1080/01431160701772526.
- Dinku, T., K. Hailemariam, R. Maidment, E. Tarnavsky, and S. Connor. 2014. “Combined Use of Satellite Estimates and Rain Gauge Observations to Generate High-Quality Historical Rainfall Time Series over Ethiopia.” International Journal of Climatology 34: 2489–2504. doi:10.1002/joc.2014.34.issue-7.
- Edossa, C., S. Babel, and D. Gupta. 2009. “Drought Analysis in the Awash River Basin, Ethiopia.” Water Resources Management 24: 1441–1460. doi:10.1007/s11269-009-9508-0.
- Ellen, V., K. Diriba, and S. Asgeir. 2013. “Recent Drought and Precipitation Tendencies in Ethiopia.” Theoretical and Applied Climatology 112: 535–551. Author 1, A.B. Title of Thesis. Level of Thesis, Degree-Granting University, Location of University, Date of Completion. doi:10.1007/s00704-012-0746-3.
- Enenkel, M., C. Steiner, T. Mistelbauer, W. Dorigo, W. Wagner, L. See, C. Atzberger, S. Schneider, and E. Rogenhofer. 2016. “A Combined Satellite-Derived Drought Indicator to Support Humanitarian Aid Organizations.” Remote Sensing 8 (4): 340. doi:10.3390/rs8040340.
- FAO. 1999. “Production Variability and Losses.” In: R. Gommes, eds. Special: Agroclimatic Concepts. Sustainable Development Department (SD), Food Agriculture Organization of the United Nations (FAO). http://www.fao.org/nr/climpag/agroclim/losses_en.asp
- Fekadu, K. 2015. “Ethiopian Seasonal Rainfall Variability and Prediction Using Canonical Correlation Analysis (CCA).” Journal of Earth Science. doi:10.11648/j.earth.20150403.14.
- FEWSNET. 2003. “Estimating Meher Crop Production Using Rainfall in the ‘Long Cycle’region of Ethiopia, June 21, Revised October 6.” http://reliefweb.int/sites/reliefweb.int/files/resources/9EC256793FA1685C49256DB90003E3DC-fews-eth-06oct2.pdf
- FEWSNET. 2015. “Estimating Meher Crop Production Using Rainfall in the ‘Long Cycle’region of Ethiopia, June 21, Revised October 6.” http://reliefweb.int/sites/reliefweb.int/files/resources/9EC256793FA1685C49256DB90003E3DC-fews-eth-06oct2.pdf
- Funk, C., P. Peterson, M. Landsfeld, D. Pedreros, J. Verdin, J. Rowland, B. Romero, et al. 2014. “A Quasi-Global Precipitation Time Series for Drought Monitoring.” Accessed 20 February 2017. pubs.usgs.gov/ds/832/
- Gebregziabhera, S., A. Mouazena, H. Brusselb, H. Ramona, J. Nyssene, H. Verplanckeg, M. Behailue, J. Deckersf, and J. Baerdemaekera. 2006. “Animal Drawn Tillage, the Ethiopian Ard Plough, Maresha a Review.” Soil & Tillage Research 89: 129–143. doi:10.1016/j.still.2005.08.010.
- GeoHive. 2014. “Global Data, Ethiopia.” http://www.geohive.com/cntry/ethiopia.aspx
- Gissila, T., E. Black, D. I. F. Grimes, and J. M. Slingo. 2004. “Seasonal Forecasting of the Ethiopian Summer Rains.” International Journal of Climatology 24: 1345–1358. doi:10.1002/(ISSN)1097-0088.
- Gleixner, S., N. Keenlyside, E. Viste, and D. Korecha. 2016. “The El Niño Effect on Ethiopian Summer Rainfall.” Climate Dynamics 2016: 1–19.
- Hao, Z., and A. AghaKouchak. 2013. “Multivariate Standardized Drought Index: A Parametric Multi-Index Model.” Advances in Water Resources 57: 12–18. doi:10.1016/j.advwatres.2013.03.009.
- Hazaymeh, K., and Q. K. Hassan. 2017. “A Remote Sensing-Based Agricultural Drought Indicator and Its Implementation over A Semi-Arid Region, Jordan.” Journal of Arid Land 9 (3): 319–330. doi:10.1007/s40333-017-0014-6.
- Hidalgo, G., T. C. Piechota, and J. A. Dracup. 2000. “Alternative Principal Components Regression Procedures for Dendrohydrologic Reconstructions.” Water Resources Research 36: 3241–3249. doi:10.1029/2000WR900097.
- IPC. 2016. “Ethiopia Drought and Food Insecurity.” Accessed 04 April 2017. http://reliefweb.int/report/ethiopia/acaps-anticipatory-briefing-note-ethiopia-drought-and-food-insecurity
- Keyantash, J. A., and J. A. Dracup. 2004. “An Aggregate Drought Index: Assessing Drought Severity Based on Fluctuations in the Hydrologic Cycle and Surface Water Storage.” Water Resources Research 40: (W09304). doi:10.1029/2003WR002610.
- Kogan, F. N. 1979. “Global Drought Watch from Space.” Bulletin of the American Meteorological Society 78 (4): 621–636. Kogan, F. 1997. doi:10.1175/1520-0477(1997)078<0621:GDWFS>2.0.CO;2.
- Korecha, D., and A. G. Barnston. 2007. “Predictability of June–September Rainfall in Ethiopia.” Monthly Weather Review 135 (2): 628–650. doi:10.1175/MWR3304.1.
- MathWorks. 2009. MATLAB Neural Network Toolbox User’s Guide. Natick, MA: MathWorks.
- McKee, T. B., N. J. Doesken, and J. Kleist. 1993. “The Relationship of Drought Frequency and Duration to Time Scales.” In Proceedings of the 8th Conference on Applied Climatology, Anaheim, CA, 179–184.
- McNally, A., K. Arsenault, S. V. Kumar, S. Shukla, P. Peterson, S. Wang, C. Funk, C. D. Peters-Lidard, and J. P. Verdin. 2017. “A Land Data Assimilation System for sub-Saharan Africa Food and Water Security Applications.” Scientific Data 4. doi:10.1038/sdata.2017.
- Mishra, A. K., and V. P. Singh. 2010. “V.P. A Review of Drought Concepts.” Journal of Hydrology 391: 202–216. doi:10.1016/j.jhydrol.2010.07.012.
- Mondal, S., C. Jeganathan, G. Amarnath, and P. Pani. 2017. “Time-Series Cloud Noise Mapping and Reduction Algorithm for Improved Vegetation and Drought Monitoring.” GIScience & Remote Sensing 54 (2): 202–229. doi:10.1080/15481603.2017.1286726.
- Narasimhan, B., and R. Srinivasan. 2005. “Development and Evaluation of Soil Moisture Deficit Index (SMDI) and Evapotranspiration Deficit Index (ETDI) for Agricultural Drought Monitoring.” Agricultural and Forest Meteorology 133: 69–88. doi:10.1016/j.agrformet.2005.07.012.
- Padhee, S. K., B. R. Nikam, S. Dutta, and P. Aggarwal. 2017. “Using Satellite-Based Soil Moisture to Detect and Monitor Spatiotemporal Traces of Agricultural Drought over Bundelkhand Region of India.” GIScience & Remote Sensing 54 (2): 144–166. doi:10.1080/15481603.2017.1286725.
- Rojas, O., A. Vrieling, and F. Rembold. 2011. “Assessing Drought Probability for Agricultural Areas in Africa with Coarse Resolution Remote Sensing Imagery.” Remote Sensing of Environment 115 (2): 343–352. doi:10.1016/j.rse.2010.09.006.
- Rosell, S., and B. Holmer. 2007. “Rainfall Change and Its Implications for Belg Harvest in South Wollo, Ethiopia.” Geografiska Annaler: Series A, Physical Geography 89 (4): 287–299. doi:10.1111/j.1468-0459.2007.00327.x.
- Saha, S., S. Moorthi, H. Pan, X. Wu, J. Wang, S. Nadiga, P. Tripp, R. Kistler, J. Woollen, and D. Behringer. 2011. “The NCEP Climate Forecast System Reanalysis.” Bulletin of the American Meteorological Society 1: 1–146.
- Senay, G. B., N. M. Velpuri, S. Bohms, M. Budde, C. Young, J. Rowland, and J. P. Verdin. 2015. “Drought Monitoring and Assessment: Remote Sensing and Modeling Approaches for the Famine Early Warning Systems Network.” Hydro-Meteorological Hazards, Risks, and Disasters, 233–262.
- Sepulcre, G., S. M. A. F. Horion, A. Singleton, H. Carrao, and J. Vogt. 2012. “Development of a Combined Drought Indicator to Detect Agricultural Drought in Europe.” Natural Hazards and Earth System Sciences 12 (11): 3519–3531. doi:10.5194/nhess-12-3519-2012.
- Shanko, D., and P. Camberlin. 1998. “The Effect of the Southwest Indian Ocean Tropical Cyclones on Ethiopian Drought.” International Journal of Climatology 18: 1373–1378. doi:10.1002/(SICI)1097-0088(1998100)18:12<1373::AID-JOC313>3.0.CO;2-K.
- Sileshi, Y., and G. R. Demarée. 1995. “Rainfall Variability in the Ethiopian and Eritrean Highlands and Its Links with the Southern Oscillation Index.” Journal of Biogeography 22: 945–952. doi:10.2307/2845995.
- Sruthi, S., and M. M. Aslam. 2015. “Agricultural Drought Analysis Using the NDVI and Land Surface Temperature Data; a Case Study of Raichur District.” Aquatic Procedia 4: 1258–1264. doi:10.1016/j.aqpro.2015.02.164.
- Svoboda, M. D., M. J. Hayes, and D. A. Wilhite. 2001. “The Role of Integrated Drought Monitoring in Drought Mitigation Planning.” Annals of Arid Zone 40 (1): 1–11.
- Tadesse, T., C. Champagne, B. D. Wardlow, T. A. Hadwen, J. F. Brown, G. B. Demisse, Y. A. Bayissa, and A. M. Davidson. 2017. “Building the Vegetation Drought Response Index for Canada (Vegdri-Canada) to Monitor Agricultural Drought: First Results.” GIScience & Remote Sensing 54 (2): 230–257. doi:10.1080/15481603.2017.1286728.
- Tadesse, T., G. B. Senay, G. Berhan, T. Regassa, and S. Beyene. 2015. “Evaluating A Satellite-Based Seasonal Evapotranspiration Product and Identifying Its Relationship with Other Satellite-Derived Products and Crop Yield: A Case Study for Ethiopia.” International Journal of Applied Earth Observation and Geoinformation 40: 39–54. doi:10.1016/j.jag.2015.03.006.
- Taffesse, A., P. Dorosh, and S. Gemessa. 2011. “Crop Production in Ethiopia: Regional Patterns and Trends.” Food and Agriculture in Ethiopia: Progress and Policy Challenges 74: 53.
- Tagel, G., A. Van Der Veen, and B. Maathuis. 2011. “Spatial and Temporal Assessment of Drought in the Northern Highlands of Ethiopia.” International Journal of Applied Earth Observation and Geoinformation 13: 309–321. doi:10.1016/j.jag.2010.12.002.
- TECSULT. 2004. “Ethiopian Energy II Project. Woody Biomass Inventory and Strategic Planning Project (WBISPP) – Phase 2 – Terminal Report.” Ministry of Agriculture, Addis Ababa, Ethiopia.
- Trambauer, P., S. Maskey, M. Werner, F. Pappenberger, L. Van Beek, and S. Uhlenbrook. 2014. “Identification and Simulation of Space-Time Variability of past Hydrological Drought Events in the Limpopo River Basin, Southern Africa.” Hydrology and Earth System Sciences Discussions 11: 2639–2677. doi:10.5194/hessd-11-2639-2014.
- USGS. 2013. “e-MODIS NDVI and Soil Moisture (10-40 Cm).” Accessed 16 March 2017. https://earlywarning.usgs.gov/fews/search/Africa/East%20Africa
- Valliyodan, B. T., and H. T. Nguyen. 2006. “Understanding Regulatory Networks and Engineering for Enhanced Drought Tolerance in Plants.” Current Opinion in Plant Biology 9: 189–195. doi:10.1016/j.pbi.2006.01.019.
- WFP. 2016. “Drought In Ethiopia: 10 Million People In Need.” Accessed 04 April 2017. https://www.wfp.org/stories/drought-ethiopia-10-million-people-need
- Wilhite, A. 2000. “Drought as a Natural Hazard: Concepts and Definitions.” In: Drought: A Global Assessment, D. A. Wilhite, eds. 3–18. Vol. 1. London: Routledge.
- Wilhite, A., D. Svoboda, and J. Hayes. 2007. “Understanding the Complex Impacts of Drought: A Key to Enhancing Drought Mitigation and Preparedness.” Water Resources Management 21: 763–774. doi:10.1007/s11269-006-9076-5.
- Wilhite, D., and M. Buchanan-Smith. 2005. “Drought as Hazard: Understanding the Natural and Social Context.” In: Drought and Water Crises: Science, Technology, and Management Issues, D. A. Wilhite, eds. 3–29. Boca Raton, Florida: CRC Press.
- WMO. 2012. “Standardized Precipitation Index User Guide.” World Meteorological Organization, WMO-No. 1090.
- Wu, H., M. J. Hayes, D. A. Wilhite, and M. D. Svoboda. 2005. “The Effect of the Length of Record on the Standardized Precipitation Index Calculation.” International Journal of Climatology 25 (4): 505–520. doi:10.1002/(ISSN)1097-0088.
- Xia, Y., M. B. Ek, D. Mocko, C. D. Peters-Lidard, J. Sheffield, J. Dong, and E. F. Wood. 2014. “Uncertainties, Correlations, and Optimal Blends of Drought Indices from the NLDAS Multiple Land Surface Model Ensemble.” Journal of Hydrometeorology 15 (4): 1636–1650. doi:10.1175/JHM-D-13-058.1.
- Xia, Y., M. B. Ek, Y. Wu, T. Ford, and S. M. Quiring. 2015. “Comparison of NLDAS-2 Simulated and NASMD Observed Daily Soil Moisture. Part I: Comparison and Analysis.” Journal of Hydrometeorology 16 (5): 1962–1980. doi:10.1175/JHM-D-14-0096.1.
- Yagci, A. L., L. Di, and M. Deng. 2015. “The Effect of Corn–Soybean Rotation on the NDVI-based Drought Indicators: A Case Study in Iowa, USA, Using Vegetation Condition Index.” GIScience & Remote Sensing 52 (3): 290–314. doi:10.1080/15481603.2015.1038427.
Appendix 1: The spatial extent of drought as indicated by CDI-E for the months February, and June for the selected wet (2006) and drought (2009 and 2015) years.
Appendix 2: Sensitivity analysis of the soil moisture and its contribution on developing CDI-E. CDI-E with soil moisture (a-c) and without the soil moisture (d-f) as an input with their corresponding difference maps (g-i) for the months July (a, d, and g), August (b, e, and h), and September (c, f, and i) in 2015.
Appendix 3: The spatial distribution of the significant t-test result maps of the correlation coefficient values for Kiremt (a) and the Belg (b) seasons.
Appendix 4: The correlation coefficient maps of crop yield anomalies with SPI (a), SMO (b), NDVI (c), and LST (d) for Kiremt season.
Appendix 5: The spatial distribution of the significant t-test result map of the correlation coefficient values between CDI-E and crop yield anomalis for Kiremt seasons.