
 ?Mathematical formulae have been encoded as MathML and are displayed in this HTML version using MathJax in order to improve their display. Uncheck the box to turn MathJax off. This feature requires Javascript. Click on a formula to zoom.
ABSTRACT
Atmospheric aerosols can alter the direct and diffuse components of global solar radiation, which further influences terrestrial gross primary productivity (GPP) via photosynthesis. To investigate the impact of aerosols on GPP, GPP is modeled using the Boreal Ecosystem Productivity Simulator (BEPS) under two aerosol scenarios (S1& S2) over cropland and grassland ecosystems in the highly polluted North China. In S1, the aerosol-effect is not considered and an original empirical method is used when estimating direct and diffuse solar radiation in BEPS. In S2, BEPS is improved by a new empirical method which incorporates the impact of aerosols using the remote sensing-based aerosol optical depth (AOD). Results suggest that aerosols can reduce GPP of the sunlit leaves by decreasing direct solar radiation, but increase GPP of the shaded leaves by increasing diffuse solar radiation. The impact of aerosols on GPP is more significant over the cropland ecosystem (p < 0.05) with a more complex canopy structure during the peak period of the growing season. Furthermore, an AOD value of 0.3–0.6 with a diffuse fraction (the fraction of diffuse solar radiation in global solar radiation) around 30-40% can largely increase total GPP over the cropland ecosystem. The study improves the accuracy of GPP modeling using BEPS by highlighting the aerosol-effect on GPP via solar radiation over highly polluted regions.
Abbreviations: gross primary productivity (GPP); aerosol optical depth (AOD); boreal ecosystem productivity simulator (BEPS)
KEYWORDS:
1. Introduction
In the recent decade, increasing atmospheric aerosols have significantly changed surface solar radiation over China (Yang et al. Citation2015; Zhou et al. Citation2005). High aerosol concentration decreases the duration and intensity of sunshine (Kaiser Citation2002) and is also responsible for the reduced global solar radiation (Qian et al. Citation2007), direct solar radiation (direct radiation) and increased diffuse solar radiation (diffuse radiation) (Ramanathan et al. Citation2001).
Separating direct and diffuse radiation is important for vegetation photosynthesis (Spitters, Toussaint, and Goudriaan Citation1986) given the discrepancy of light use efficiency on the sunlit and shaded canopy. According to Mercado et al. (Citation2009), the sunlit canopy, illuminated by abundant direct radiation, is often light saturated and therefore has a low light-use efficiency. In contrast, the shaded canopy experiences low exposure to insufficient diffuse radiation under the clear sky condition, therefore, it is more light-use efficient. However, under the cloudy or aerosol-laden condition, the photosynthesis rate on the shaded canopy can be improved by more diffuse radiation scattered by atmospheric particles. Roderick et al. (Citation2001) have concluded that the volume of shade within the canopy can be reduced on cloudy or hazy days due to more diffuse radiation compared to clear sunny days. Meanwhile, more diffuse radiation can increase the gross primary productivity (GPP) of the ecosystem (Cheng et al. Citation2015; Gu et al. Citation2002; Williams et al. Citation2016).
GPP, the capacity of vegetation to capture carbon and energy during photosynthesis (Sjöström et al. Citation2013), is a key component of land-atmospheric carbon exchange (He et al. Citation2013). Currently, two major categories of GPP models have been developed including the big-leaf and two-leaf models based on the eddy covariance system and satellite imagery. The big-leaf model maps properties of the whole canopy onto a single leaf to calculate the flux (Dai, Dickinson, and Wang Citation2004). Whereas the two-leaf model simulates GPP by separating the canopy into the sunlit and shaded leaf groups (Chen et al. Citation2012). Different from the big-leaf model, which assumes that the photosynthetic capacity is distributed in proportion to the profile of radiation within the canopy (De Pury and Farquhar Citation1997), the two-leaf model supposes that the distribution of absorbed radiation is highly variable due to the complex canopy structure. Moreover, the big-leaf model is acceptable for estimating seasonal trends of canopy photosynthesis but inadequate for simulating day-to-day variations (Chen et al. Citation1999). However, the two-leaf model is more applicable at daily level since it considers the diurnal variations of the sunlit and shaded leaves. Sprintsin et al. (Citation2012) have suggested that productivity simulated by the two-leaf model is sensitive to both global and diffuse radiation. Therefore, it is feasible to study the aerosol-effect on GPP using a two-leaf model.
Given an increasing proportion of anthropogenic aerosols in the highly populated and polluted North China (Feng, Chen, and Ouyang, Citation2018), this study aims to investigate the impact of aerosols on GPP over grassland and cropland ecosystems in this area. A two-leaf model, the Boreal Ecosystem Productivity Simulator (BEPS), has been used to model GPP under two aerosol scenarios with or without considering aerosols. The difference in GPP between the two scenarios is used to indicate the aerosol-effect on GPP.
2. Model description
BEPS is a coupled carbon and hydrology model using climate data and remote sensing-based data to quantify the biophysical processes governing ecosystem productivity (Liu et al. Citation1997; Chen et al. Citation1999). It was originally developed to simulate net primary productivity at daily step and has been updated to an hourly model (Ju et al. Citation2006). Initially developed for boreal ecosystems, BEPS has been validated over different temperate and tropical ecosystems with reliable estimates (Matsushita and Tamura Citation2002; Sun et al. Citation2004; Wang et al. Citation2003). In BEPS, the canopy is separated into the sunlit and shaded leaves by the sunlit-shaded leaf stratification technique using the foliage clumping index, leaf area index and solar zenith angle (Chen et al. Citation1999). To consider the diurnal variations of the sunlit and shaded leaves, hourly photosynthesis is modeled for the two leaf groups above and below the canopy (Chen et al. Citation2012). Particularly, an empirical method, developed under a mid-latitude marine air mass near Vancouver, Canada, is used in BEPS to separate direct and diffuse radiation for vegetation photosynthesis on the sunlit and shaded canopy. However, this method does not consider the impact of aerosols on solar radiation. Considering the notable impact of aerosols on solar radiation (Boers, Brandsma, and Pier Siebesma Citation2017; Zeng, Zhao, and Ma Citation2018), this method should be improved to incorporate the aerosol-effect when modeling GPP using BEPS over highly polluted regions.
3. Data and methods
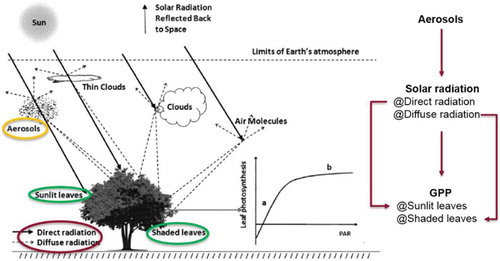
As illustrated in , the photosynthesis rate of plants is not directly controlled by atmospheric aerosols. Instead, aerosols alter the proportion of direct and diffuse radiation reaching the surface. Changes in the direct and diffuse components of solar radiation as a consequence of aerosols can modify the photosynthesis of the sunlit and shaded leaves and further influence GPP. Therefore, diffuse fraction, the fraction of diffuse radiation in global radiation, was introduced to estimate the impact of aerosols on surface solar radiation by improving a new empirical method. BEPS was then improved by this new method to model GPP under the aerosol-laden air mass. For comparison, BEPS with the original empirical method which does not consider the impact of aerosols on solar radiation, was applied to model GPP. Meanwhile, given the varying spatial resolutions of multiple datasets, the site-based GPP modeling was conducted under two aerosol scenarios with or without considering the aerosol-effect to compare their difference.
Figure 1. The schematic diagram illustrating the interaction of solar radiation between atmospheric aerosols and terrestrial vegetation according to Kanniah et al. (Citation2012).
To improve a new empirical method in BEPS by incorporating the aerosol-effect on solar radiation, the satellite-retrieved aerosol optical depth, as the proxy for aerosol concentration, and the ground-measured solar radiation including global, direct, diffuse radiation and sunshine duration are essential. Meanwhile, to model GPP using BEPS requires: (1) hourly climate data including shortwave solar radiation, air temperature, relative humidity, precipitation and wind speed, (2) remote sensing-based data, such as land cover type, leaf area index and clumping index, and (3) other parameters, e.g. the texture, water, temperature of soil and snow depth, etc.
3.1. Data processing
3.1.1. Climate data
Hourly climate data including shortwave solar radiation, air temperature, relative humidity, precipitation and wind speed were collected from the Cold and Arid Regions Science Data Centre (CARSDC) at Lanzhou, China (http://westdc.westgis.ac.cn). This dataset has a spatial resolution of 0.2° × 0.2° (Shi et al. Citation2011) and is only available during the period of 2006–2009. Therefore, 4 years from 2006–2009 were selected as the study period. Meanwhile, the ground-measured solar radiation including daily global, direct and diffuse radiation was obtained from the China Meteorological Data Sharing System (CMDSS, http://www.cma.gov.cn) for 16 meteorological and radiometric stations in North China during 2006–2009. Through a preliminary quality check, 14 out of 16 stations have almost complete measurements of daily global radiation but no measurements of direct and diffuse radiation. The other two stations (Beijing 54,511 and Zhengzhou 57,083) have almost complete (over 99.9%) measurements of daily global, direct and diffuse radiation. Measurements from these two stations were used to calibrate and validate the new empirical method for separating direct and diffuse radiation under the aerosol-laden air mass in North China. In addition, sunshine duration (SSD), a widely used variable in estimating solar radiation (Angström Citation1924; Li et al. Citation2011), was also collected from the CMDSS for 16 stations over the same period. Few missing data and outliers in the solar radiation datasets were interpolated using a three-day average moving window.
3.1.2. Remote sensing-based data
Satellite-retrieved daily aerosol optical depth (AOD) with 1°×1° spatial resolution was collected from the Moderate Resolution Imaging Spectroradiometer (MODIS) sensor aboard the Terra (MOD08D3) and Aqua (MYD08D3) platforms. AOD, the degree to which aerosols prevent the transmission of light by absorption or scattering, has been frequently used as an effective proxy for the columnar aerosol concentration (Tian and Chen Citation2010). Missing daily AOD data from the Terra platform were filled with available daily AOD from the Aqua platform (Tang et al. Citation2005; Fan and Liu Citation2016). Meanwhile, MODIS Land Cover Type product (MCD12Q1), providing annual global land cover with 500 m spatial resolution, along with the University of Maryland (UMD) land cover classification scheme, was used to identify the cover types in North China in 2007. Two major land covers, namely cropland, and grassland, were identified.
To separate the sunlit and shaded leaves, the vegetation clumping index (CI) with 500 m spatial resolution, derived from the MODIS Bidirectional Reflectance Distribution Function (BRDF) product by He et al. (Citation2012), was used in this study. CI refers to the confined distribution of foliage in canopies with different structures and it quantifies the level of foliage grouping within distinct canopy structures (He et al. Citation2012). Moreover, leaf area index (LAI), a key parameter to simulate many physical and biological processes (Feng et al. Citation2007), was collected from the Global Land Surface Satellite (GLASS) LAI product provided by the Centre for Global Change Data Processing and Analysis of Beijing Normal University. It has an 8-day temporal resolution and 1 km spatial resolution. Here, the 8-day average LAI was linearly interpolated into daily LAI.
3.1.3. Other data
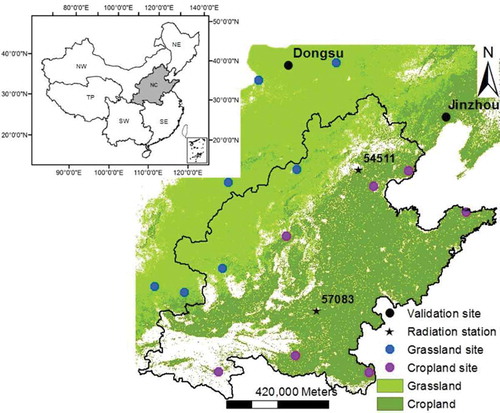
Soil is another important factor affecting plant growth. Soil texture was determined using the soil triangle calculator based on the proportion of clay, sand, and silt retrieved from a standardized global dataset of soil horizon thicknesses and textures compiled by Webb et al. (Citation1991) with 1°×1° spatial resolution. Daily land surface temperature with 1 km spatial resolution collected from the MODIS Land Surface Temperature/Emissivity (MOD11) was used as the surrogate for soil temperature. Soil water was obtained from outputs of the land data assimilation system provided by the Chinese Meteorological Administration (CMA). Moreover, Peng et al.’s research (Citation2010) was referred to estimate the snow depth. The field measurements of GPP from two eddy covariance systems located in Dongsu (grassland ecosystem) and Jinzhou (cropland ecosystem) were used to validate GPP modeled by BEPS. The available field measurements are 8-day total GPP covering the growing season of vegetation, which have been used for validating the model simulated GPP (Wang et al. Citation2013). The geographical distribution of the study area, 16 meteorological and radiometric stations, two ecosystems and two validation sites is shown in .
Figure 2. The location of North China and the distribution of two ecosystems, 16 meteorological and radiometric stations and two validation sites in the study area. The study area is defined by Xu et al. (Citation2015), who have divided China into six regions including North China (NC), Southwest (SW), Southeast (SE), Northeast (NE), Northwest (NW) China and the Tibet Plateau (TP).
3.2. Empirical radiation method
Two aerosol scenarios (S1& S2) for GPP modeling were differentiated by the empirical method for separating direct and diffuse radiation in BEPS. In S1, diffuse fraction was determined by an empirical method (Equation 1) (Chen et al. Citation1999) developed under a mid-latitude marine air mass near Vancouver, Canada, which did not consider the aerosol-effect on solar radiation. Diffuse radiation estimated using this method at two stations (Beijing 54,511 and Zhengzhou 57,083) in North China was compared with the field measurements from 2006–2009.
Where is the hourly global solar radiation above the canopy,
is the hourly diffuse radiation,
is the cloud ratio,
is the solar constant (= 1367 W/m2).
In S2, a new empirical method, developed by Feng, Chen, and Zhao (Citation2019) based on the field measured solar radiation and remote sensing-based AOD from two stations, was used to estimate daily diffuse radiation by considering three cases. In case 1 where daily sunshine duration (SSD) was zero, daily diffuse radiation was estimated as Equation (2).
where are daily diffuse and global radiation. In case 2 where daily aerosol optical depth (AOD) and sunshine duration (SSD) were both available, daily diffuse radiation was estimated as Equation (3).
In case 3 where daily aerosol optical depth (AOD) was not available, Erb et al.’s method (Citation1982) was adopted to estimate daily diffuse radiation (Equation 4).
Where is the clearness index,
is the sunset hour angle and
is the extraterrestrial radiation. Then, three cases were all considered to estimate daily diffuse radiation influenced by aerosols at two stations during 2006–2009. Hourly diffuse radiation was then estimated from daily diffuse radiation based on the empirical model proposed by Liu and Jordan (Citation1960) and improved by Collares-Pereira and Rabl (Citation1979), which was enlightened by Khatib and Elmenreich (Citation2015) method to estimate hourly solar radiation using daily solar radiation and other solar angles based on a typical profile of mean hourly solar radiation versus time.
3.3. Site-based GPP modeling
To conduct the site-based GPP modeling, 16 stations were used to determine the GPP modeling site. To guarantee the maximum land cover homogeneity around each station, 1 km-radius buffer was established around 16 stations. Stations with the dominant land cover type, which takes up the largest area within the buffer area as grassland or cropland, were selected. Fourteen sites were determined including seven grassland ecosystem sites and seven cropland ecosystem sites (). GPP of the sunlit and shaded leaves above and below the canopy, defined as overstory sunlit GPP, overstory shaded GPP, understory sunlit GPP and understory shaded GPP, were compared under two aerosol scenarios. Two proxies were used to indicate the change (, Equation 5) and the changing rate (
, Equation 6) of GPP under two aerosol scenarios. The significance of difference was tested using the Student’s t-test. Initial values of the required parameters for GPP modeling using BEPS were spatially extracted from the corresponding datasets for each site based on the geographical location ().
Table 1. Initial values of the required parameters to model GPP using BEPS at 14 sites.
4. Results and discussions
4.1. Diffuse radiation under two aerosol scenarios
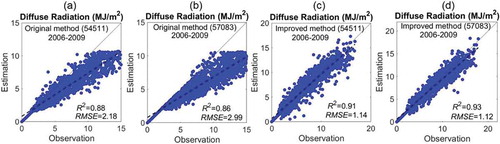
In S1, the original empirical method in BEPS, which does not consider the aerosol-effect on solar radiation, has significantly underestimated daily diffuse radiation, particularly the daily maximum diffuse radiation (,b)). Spitters, Toussaint, and Goudriaan (Citation1986) have also suggested that diffuse radiation estimated by this method is within the variation range but about 5-10% lower than the mean value. In S2, the improved empirical method, which incorporates the aerosol-effect, can significantly improve the estimation accuracy of daily diffuse radiation, particularly the maximum daily diffuse radiation (,d)). Hourly diffuse radiation was compared for seasonal differences under two aerosol scenarios ().
Figure 3. Scatterplots of daily diffuse radiation estimated by the original and the improved empirical method against the field measurements at two stations in North China under S1 (ab) and S2 (cd) aerosol scenarios.
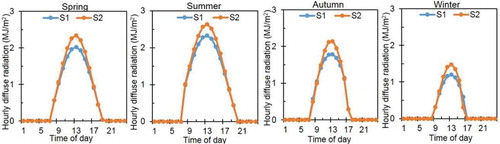
Seasonal analysis suggests more diffuse radiation in summer, spring, autumn than in winter with the increased diffuse radiation as a consequence of aerosols. Given the improved estimation accuracy of diffuse radiation by the new empirical method, this method can be used with confidence in North China to improve BEPS for GPP modeling in S2, where GPP modeling was influenced by atmospheric aerosols. In contrast, in S1, GPP modeled by BEPS with the original empirical method is assumed to be not, or less disturbed by aerosols. The differences in GPP under two aerosol scenarios were used to investigate the impact of aerosols on GPP.
Figure 4. Seasonal difference of hourly diffuse radiation under two aerosol scenarios (S1& S2).
4.2. Model validation under two aerosol scenarios
GPP of the cropland ecosystem is higher than that of the grassland ecosystem. GPP modeled in the scenario considering aerosols (S2) exhibits generally better agreement with the measured GPP than that in the scenario without considering aerosols (S1) at both sites (), particularly at Jinzhou site over cropland ecosystem. The model validation suggests that the improved BEPS can achieve a better estimation accuracy of GPP by incorporating the aerosol-effect in highly polluted North China. Therefore, the improved empirical method is applicable for better estimating diffuse radiation and modeling GPP using BEPS over the highly polluted regions.
Figure 5. Validation of eight-day total GPP modeled by BEPS under two aerosol scenarios (S1& S2) at Jinzhou (cropland ecosystem) site and Dongsu (grassland ecosystem) site. N is the number of available measurements of eight-day total GPP.
4.3. Difference in GPP under two aerosol scenarios
4.3.1. Spatiotemporal difference in annual average GPP
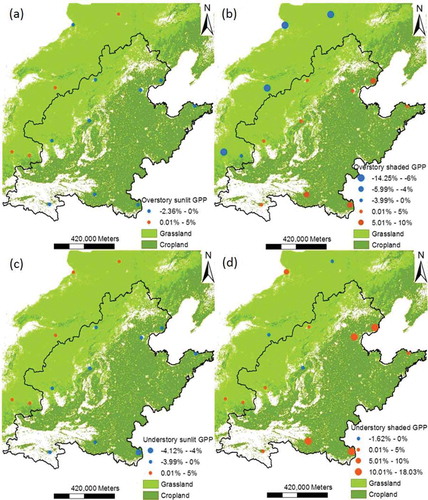
The changing rate in GPP suggests that GPP of the sunlit leaves has been reduced but that of the shaded leaves has been increased at seven cropland ecosystem sites. Moreover, the increasing rate in shaded GPP is larger below the canopy than that above the canopy. The spatial pattern of the decreased sunlit GPP and the increased shaded GPP are generally consistent with that of aerosol concentration, which is decreasing from the southeast to northwest in North China (Feng et al. Citation2018a; Luo et al. Citation2012). However, the changing rate in GPP over the grassland ecosystem is less consistent at seven sites. Generally, GPP of the sunlit leaves has been increased above and below the canopy whereas GPP of the shaded leaves has been largely reduced above the canopy but increased below the canopy at most sites ().
Figure 6. Four-year average changing rate in GPP (△GPP (%)) of the sunlit and shaded leaves above and below the canopy under two aerosol scenarios at each site. (a) Overstory sunlit GPP, (b) overstory shaded GPP, (c) understory sunlit GPP and (d) understory shaded GPP refer to GPP of the sunlit and shaded leaves above and below the canopy.
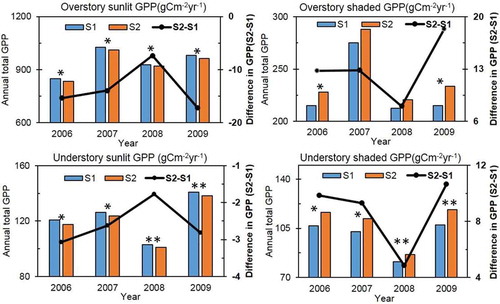
Over the cropland ecosystem, the decrease of sunlit GPP due to the declining direct radiation is significant from 2006 to 2009 above and below the canopy. In contrast, the increase of shaded GPP as a consequence of high aerosol concentration is more significant below the canopy (). The increase in shaded GPP and decrease in sunlit GPP contribute to an increase of total GPP over the cropland ecosystem, which is significant in 2006 and 2009 (p < 0.05). Despite the similar GPP variations detected over the grassland ecosystem, t-test suggests non-significant differences. Possible causes include the relatively lower productivity and simpler canopy structure of the grassland ecosystem. Over the study area, wheat and maize are two major plants in the cropland ecosystem providing considerable agricultural products. Whereas plants over the grassland ecosystem in this fragile farming-pastoral ecotone are mainly short grasses exposed to regional desertification.
Figure 7. Annual total GPP and the change of GPP (△GPP, gCm−2yr−1) averaged from seven cropland ecosystem sites under two aerosol scenarios. Significance levels are suggested as * = 0.05 and ** = 0.01.
4.3.2. Temporal difference in eight-day total GPP
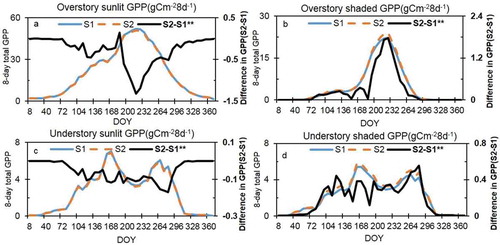
The aerosol-effect on GPP is significant (p< 0.01) during the peak period of the growing season including the decrease in sunlit GPP and the increase in shaded GPP above and below the canopy over cropland ecosystem (). However, only the decrease in sunlit GPP below the canopy is significant (p < 0.05) over the grassland ecosystem. Generally, the decrease in sunlit GPP above and below the canopy and the increase in shaded GPP above the canopy are similar on both ecosystems. Whereas the shaded GPP below the canopy is increased during the peak periods of shaded GPP both above and below the canopy over the grassland ecosystem. But it is increased throughout the growing season and highly increased during its peak period over cropland ecosystem. This difference highlights the impact of canopy structure on shaded GPP below the canopy. The canopy structure of the cropland ecosystem is more complex with a significant difference in the sunlit and shaded canopy. Therefore, the increase in GPP of the shaded leaves below the canopy is more significant. In contrast, it is challenging to stratify the sunlit and shaded canopy of grassland ecosystem due to the simple canopy structure, therefore, the shaded GPP below the canopy tends to be influenced by that above the canopy.
Figure 8. Eight-day total GPP and change in GPP (△GPP, gCm−28d−1) averaged from seven cropland ecosystem sites under two aerosol scenarios. Significance levels are suggested as * = 0.05 and ** = 0.01 and DOY indicates the day of year.
4.4. Impact of aerosols on GPP
4.4.1. Sensitivity of GPP to diffuse fraction
A negligible increase in total GPP is detected when diffuse fraction is below 30% (). In this case, diffuse radiation is not enough to illuminate more shaded leaves. Therefore, the shaded leaves can hardly contribute to the increase of total GPP. However, total GPP can be reduced when diffuse fraction is over 70%. Despite enough diffuse radiation, in this case, GPP of the sunlit leaves is largely reduced due to the decrease of direct radiation. Total GPP is likely to be reduced since the increase in GPP of the shaded leaves is not enough to compensate for the decrease in GPP of the sunlit leaves. Instead, total GPP can be largely increased when diffuse fraction increases from 30% to 40%. Within this range, GPP of the sunlit leaves is barely influenced by the declining direct radiation whereas GPP of the shaded leaves can be largely increased, thus increasing total GPP. These thresholds can provide a better understanding of the impact of direct and diffuse radiation on total GPP.
Figure 9. Linear regression between the increase of daily total GPP (△GPP, gCm−2d−1) and daily diffuse fraction in S2 during the growing season at seven cropland ecosystem sites for 2007.
4.4.2. Sensitivity of diffuse fraction to aerosols
Diffuse fraction increases linearly with AOD when AOD increases from 0 to 2 ( left). When AOD is above 2, there are slight increases of diffuse fraction with increasing aerosols. When diffuse fraction approaches 1, variations in AOD make no obvious differences ( right). Apparently, there is a potential threshold of 2 in AOD regarding the sensitivity of diffuse fraction to aerosol concentration. Based on the trend lines, diffuse fraction can reach 30-40% when AOD is around 0.3–0.6. Therefore, it can be concluded that an AOD value of 0.3–0.6 with a diffuse fraction around 30–40% can increase the total GPP over the cropland ecosystem.
Figure 10. Scatterplots of daily diffuse fraction against daily AOD from two stations.
4.5. Discussions
In this study, the two-leaf model BEPS was selected for GPP estimation due to its improved performance compared to the light use efficiency (LUE) based MODIS GPP algorithm over different vegetation types (Zhang et al. Citation2012). The simplification of using a constant maximum LUE value for a biome type in the MODIS GPP algorithm cannot properly handle the contribution of shaded leaves to the total canopy-level GPP, this problem is minimized in BEPS by modeling GPP as the sum of sunlit and shaded leaf GPP. Moreover, the better performance of BEPS GPP than MODIS GPP also lies in the way of considering solar radiation. In the MODIS GPP model, ecosystem GPP is directly related to the absorbed photosynthetically active radiation (APAR) through LUE, where fPAR is calculated as the fraction of the incident photosynthetically active radiation (PAR) (Yuan et al. Citation2014). In contrast, BEPS includes an advanced canopy radiation sub-model to quantify the effects of canopy architecture on the radiation distribution as well as the photosynthesis of sunlit and shaded leaves influenced by direct and diffuse radiation (Feng et al. Citation2007). Given the significant impact of aerosols on diffuse fraction in North China (Feng and Li Citation2018), the two-leaf model is more suitable to quantify the impact of aerosols on terrestrial GPP.
GPP was more or less underestimated using BEPS over cropland and grassland sites in this study. This is consistent with a previous work comparing the performance of both BEPS GPP and MODIS GPP against the eddy-covariance measured GPP (Zhang et al. Citation2012), which suggested that BEPS slightly underestimated annual GPP at the lower productivity sites such as cropland, shrublands and savannas sites, and that both models underestimated GPP at crop sites. This was because both models largely underestimated monthly GPP and failed to capture the monthly pattern at crop sites due to the complication in agricultural cultivation (till or no-till, irrigation) and rotation (maize-wheat, or maize-soybean). Some other possible drivers may include the application of satellite-based products, such as leaf area index, clumping index and land cover in determining the canopy structure and other soil parameters for further GPP modeling.
Two possible reasons may account for different results on grassland and cropland ecosystems. One is that the two-leaf model, BEPS, may not be able to significantly improve the estimation accuracy of GPP over grassland ecosystem compared to those big-leaf models since shaded leaves contributed less to total GPP over the shrub and C4 vegetation but more over the broadleaf evergreen forest (Chen et al. Citation2012). The other is the fact that the impact of aerosols on grassland is not that significant due to the simple canopy structure. Based on the results from this study, the increase of total GPP by aerosols is mainly from the increased GPP of the shaded leaves below the canopy. Therefore, different results between grassland and cropland ecosystems can be caused by the application of the two-leaf model as well as the different canopy structure of two ecosystems.
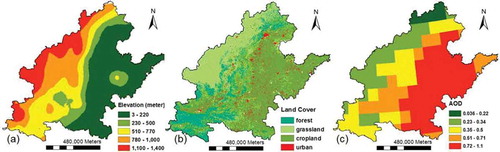
North China is one of the three regions with a higher aerosol concentration across China (Feng, Chen, and Zhang Citation2018). The low elevation with two major land covers (urban and cropland) with intensive anthropogenic activities fosters higher aerosol concentration in eastern North China. In contrast, the high elevation with another two land covers (forest and grassland) generating declining natural aerosol emissions results in lower aerosol concentration in western North China (,b)). Moreover, this region is featured by an increasing proportion of small-size anthropogenic aerosols in the recent decade and aerosol concentration is higher in eastern than western North China ()). This study has investigated the impact of aerosols on terrestrial GPP and provides a better understanding of the interaction between human activities and natural ecosystems. Based on the results, in future, increasing aerosol concentration during the growing season may have the risk to reduce terrestrial productivity over the cropland ecosystem in North China as a consequence of the varying proportion of direct and diffuse component in global radiation.
Figure 11. The distribution of elevation, aerosol concentration and land cover in North China according to Feng et al. (Citation2018a).
It should be noted that the response of diffuse fraction varies to different types of aerosols. It has been shown that small-size particles tend to increase diffuse fraction whereas large-size aerosols may decrease it (Feng and Li Citation2018). Therefore, the empirical models developed for North China in this study should be used with caution and carefully validated in other regions. Moreover, since the intention of this study was to quantify the aerosol-effect on terrestrial GPP, the substantial clouds effect on GPP estimation was not highlighted in this study. Gu et al. (Citation1999) have concluded that the presence of clouds can increase the carbon uptake of North American deciduous forests. More studies on the cloud contribution to diffuse radiation and GPP should be conducted in future.
5. Conclusions
In North China, high aerosol concentration increases GPP of the shaded leaves via the incremental diffuse radiation but reduces GPP of the sunlit leaves through the decrease of direct radiation both above and below the canopy, ending up with the increase of total GPP over grassland and cropland ecosystems. Despite the similar GPP variations, the aerosol-effect on GPP is more significant over the cropland ecosystem (p < 0.05) due to more complex canopy structure during the peak period of the growing season. Moreover, an AOD value of 0.3–0.6 with a diffuse fraction from 30-40% can increase total GPP over the cropland ecosystem. These thresholds are important in better understanding the aerosol-effect on solar radiation and terrestrial GPP.
The better performance of new empirical solar radiation method and GPP modeling using the improved BEPS highlights the impact of atmospheric aerosols on surface solar radiation and terrestrial productivity in highly polluted region. Differences between two ecosystems also stress the significance of canopy structure when modeling GPP using a two-leaf model. Future efforts are still needed to improve the quality of remote sensing-based data and to determine the optimal spatial resolution for GPP modeling at a large regional to global scale.
Acknowledgements
The authors would like to thank Dr. Jingming Chen and his team from University of Toronto for the two-leaf model (BEPS), thanks to the China Meteorological Administration for providing the radiation data and NASA for the open access to the MODIS products.
Disclosure statement
No potential conflict of interest was reported by the authors.
Additional information
Funding
References
- Angström, A. 1924. “Solar and Terrestrial Radiation.” Quarterly Journal of the Royal Meteorological Society 59 (210): 121–126. doi:10.1016/S0074-6142(08)60506-9.
- Boers, R., T. Brandsma, and A. Pier Siebesma. 2017. “Impact of Aerosols and Clouds on Decadal Trends in All-Sky Solar Radiation over the Netherlands (1966-2015).” Atmospheric Chemistry and Physics 17 (13): 8081–8100. doi:10.5194/acp-17-8081-2017.
- Chen, J. M., G. Mo, J. Pisek, J. Liu, F. Deng, M. Ishizawa, and D. Chan. 2012. “Effects of Foliage Clumping on the Estimation of Global Terrestrial Gross Primary Productivity.” Global Biogeochemical Cycles 26 (1): 1–18. doi:10.1029/2010GB003996.
- Chen, J. M., J. Liu, J. Cihlar, and M. L. Goulden. 1999. “Daily Canopy Photosynthesis Model through Temporal and Spatial Scaling for Remote Sensing Applications.” Ecological Modelling 124 (2–3): 99–119. doi:10.1016/S0304-3800(99)00156-8.
- Cheng, S. J., G. Bohrer, A. L. Steiner, D. Y. Hollinger, A. Suyker, R. P. Phillips, and K. J. Nadelhoffer. 2015. “Variations in the Influence of Diffuse Light on Gross Primary Productivity in Temperate Ecosystems.” Agricultural and Forest Meteorology 201: 98–110. Elsevier B.V. doi:10.1016/j.agrformet.2014.11.002.
- Collares-Pereira, M., and A. Rabl. 1979. “The Average Distribution of Solar Radiation-Correlations between Diffuse and Hemispherical and between Daily and Hourly Insolation Values.” Solar Energy 22 (2): 155–164. doi:10.1016/0038-092X(79)90100-2.
- Dai, Y. J., R. E. Dickinson, and Y. P. Wang. 2004. “A Two-Big-Leaf Model for Canopy Temperature, Photosynthesis, and Stomatal Conductance.” Journal of Climate 17 (12): 2281–2299. doi:10.1175/1520-0442(2004)017<2281:ATMFCT>2.0.CO;2.
- De Pury, D. G. G., and G. D. Farquhar. 1997. “Simple Scaling of Photosynthesis from Leaves to Canopies without the Errors of Big-Leaf Models.” Plant, Cell and Environment 20 (5): 537–557. doi:10.1111/j.1365-3040.1997.00094.x.
- Erbs, D. G., S. A. Klein. 1982. “Of the Diffuse Radiation Fraction for Hourly, Daily and Monthly-average Global Radiation.” Solar Energy 28 (4): 293–302. doi:10.1016/0038-092X(82)90302-4.
- Fan, X. W., and Y. B. Liu. 2016. “Exploiting TERRA-AQUA MODIS Relationship in the Reflective Solar Bands for Aerosol Retrieval.” 1–20. doi:10.3390/rs8120996.
- Feng, X., G. Liu, J. M. Chen, M. Chen, J. Liu, W. M. Ju, R. Sun, and W. Zhou. 2007. “Net Primary Productivity of China’s Terrestrial Ecosystems from a Process Model Driven by Remote Sensing.” Journal of Environmental Management 85 (3): 563–573. doi:10.1016/j.jenvman.2006.09.021.
- Feng, Y., D. M. Chen, and X. H. Zhang. 2018. “Atmospheric Aerosol Pollution across China: A Spatiotemporal Analysis of Satellite-Based Aerosol Optical Depth during 2000–2016.” International Journal of Digital Earth: 1–15. Taylor & Francis. doi:10.1080/17538947.2018.1486892.
- Feng, Y., D. M. Chen, X. Y. Ouyang, and X. H. Zhang. 2018a. “Variability of Satellite-Based Total Aerosols and the Relationship with Emission, Meteorology and Landscape in North China during 2000–2016.” Environmental Earth Sciences 77 (499): 1–11. Springer Berlin Heidelberg. doi:10.1007/s12665-018-7685-y.
- Feng, Y., D. M. Chen, and X. Y. Zhao. 2018. “Improved Empirical Models for Estimating Surface Direct and Diffuse Solar Radiation at Monthly and Daily Level: A Case Study in North China.” Progress in Physical Geography.
- Feng, Y., and Y. T. Li. 2018. “Estimated Spatiotemporal Variability of Total, Direct and Diffuse Solar Radiation across China during 1958 – 2016.” International Journal of Climatology, no. April: 1–10. doi:10.1002/joc.5676.
- Feng, Y., D. Chen, and X. Zhao. 2019. “Improved Empirical Models for Estimating Surface Direct and Diffuse Solarradiation at Monthly and Daily Level: A Case Study in North China.” Progress in Physical Geography 43 (1): 80–94. doi:10.1177/0309133318823459.
- Gu, L., J. D. Fuentes, H. H. Shugart, R. M. Staebler, and T. A. Black. 1999. “Responses of Net Ecosystem Exchanges of Carbon Dioxide to Changes in Cloudiness: Results from Two North American Deciduous Forests.” Journal of Geophysical Research Atmospheres 104 (D24): 31421–31434. doi:10.1029/1999JD901068.
- Gu, L. H., D. Baldocchi, S. B. Verma, T. A. Black, T. Vesala, E. M. Falge, and P. R. Dowty. 2002. “Advantages of Diffuse Radiation for Terrestrial Ecosystem Productivity.” Journal of Geophysical Research: Atmospheres 107 (D6): ACL 2-1-ACL 2–23. doi:10.1029/2001JD001242.
- He, L. M., J. M. Chen, J. Pisek, C. B. Schaaf, and A. H. Strahler. 2012. “Global Clumping Index Map Derived from the MODIS BRDF Product.” Remote Sensing of Environment 119 (January): 118–130. Elsevier Inc. doi:10.1016/j.rse.2011.12.008.
- He, M. Z., W. M. Ju, Y. L. Zhou, J. M. Chen, H. L. He, S. Q. Wang, H. M. Wang. et al. 2013. “Development of a Two-Leaf Light Use Efficiency Model for Improving the Calculation of Terrestrial Gross Primary Productivity.” Agricultural and Forest Meteorology 173: 28–39. Elsevier B.V. doi:10.1016/j.agrformet.2013.01.003.
- Ju, W. M., J. M. Chen, T. Andrew Black, A. G. Barr, J. Liu, and B. Z. Chen. 2006. “Modelling Multi-Year Coupled Carbon and Water Fluxes in a Boreal Aspen Forest.” Agricultural and Forest Meteorology 140 (1–4): 136–151. doi:10.1016/j.agrformet.2006.08.008.
- Kaiser, D. P. 2002. “Decreasing Trends in Sunshine Duration over China for 1954–1998: Indication of Increased Haze Pollution?” Geophysical Research Letters 29 (21): 1–4. doi:10.1029/2002GL016057.
- Kanniah, K. D., J. Beringer, P. North, and L. Hutley. 2012. “Control of Atmospheric Particles on Diffuse Radiation and Terrestrial Plant Productivity: A Review.” Progress in Physical Geography 36 (2): 209–237. doi:10.1177/0309133311434244.
- Khatib, T., and W. Elmenreich. 2015. “A Model for Hourly Solar Radiation Data Generation from Daily Solar Radiation Data Using A Generalized Regression Artificial Neural Network.” International Journal of Photoenergy 10: 1–13. doi:10.1155/2015/968024.
- Li, H. S., W. B. Ma, Y. W. Lian, X. L. Wang, and L. Zhao. 2011. “Global Solar Radiation Estimation with Sunshine Duration in Tibet, China.” Renewable Energy 36 (11): 3141–3145. Elsevier Ltd. doi:10.1016/j.renene.2011.03.019.
- Liu, B. Y. H., and R. C. Jordan. 1960. “The Interrelationship and Characteristic Distribution of Direct, Diffuse and Total Solar Radiation.” Solar Energy 4 (3): 1–19. doi:10.1016/0038-092X(60)90062-1.
- Liu, J., J. M. Chen, J. Cihlar, and W. M. Park. 1997. “A Process-Based Boreal Ecosystem Productivity Simulator Using Remote Sensing Inputs.” Remote Sensing of Environment 62: 158–175. doi:10.1016/S0034-4257(97)00089-8.
- Luo, Y. X., J. Chen, X. B. Zheng, and T. L. Zhao. 2012. “Climatology of Aerosol Optical Depth over China from Recent 10 Years of MODIS Remote Sensing Data.” Ecology and Environmental Sciences 21 (5): 876–883.
- Matsushita, B., and M. Tamura. 2002. “Integrating Remotely Sensed Data with an Ecosystem Model to Estimate Net Primary Productivity in East Asia.” Remote Sensing of Environment 81 (1): 58–66. doi:10.1016/S0034-4257(01)00331-5.
- Mercado, L. M., N. Bellouin, S. Sitch, O. Boucher, C. Huntingford, M. Wild, and P. M. Cox. 2009. “Impact of Changes in Diffuse Radiation on the Global Land Carbon Sink.” Nature 458: 1014–1017. doi:10.1038/nature07949.
- Peng, S. S., S. L. Piao, P. CIAIS, J. Y. Fang, and X. H. Wang. 2010. “Change in Winter Snow Depth and Its Impacts on Vegetation in China.” Global Change Biology 16 (11): 3004–3013. doi:10.1111/j.1365-2486.2010.02210.x.
- Qian, Y., W. G. Wang, L. R. Leung, and D. P. Kaiser. 2007. “Variability of Solar Radiation under Cloud-Free Skies in China: The Role of Aerosols.” Geophysical Research Letters 34 (12): 1–5. doi:10.1029/2006GL028800.
- Ramanathan, V., P. J. Crutzen, J. T. Kiehl, and D. Rosenfeld. 2001. “Aerosols, Climate, and the Hydrological Cycle.” Science 294 (December): 2119–2125. doi:10.1126/science.1064034.
- Roderick, M. L., G. D. Farquhar, S. L. Berry, and I. R. Noble. 2001. “On the Direct Effect of Clouds and Atmospheric Particles on the Productivity and Structure of Vegetation.” Oecologia 129 (1): 21–30. doi:10.1007/s004420100760.
- Shi, C. X., Z. H. Xie, H. Qian, M. L. Liang, and X. C. Yang. 2011. “China Land Soil Moisture EnKF Data Assimilation Based on Satellite Remote Sensing Data.” Science China Earth Sciences 54 (9): 1430–1440. doi:10.1007/s11430-010-4160-3.
- Sjöström, M., M. Zhao, S. Archibald, A. Arneth, B. Cappelaere, U. Falk, A. de Grandcourt. et al. 2013. “Evaluation of MODIS Gross Primary Productivity for Africa Using Eddy Covariance Data.” Remote Sensing of Environment 131: 275–286. Elsevier Inc. doi:10.1016/j.rse.2012.12.023.
- Spitters, C. J. T., H. A. J. M. Toussaint, and J. Goudriaan. 1986. “Separating the Diffuse and Direct Component of Global Radiation and Its Implications for Modeling Canopy Photosynthesis Part I. Components of Incoming Radiation.” Agricultural and Forest Meteorology 38 (1–3): 217–229. doi:10.1016/0168-1923(86)90060-2.
- Sprintsin, M., J. M. Chen, A. Desai, and C. M. Gough. 2012. “Evaluation of Leaf-to-Canopy Upscaling Methodologies against Carbon Flux Data in North America.” Journal of Geophysical Research: Biogeosciences 117 (1): 1–17. doi:10.1029/2010JG001407.
- Sun, R., J. M. Chen, Q. Zhu, Y. Zhou, J. Liu, J. Li, S. Liu, G. Yan, and S. Tang. 2004. “Spatial Distribution of Net Primary Productivity and Evapotranspiration in Changbaishan Natural Reserve, China, Using Landsat ETM+ Data.” Canadian Journal of Remote Sensing 30 (5): 731–742. doi:10.5589/m04-040.
- Tang, J. K., Y. Xue, T. Yu, and Y. N. Guan. 2005. “Aerosol Optical Thickness Determination by Exploiting the Synergy of TERRA and AQUA MODIS.” 94: 327–334. doi:10.1016/j.rse.2004.09.013.
- Tian, J., and D. M. Chen. 2010. “A Semi-Empirical Model for Predicting Hourly Ground-Level Fine Particulate Matter (PM2.5) Concentration in Southern Ontario from Satellite Remote Sensing and Ground-Based Meteorological Measurements.” Remote Sensing of Environment 114 (2): 221–229. Elsevier Inc. doi:10.1016/j.rse.2009.09.011.
- Wang, Q., J. Tenhunen, E. Falge, C. H. Bernhofer, A. Granier, and T. Vesala. 2003. “Simulation and Acaling of Temporal Variation in Gross Primary Production for Coniferous and Deciduous Temperate Forests.” Global Change Biology 10: 37–51. doi:10.1046/j.1529-8817.2003.00716.x.
- Wang, X. F., M. G. Ma, X. Li, Y. Song, J. L. Tan, G. H. Huang, Z. H. Zhang, et al. 2013. “Validation of MODIS-GPP Product at 10 Flux Sites in Northern China.” International Journal of Remote Sensing 34 (2): 587–599. doi:10.1080/01431161.2012.715774.
- Webb, R. S., C. E. Rosenzmig, E. R. Levine, and R. S. Webb. 1991. “A Global Data Set of Soil Particle Size Properties.” NASA Techinical Memorandum (TM4280): 1–43.
- Williams, I. N., W. J. Riley, L. M. Kueppers, S. C. Biraud, and M. S. Torn. 2016. “Separating the Effects of Phenology and Diffuse Radiation on Gross Primary Productivity in Winter Wheat.” Journal of Geophysical Research: Biogeosciences 121 (7): 1903–1915. doi:10.1002/2015JG003317.
- Xu, W., X. S. Luo, Y. P. Pan, L. Zhang, A. H. Tang, J. L. Shen, Y. Zhang, et al. 2015. “Quantifying Atmospheric Nitrogen Deposition through a Nationwide Monitoring Network across China. .” Atmospheric Chemistry and Physics 15 (21): 12345–12360. doi:10.5194/acp-15-12345-2015.
- Yang, X., C. F. Zhao, L. J. Zhou, Y. Wang, and X. H. Liu. 2015. “Distinct Impact of Different Types of Aerosols on Surface Solar Radiation in China.” Journal of Geophysical Research: Atmospheres 121: 6459–6471. doi:10.1002/2014JD022599.
- Yuan, W., W. Cai, J. Xia, J. Chen, S. Liu, W. Dong, and G. Wohlfahrt. 2014. “Global Comparison of Light Use Efficiency Models for Simulating Terrestrial Vegetation Gross Primary Production Based on the LaThuile Database.” Agricultural and Forest Meteorology 192–193: 108–120. doi:10.1016/j.agrformet.2014.03.007.
- Zeng, X. F., N. Zhao, and Y. Ma. 2018. “Distributed Modeling of Surface Solar Radiation Based on Aerosol Optical Depth and Sunshine Duration in China.” Earth and Environmental Science 121: 1–9.
- Zhang, F. M., J. M. Chen, J. Q. Chen, C. M. Gough, T. A. Martin, and D. Dragoni. 2012. “Evaluating Spatial and Temporal Patterns of MODIS GPP over the Conterminous U.S. Against Flux Measurements and a Process Model.” Remote Sensing of Environment 124 :717–29. doi:10.1016/j.rse.2012.06.023.
- Zhou, M., H. Yu, R. E. Dickinson, O. Dubovik, and B. N. Holben. 2005. “A Normalized Description of the Direct Effect of Key Aerosol Types on Solar Radiation as Estimated from Aerosol Robotic Network Aerosols and Moderate Resolution Imaging Spectroradiometer Albedos.” Journal of Geophysical Research D: Atmospheres 110 (19): 1–10. doi:10.1029/2005JD005909.