
 ?Mathematical formulae have been encoded as MathML and are displayed in this HTML version using MathJax in order to improve their display. Uncheck the box to turn MathJax off. This feature requires Javascript. Click on a formula to zoom.
ABSTRACT
Surface soil moisture (SSM) is an important parameter for many applications. Soil Moisture Active Passive (SMAP) satellite mission provides an SSM map at global scale. But its spatial resolution (36 km) is a big restriction for agricultural and hydrological studies at the catchment scale. Therefore, the present study was conducted to disaggregate the passive SMAP soil moisture data using the retrieved Soil Evaporative Efficiency (SEE) at 1-km spatial and daily temporal resolution from Moderate Resolution Imaging Spectroradiometer (MODIS) data and to assess the effectiveness of the method for generating data for different land covers. For this purpose, SMAP data were disaggregated using the SEE retrieved from daily MODIS data located at the southwest part of the United States. The accuracy of spatial and temporal variability of the disaggregated SMAP data was evaluated against the recorded in-situ soil moisture data in 202 stations of the Soil Climate Analysis Network (SCAN) for a period of 1 year. Results indicate that the disaggregated SMAP data have a moderate correlation with in-situ soil moisture data, but it is strongly affected by land cover. The highest accuracy was observed in the pasture/hay land cover class with Correlation Coefficient (R) value of 0.683 and 0.632, Mean Difference (MD) of −0.004 and −0.001, Root-Mean Square Error (RMSE) of 0.049 and 0.056, and unbiased Root-Mean Square Error (ubRMSE) of 0.039 and 0.045 for the disaggregated and original SSM data with the unit of , respectively. The lowest accuracy was found in the barren land (rock/sand/clay) for the disaggregated and original SSM data with R of 0.0278 and 0.155, MD of −0:081 and −0.052, RMSE of 0.134 and 0.116, and ubRMSE of 0.106 and 0.103, respectively. Results indicate that in overall disaggregation of SMAP data using Disaggregation based on Physical And Theoretical scale Change (DisPATCh) algorithm and MODIS products has a good potential for generating high spatial and temporal resolution of SSM at the catchment scale. But it is strongly affected by the land cover class type, because the calculation of the SEE is based on the Normalized Difference Vegetation Index (NDVI). Therefore, it can be recommended to retrieve the SEE with the attention to land cover class type and employ the other vegetation indices or methods.
1. Introduction
Soil moisture is defined as the water stored in the unsaturated soil and is affected by rainfall, ground-water and other soil characteristics (Petropoulos Citation2013). Soil moisture is an important parameter in a wide range of environmental sciences including agriculture, meteorology, climatology, water resources management, and hydrology (Robinson et al. Citation2008; Anderson et al. Citation2007; Loew et al. Citation2013; Dobriyal et al. Citation2012; Padhee, Nikam, and Dutta Citation2017) Hence, measurement of this parameter is particularly crucial. Numerous parameters may affect the soil moisture content. These include variations in topography, soil properties, land cover type, density, mean soil moisture content, depth to the water table, precipitation depth, solar radiation, and other meteorological factors (Famiglietti, Rudnicki, and Rodell Citation1998; Hébrard et al. Citation2006). However, soil moisture changes are always affected by the combination of aforesaid factors, the relationship between soil moisture content and any of them cannot be determined accurately (Liancourt et al. Citation2012). Field measurement of soil moisture is time-consuming and costly. Hence, in recent decades, different satellites have been launched and different methods have been also developed to estimate soil moisture based on these satellite data (Ebrahimi-Khusfi et al. Citation2018; Bartalis et al. Citation2007; Piles, Entekhabi, and Camps Citation2009; Entekhabi et al. Citation2010b; Das, Entekhabi, and Njoku Citation2011; Panciera et al. Citation2013; Chan et al. Citation2016; Chen, He, and Zhang Citation2017; Finn et al. Citation2011). The relative competence of these methods depends on two main factors, one is the strength of the physical link between the observations in the spectral domains with soil water content and the other is the spatial and temporal resolution of satellite data (Merlin et al. Citation2008). The physical link between L-band microwave brightness temperature and surface soil moisture profile (5 cm) is stronger than other microwave frequencies, thermal data, and radar backscatter (Kerr Citation2007). Microwave sensors with C-band and L-band in [~6 GHz] and [~10 GHz] frequencies have been used since the late 70s to estimate soil moisture content at large scales (Owe, De Jeu, and Walker Citation2001; Paloscia et al. Citation2001; Njoku et al. Citation2003). For this purpose, measuring soil moisture at global scale started successfully by The European Space Agency (ESA) entitled as the Soil Moisture and Ocean Salinity (SMOS) in 2009 (Kerr et al. Citation2010) and The National Aeronautics and Space Administration of the United States (NASA) as Soil Moisture Active Passive (SMAP) mission in 2015 (Entekhabi et al. Citation2010a). The mission of these two satellites is to provide global soil moisture maps through the L-band with [~1 GHz] frequency. The L-band low-frequency radiometers can penetrate 3 to 5-centimeter depths in the earth and they are sensitive to plant water/moisture content with an approximate density of (Entekhabi et al. Citation2010b). Although the L-band is more accurate in estimating soil moisture and atmospheric effects have less impact on it compared to the C-band and X-band, for longer wavelength and lower frequency the energy that the sensor receives from the land surface significantly diminishes, therefore decreasing the spatial resolution (30 to 40 km) can compensate for the energy reduction effect (Chang et al. Citation1980). Using these resolutions in climatology studies at local and global scales is acceptable; however, they are not effective for agricultural and hydrological applications at catchment and finer scales that require a higher spatial resolution (Brown et al. Citation2013; Padhee, Nikam, and Dutta Citation2017). In recent years, numerous attempts have been made to improve the spatial resolution of coarse resolution soil moisture products by utilizing the radiometer sensor of SMAP and SMOS satellites and using visible and infrared thermal images from other satellites with the high spatial resolution to generate more spatially and temporally accurate soil moisture products (Merlin et al. Citation2008, Citation2010; Younis, Zubair, and Iqbal Citation2015; Merlin et al. Citation2009; Lee et al. Citation2018; Jiang and Weng Citation2016). One of the new methods for generating soil moisture with high resolution is the disaggregation of soil moisture, which is measured by microwave with a resolution of 36 km, using visible, near, and thermal infrared of the MODIS sensor at 1-km resolution. In this method, the relationship between soil moisture, land surface temperature, and land cover is expressed as an empirical polynomial relation based on “global triangle” which relies on using the Soil Evaporative Efficiency (SEE) parameter (Carlson, Gillies, and Perry Citation1994; Merlin et al. Citation2012, Citation2013, Citation2014; Peng et al. Citation2017). The basic purpose of a polynomial fitting method is to calculate the SEE parameter. In different studies to calculate these parameter optical satellite data at various spatial and temporal resolutions and in-situ data have been used to improve spatial/temporal resolution of the derived SSM products (Peng et al. Citation2017; Mishra et al. Citation2018). The disaggregation model proposed based on Physical and Theoretical Scale Change (DisPATCh) (Merlin et al. Citation2012) is an improved version of (Merlin et al. Citation2008). The new version of this algorithm includes water stress and land cover effects (Moran et al. Citation1994), substituting “Global Trapezoid” for “Global Triangle” and a simple correction for potential effects have been implemented (Merlin et al. Citation2013). Therefore, the main objectives of this study are, a) Downscaling the SMAP coarse resolution SSM product using the disaggregation algorithm based on the NDVI and LST data of MODIS at 1-km spatial resolution and daily temporal resolution to generate the SSM product at the 1-km spatial resolution. b) Evaluating the DisPATCh algorithm in a wide region with high diversity in climate conditions and different land covers. c) Evaluating the 1-km disaggregated SSM product compared to the 36-km SSM product of SMAP based on land cover class types using SCAN site observations.
2. Materials and methods
2.1. Study area
The study area, with an approximate area of 1,245,588 km2 located in the United States consists of eight southern, southwestern and westerns states. The highest and lowest annual precipitations over the study area are 1586 mm and 204 mm in Louisiana and Arizona states, respectively. The highest and lowest maximum annual temperature were reported in Arizona and Utah and the highest and lowest minimum annual temperature were recorded in Arizona and New Mexico (). Most of this region located in the arid to the semi-arid environment. Predominant land cover of the study area includes Shrub/Scrub, Grassland/Herbaceous, Evergreen Forest, Deciduous Forest and Barren Land (Rock/Sand/Clay) classes ().
Figure 1. The study area and locations of SCAN site stations and the MODIS sensor tile (h09v05) in the United States
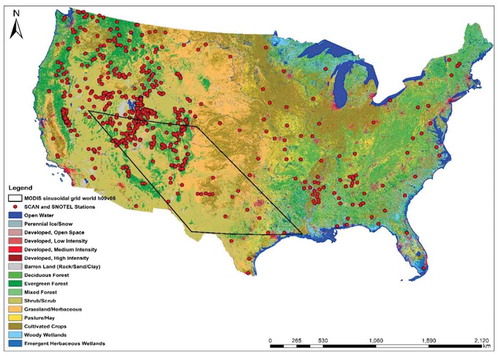
Table 1. Summarized of annual meteorological data over the study area
2.2. Data
In this study, the SMAP level-3 daily SSM product at 36-km spatial resolution and 3-day temporal resolution was used as the input of disaggregation method and time series of land surface reflectance and LST products of MODIS sensor were used to calculate the SEE parameter at 1-km spatial resolution and daily temporal resolution. The data were downloaded from the https://search.earchdata.nasa.gov based on the temporal and spatial overlap of the required products for the time period of 2017.01 to 2017.12. The data will be described in detail in the following section ().
Table 2. List of data in details and data centers used in this study
2.2.1. Soil moisture data of SMAP
SMAP products are divided into two types based on the type of source data (radar and radiometer). They are available at various spatial resolutions of 3-km, 9-km, 36-km, and 3-days temporal resolution. These products are provided at global coverage of N: 85.044, S: −85.044, E: 180, W: −180 in the global projected coordinate system EASE-Grid 2.0 in HDF format (Brodzik et al. Citation2012). In the present study, SMAP level-3 (L3) soil moisture product at 0–5 cm depth derived from radiometer sensor was used (O’Neill et al. Citation2019).
2.2.2. MODIS data
The MODIS products used in the study are as follows:
The MOD11A1 Version-6 provides daily land surface temperature with 1-km spatial resolution. Land surface temperature data are the main component in the DisPATCh algorithm that is used for calculating the SEE at 1-km resolution (Wan, Hook, and Hulley Citation2015). The MOD09GQ Version-6 product provides an estimate of the surface spectral reflectance of Terra MODIS 250 m bands 1 and 2 corrected for atmospheric conditions such as gasses, aerosols, and Rayleigh scattering (Vermote and Wolfe Citation2015). This product is used to calculate the NDVI.
2.2.3. NRCS SCAN site observations
The Soil Climate Analysis Network (SCAN) began as a soil moisture/soil temperature pilot project of the Natural Resources Conservation Service in 1991. The system is designed to provide data to support natural resource assessments and conservation activities. The SCAN system focuses on agricultural areas of the U.S. and is composed of over 200 stations. A typical SCAN site monitors soil moisture content at several depths, air temperature, relative humidity, solar radiation, wind speed and direction, rainfall, and barometric pressure. In this study, soil moisture measured at 0 to 5 cm depth was used by the Hydra Probe tool (Schaefer, Cosh, and Jackson Citation2007) and stations in which they overlap the MODIS products. shows the location of the active stations used in this study.
2.2.4. Land cover data
The U.S. Geological Survey (USGS), in partnership with several federal agencies, has developed and released four National Land Cover Database (NLCD) products over the past two decades: NLCD 1992, 2001, 2006, 2011, and 2016 (Yang et al. Citation2018). NLCD provides spatial references and descriptive data for characteristics of the land surface such as thematic class (for example, urban, agriculture, and forest), impervious surface percentage, and tree canopy cover percentage. NLCD products are created by the Multi-Resolution Land Characteristics (MRLC) Consortium, a partnership of Federal agencies led by the U.S. Geological Survey (Homer, Fry, and Barnes Citation2012).
2.3. Disaggregation
Generally, in order to downscale the soil moisture data and increase the spatial resolution for agricultural and hydrological applications at the catchment scale, various approaches such as disaggregation methods have been developed. These approaches are based on the trapezoid or triangular method in which the land surface temperature is converted to soil and vegetation temperature components to separate evaporation from the first 5 cm of soil and transpiration from the root zone of the vegetation (Carlson, Gillies, and Perry Citation1994; Moran et al. Citation1994). DisPATCh is one of the best trapezoid methods for downscaling soil moisture data (Fontanet Ambrós, Fernández García, and Ferrer Citation2018). This algorithm was developed for providing high-resolution soil moisture data using LST and NDVI data of MODIS and large-scale soil moisture data measured by the radiometer sensor of the SMOS satellite (Merlin et al. Citation2012).
The disaggregation method fundamentally depends on calculating of SEE parameter. SEE is defined as a ratio of actual and potential evaporation. Since in the catchment areas, two phenomena of evaporation from the wet soil and transpiration from the surface of the vegetation cannot be separated; therefore, these two processes are described as evapotranspiration. However, by using the capability of remote sensing data, evapotranspiration can be separated into two components of evaporation from the soil surface and transpiration from the vegetation surface. Based on this, MODIS LST is used to estimate the SEE, which is a relatively constant coefficient during the day and under clear sky conditions. The SEE is used to model surface evaporation flux for estimation of soil moisture content at a higher resolution. The main assumption of the method is that SEE is constant and depends on soil moisture content. Based on that, the equation is expressed as follows (Merlin et al. Citation2012):
That is the soil moisture product generated by DisPATCh algorithm, and
is the soil moisture of coarse-resolution SMAP.
is the partial derivative of soil moisture given the soil evaporation coefficient,
is the soil evaporation coefficient obtained from the optical data.
is the mean soil evaporation coefficient in each SMAP pixel (to make the equation more intelligible, the variables that are obtained from coarse-resolution SMAP are written in bold). SEE derived from MODIS is expressed as a linear function of soil temperature:
In this equation, is the daily land surface temperature derived from MODIS;
is the land surface temperature at SEE = 0 and
is the land surface temperature at SEE = 1.
To calculate the following equation is used:
indicates the soil parameter that has a number close to the field capacity, and in DisPATCh algorithm,
is retrieved at 36-km resolution from SMAP and aggregated MODIS data. The
is used to calculate partial derivative of
in equation (1):
2.4. Accuracy assessment
To evaluate the performance of the DisPATCh algorithm, soil moisture products derived from DisPATCh and the SMAP were compared with the observations of the SCAN site. For this purpose, SMAP level-3 daily soil moisture product at 36-km resolution and downscaled soil moisture product derived from DisPATCh at 1-km resolution were compared and validated in 202 in-situ stations. Validation was conducted by two spatial and temporal methods using time series of soil moisture data. For both spatial and temporal analysis, common statistical methods including MD, RMSE, ubRMSE, and R were used (Entekhabi et al. Citation2010a).
Where is soil moisture measured by satellite
and
expresses the measured soil moisture in in-situ stations
. In case of temporal analysis,
equals to the total number of the samples and
corresponding to a daily or monthly time period. In order to obtain more accurately estimation of RMSE, bias can be eliminated using following equation (Entekhabi et al. Citation2010):
The R indicates the relative accuracy between the soil moisture content estimated by the satellite and the soil moisture content measured by SCAN site stations:
In this equation ,
and
,
are, respectively, expressing the mean, standard deviation of satellite estimation and field measurement of soil moisture data.
3. Results
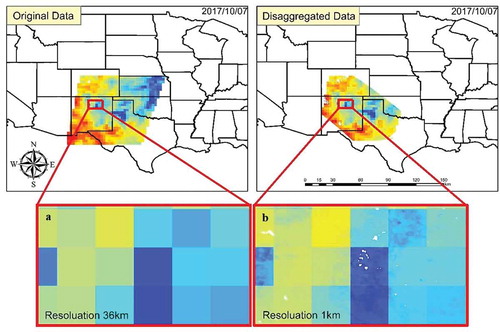
The DisPATCh algorithm was applied to the SMAP coarse resolution SSM data over the entire study period (from 01/2017 to 12/2017) and the disaggregated SSM data was compared spatially and temporally in different land cover classes over the MODIS tile using SCAN site observation in the study area. Then, the results of validation were provided for SMAP SSM data and downscaled SSM data, respectively. shows the comparative form of SMAP soil moisture data and the downscaled soil moisture data.
Figure 2. SSM data over the MODIS h09v05 tile on 7 October 2017: a. SMAP SSM data at 36-km resolution. b. Disaggregated SSM data at 1-km resolution
3.1. Spatial analysis
Validation was not possible based on land cover classes due to a lack of distribution of SCAN site stations in all land cover classes. Consequently, a comprehensive validation was conducted for all land cover classes. The results of the spatial analysis for SMAP and disaggregated soil moisture data in the SCAN measurement stations are illustrated in .
Figure 3. Evaluating results of four statistical parameters for SSM data at 36-km and 1-km spatial resolution
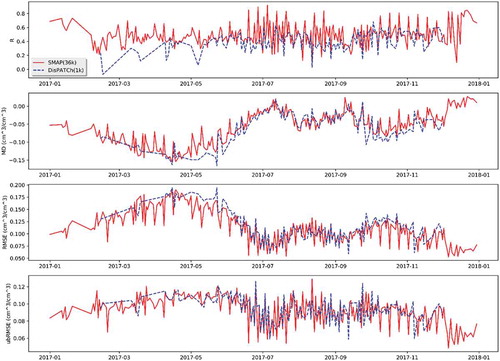
The validation results of downscaled and SMAP soil moisture products were obtained using SCAN site observations through spatial analysis method as follows: The average of each statistical parameter for downscaled and SMAP soil moisture is ,
,
, and
and
,
,
, and
respectively.
Soil moisture is strongly dependent on the land cover type (Petropoulos Citation2013); therefore, each of the soil moisture products that has been investigated by the four statistical parameters has varied accuracy in different classes of land cover. Also, by comparing the graphs obtained from validation by spatial analysis method (), it can be concluded that the accuracy of estimating the soil moisture parameter in different seasons of the year is accompanied by some changes. So much so that in warm seasons due to increasing NDVI, the measurement accuracy of the soil moisture parameter increases. Estimation accuracy of the soil moisture parameter can be seen in the ubRMSE for the seventh month of the year compared to other months of the year. Based on the calculated values for the MD parameter, it can be concluded that the amount of the soil moisture has always been estimated less than the actual value.
3.2. Temporal analysis
Land cover has a direct effect on the rate and changes of soil moisture over time because of controlling effective parameters on the soil moisture content such as runoff rates, evapotranspiration, infiltration, etc. (Petropoulos Citation2013). Therefore, for temporal analysis of disaggregated and SMAP soil moisture products using the land cover map generated by The Multi-Resolution Land Characteristics (MRLC) consortium, the SCAN sites were classified into 11 class based on land cover types. Subsequently, for each type of land cover, the evaluation was conducted by using four statistical parameters. The results of temporal analysis based on the type of land cover classes are shown in .
Figure 4. Results of four statistical parameters for both the downscaled and SMAP soil moisture products that classified based on the land cover map of the study area
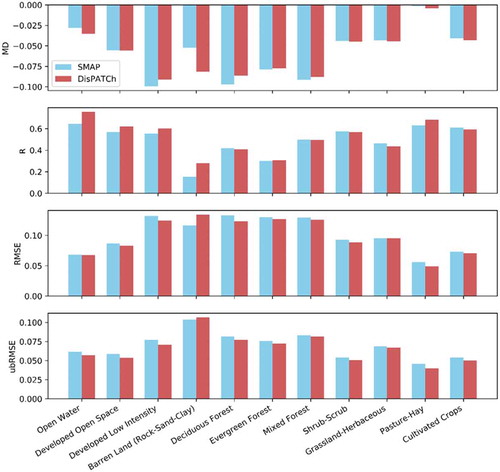
The results of the validation using the temporal analysis method are shown in . By comparing each of the statistical parameters (MD, R, RMSE, ubRMSE) in different land cover classes, it is possible to determine the accuracy of soil moisture estimation. The MD parameter is used to determine the underestimate soil moisture or overestimate soil moisture. The negative values of MD for all land cover classes indicate that underestimation of soil moisture has occurred for downscaled and SMAP soil moisture products. The Pasture/Hay class has the lowest MD value and the developed low-intensity class has the highest MD value. Also, by evaluating the ubRMSE statistical parameter for land cover classes, the best and worst class in terms of soil moisture estimation accuracy can be determined. The Pasture/Hay class has the lowest value of the ubRMSE parameter and the Barren Land (Rock/Sand/Clay) class has the highest value of this parameter. Therefore, the highest accuracy in estimating the soil moisture was found in Pasture/Hay land cover class and the average accuracy of downscaled soil moisture product were ,
,
,
and for SMAP soil moisture product were
,
,
, and
. The lowest accuracy in the estimation of soil moisture was found in Barren Land (Rock/Sand/Clay) class. For the downscaled soil moisture products were
,
,
,
and for SMAP soil moisture products were
,
,
, and
(). As vegetation cover is dense in Pasture/Hay land cover classes, and the values of NDVI are maximum, the estimation of soil moisture is more accurate compared to the Barren Land (Rock/Sand/Clay) land cover classes with the minimum values of NDVI.
Table 3. Results summary of four statistical parameters for soil moisture based on the land cover of the study area
3.3. Potential sources of error in the algorithm
In the process of disaggregation of SMAP coarse-resolution soil moisture product using surface reflectance and land surface temperature products of MODIS for the purpose of calculating the SEE, typically there are certain errors involved. In disaggregation models that are schemed based on the SEE, the accuracy of the derived soil moisture product depends on the SEE estimation accuracy and the relationship between coarse-resolution soil moisture and the SEE (Mishra et al. Citation2018). In this algorithm, due to employing data from various sources, the downscaled soil moisture data encountered uncertainties related to the input data. Each product produced by research teams using MODIS images also has a certain amount of accuracy and error. In relation to the validation of downscaled soil moisture data using SCAN site measurements, there is also a limitation. Since the SMAP observe the Earth’s surface at 6:00 AM (descending) and the MODIS observe the Earth’s surface at 10:00 AM, so the question is what time is suitable for achieving the best results in validation of downscaled soil moisture data for in-situ measurement? According to the Taylor series that is used as the main equation of the DisPATCh algorithm, the first section of the equation is related to the coarse-resolution SMAP soil moisture measurement. The second section of the equation is related to calculation of the SEE using MODIS and SMAP products that could have positive or negative values based on land surface soil moisture changes between 6:00 and 10:00 AM. Therefore, the calculated soil moisture at 6:00 AM by SMAP can be greater, equal or lower than the calculated soil moisture at 10:00 AM. As a result, in this study in-situ measurements of the SCAN site at 10:00 AM were used to validate downscaled soil moisture data. Nonetheless, by using MODIS surface reflectance for generating daily FVC data at 1-km resolution, cloud cover causes one of the major problems affecting DisPATCh algorithm outputs. Therefore, the downscaled soil moisture data have many gaps in colder seasons of the year.
4. Conclusions
The main purpose of this study was to generate high spatial resolution SSM product using the disaggregation of SMAP data and its assessment during various seasons of a year in different land cover classes. The results showed that in general, the DisPATCh algorithm is reliable for generating downscaled soil moisture data with higher resolution. Based on the spatial and temporal validation of the downscaled soil moisture data over the study area it was concluded that the DisPATCh algorithm performs well in the low to moderate height vegetation regions such as grasslands, cultivated croplands, pasture/hay, and shrubland cover classes. Also, this algorithm has a moderate accuracy in the forested area. But, it is not performed well in the barren lands (rock/sand/clay). The major barriers in generating the downscaled SSM in different seasons of the year, are the land cover and climatic conditions (evaporative demand and cloud cover) which significantly affect the algorithm performance. Hence, there is a need to revise the procedure of calculating the SEE in regards to the land cover type and employ the other vegetation indices or methods. Another restriction for using this method is its calculation complexity and variety of different inputs which will limit the application of this method. Therefore, it seems that developing a web-based application to automatize the procedure of running this algorithm is essential.
Acknowledgements
The USDA Natural Resources Conservation Service Soil Climate Analysis Network (SCAN) team are gratefully acknowledged for providing and sharing extensive soil moisture data set.
Disclosure statement
The authors of this paper certify that they have no affiliations with or involvement in any organization or entity with any financial interest, or non-financial interest in the subject matter or materials discussed in this manuscript.
References
- Anderson, M. C., J. M. Norman, J. R. Mecikalski, J. A. Otkin, and W. P. Kustas. 2007. “A Climatological Study of Evapotranspiration and Moisture Stress across the Continental United States Based on Thermal Remote Sensing: 1. Model Formulation.” Journal of Geophysical Research: Atmospheres 112 (D10): 68–73. doi:10.1029/2006JD007506.
- Bartalis, Z., W. Wagner, V. Naeimi, S. Hasenauer, K. Scipal, H. Bonekamp, J. Figa, and C. Anderson. 2007. “Initial Soil Moisture Retrievals from the METOP-A Advanced Scatterometer (ASCAT).” Geophysical Research Letters 34 (20). Wiley Online Library: L20401. doi:10.1029/2007GL031088.
- Brodzik, M. J., B. Billingsley, T. Haran, B. Raup, and M. H. Savoie. 2012. “EASE-Grid 2.0: Incremental but Significant Improvements for Earth-Gridded Data Sets.” ISPRS International Journal of Geo-Information 1 (3): 32–45. doi:10.3390/ijgi1010032.
- Brown, M. E., V. Escobar, S. Moran, D. Entekhabi, P. E. O’Neill, E. G. Njoku, B. Doorn, and J. K. Entin. 2013. “NASA’s Soil Moisture Active Passive (SMAP) Mission and Opportunities for Applications Users.” Bulletin of the American Meteorological Society 94 (8): 1125–1128. doi:10.1175/BAMS-D-11-00049.1.
- Carlson, T. N., R. R. Gillies, and E. M. Perry. 1994. “A Method to Make Use of Thermal Infrared Temperature and NDVI Measurements to Infer Surface Soil Water Content and Fractional Vegetation Cover.” Remote Sensing Reviews 9 (1–2). Taylor & Francis: 161–173. doi:10.1080/02757259409532220.
- Chan, S. K., R. Bindlish, P. E. O’Neill, E. Njoku, T. Jackson, A. Colliander, F. Chen, et al. 2016. “Assessment of the SMAP Passive Soil Moisture Product.” IEEE Transactions on Geoscience and Remote Sensing 54 (8): 4994–5007. IEEE. doi:10.1109/TGRS.2016.2561938.
- Chang, A. T. C., S. G. Atwater, V. V. Salomonson, J. E. Estes, D. S. Simonett, and M. L. Bryan. 1980. “L-Band Radar Sensing of Soil Moisture.” IEEE Transactions on Geoscience and Remote Sensing GE-18 (4): 303–310. doi:10.1109/TGRS.1980.350306.
- Chen, N., Y. He, and X. Zhang. 2017. “Correction: Chen, N. Et Al. NIR-Red Spectra-Based Disaggregation of SMAP Soil Moisture to 250 M Resolution Based on OzNet in Southeastern Australia. Remote Sens. 2017, 9, 51.” Remote Sensing 9 (4): 321. doi:10.3390/rs9040321.
- Das, N. N., D. Entekhabi, and E. G. Njoku. 2011. “An Algorithm for Merging SMAP Radiometer and Radar Data for High-Resolution Soil-Moisture Retrieval.” IEEE Transactions on Geoscience and Remote Sensing 49 (5). IEEE: 1504–1512. doi:10.1109/TGRS.2010.2089526.
- Dobriyal, P., A. Qureshi, R. Badola, and S. A. Hussain. 2012. “A Review of the Methods Available for Estimating Soil Moisture and Its Implications for Water Resource Management.” Journal of Hydrology 458–459 (August). Elsevier B.V.: 110–117. doi:10.1016/j.jhydrol.2012.06.021.
- Ebrahimi-Khusfi, M., S. K. Alavipanah, S. Hamzeh, F. Amiraslani, N. N. Samany, and J.-P. Wigneron. 2018. “Comparison of Soil Moisture Retrieval Algorithms Based on the Synergy between SMAP and SMOS-IC.” International Journal of Applied Earth Observation and Geoinformation 67: 148–160. doi: 10.1016/j.jag.2017.12.005, December 2017.
- Entekhabi, D., E. G. Njoku, P. E. O’Neill, K. H. Kellogg, W. T. Crow, W. N. Edelstein, J. K. Entin, et al. 2010a. “The Soil Moisture Active Passive (SMAP) Mission.” Proceedings of the IEEE 98 (5): 704–716. doi:10.1109/JPROC.2010.2043918.
- Entekhabi, D., E. G. Njoku, P. E. O’Neill, K. H. Kellogg, W. T. Crow, W. N. Edelstein, J. K. Entin, et al. 2010b. “The Soil Moisture Active Passive (SMAP) Mission.” Proceedings of the IEEE 98 (5): 704–716. IEEE. doi:10.1109/JPROC.2010.2043918.
- Entekhabi, D., R. H. Reichle, R. D. Koster, and W. T. Crow. 2010. “Performance Metrics for Soil Moisture Retrievals and Application Requirements.” Journal of Hydrometeorology 11 (3): 832–840. doi:10.1175/2010JHM1223.1.
- Famiglietti, J. S., J. W. Rudnicki, and M. Rodell. 1998. “Variability in Surface Moisture Content along a Hillslope Transect: Rattlesnake Hill, Texas.” Journal of Hydrology 210 (1–4). Elsevier: 259–281. doi:10.1016/S0022-1694(98)00187-5.
- Finn, Michael P, Mark David Lewis, David D Bosch, Mario Giraldo, Kristina Yamamoto, Dana G Sullivan, Russell Kincaid, et al. 2011. “Remote Sensing of Soil Moisture Using Airborne Hyperspectral Data.” GIScience & Remote Sensing 48 (4): 522–40. doi:10.2747/1548-1603.48.4.522.
- Fontanet Ambrós, M., D. Fernández García, and F. Ferrer. 2018. “The Value of Satellite Remote Sensing Soil Moisture Data and the DISPATCH Algorithm in Irrigation Fields.” Hydrology and Earth System Sciences 22 (11): 5889–5900. doi:10.5194/hess-22-5889-2018.
- Hébrard, O., M. Voltz, P. Andrieux, and R. Moussa. 2006. “Spatio-Temporal Distribution of Soil Surface Moisture in a Heterogeneously Farmed Mediterranean Catchment.” Journal of Hydrology 329 (1–2): 110–121. doi:10.1016/j.jhydrol.2006.02.012.
- Homer, C. H., J. A. Fry, and C. A. Barnes. 2012. “The National Land Cover Database.” Fact Sheet. Reston, VA. doi:10.3133/fs20123020.
- Jiang, Y., and Q. Weng. 2016. “Estimation of Hourly and Daily Evapotranspiration and Soil Moisture Using Downscaled LST over Various Urban Surfaces.” GIScience & Remote Sensing. Taylor & Francis: 1–23. doi:10.1080/15481603.2016.1258971.
- Kerr, Y. H. 2007. “Soil Moisture from Space: Where are We?” Hydrogeology Journal 15 (1): 117–120. Springer. doi:10.1007/s10040-006-0095-3.
- Kerr, Y. H., P. Waldteufel, J.-P. Wigneron, S. Delwart, F. Cabot, J. Boutin, M.-J. Escorihuela, et al. 2010. “The SMOS Mission: New Tool for Monitoring Key Elements of the Global Water Cycle.” Proceedings of the IEEE 98 (5): 666–687. doi:10.1109/JPROC.2010.2043032.
- Lee, C., E. Sohn, J. D. Park, and J.-D. Jang. 2018. “Estimation of Soil Moisture Using Deep Learning Based on Satellite Data : A Case Study of South Korea.” GIScience & Remote Sensing. Taylor & Francis: 1–25. doi:10.1080/15481603.2018.1489943.
- Liancourt, P., A. Sharkhuu, L. Ariuntsetseg, B. Boldgiv, B. R. Helliker, A. F. Plante, P. S. Petraitis, and B. B. Casper. 2012. “Temporal and Spatial Variation in How Vegetation Alters the Soil Moisture Response to Climate Manipulation.” Plant and Soil 351 (1–2): 249–261. doi:10.1007/s11104-011-0956-y.
- Loew, A., T. Stacke, W. Dorigo, R. de Jeu, and S. Hagemann. 2013. “Potential and Limitations of Multidecadal Satellite Soil Moisture Observations for Selected Climate Model Evaluation Studies.” Hydrology and Earth System Sciences 17 (9): 3523–3542. doi:10.5194/hess-17-3523-2013.
- Merlin, O., A. Al Bitar, J. P. Walker, and Y. Kerr. 2009. “A Sequential Model for Disaggregating Near-Surface Soil Moisture Observations Using Multi-Resolution Thermal Sensors.” Remote Sensing of Environment 113 (10). Elsevier Inc.: 2275–2284. doi:10.1016/j.rse.2009.06.012.
- Merlin, O., B. Duchemin, O. Hagolle, F. Jacob, B. Coudert, G. Chehbouni, G. Dedieu, J. Garatuza, and Y. Kerr. 2010. “Disaggregation of MODIS Surface Temperature over an Agricultural Area Using a Time Series of Formosat-2 Images.” Remote Sensing of Environment 114 (11). Elsevier Inc.: 2500–2512. doi:10.1016/j.rse.2010.05.025.
- Merlin, O., C. Rüdiger, A. Al Bitar, P. Richaume, J. P. Walker, and Y. H. Kerr. 2012. “Disaggregation of SMOS Soil Moisture in Southeastern Australia.” IEEE Transactions on Geoscience and Remote Sensing 50 (5 PART 1): 1556–1571. doi:10.1109/TGRS.2011.2175000.
- Merlin, O., J. P. Walker, A. Chehbouni, and Y. Kerr. 2008. “Towards Deterministic Downscaling of SMOS Soil Moisture Using MODIS Derived Soil Evaporative Efficiency.” Remote Sensing of Environment 112 (10): 3935–46. doi:10.1016/j.rse.2008.06.012.
- Merlin, O., M. J. Escorihuela, M. A. Mayoral, O. Hagolle, A. Al Bitar, and Y. Kerr. 2013. “Self-Calibrated Evaporation-Based Disaggregation of SMOS Soil Moisture: An Evaluation Study at 3km and 100m Resolution in Catalunya, Spain.” Remote Sensing of Environment 130 (2013). Elsevier Inc.: 25–38. doi:10.1016/j.rse.2012.11.008.
- Merlin, O., M. J. Escorihuela, M. A. Mayoral, O. Hagolle, A. Al Bitar, and Y. Kerr. 2014. “Self-Calibrated Evaporation-Based Disaggregation of SMOS Soil Moisture: An Evaluation Study at 3km and 100m Resolution in Catalunya, Spain.” Remote Sensing of Environment 130 (2013). Elsevier Inc.: 25–38. doi:10.1016/j.rse.2012.11.008.
- Mishra, V., W. L. Ellenburg, R. E. Griffin, J. R. Mecikalski, J. F. Cruise, C. R. Hain, and M. C. Anderson. 2018. “An Initial Assessment of a SMAP Soil Moisture Disaggregation Scheme Using TIR Surface Evaporation Data over the Continental United States.” International Journal of Applied Earth Observation and Geoinformation 68 (February): 92–104. doi:10.1016/j.jag.2018.02.005.
- Moran, M. S., T. R. Clarke, Y. Inoue, and A. Vidal. 1994. “Estimating Crop Water Deficit Using the Relation between Surface-Air Temperature and Spectral Vegetation Index.” Remote Sensing of Environment 49 (3): 246–263. doi:10.1016/0034-4257(94)90020-5.
- Njoku, E. G., T. J. Jackson, V. Lakshmi, T. K. Chan, and S. V. Nghiem. 2003. “Soil Moisture Retrieval from AMSR-E.” IEEE Transactions on Geoscience and Remote Sensing 41 (2 PART 1): 215–229. doi:10.1109/TGRS.2002.808243.
- O’Neill, P. E., S. Chan, E. G. Njoku, T. Jackson, and R. Bindlish. 2019. SMAP L3 Radiometer Global Daily 36 Km EASE-Grid Soil Moisture, Version 6. Boulder: NASA National Snow and Ice Data Center Distributed Active Archive Center. doi:10.5067/EVYDQ32FNWTH, October 14.
- Owe, M., R. De Jeu, and J. Walker. 2001. “A Methodology for Surface Soil Moisture and Vegetation Optical Depth Retrieval Using the Microwave Polarization Difference Index.” IEEE Transactions on Geoscience and Remote Sensing 39 (8): 1643–1654. doi:10.1109/36.942542.
- Padhee, S. K., B. R. Nikam, and S. Dutta. 2017. “Using Satellite-Based Soil Moisture to Detect and Monitor Spatiotemporal Traces of Agricultural Drought over Bundelkhand Region of India.” GIScience & Remote Sensing. Taylor & Francis: 1–23. doi:10.1080/15481603.2017.1286725.
- Paloscia, S., G. Macelloni, E. Santi, and T. Koike. 2001. “A Multifrequency Algorithm for the Retrieval of Soil Moisture on A Large Scale Using Microwave Data from SMMR and SSM/I Satellites.” IEEE Transactions on Geoscience and Remote Sensing 39 (8): 1655–1661. doi:10.1109/36.942543.
- Panciera, R., J. P. Walker, T. J. Jackson, D. A. Gray, M. A. Tanase, D. Ryu, A. Monerris, et al. 2013. “(Smapex): Toward Soil Moisture Retrieval from the SMAP Mission.” IEEE Transactions on Geoscience and Remote Sensing 52. IEEE: 490–507. doi:10.1109/TGRS.2013.2241774, January 2014.
- Peng, J., A. Loew, O. Merlin, and N. E. C. Verhoest. 2017. “A Review of Spatial Downscaling of Satellite Remotely Sensed Soil Moisture.” Reviews of Geophysics 55 (2): 341–366. doi:10.1002/2016RG000543.
- Petropoulos, G. P. 2013. Remote Sensing of Energy Fluxes and Soil Moisture Content. Boca Raton: CRC Press, doi:10.1201/b15610.
- Piles, M., D. Entekhabi, and A. Camps. 2009. “A Change Detection Algorithm for Retrieving High-Resolution Soil Moisture from SMAP Radar and Radiometer Observations.” IEEE Transactions on Geoscience and Remote Sensing 47 (12). IEEE: 4125–4131. doi:10.1109/TGRS.2009.2022088.
- Robinson, D. A., C. S. Campbell, J. W. Hopmans, B. K. Hornbuckle, S. B. Jones, R. Knight, F. Ogden, J. Selker, and O. Wendroth. 2008. “Soil Moisture Measurement for Ecological and Hydrological Watershed-Scale Observatories: A Review.” Vadose Zone Journal 7 (1): 358. doi:10.2136/vzj2007.0143.
- Schaefer, G. L., M. H. Cosh, and T. J. Jackson. 2007. “The USDA Natural Resources Conservation Service Soil Climate Analysis Network (SCAN).” Journal of Atmospheric and Oceanic Technology 24 (12): 2073–2077. doi:10.1175/2007JTECHA930.1.
- Vermote, E., and R. Wolfe. 2015. MOD09GQ MODIS/Terra Surface Reflectance Daily L2G Global 250m SIN Grid V006. 2015, distributed by NASA EOSDIS Land Processes DAAC, doi:10.5067/MODIS/MOD09GQ.006.
- Wan, Z., S. Hook, and G. Hulley. 2015. MOD11A1 MODIS/Terra Land Surface Temperature/Emissivity Daily L3 Global 1km SIN Grid V006. 2015, distributed by NASA EOSDIS Land Processes DAAC. doi:10.5067/MODIS/MOD11A1.006.
- Yang, L., S. Jin, P. Danielson, C. Homer, L. Gass, S. M. Bender, A. Case, et al. 2018. “ISPRS Journal of Photogrammetry and Remote Sensing A New Generation of the United States National Land Cover Database : Requirements, Research Priorities, Design, and Implementation Strategies.” ISPRS Journal of Photogrammetry and Remote Sensing 146 (August): 108–123. Elsevier. doi:10.1016/j.isprsjprs.2018.09.006.
- Younis, S., M. Zubair, and J. Iqbal. 2015. “Estimation of Soil Moisture Using Multispectral and FTIR Techniques.” The Egyptian Journal of Remote Sensing and Space Science 18 (2). Authority for Remote Sensing and Space Sciences: 151–161. doi:10.1016/j.ejrs.2015.10.001.