
 ?Mathematical formulae have been encoded as MathML and are displayed in this HTML version using MathJax in order to improve their display. Uncheck the box to turn MathJax off. This feature requires Javascript. Click on a formula to zoom.
ABSTRACT
This study designs a coherence-based multi-master-image stacking InSAR workflow as an efficient large-scale expressway stability monitoring method, which can improve the overall coherence and number of interferometric pairs via multi-master-image stacking and an average coherence threshold. The average annual ground deformation rate of Shanxi Province, China, was determined using Sentinel-1A data from 2017 to 2021 with a parallel processing strategy to improve efficiency. Compared to global navigation satellite system data, the InSAR results have a root mean square error of 2.90 mm/year. To evaluate the relationship between different factors and the occurrence of geohazards along the expressway network, we conducted a binary logistic regression analysis. The result shows that the deformation rate, annual precipitation, bedrock hardness, distance to stream, and traffic load are significantly related to the occurrence of geohazards along the expressway network in Shanxi Province, among which the deformation rate has the highest significant value, while the traffic load has the lowest, indicating that using InSAR alone to determine geohazards along expressway network is biased and it takes more than InSAR to conduct a comprehensive yet accurate expressway geohazard vulnerability evaluation. This study provides guidance for the road maintenance to ensure the safe operation of expressway systems.
1. Introduction
The expansion of expressways has greatly promoted socio-economic development in China (Faber Citation2014). However, large volumes and high speed of vehicular traffic destabilize expressways, resulting in severe consequences (Abdelwahab and Abdel-Aty Citation2002; Qu et al. Citation2014). Particularly in Shanxi Province, which is located in the eastern part of the Loess Plateau in north China, the wide distribution of collapsible loess has caused serious water and soil loss (Zhang et al. Citation2015; Li et al. Citation2020), also contributing to destabilizing expressways. Furthermore, underground mining activities have intensified ground subsidence in goaf areas, thereby jeopardizing the safety of overlying road infrastructure (Xu et al. Citation2020; Liu et al. Citation2021; Yi et al. Citation2021). In addition, vehicular traffic affects the stability of expressways, making them extremely vulnerable to geological disasters (Guo et al. Citation2019). Therefore, the stability of expressway is in urgent need of routinely monitoring in Shanxi Province.
The surface deformation of an expressway directly reflects its stability (Dai et al. Citation2018). Currently, using conventional methods (e.g. Global Positioning System and leveling) to evaluate the stability of expressway networks exhibits certain difficulties, including low sampling density, low coverage, and high cost in terms of time and labor (Shi et al. Citation2014; Liu et al. Citation2020), which make it unsuitable for large-scale expressway stability evaluation. As an advanced spaceborne remote sensing earth observation approach (Wright, Parsons, and Lu Citation2004; Lyu et al. Citation2020; Chen et al. Citation2021), Interferometric synthetic aperture radar (InSAR) has been applied to ground deformation recognition due to its high accuracy, wide coverage, and capability to operate in all weather conditions (Chaussard et al. Citation2013; Ge et al. Citation2014; Wang et al. Citation2022). The application of multi-temporal InSAR to surface deformation monitoring has achieved particularly good results. Different multi-temporal techniques, such as permanent scattering (Ferretti, Prati, and Rocca Citation1999), small baseline subsets (Berardino et al. Citation2002), and stacking InSAR (Sandwell and Price Citation1998), have not only reduced errors (e.g. atmospheric delay and decorrelation noise) but also enhanced accuracy and further promoted the application of InSAR technology.
In 1998, Usai and Klees (Citation1998) made the first attempt to measure road deformation using InSAR by extracting the phase values of high-coherence pixels along the road and assessing their stability during the monitoring period. Subsequently, InSAR has been extensively used in the deformation monitoring and geohazards vulnerability along road network applied InSAR to the monitoring of highway stability in Tibet and Foshan, respectively, and demonstrated the capability of InSAR in deformation extraction of linear infrastructures. Later, Zhao et al. (Citation2019), Hu et al. (Citation2021) and Hussain et al. (Citation2021) integrated InSAR results with a series of geological factors to study the relationship between geohazard and these factors. However, these studies were typically carried out in relatively small areas (i.e. within a single SAR data frame) and seldom included attribution analysis regarding the geohazard-causing factors.
Due to low efficiency of conventional InSAR approach in large-scale deformation extraction with regard to expressway network, as well as the absence of comprehensive large-scale expressway deformation monitoring research in the Loess Plateau region, in this study, we designed a multi-master-image stacking InSAR workflow specially for large-scale surface deformation extraction and applied it to the surface deformation extraction of the expressway network of Shanxi Province. The InSAR results, along with a variety of disaster-causing factors, were subsequently input into a binary logistic regression model to conduct an attribution analysis of geohazards along the expressway network. In doing so, this study fills the niche of large-scale expressway deformation monitoring and geohazard attribution research and provides a reference for related research in other regions.
2. Study area and SAR data
Shanxi Province is located on the eastern side of the Loess Plateau, North China, and has a total area of 156,700 km2 (). Shanxi Province features a complex topography, with mountainous terrain accounting for 80% of its total area. Most areas in the province are located at an altitude of over 1,000 m (Li et al. Citation2013) and are geologically composed of well-developed strata (Guo et al. Citation2018). Annual precipitation throughout the province is less than 620 mm (Fan and Wang Citation2011), concentrated in the summer months. The cumulative distance of currently operating expressway in the province is 5,745 km (). A total of 236 geological hazards (including ground subsidence, fissures, and landslides) occurred along the expressway network (within 1 km on both sides) from 2017 to 2021, seriously threatening the safety of motorists, vehicles, and infrastructure.
Figure 1. Map of Shanxi Province and data coverage. Sentinel-1 frames are delineated with blue boxes; expressway network is shown in grey line; orange and red dots are the location of subsidence/fissure and landslide, respectively; and the purple triangle denotes the location of GNSS station.
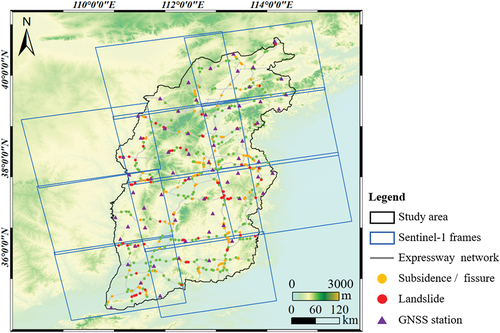
C-band IW (interferometric wide swath)-mode SAR data of Sentinel-1A satellite were used for InSAR processing (Yagüe-Martínez et al. Citation2016; Radman, Akhoondzadeh, and Hosseiny Citation2021), and required 10 frames to cover the study area (). For each frame, a total of 58 VV-polarized ascending single-look complex images taken from March 2017 to December 2021 were collected at a frequency of one scene per month, the detailed data information is shown in . The resolution of SAR data was 20 m after multi-looking, with a coefficient of 5 × 1. An external digital elevation model (DEM), namely ALOS PALSAR DEM, was obtained by correcting SRTM using PALSAR data from 2006 to 2011 and up-sampling to 12.5 m resolution was used for topographic phase removal and geocoding. For the purposes of this study, data from 2017 to 2021 were collected from 65 global navigation satellite system stations for the subsequent validation of InSAR results.
Table 1. Detailed data information of SAR acquisitions.
3. Methods
3.1 Coherence-based multi-master-image stacking workflow
The stacking InSAR algorithm was initially proposed by Sandwell and Price (Citation1998), whose workflow is mainly performing DInSAR to time-series SAR images in chronological order, and the surface deformation can be determined by calculating the weighted average of all DInSAR unwrapped phases. And later it has been applied to multiple scenarios including groundwater extraction (Bui et al. Citation2021), landslide survey (Zhang et al. Citation2021), permafrost deformation (Dai et al. Citation2018), due to its simplicity. The algorithm can be demonstrated using equation 1:
where is the deformation rate; the unwrapped phase and the time interval of the
-th interferogram are denoted by
and
, respectively; and
is the wavelength of the radar echo.
Stacking InSAR is more efficient than other time-series algorithms, and more suitable for deformation extraction over a large area or from a large amount of data. However, the stacking algorithm requires a large number of unwrapped images. Generally, it requires good coherence, which the conventional stacking workflow lacks, to correctly inverse surface deformation (Zebker and Villasenor Citation1992; Gatelli et al. Citation1994). Therefore, in this study, we used a coherence-based multi-master-image-stacking workflow, which increased the data sampling rate and improved the overall coherence of interferograms, to extract surface deformation more accurately.
The phase information is more reliable when the overall coherence of the interferogram is higher, leading to a more accurate deformation interpretation (Touzi et al. Citation1999). The coherence of a pixel is calculated using equation 2:
where and
represent the master and slave images, respectively; * indicates the complex conjugate; and
and
denote the local window size. The average coherence of the entire scene is calculated using equation 3:
where and
are the length and width of the interferogram, respectively.
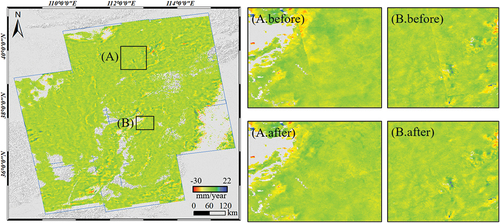
Interferometric pairs with low coherence (below the average coherence threshold) were ruled out, and those with high coherence were used in the subsequent stacking process (). First, the Sentinel-1 SAR images, corresponding orbit state data, and the 12.5 m ALOS PRISM DEM of the study area were prepared and uploaded to the Supercomputing Center of Wuhan University for parallel processing to improve efficiency. Each Sentinel-1 image frame underwent pre-processing, including data decompression and co-registration, to obtain single-look complex image stacks. Second, baseline matching was performed using a multi-master-image strategy. One hundred and sixty interferometric pairs (with minor variations between different tracks) were obtained using a spatial baseline of 10 m, and 80 pairs with better coherence were selected for further processing with regard to the average coherence index. Third, interferometry was performed on these image pairs to obtain interferograms, and the minimum cost flow method was used for phase unwrapping with a threshold of 0.5 to obtain the initial unwrapped interferograms. Fourth, phase correction, including atmospheric fitting and spatio-temporal filtering, was performed to obtain refined unwrapped interferograms. Finally, stacking and geocoding were performed to obtain the frame-wise deformation rate map. These maps were downloaded to a local workstation for mosaicking and adjustment using the mosaic module in ArcGIS software with an averaging strategy applied to the overlapping areas to reduce differences between adjacent frames, and the comparison of the deformation rate before and after the mosaicking and adjustment are shown in . After that, the global deformation rate map of the entire study area was obtained.
Figure 2. Flow chart of the stacking workflow used in this study. SLC: single-look complex; MCF: minimum cost flow; SCWU: Supercomputing center of Wuhan University.
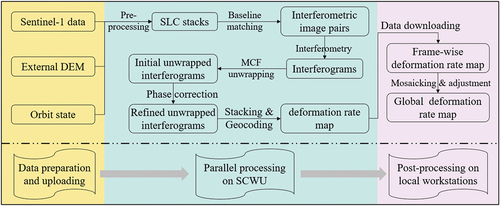
Figure 3. Comparison of deformation rate before and after mosaicking and adjustment. Left column is the location indicator of the zoom-ins; A.Before and B.Before are the deformation rate before mosaicking and adjustment; A.After and B.After are the deformation rate after mosaicking and adjustment.
3.2. Binary logistic regression
The impact of different factors on the occurrence of geological disasters along the expressway network in Shanxi Province was evaluated using the binary logistic regression model, which is commonly used to predict the likelihood of a specific event occurring in a region based on the multiple regression relationship between a dependent variable (e.g. a geohazard) and multiple independent variables (e.g. causal factors). It can also be used to determine the extent to which different independent variables influence the dependent variable (Peng, Lee, and Ingersoll Citation2002). In our case study, 236 random non-hazard points (same as the hazard points) were generated within the buffer zone (). As for the factor layer, after thorough review of existing literatures (Devkota et al. Citation2013; Banerjee, Ghose, and Pradhan Citation2018; Zhao et al. Citation2019; Fatih, Faruk, and Ekrem Citation2021; Ye et al. Citation2022) and evaluation of accessibility of data, 7 factors were adopted in addition to the InSAR deformation rate results obtained following the steps in Section 3.1 (), elevation (), gradient (), precipitation (), bedrock hardness (), stream distribution (), fault distribution (), and traffic load () were collected. Detailed data information and preparation strategy as listed in . The point attribute table containing all the above-mentioned layer information was then exported to Microsoft Excel. Afterward, the Excel data was imported into SPSS software to conduct binary logistic regression analysis. The function of variables (f) influencing the conditional probability (p) of the occurrence of a geohazard was expressed using a logit transformation (Srimaneekarn et al. Citation2022):
Figure 4. Factors of geohazards assessed in the binary logistic regression. a. Random hazard points. b. Deformation rate. c. Elevation. d. Gradient. e. Annual precipitation. f. Bedrock hardness. g. Stream distribution. h. Fault distribution. i. Traffic load.
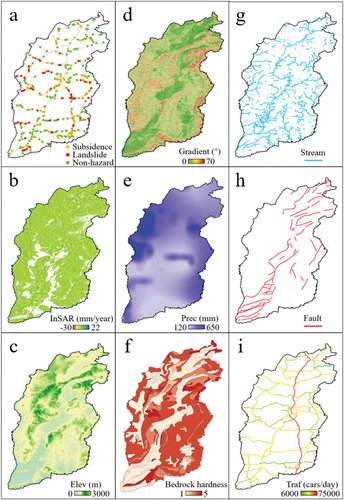
Table 2. Detailed data information and preparation strategy.
The logistic regression model was as follows:
The relationship between independent and dependent variables was evaluated using the significance index obtained from the Wald test, which is the ratio of the estimating parameter to its standard error (Kleinbaum and Klein Citation2010; Hosmer, Lemeshow, and Sturdivant Citation2013). The lower the significance value of a factor, the greater its influence on the occurrence of geohazards.
4. Results
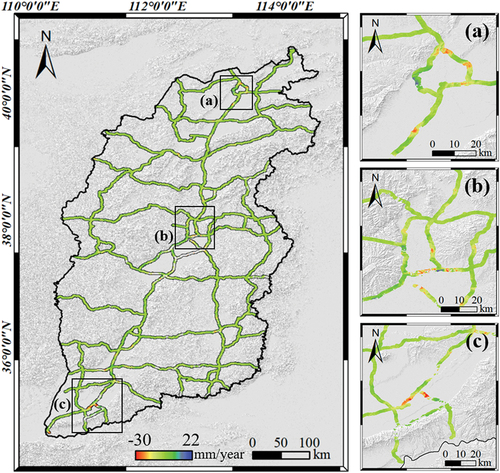
The resulting surface deformation rate map of Shanxi Province is depicted in . The average annual surface deformation rate in the study area ranged from −33 to 22 mm/year. Decorrelated areas of the map occurred because of the influence of dense vegetation, layover, or the shadowing effect. The deformation of the expressway network in Shanxi Province was determined using a 1 km buffer zone on both sides of the expressway, as shown in . Most of the areas along the expressway are relatively stable, yet major deformation is observable in three areas (, a – c), and possible reasons are the disturbance of passing vehicles, underground mining activity in adjacent regions, and early deformation of geological hazards or water and soil loss.
Figure 5. Deformation rate map of Shanxi Province. Negative value represents subsiding, positive value represents uplifting.
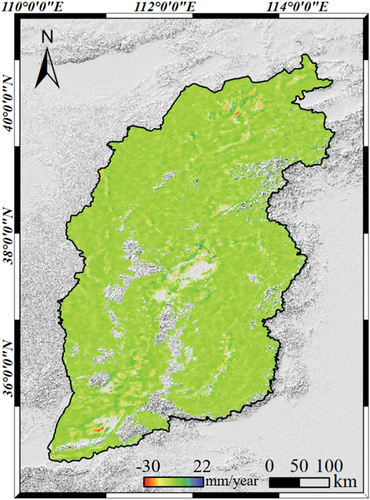
Figure 6. Deformation rate map of the expressway network in Shanxi Province. Negative value represents subsiding, positive value represents uplifting.
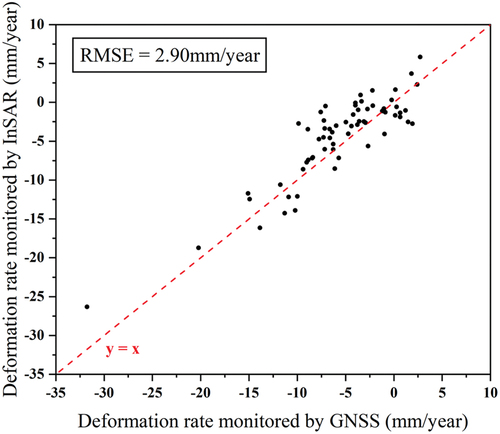
Although the proposed InSAR workflow takes into account various errors (i.e. topographic and atmospheric errors), the results may still suffer from a small amount of residual terrain error, atmospheric delay error, and noise error. Therefore, to evaluate the performance of the proposed workflow, the average annual vertical deformation rate at 65 GNSS stations was calculated as the ground truth, and the InSAR results were projected vertically for comparison (). The root mean square error (RMSE) was 2.90 mm/year.
Figure 7. Comparison between InSAR results and GNSS data.
The results of the binary regression analysis are shown in . The variance inflation factor of all independent variables is lower than 2. This indicates no multicollinearity (Lavery et al. Citation2019), meaning that the independent variables in the regression analysis do not affect one another. Deformation rate, annual precipitation, bedrock hardness, distance to stream, and traffic load all had a significant impact on the occurrence of geohazards, based on a standard of significance value <0.05 (Ou et al. Citation2021), whereas elevation, slope, and distance to fault did not.
Figure 8. Results of the binary logistic regression analysis for the eight factors. a. Deformation rate. b. Elevation. c. Gradient. d. Annual precipitation. e. Bedrock hardness. f. Distance to stream. g. Distance to fault. h. Traffic load. VIF: variance inflation factor; sig: significance.
5. Discussion
Based on the expressway deformation information obtained from InSAR shown in , we calculated the proportion of pixels in each deformation rate interval, as shown in . It can be seen from the table that the annual average deformation rate within ±10 mm/year accounts for 93.47%, which indicates that most of the expressway network in Shanxi is relatively stable without large deformation. However, it is worth noting that more than half of the expressway network has a negative deformation rate, reaching 54.60%, showing a subsiding trend. In addition, the area with the absolute value of deformation rate greater than 20 mm/year accounts for 0.04%. These areas are suffering from serious deformation, as shown in the zoom-ins in . Therefore, although their proportion is relatively small, they cannot be ignored. And the expressway maintenance department needs to carry out deformation treatment in time to ensure road stability and the safety of passing vehicles.
Table 3. Statistical table of pixel count and percentage in each deformation rate interval.
Among these factors, traffic load had the smallest significance value of 0.002, indicating that this factor has the greatest significance on the occurrence of geohazards. Large traffic loads and high-speed vehicular movement greatly disturb the subgrade, resulting in pavement and slope deformation on both sides of the expressway. The distance to the stream was the second-largest contributor to the occurrence of geohazards (significance value = 0.008). Water erodes the slope toe and softens the soil, which reduces the shear strength of the soil and destabilizes the slope. Bedrock hardness was the key internal factor controlling the occurrence of geohazards as well as their scale and type (significance value = 0.017).
The deformation rate obtained via InSAR had a significance value of 0.036, higher than that of the traffic load, distance to stream, and bedrock hardness, which means that the deformation rate is not as significant to the occurrence of geohazard as the other three factors. There are three possible reasons for this. First, InSAR captures ground deformation in the direction of a radar’s line of sight. Although these data can be converted into a vertical direction, this representation still differs from the sliding direction of geohazards in some cases (Dai et al. Citation2022). Second, some geohazards occur instantaneously without the slow accumulation of subsidence. In such cases, severe subsidence occurs over a relatively short time, far exceeding the maximum deformation gradient that InSAR can detect. Third, densely vegetated areas along the expressway lead to decorrelation, such that ground deformation cannot be interpreted using InSAR. In future studies, both ascending and descending tracks of SAR data with longer wavelengths should be adopted to address these problems. The significance value of precipitation on geohazard occurrence is equivalent to that of the deformation rate. During a precipitation event, a large volume of surface water infiltrates the slope, increasing its mass and sliding power. Rainwater also infiltrates rock fractures, reducing the cohesion and internal friction angles of the rock and thereby reducing slope stability.
The significance values of elevation and gradient on geohazard occurrence are larger than 0.005, indicating that they are not significant to the occurrence of geohazard. This is because of land leveling, slope cutting, and ditch filling activities during expressway construction, all of which considerably decrease the topographic relief along the expressway. In addition, the distribution of faults in the study area is scarce and concentrated, resulting in a higher significance value.
6. Conclusion
This study designed a coherence-based multi-master-image stacking workflow as an efficient large-scale expressway stability monitoring method to improve the overall coherence and the number of interferometric pairs via a multi-master-image strategy and average coherence threshold. Using Sentinel-1 data obtained from 2017 to 2021, the annual average ground deformation rate was determined for Shanxi Province. Comparing the GNSS data with the InSAR results, the RMSE was 2.90 mm/year. To evaluate the impact of different factors, including the deformation rate, on geohazard occurrence along the expressway network, this study included binary logistic regression analysis. Among the factors considered, the deformation rate, annual precipitation, bedrock hardness, distance to stream, and traffic load all had a significant impact on the occurrence of geohazards along the expressway network in Shanxi Province, indicating that an accurate and comprehensive evaluation of expressway network to geohazard requires the participation of multiple datasets other than InSAR results. This study fills the niche of large-scale expressway deformation monitoring and geohazard attribution analysis in Shanxi Province and provides a reference for future studies in other regions.
Acknowledgements
The authors would like to thank the European Space Agency for providing Sentinel-1 data and Qianxun SI for GNSS data. The authors would also like to thank the anonymous reviewers whose comments helped significantly improve this article.
Disclosure statement
The authors declare that they have no known competing financial interests or personal relationships that could have appeared to influence the work reported in this paper.
Data availability statement
Sentinel-1 SAR data can be downloaded from https://scihub.copernicus.eu/; Orbit state data can be downloaded from https://s1qc.asf.alaska.edu/aux_poeorb/; And ALOS PRISM DEM data can be downloaded from https://asf.alaska.edu/; The precipitation data is obtained from National Tibetan Plateau Data Center (http://www.ngac.org.cn/); The bedrock hardness and fault map are obtained from the 1:200000 geological map from National geological archives of China (http://www.tpdc.ac.cn/).
Additional information
Funding
References
- Abdelwahab, H. T., and M. A. Abdel-Aty. 2002. “Artificial Neural Networks and Logit Models for Traffic Safety Analysis of Toll Plazas.” Transportation Research Record: Journal of the Transportation Research Board 1784 (1): 115–12. doi:10.3141/1784-15.
- Banerjee, P., K. Ghose, and R. Pradhan. 2018. “Analytic Hierarchy Process and Information Value Method-Based Landslide Susceptibility Mapping and Vehicle Vulnerability Assessment Along a Highway in Sikkim Himalaya.” Arabian Journal of Geosciences 11 (7): 139. doi:10.1007/s12517-018-3488-4.
- Berardino, P., G. Fornaro, R. Lanari, and E. Sansosti. 2002. “A New Algorithm for Surface Deformation Monitoring Based on Small Baseline Differential SAR Interferograms.” IEEE Transactions on Geoscience and Remote Sensing 40 (11): 2375–2383. doi:10.1109/TGRS.2002.803792.
- Bui, L., P. Le, P. Dao, N. Long, H. Pham, H. Tran, and L. Xie. 2021. “Recent Land Deformation Detected by Sentinel-1A InSar Data (2016–2020) Over Hanoi, Vietnam, and the Relationship with Groundwater Level Change.” GIScience & Remote Sensing 58 (2): 161–179. doi:10.1080/15481603.2020.1868198.
- Chaussard, E., F. Amelung, H. Abidin, and S. Hong. 2013. ”Sinking Cities in Indonesia: ALOS PALSAR Detects Rapid Subsidence Due to Groundwater and Gas Extraction.” Remote Sensing of Environment 128: 150–161. 2013. doi:10.1016/j.rse.2012.10.015
- Chen, F., H. Xu, W. Zhou, W. Zheng, Y. Deng, and I. Parcharidis. 2021. “Three-Dimensional Deformation Monitoring and Simulations for the Preventive Conservation of Architectural Heritage: A Case Study of the Angkor Wat Temple, Cambodia.” GIScience & Remote Sensing 58 (2): 217–234. doi:10.1080/15481603.2020.1871188.
- Dai, K., J. Deng, Q. Xu, Z. Li, X. Shi, C. Hancock, N. Wen, L. Zhang, and G. Zhuo. 2022. “Interpretation and Sensitivity Analysis of the InSar Line of Sight Displacements in Landslide Measurements.” GIScience & Remote Sensing 59 (1): 1226–1242. doi:10.1080/15481603.2022.2100054.
- Dai, K., G. Liu, Z. Li, D. Ma, X. Wang, B. Zhang, J. Tang, and G. Li. 2018. “Monitoring Highway Stability in Permafrost Regions with X-Band Temporary Scatterers Stacking InSar.” Sensors 18 (6): 1876. doi:10.3390/s18061876.
- Devkota, C., D. Regmi, R. Pourghasemi, K. Yoshida, B. Pradhan, C. Ryu, R. Dhital, and F. Althuwaynee. 2013. “Landslide Susceptibility Mapping Using Certainty Factor, Index of Entropy and Logistic Regression Models in GIS and Their Comparison at Mugling–Narayanghat Road Section in Nepal Himalaya.” Natural Hazards 65 (1): 135–165. doi:10.1007/s11069-012-0347-6.
- Faber, B. 2014. “Trade Integration, Market Size, and Industrialization: Evidence from China’s National Trunk Highway System.” The Review of Economic Studies 81 (3): 1046–1070. doi:10.1093/restud/rdu010.
- Fan, X., and M. Wang. 2011. “Change Trends of Air Temperature and Precipitation Over Shanxi Province, China.” Theoretical and Applied Climatology 103 (3–4): 519–531. doi:10.1007/s00704-010-0319-2.
- Fatih, K., Y. Faruk, and S. Ekrem. 2021. “Risk Analysis of Forest Roads Using Landslide Susceptibility Maps and Generation of the Optimum Forest Road Route: A Case Study in Macka, Turkey.” Geocarto international 36 (14): 1612–1629. doi:10.1080/10106049.2019.1659424.
- Ferretti, A., C. Prati, and F. Rocca. 1999. “Permanent Scatterers in SAR Interferometry.” IEEE International Geoscience and Remote Sensing Symposium 3: 1528–1530.
- Gatelli, F., A. M. Guarnieri, F. Parizzi, P. Pasquali, C. Prati, and F. Rocca. 1994. “Wavenumber Shift in SAR Interferometry.” IEEE Transactions on Geoscience and Remote Sensing 32 (4): 855–864. doi:10.1109/36.298013.
- Ge, L., A.H. -M. Ng, X. Li, H. Z. Abidin, and I. Gumilar. 2014. “Land Subsidence Characteristics of Bandung Basin as Revealed by ENVISAT ASAR and ALOS PALSAR Interferometry.” Remote Sensing of Environment 154: 46–60. doi:10.1016/j.rse.2014.08.004.
- Guo, Q., Y. Li, X. Meng, G. Guo, and X. Lv. 2019. “Instability Risk Assessment of Expressway Construction Site Above an Abandoned Goaf: A Case Study in China.” Environmental Earth Sciences 78 (20): 588. doi:10.1007/s12665-019-8599-z.
- Guo, W., W. Shen, S. Zhou, H. Xue, D. Liu, and N. Wang. 2018. “Shale Favorable Area Optimization in Coal-Bearing Series: A Case Study from the Shanxi Formation in Northern Ordos Basin, China.” Energy Exploration & Exploitation 36 (5): 1295–1309. doi:10.1177/0144598717748951.
- Hosmer, D. W., S. Lemeshow, and R. X. Sturdivant. 2013. Applied Logistic Regression. 3rd ed. New Jersey, NJ, USA: Wiley.
- Hussain, M. A., Z. Chen, R. Wang, and M. Shoaib. 2021. “PS-InSar-Based Validated Landslide Susceptibility Mapping Along Karakorum Highway, Pakistan.” Remote Sensing 13 (20): 4129. doi:10.3390/rs13204129.
- Hu, Z., D. Xiao, W. Zhan, Y. Yu, Y. Yu, X. Yan, and C. Pan. 2021. “Feasibility of Artificial Slope Hazards Identification in Regional Mountainous Highway Using SBAS-InSar Technique: A Case Study in Lishui, Zhejiang.” Applied Sciences 11 (19): 8962. doi:10.3390/app11198962.
- Kleinbaum, D. G., and M. Klein. 2010. Logistic Regression: A Self Learning Text, 138–140. 3rd ed. New York, NY, USA: Springer.
- Lavery, M. R., P. Acharya, S. A. Sivo, and L. Xu. 2019. “Number of Predictors and Multicollinearity: What are Their Effects on Error and Bias in Regression?” Communications in Statistics - Simulation and Computation 48 (1): 27–38. doi:10.1080/03610918.2017.1371750.
- Li, P., W. Tian, M. Han, and R. Peng. 2013. “Shanxi Highway Earthquake Disaster Risk Division Based on Gis.” Applied Mechanics and Materials 353-356: 2367–2372. https://www.scientific.net/AMM.353-356.2367.
- Liu, Z., G. Mei, Y. Sun, and N. Xu. 2021. “Investigating Mining-Induced Surface Subsidence and Potential Damages Based on SBAS-InSar Monitoring and GIS Techniques: A Case Study.” Environmental Earth Sciences 80 (24): 817. doi:10.1007/s12665-021-09726-z.
- Liu, L., J. Yu, B. Chen, F. Zhu, G. Duan, M. Gao, and W. Lu. 2020. “Urban Subsidence Monitoring by SBAS-InSar Technique with Multi-Platform SAR Images: A Case Study of Beijing Plain, China.” European Journal of Remote Sensing 53 (sup1): 141–153. doi:10.1080/22797254.2020.1728582.
- Li, M., X. Zhang, Z. Yang, T. Yang, and X. Pei. 2020. “The Rainfall Erosion Mechanism of High and Steep Slopes in Loess Tablelands Based on Experimental Methods and Optimized Control Measures.” Bulletin of Engineering Geology and the Environment 79 (9): 4671–4681. doi:https://doi.org/10.1007/s10064-020-01854-3.
- Lyu, M., Y. Ke, L. Guo, X. Li, L. Zhu, H. Gong, and C. Constantinos. 2020. “Change in Regional Land Subsidence in Beijing After South-To-North Water Diversion Project Observed Using Satellite Radar Interferometry.” GIScience & Remote Sensing 57 (1): 140–156. doi:10.1080/15481603.2019.1676973.
- Ou, P., W. Wu, Y. Qin, X. Zhou, W. Huangfu, Y. Zhang, L. Xie, et al. 2021. “Assessment of Landslide Hazard in Jiangxi Using Geo-Information Technology.” Frontiers in Earth Science 9: 648342. doi:10.3389/feart.2021.648342.
- Peng, J., L. Lee, and G. Ingersoll. 2002. “An Introduction to Logistic Regression Analysis and Reporting.” The Journal of Educational Research 96 (1): 3–14. doi:10.1080/00220670209598786.
- Qu, X., Y. Kuang, E. Oh, and S. Jin. 2014. “Safety Evaluation for Expressways: A Comparative Study for Macroscopic and Microscopic Indicators.” Traffic Injury Prevention 15 (1): 89–93. doi:10.1080/15389588.2013.782400.
- Radman, A., M. Akhoondzadeh, and B. Hosseiny. 2021. “Integrating InSar and Deep-Learning for Modeling and Predicting Subsidence Over the Adjacent Area of Lake Urmia, Iran.” GIScience & Remote Sensing 58 (8): 1413–1433. doi:10.1080/15481603.2021.1991689.
- Sandwell, D. T., and E. J. Price. 1998. “Phase Gradient Approach to Stacking Interferograms.” Journal of Geophysical Research: Solid Earth 103 (B12): 30183–30204. doi:10.1029/1998jb900008.
- Shi, X., M. Liao, T. Wang, L. Zhang, W. Shan, and C. Wang. 2014. “Expressway Deformation Mapping Using High-Resolution TerraSar-X Images.” Remote Sensing Letters 5 (2): 194–203. doi:10.1080/2150704X.2014.891774.
- Srimaneekarn, N., A. Hayter, W. Liu, C. Tantipoj, and Z. Khurshid. 2022. ”Binary Response Analysis Using Logistic Regression in Dentistry.” International Journal of Dentistry 2022 (7): 1–7. Article ID 5358602 pages, 2022. doi:10.1155/2022/5358602.
- Touzi, R., A. Lopes, J. Bruniquel, and P. W. Vachon. 1999. “Coherence Estimation for SAR Imagery.” IEEE Transactions on Geoscience and Remote Sensing 37 (1, Jan): 135–149. doi:10.1109/36.739146.
- Usai, S., and R. Klees, 1998. On the Feasibility of Long Time Scale INSAR. IGARSS ’98. Sensing and Managing the Environment. 1998 IEEE International Geoscience and Remote Sensing. Symposium Proceedings. (Cat. No.98CH36174), pp. 2448–2450 vol.5, doi:10.1109/IGARSS.1998.702242.
- Wang, S., G. Zhang, Z. Chen, H. Cui, Y. Zheng, Z. Xu, and Q. Li. 2022. “Surface Deformation Extraction from Small Baseline Subset Synthetic Aperture Radar Interferometry (SBAS-InSar) Using Coherence-Optimized Baseline Combinations.” GIScience & Remote Sensing 59 (1): 295–309. doi:10.1080/15481603.2022.2026639.
- Wright, T. J., B. E. Parsons, and Z. Lu. 2004. “Toward Mapping Surface Deformation in Three Dimensions Using InSar.” Geophysical Research Letters 31 (1): 169–178. doi:10.1029/2003GL018827.
- Xu, S., Y. Zhang, H. Shi, Z. Zhang, and J. Chen. 2020. “Impactos de las propiedades de acuitardo en un acuífero no consolidado suprayacente en un área minera de la meseta de Loess: Estudio de caso de la mina de Changcun, Shanxi.” Mine Water and the Environment 39 (1): 121–134. doi:10.1007/s10230-019-00649-7.
- Yagüe-Martínez, N., P. Prats-Iraola, F. R. Gonzalez, R. Brcic, R. Shau, D. Geudtner, M. Eineder, and R. Bamler. 2016. “Interferometric Processing of Sentinel-1 TOPS Data.” IEEE Transactions on Geoscience and Remote Sensing 54 (4): 2220–2234. doi:10.1109/TGRS.2015.2497902.
- Ye, C., R. Wei, Y. Ge, Y. Li, M. Junior, and J. Li. 2022. “GIS-Based Spatial Prediction of Landslide Using Road Factors and Random Forest for Sichuan-Tibet Highway.” Journal of Mountain Science 19 (2): 461–476. doi:10.1007/s11629-021-6848-6.
- Yi, Z., M. Liu, X. Liu, Y. Wang, L. Wu, Z. Wang, and L. Zhu. 2021. “Long-Term Landsat Monitoring of Mining Subsidence Based on Spatiotemporal Variations in Soil Moisture: A Case Study of Shanxi Province, China.” International Journal of Applied Earth Observation and Geoinformation : ITC Journal 102: 102447.
- Zebker, H. A., and J. Villasenor. 1992. “Decorrelation in Interferometric Radar Echoes.” IEEE Transactions on Geoscience and Remote Sensing 30 (5): 950–959.
- Zhang, L., K. Dai, J. Deng, D. Ge, R. Liang, W. Li, and Q. Xu. 2021. “Identifying Potential Landslides by stackingInsar in Southwestern China and Its Performance Comparison with SBAS-InSar.” Remote Sensing 13 (18): 3662.
- Zhang, L., J. Wang, Z. Bai, and C. Lv. 2015. “Effects of Vegetation on Runoff and Soil Erosion on Reclaimed Land in an Opencast Coal-Mine Dump in a Loess Area.” Catena 128: 44–53. doi:10.1016/j.catena.2015.01.016.
- Zhao, F., X. Meng, Y. Zhang, G. Chen, X. Su, and D. Yue. 2019. “Landslide Susceptibility Mapping of Karakorum Highway Combined with the Application of SBAS-InSar Technology.” Sensors 19: 2685. doi:10.3390/s19122685.