
 ?Mathematical formulae have been encoded as MathML and are displayed in this HTML version using MathJax in order to improve their display. Uncheck the box to turn MathJax off. This feature requires Javascript. Click on a formula to zoom.
ABSTRACT
Forests are resilient to a range of disturbances, but combinations of severe natural and anthropogenic disturbances (e.g. wildfire and logging) may inhibit forest recovery and lead to forest degradation. Recent studies have explored long-term forest-disturbance detection and forest-recovery dynamics by using free and open-access remote-sensing images. However, mapping consecutive multiple disturbance agents is challenging using existing automated change-detection algorithms because the reduced canopy reflectance and the smoothing of consecutive disturbance signals mean that the initial disturbance cannot be spectrally separated from the second disturbance. Furthermore, uncertainty remains about post-disturbance vegetation dynamics and the effects of forest recovery under the interaction of burn severity, biological-legacy management, and active forest restoration (i.e. artificial regeneration and assisted natural regeneration). This contributes to biases in long-term forest-recovery monitoring, which are not conducive to the guidance of post-fire vegetation recovery. Here, we propose a modified disturbance index to separate the spectral characteristics of fire and forest logging using normalized tasseled-cap components (brightness and wetness) and detect the spatiotemporal distribution of post-fire logging by means of an index threshold and image differencing. On this basis, the recovery patterns of the post-fire forest are differentiated by considering the cumulative effect of fire, post-fire logging, and recovery approaches. The method is tested in the burn areas of the 5.6 Fire in the Greater Hinggan Mountain area (the largest forest fire in recorded history in China), giving an overall accuracy of 85% in post-fire forest logging mapping. Our results confirm that biological legacies (i.e. trees, logs, and snags) were removed across many areas in the fire, with activities peaking in the second year after the fire and located chiefly in areas of moderate and high burn severity. By identifying post-fire logging, the fluctuation and high disturbance index of the conventional temporal trajectory in the early stage of forest recovery are explained. The large-scale salvage logging slowed the recovery of the post-fire forest ecosystem and influenced the recovery process through the interaction of burn severity and active forest restoration. In areas of high burn severity, assisted natural regeneration (i.e. natural regeneration with artificial aids such as clearing the snags, weeding, digging pits, and supplemental planting) preserved biological legacies and achieved a higher proportion of forest recovery, second only to non-logged areas where natural regeneration (i.e. forestry recovering naturally without any artificial intervention) occurred. By contrast, salvage logging followed by artificial regeneration (i.e. clear-cutting all dead or damaged trees followed by tree planting or artificial seeding) hindered vegetation recovery in the early stage, but it improved the recovery rate in years 10–20 and approached the recovery proportion of non-logged areas where natural regeneration occurred as the recovery progressed and habitat conditions improved. The proposed method is shown to offer important advantages in detecting post-fire salvage logging, and it provides improved guidance for forest managers in developing strategies for forest recovery.
1. Introduction
As one of the largest terrestrial ecosystems on Earth, boreal forests account for ca. 30% of the global forest area and store 32% of global terrestrial carbon (Brandt et al. Citation2013; Pan et al. Citation2011). Fire is the primary disturbance of boreal forests, with an estimated 9–20 million hectares burned each year across the circumboreal region (Robinne et al. Citation2018). Although wildfires have occurred for millennia in boreal ecosystems, increasing temperature and drying climate in the context of global warming will aggravate the burn area, frequency, and severity of fire activity (Bar et al. Citation2021; de Groot, Flannigan, and Cantin Citation2013; Running Citation2006) and further affect the post-fire recovery dynamics of the forest (Anderson-Teixeira et al. Citation2013). As an inherent characteristic of terrestrial ecosystems, fire alters the landscape dynamics, biogeochemical cycle, and carbon sequestration of forest ecosystems (Goetz, Fiske, and Bunn Citation2006; Johnson Citation1992). On one hand, severe fire threatens forest biomass and public safety, leading to greenhouse gas emissions, soil erosion, and the degradation of ecosystem functions (Keane et al. Citation2008; Langmann et al. Citation2009); on the other hand, a certain degree of fire is an indispensable ecological factor in forest ecosystems, releasing growing space from overstory trees, accelerating litter decomposition, and thereby facilitating forest succession and maintaining biodiversity (Bonan and Shugart Citation1989; Bond and Keeley Citation2005). To maintain forest ecosystem functions and services, it is necessary to implement effective and scientific management strategies that take into account different burn severities. Therefore, this calls for a comprehensive acknowledgment of forest disturbance and recovery over large areas to understand the effect of fire on forest ecosystems in the context of climate change and global warming.
Forest disturbance and subsequent recovery are important ecological processes in forest systems and have significant influences on surface energy balance and global forest carbon budgets (Bowman et al. Citation2009). Forest disturbance (e.g. fire, insect outbreak, harvesting) can be viewed as being a relatively discrete event (White and Pickett Citation1985), whereas recovery is a process in which vegetation returns to its pre-disturbance state in terms of soil substrate, species composition, canopy structure, ecosystem functions, etc. (Oliver and Larson Citation1996; Stanturf, Palik, and Dumroese Citation2014). Satellite data record continuous spatial information on a terrestrial surface separated by relatively short time intervals (Foody Citation2002). Landsat satellites provide the longest monitoring period at moderate resolution, and numerous studies have characterized forest disturbance and recovery over large areas with spectral change metrics derived from remote sensing (RS) data (Cuevas‐gonzález et al. Citation2009; Frazier, Coops, and Wulder Citation2015; Goetz, Fiske, and Bunn Citation2006; Mitchell and Yuan Citation2010; Nguyen et al. Citation2018). However, while most studies considered just one change agent (e.g. fire, logging, insects, storms, etc.), only a few mapped multiple disturbance agents by disturbance detection and disturbance agent attribution, relying on change-detection algorithms and abundant training samples with spectral change metrics (Hermosilla et al. Citation2015; Kennedy et al. Citation2015; Nguyen et al. Citation2018). Some studies mapped short-interval disturbances (Hermosilla et al. Citation2019; Rodman et al. Citation2021), but multiple consecutive disturbance agents (e.g. post-fire forest logging) are difficult to detect using common change-detection methods (e.g. LandTrendr, VCT, and BFAST) because of the reduced canopy reflectance and the smoothing of consecutive stand-replacement disturbance signals, which mean that only a single change agent (e.g. fire) can be detected (Zhu Citation2017).
Post-fire logging leads to the destruction of biological legacies (BLs), including intact live trees, seed banks, standing and downed dead trees, and understory composition and distribution (Lindenmayer and Franklin Citation2002), which play an important role in improving connectivity in the landscape and realizing ecosystem reorganization and biodiversity perpetuation (Franklin, Mitchell, and Palik Citation2007). Several studies noted that the removal of trees from BLs – also called salvage logging – can reduce fuel loads to mitigate insect outbreaks, diminish fire risk, be used for industrial production, and provide economic benefits (Sessions et al. Citation2004; Xu Citation1998), but other studies have questioned the actual results of salvage logging because it can amplify erosion risk, increase ground temperature (Leverkus et al. Citation2021), and be counterproductive to forest recovery and fuel-load reduction (Donato et al. Citation2006). Moreover, post-fire logging is usually associated with tree planting or artificial seeding that can interact to alter the successional development patterns of forest stands (Sessions et al. Citation2004; Xu Citation1998). Therefore, accurate mapping of post-fire logging is required to provide information for understanding how it affects forest recovery.
A comprehensive characterization of forest recovery dynamics requires disentangling the spectral signatures of multiple disturbances and subsequent recovery. Forest ecosystems have ecological resilience, meaning that most disturbed forests recover to their pre-disturbance level over a long period, but the nature and rate of forest recovery depend on both natural and artificial influences (Bartels et al. Citation2016; Franklin, Mitchell, and Palik Citation2007). Natural regeneration indicates forests recovering naturally without any artificial intervention. Active forest restoration strategies mainly include artificial regeneration and assisted natural regeneration. Artificial regeneration involves clear-cutting all dead or damaged trees followed by tree planting or artificial seeding, while assisted natural regeneration involves natural regeneration with artificial aids such as clearing the snags and ground litter of the burned area, weeding, digging some pits, and supplemental planting if necessary to promote seed germination and growth naturally (Chen et al. Citation2014a). Previous studies have explored natural regeneration processes in boreal forests (Chu, Guo, and Takeda Citation2016; Frazier, Coops, and Wulder Citation2015; Griffiths et al. Citation2014; Nguyen et al. Citation2018; White et al. Citation2017), but uncertainty remains about the process of long-term forest recovery because active forest restoration interacts with burn severity and BL management. Didham et al. (Citation2007) proposed a mechanistic pathway for the interaction of multiple disturbances. According to this pathway, the interaction modification effects among fire, salvage logging, and recovery approaches may diverge from the effects produced by simply adding multiple disturbance agents in sequence. Additionally, the interaction chain effects may allow for one disturbance to alter the likelihood and magnitude of subsequent disturbances. For instance, forest managers will use different strategies for BL management and active forest restoration depending on burn severity. These events change the initial states of the forest stand and landscape, and may further alter forest succession and recovery trajectory and rate (Franklin and MacMahon Citation2000; Franklin, Mitchell, and Palik Citation2007). Under the complex interaction between natural and artificial disturbance agents, accurately monitoring forest-recovery dynamics through decades of conventional field surveys can be difficult and time consuming, whereas RS approaches can reveal the long-term spatiotemporal natures of multiple disturbance agents over a wide range (Kennedy et al. Citation2015). Therefore, to enhance the understanding of long-term forest-recovery dynamics under such interaction, we need to use RS approaches to clarify the essences and recovery effects of different patterns.
Landsat time-series data have great potential for monitoring the nature and rate of post-fire forest recovery. Several spectral vegetation indices and their time-series information have been exploited to characterize forest dynamics, such as NDVI (normalized difference vegetation index), NBR (normalized burn ratio), TCB, TCG, and TCW (tasseled-cap components for brightness, greenness, and wetness, respectively), and DI (disturbance index) (Frazier, Coops, and Wulder Citation2015; Griffiths et al. Citation2014; Lambert et al. Citation2013; Nguyen et al. Citation2018). However, spectral characteristics are not always associated with silvicultural and ecological recovery (Griffiths et al. Citation2014; Kennedy et al. Citation2012), and different vegetation indices can indicate different characteristics of forest-recovery state in time series, such as vegetation cover, forest biomass, and forest structure (Chu, Guo, and Takeda Citation2016; Pickell et al. Citation2016). Indices for which the visible and near-infrared bands are dominant (e.g. NDVI, TCG) show a high sensitivity to the photosynthetic activity of the vegetation, and they saturate rapidly because of understory vegetation (herb and shrub) growth, typically reflecting the early stages of forest succession (Pickell et al. Citation2016). Conversely, indices for which the shortwave infrared (SWIR) bands are dominant (e.g. NBR, TCW) can indicate forest structural complexity and are expected to explain the forest recovery process (Cohen and Goward Citation2004; Frazier, Coops, and Wulder Citation2015). This is because the absorption of solar radiation is influenced strongly by the presence of water in either the soil or plant tissue in the SWIR region of the electromagnetic spectrum. Consequently, through a linear combination of the normalized components of the tasseled-cap transformation, an advantage of DI is its insensitivity to the regrowth of understory vegetation and so it has been used widely to characterize long-term forest-recovery dynamics (Griffiths et al. Citation2014). Because different spectral bands and indices are related to different types of disturbance and components of post-disturbance forest succession, using multiple spectral vegetation indices can be highly valuable and can better connect (i) spectral characteristics to consecutive disturbances and (ii) spectral trends to ecological and silvicultural recovery.
The aims of the present study are to detect post-fire logging and describe the subsequent forest- recovery dynamics and effects under different recovery patterns in the northernmost part of the Greater Hinggan Mountain area in China. The 5.6 Fire – the most serious forest fire to date in China – provides an opportunity to study the interactions between post-fire logging and different forest-recovery patterns. The recovery patterns considered in this study integrated different burn severities (i.e. low/moderate/high burn severity), BL management (i.e. salvage logging/non-salvage logging), and recovery approaches (i.e. natural regeneration/active forest restoration strategies/artificial regeneration). To achieve this goal, we propose a modified disturbance index to identify the spatiotemporal distribution of the post-fire logging events. By combining a field survey and RS monitoring, the recovery patterns of post-fire forests are differentiated by the interaction of burn severity, BL management, and active forest restoration, then the long-term forest dynamics and recovery effects of each pattern are evaluated by means of DI. With comprehensive information about forest dynamics, we provide scientific guidance for forest managers to help plan activities that influence post-fire forest recovery.
2. Study area and data
The northernmost part of the Greater Hinggan Mountain area in China is located on the southern edge of the eastern Siberian boreal forests, which accounts for 30% of the total timber production in China (DFPRC Citation1994). During the past 100 years, forest resources have been exploited (e.g. deforestation, harvesting) without any forest protection policies (Liu Citation2001), causing significantly increased frequency and intensity of fire (Zhou Citation1991). On 6 May 1987, a severe fire (known as the 5.6 Fire or Black Dragon Fire) broke out in the northernmost part of the Greater Hinggan Mountain area, burning an area of 1.14 million hectares (), causing 39.6 million cubic meters of timber loss, and leaving 213 people dead and over 50 000 people homeless.
Figure 1. Location and the Landsat 5 TM composite image in 1987 (bands 4, 3, 2 as RGB) of the study area.
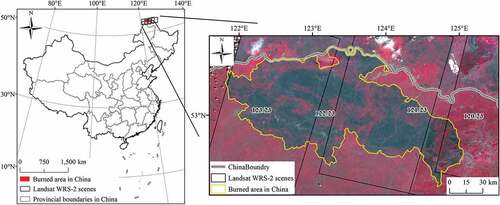
Our study area – the burned area of the 5.6 Fire in 1987 ()—extends from 52°24‘36“N/121°49’12“E to 53°33‘36“N/125°1’12“E and is covered by four Landsat WRS-2 scenes (Path/Row 120/23, 121/23, 122/23, and 123/23). The area is characterized by a typical cold-temperate continental monsoon climate with a dry and cold winter from November to April and a wet and hot summer from July to August. The average annual temperature of this area is−2°C to−4°C, and the average annual precipitation is ca. 400–500 mm (China Meteorological Administration Citation2022). In the context of a cold-temperate coniferous forest zone, this area is dominated by the early successional species White Birch (Betula platyphylla Suk.) and Aspen (Populus davidiana Dode) and the late successional species Dahurian larch (Larix gmelinii Rupr.) and Mongolian pine (Pinus sylvestris L. var. mongolica Litv.).
Soon after the 5.6 Fire, the local forestry bureau conducted widespread salvage logging of burned wood to prevent economic losses and insect damage (Li et al. Citation2006), and this activity led to the logging of many surviving coniferous trees (Xu Citation1998). Post-fire forest management in the area has shifted from harvesting to planting conifer seedlings, which started in the first year after the fire (Great Hinggan Mountain Forest Corporation Citation1997). In 1998, the Natural Forest Protection Program was implemented, and the commercial logging of natural forests was stopped completely. Inventory data on dominant tree species and recovery approaches (natural regeneration or active forest restoration) were derived from forest stand map in 2018, which recorded this information in each unit polygon.
3. Methods
Characterizing post-fire forest recovery in a landscape with diverse patterns of burn severity, BL management, and active forest restoration involved five major steps. First, stable dense forest samples were extracted through the temporal statistics of NBR. Second, each burn severity of the 5.6 Fire was separated by manually digitizing the burn-severity map from the post-fire field survey (Great Hinggan Mountain Forest Corporation Citation1997). Third, based on our proposed modified disturbance index (mDI) using normalized tasseled-cap components, post-fire logging was detected by means of mDI threshold and image differencing. Fourth, visual interpretation of the test samples from non-logged forests and first and secondary logged forest areas validated the accuracy of the forest logging map. Finally, the vegetation-recovery dynamics of each recovery pattern were evaluated using absolute and relative measures calculated from DI.
3.1. Satellite data, pre-processing, and image compositing
Monitoring forest disturbance and recovery requires consecutive observation data, and the entire archive of the Landsat series provides detailed time-series information about forest ecosystems both spatially and spectrally (Foody Citation2002). We applied Landsat-5 Thematic Mapper (TM) and Landsat-7 Enhanced Thematic Mapper Plus (ETM+) images from 1986 to 2011 in the Google Earth Engine (GEE) platform. All images were converted to surface reflectance (SR) values using the Landsat Ecosystem Disturbance Adaptive Processing System (LEDAPS) for atmospheric correction (Masek et al. Citation2006). Pixels of poor quality in each image, which were contaminated by cloud and/or shadow, were eliminated using the Function of mask algorithms (Fmask) (Zhu and Woodcock Citation2012). We also used Landsat-7 images after the scan-line corrector (SLC) failed, because these images can still provide forest information and give RS data covering the entire study area, especially for those areas with few valid observations.
To alleviate biased estimates of forest recovery caused by different image acquisition times, annual composite images covering the study area from 1986 to 2011 were generated based on the following rules: (i) selecting images from the growing season (June – August) and with less than 50% cloud cover in the study area; (ii) setting a target date and date range according to the peak growing season in the study area, and compositing all the images in order of their proximity to the target day-of-year (DOY) (Kennedy, Yang, and Cohen Citation2010). Based on the phenology characteristics of vegetation growth (Huang et al. Citation2020), the resulting target DOY was confirmed to be 202 (July 20) with a date range of±33. Note that in 1987, the target DOY for image composition was set to 170 (June 18) and the images prior to June 2 were excluded to fully demonstrate the disturbance of the forest caused by the 5.6 Fire, which lasted from May 6 to June 2 in the summer of 1987.
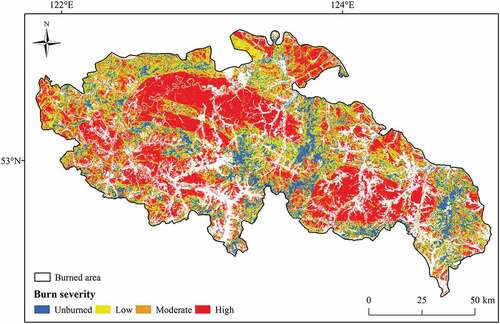
3.2. Mapping of burn severity of 5.6 Fire
Accurate information about the spatial distribution of burn severity is essential for post-fire forest management and recovery (Lentile et al. Citation2006). In the present study, we manually digitized the burn-severity map from the post-fire aerial survey to separate each burn severity of the 5.6 Fire (). According to the official post-fire survey report, the burn-severity classification was based on tree mortality: specifically, low severity refers to less than 30% tree mortality, moderate severity refers to 31–70% tree mortality, and high severity refers to>70% tree mortality (China Forestry Publishing House Citation1987). Before evaluating the burn severity, the non-forest areas in the study area were masked using DI < 3, which is described in detail in Section 3.4 (Griffiths et al. Citation2014). Note that some open forests with low tree cover may also have been masked because of mixed pixels with partial forest cover (Figure S1).
Figure 2. Burn severity of 5.6 Fire in the northernmost part of the Greater Hinggan Mountain area in China.
3.3. Mapping of post-fire forest logging
Since 1987, there have been no large fires in this area, and forest logging was the primary disturbance type. Post-fire forest logging can destroy BLs and alter the initial states of forest succession and recovery trajectory (Franklin and MacMahon Citation2000; Franklin, Mitchell, and Palik Citation2007; Johnstone et al. Citation2004). Therefore, a method is needed to detect multiple disturbance agents and evaluate the post-fire loss of BLs with high accuracy, particularly in the first few years after the fire. Automated change-detection algorithms do exist, such as LandTrendr (Kennedy, Yang, and Cohen Citation2010), VCT (Huang et al. Citation2010), and BFAST (DeVries et al. Citation2015), but these may smooth consecutive stand-replacement disturbance signals and be insensitive to multiple consecutive forest-disturbance agents. Therefore, we propose the new mDI for distinguishing different disturbance types to identify post-fire logging, and we use an mDI threshold and image differencing to detect annually increased forest logging.
3.3.1. Stable dense forest pixel selection
Referring to the method proposed by Healey et al. (Citation2005), we used stable dense forest samples to measure the disturbed magnitude of the disturbed forest. To reduce the inter-annual spectral variability of the index and unify the stable dense forest pixels of each RS scene used for standardized calculation, we aimed to select unburned forests in 1987 that were also undisturbed from 1988 to 2011 with a relatively high canopy density as the final stable dense forest samples. First, we calculated the mean and standard deviation of NBR from annual composite images during 1986–2011 in GEE to acquire the coefficient of variation (CV), because NBR is strongly linked to vegetation structure (Frazier, Coops, and Wulder Citation2015). Then, pixels with >90% and CV < 0.1 were determined as the final stable dense forest samples. Given that lack of valid observations can influence the statistical results and decrease the reliability of the stable dense forest pixels, we selected regions with greater than 90% data coverage (i.e. more than 23 years) from 1986 to 2011 to calculate CV. The calculation formulas are
where and
indicate the near-infrared and second SWIR bands of a Landsat image, respectively, and
and
indicate the mean and standard deviation of NBR of a pixel in 1986–2011, respectively.
3.3.2. Formulation of modified disturbance index (mDI)
Recent studies have emphasized that different spectral indices can reveal different forest characteristics, such as canopy cover and forest structure and changes (Frazier, Coops, and Wulder Citation2015; Pickell et al. Citation2016). In particular, the brightness (TCB) and wetness (TCW) component of the tasseled-cap transformation relate to the general albedo and forest structure, respectively, and can separate the spectral differences between fire and forest logging. After a fire, TCB typically remains low because of the increased absorption of solar shortwave radiation from charred surfaces and vegetation until the vegetation gradually starts to recover (Loboda et al. Citation2013); however, TCB remains high after forest logging because of the lack of absorption from vegetation cover and the enhanced spectral signature of bare soil (Frazier, Coops, and Wulder Citation2015). Meanwhile, TCW incorporates the SWIR bands and is strongly related to canopy moisture and structure (Crist and Cicone Citation1984; Frazier, Coops, and Wulder Citation2015), which reflects differences in the BL of fire and forest logging. Building on the above spectral characteristics, we devised the new mDI using the normalized TCB and TCW components; we ignore the greenness component (TCG) because it can rapidly reach spectral saturation because of the regrowth of the herbaceous and shrub layer (dwarf shrub) after disturbance. With stable dense forest samples generated from the previous step, the normalized TCB () and TCW (
) components were calculated in each image, then annual composite images were generated from 1986 to 2011. The calculation formulas are
where and
are the normalized brightness and wetness components of the tasseled-cap transformation, respectively.
To explain the ability of the mDI index to discriminate among unburned, post-fire logged, and post-fire non-logged forests, we visually interpreted 300 samples for each class in 1988 by stratified random sampling.
3.3.3. Detection of post-fire forest logging
Forest recovery is accompanied by attenuation of the spectral signature of the disturbance and enhanced vegetation regeneration (Cai et al. Citation2013; Frazier, Coops, and Wulder Citation2015; Nguyen et al. Citation2018; Oliver and Larson Citation1996). However, forest logging alters the structural complexity of post-fire BLs and increases uncertainty about the recovery process. To detect annual increased forest logging by using mDI, we used mDI threshold and image differencing. Because the burn scars of the 5.6 Fire quickly became undetectable because of rapid post-fire understory growth, we selected 1989–1991 as the time period for visually interpreting forest logging and non-logging areas. Based on stratified random sampling of logged and non-logged forest areas in the high-severity area with 1000 test samples of each class in 1989–1991, shows the distributions of mDI values for the post-fire logged and non-logged forest samples. As can be seen, the post-fire non-logged forest areas show two separate parts: one part has smaller positive mDI values because of relatively bare ground consisting of the herbaceous and shrub layer in the early recovery stage, and a low intensity of logging (>0); the other part has negative mDI values because charred burn scars did not disappear completely (
<0). The post-fire logged forest areas have greater positive mDI values, except for outliers caused by low-intensity logging resulting in the retention of charred vegetation.
Figure 3. The distribution of mDI values for post-fire logged and non-logged forest samples during 1988–1991.
The mDI values of logged forest areas decrease gradually with the recovery of canopy cover and forest structure. However, the spectral signature of forest logging may persist for subsequent years, which may lead to overestimated logging areas. Consecutively increased mDI values of logged forest pixels in time series could be caused by deforestation or phenology differences between images, which should not be detected as increased logging events. To ensure the accuracy of annual increased logging areas, we established the following rule to reduce errors: logged forest pixels did not return to their pre-logging state within two years because of the slow growth rate of vegetation in the Greater Hinggan Mountain area. This rule was designed to reduce effectively the implications of (i) pixels contaminated by clouds and/or their shadows and (ii) phenology differences among RS images. Based on the thresholds greater than 95% logging forest samples in frequency distribution histogram, the mDI threshold of 5.13 and >1.6 between adjacent years were used to detect increased logging areas.
Given the emphasis that we place on first and secondary forest logging, which correspond to the largest and second-largest magnitudes of mDI during 1988–2011, respectively, tertiary and subsequent logging were extremely rare and therefore are ignored in this study. Secondary logging was the further removal of surviving burned trees by local managers for economic benefits (China Forestry Publishing House Citation1987). We account for secondary logging because this ongoing element of forest dynamics is often underestimated. To reduce salt-and-pepper noise, which is caused by mixed pixels and environmental noise, we applied a nine-pixel minimum mapping unit to the annual forest-logging maps: patches smaller than nine pixels were eliminated and reclassified as non-logged; note that the resulting annual forest-logging maps contained both clear-cut logging and low-intensity logging.
3.3.4. Accuracy assessment
To assess comprehensively the accuracy of post-fire forest-logging mapping, we used stratified random sampling of pixels representing logged and non-logged forest areas to generate independent validation data (Olofsson et al. Citation2014), of which the logged forest areas included both first and secondary logged ones. In terms of reference data, time-series Landsat images were the only available data because of the lack of high-resolution images from Google Earth (GE) for the 1980s and 1990s. Similar to the TimeSync approach developed by Cohen, Yang, and Kennedy (Citation2010), we visually interpreted reference data derived from multi-date Landsat images in combination with original spectral bands, NBR and TCW. Visual interpretation of forest logging used the fact that the boundaries of forests are clear-cut and abrupt, contain homogeneous landscape, and have regular shapes rather than the feathered ones of many natural disturbances (Franklin, Mitchell, and Palik Citation2007). Furthermore, logged areas are usually near roads, and the latter can also be used to identify the former. Therefore, 300 test samples were randomly selected in each stratum, for a total of 600 samples. The visually interpreted results of the validation data were used to establish error matrices, and then user’s accuracy (UA), producer’s accuracy (PA), and overall accuracy (OA) were calculated as
where is the total number of correctly classified test samples,
is the total number of test samples,
is the observation in row
and column
in the confusion matrix,
is the marginal total of row
, and
is the marginal total of column
.
3.4. Characterizing post-fire vegetation-recovery dynamics of different recovery patterns
3.4.1. Differentiating the recovery patterns of the post-fire forest
Burn severity, BL management, and active forest restoration influence the dominant species of post-fire forest recovery and then change the forest succession and composition (Cai et al. Citation2013; Franklin and MacMahon Citation2000). To understand post-fire vegetation-recovery dynamics comprehensively, the recovery patterns were differentiated by whether salvage logging and active forest restoration strategies were carried out under different burn severities (). Combined with burn severity, BL management, and active forest restoration, there are 10 categories of recovery patterns comprising each unique hybrid category determined in for evaluating vegetation-recovery dynamics. There was very little active forest restoration in the study area, except for high-severity areas. Unburned areas were used as control groups to reflect the individual impacts of fire and forest logging on the recovery dynamics.
Figure 4. The rules employed for distinguishing recovery patterns based on the implementation of forest logging and active forest restoration strategies.
Table 1. Categories describing fire, forest logging, and recovery approaches.
In this study, we evaluate the recovery process in the monotonic recovery stage, which represents vegetation beginning to recover after the last disturbance. Because it is difficult to determine the start date of active forest restoration strategies from forest inventory data, we assume that they happened immediately after forest logging.
3.4.2. Proportion and rate of forest recovery in each recovery pattern
Forest recovery is a long-term process, especially in the northernmost part of the Greater Hinggan Mountain area with its short growing season and slow succession (Cai et al. Citation2013). Therefore, what is needed is a spectral index with the capacity to monitor long-term vegetation recovery and relate it to forest succession. Some vegetation indices (e.g. NDVI, TCG) capture few indications of the entire recovery process except in the early stage of forest succession (Pickell et al. Citation2016). By contrast, DI (Healey et al. Citation2005) integrates the normalized brightness, greenness, and wetness components of the tasseled-cap transformation [,
, and
in Equationequation (5)
(5)
(5) ] and reflects the normalized spectral distance of certain pixels from mature forests, and so DI should outperform NDVI and TCG in estimating long-term forest recovery and characterizing forest structure using the information of TCW and the SWIR band. The calculation formula is
where ,
, and
are the normalized brightness, greenness, and wetness components of the tasseled-cap transformation, respectively.
To characterize the post-fire vegetation-recovery dynamics of each recovery pattern, we calculate two types of metric for post-disturbance forest recovery, i.e. absolute ones and relative ones. First, the absolute measures of forest recovery from 1988 to 2011 are (i) the temporal trajectory of DI, (ii) the proportion of forest recovery, and (iii) the recovery rate derived from the proportion of forest recovery in a five-year interval. Following Griffiths et al. (Citation2014), we use the DI threshold of 3 for determining when closed-canopy forest is reached after disturbance. Figure S1 suggests that this threshold (DI < 3) proposed by Griffiths et al. (Citation2014) is also plausible for mapping closed-canopy forest in our study area. If the DI value of a pixel is less than 3 in two consecutive years (i.e. DIt<3 and DIt + 1<3), then we suggest that the disturbed forest has recovered to a closed-canopy one. However, given that phenology differences and environmental noise in Landsat scenes may lead to inconsistent results in adjacent years, we add the case that disturbed forest with DI < 3 in years t and t + 2 (DIt<3 and DIt + 2<3) is also deemed to have recovered. However, because the year 2011 is at the edge of the vegetation sequence, incomplete DI information resulted in an unavailable forest-recovery proportion in 2011.
Second, a relative measure of forest recovery defined by Kennedy et al. (Citation2012) is obtained at five-year intervals. The relative indicator (RI) is the percentage of recovery relative to the magnitude of the disturbance, which can better explain areas of lower-magnitude disturbances with more surviving vegetation (Kennedy et al. Citation2012). The disturbance magnitude for post-fire logged forests is defined as the difference between the last disturbance (forest logging) and the pre-disturbance DI values. The calculation formulas are
where is the DI value in the disturbance years, and
is the DI value in the pre/post-disturbance years.
4. Results
4.1. Accuracy assessment results
As shown in Figure S2, mDI offers significant distinguishing ability in the first year after a fire, with greater positive mDI values for pixels dominated by post-fire logged forest areas and either smaller positive or negative mDI values for pixels dominated by post-fire non-logged forest areas. The mDI values for stable forests are usually close to zero or slightly negative. The larger the mDI value, the higher the possibility of forest logging, while the smaller the mDI value, the higher the possibility of fire.
The accuracy of the results shows the reliability of using an mDI threshold and image differencing to detect post-fire forest logging. gives the results of visual interpretation for independent test samples of logged and non-logged forest areas. The OA of forest logging in 1988–2011 is 85%. Specifically, non-logged forest areas have the highest UA of 88.0%, and logged forest areas have the highest PA of 87.2%. Some logged forest areas occurred outside the date range of the composited imagery and were captured one year after actual occurrence. When this was taken into account, the UA and PA of logged forest areas reached 83.7% and 86.0%, respectively. Besides, our method achieved a high UA at different burn severities (Table S1). Logged forests in unburned areas had the highest UA of 88.9%, followed by high severity, low severity, and moderate severity. Mixed pixels of logged forest areas caused by forest logging with low intensity were the main reason for the commission error of first logged forest areas and the omission error of non-logged forest areas, with a partially intact canopy cover and forest structure retained in these pixels after logging; they were also often confused with environmental noise, such as residual cloud and cloud shadow (Nguyen et al. Citation2018). The main reason for the commission error of secondary logged forest areas was early image-acquisition time in a certain year leading to abruptly increased mDI values.
Table 2. Accuracy error matrices of forest logging extracted by the methods of mDI threshold and image differencing, according to visually interpreted testing samples in 1988–2011.
4.2. Dynamic characteristics of forest logging in 1986–2011
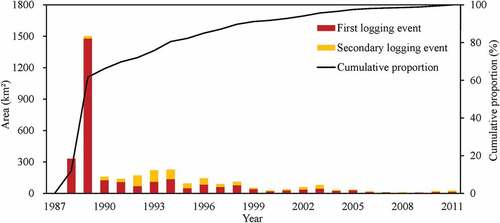
From 1988 to 2011, 3612.4 km2 of the study area in the northernmost part of the Greater Hinggan Mountain area were disturbed by forest logging, comprising 2933.5 km2 from first logging (accounting for 28.5% of the total forest area) and 678.9 km2 from secondary logging (accounting for 6.6% of the total forest area) (see Table S2). Therefore, the area from first logging was 4.3 times that from secondary logging, with the former peaking at 1480.0 km2 in 1989, when it accounted for ca. 41.0% of the total logged area (). Clear-cutting was the main disturbance type in 1989, accompanied by low-intensity logging (). The secondary forest logging was conducted mainly in 1992–1994, with the largest logged area of 108.4 km2 in 1993, which accounted for 44.6% of the secondary logged area (Table S2). Note that the secondary forest logging was often followed by artificial intervention procedures, corresponding to clearing regenerated understory vegetation and saplings of early succession species (e.g. Birch) before artificial seeding or planting. Temporally, the main period of forest logging was 1988–1998, accounting for ca. 88.2% of the total logged area, with other years having less than 80 km2 of forest logging. The logged area has decreased significantly since 1999, which can be attributed to the implementation of the Natural Forest Protection Program in 1998 ().
Figure 5. Logging map of 5.6 Fire burn area in the northernmost part of the Greater Hinggan Mountain area in 1988–2011. (Three details of post-fire first and secondary logging were indicated by the red frames: A – B shows post-fire logging in 1988 and 1989, respectively, and C shows secondary logging in 1993. The Landsat 5 TM images are shown with bands 3, 2, and 1 as RGB).
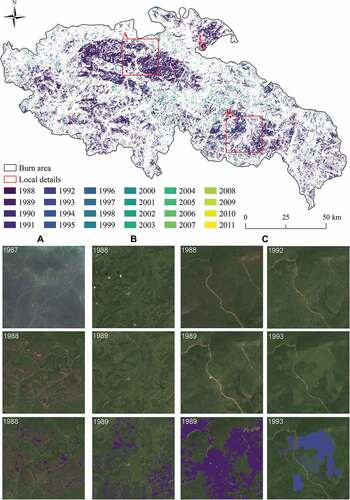
Figure 6. Annual first logged areas, secondary logged areas, and cumulative proportions of the northernmost part of the Greater Hinggan Mountain area in 1988–2011.
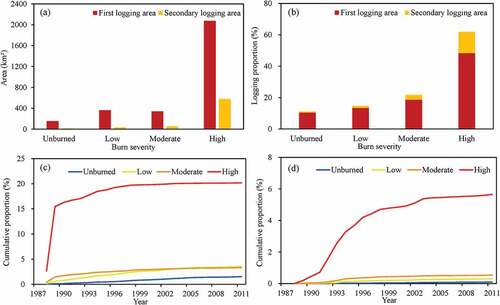
To reveal the influence of forest logging for each burn severity, we summarize the total area, proportion, and annual area of forest logging in and Table S3, as well as the cumulative proportions of first and secondary forest logging from 1988 to 2011 for each burn severity in . As can be seen, the forest logging area varies with burn severity, with more than 2655.3 km2 (accounting for 73.5% of the total logged area) occurring in high-severity areas, followed by moderate-severity, low-severity, and unburned areas (). High-severity areas accounted for a high proportion of both first and secondary forest logging. Regarding the logged proportion for each burn severity, those of high-severity (61.9%) and moderate-severity (21.7%) areas were significantly higher than those of the other two areas. Temporally, the majority of first forest logging in the moderate- and high-severity areas was between 1988 and 1989, and these two years accounted respectively for 59.8% and 38.0% of the forest logging in these areas (), indicating that heavily burned forest areas experienced large-scale forest logging during this period. Little first forest logging occurred after 1998 in the moderate- and high-severity areas, while low-severity and unburned areas maintained a small and steady annual logged area between 1988 and 2011. The majority of the secondary forest logging in the high-severity areas was between 1990 and 1998, and there was basically no increase in secondary forest logging after 1998, as with first forest logging (). Moreover, other areas had less secondary forest logging.
Figure 7. Total logged areas (a), logged proportion of respective burn area (b), and cumulative proportion from 1988 to 2011 (c–d) of the first and secondary forest logging in each burn severity.
4.3. Characterizing post-disturbance vegetation-recovery dynamics for each recovery pattern
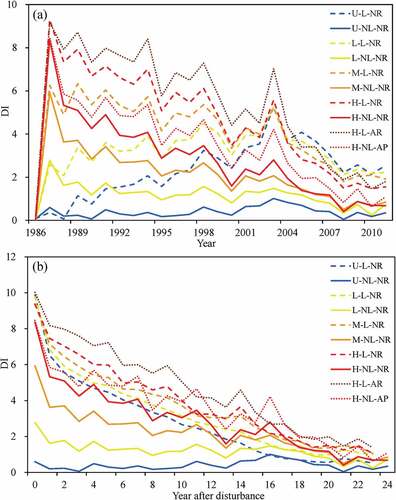
shows the spatial distribution of vegetation-recovery dynamics in the northernmost part of the Greater Hinggan Mountain area after fire and forest logging. shows high DI values in 1988–1998 caused by forest logging, which may obscure the recovery of non-logged forest areas that underwent natural regeneration in previous studies, thereby leading to biased assessment. Therefore, with comprehensive and accurate time-series vegetation information, we elaborate the recovery-dynamics characteristics of disturbed forests in each recovery pattern from 1986 to 2011. shows the post-disturbance temporal trajectory of DI values for several recovery patterns since the disturbance year. As can be seen, the DI values in the early recovery stage increase with increasing burn severity, which indicates varying degrees of damage to the forest structure. For all disturbed forest areas, the DI values decrease rapidly within years 1–3, which can be attributed to the rapid regrowth of understory plant communities or the restoration of trees that survived fires. Compared with the forest areas that only experienced fire events, the post-fire logged forest areas have larger DI values during years 1–10, which indicates that clear-cutting BLs can reduce structural complexity and cause habitat condition to decline in the early succession. From year 11 after the disturbance, the trajectory of DI values for the post-fire logged forest areas gradually approaches those for the forest areas that suffered from a single fire disturbance. Note that H-L-AR has the largest DI values within years 1–10 in high-severity areas and then gradually approaches H-NL-NR after year 15. H-NL-AP has relatively low DI values close to those of H-NL-NR during years 1–10 and has a lower DI value than those of H-L-NR and H-L-AR in 2011, which reflects the fact that this pattern retained the heterogeneity of forest structure and composition to realize better recovery of canopy structure than did H-L-AR and H-L-AP. According to the DI values, none of the disturbed forest areas had reached the state of stable ones (U-NL-NR) by the end of the study period in 2011, and differences remained in structural complexity and compositional diversity between post-fire logged forest areas and those that had only suffered from fire.
Figure 8. Spatial distribution of the DI map in the burn area, showing on a pre-fire image (1986), fire image (1987), and post-fire images (1989, 1993, 1997, 2001, 2005, and 2011).
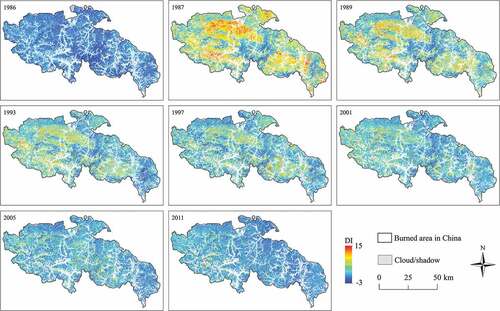
Figure 9. Temporal trajectory of DI value for each recovery patterns in 1988–2011 from the perspective of statistics by years (a) and year after disturbance (b). The acronyms were composed of three parts: the first part indicated burn severity, including unburned (U), low severity (L), moderate severity (M), and high severity (M); the second part indicated forest logging, including logged forest (L) and non-logged forest (NL); the third part indicated recovery approaches, including natural regeneration (NL), artificial regeneration (AR), and assisted natural regeneration (AP).
shows the spatial distribution of recovered forest areas in the northernmost part of the Greater Hinggan Mountain area after fire and forest logging. Furthermore, to discriminate the recovery of understory vegetation and forests, in we show the proportion of forest recovery in each recovery pattern from 1988 to 2010 using two years of DI information, and in we use the proportion of forest recovery in a five-year interval to reflect the recovery rate of each recovery pattern. Burn severity interacts with BL management and active forest restoration to affect the forest recovery rate at different stages. Salvage logging has a negative influence on natural regeneration in the early stage, and the proportion and rate of logged-forest recovery increase gradually with the improvement of habitat conditions ( and ). Forest logging in low-severity areas – L-L-NR areas – further damaged the BLs and forest structure, resulting in a lower rate and proportion of forest recovery during the entire recovery period. Instead, ca. 94% of the L-NL-NR areas recovered within years 1–5, attributed to the many trees still alive at a low disturbed magnitude of the fire. Unlike that of low-severity areas, the recovery proportions of moderate- and especially high-severity areas without forest logging (M-NL-NR and H-NL-NR) decrease significantly within years 1–5, indicating significant damage to forest structures and increased forest mortality, which in turn led to a low recovery proportion and rate in the early stage. As with L-L-NR, the addition of fire and forest logging decreases the proportions of forest recovery of M-L-NR, H-L-NR, and H-L-AR in year 1 compared with those of M-NL-NR and H-NL-NR. The areas disturbed by forest logging show significantly increased recovery proportion and rate after year 6 with the help of fast-growing tree species (e.g. White Birch) or active forest restoration. Because of the low disturbance to BLs, H-NL-AP has a relatively high recovery proportion and rate in years 1–5 compared to H-L-NR and H-L-AR and is second only to non-logged natural regeneration. In 2011, post-fire non-logged forest areas had higher recovery proportions than those of post-fire logged forest areas in different burn severities, with H-NL-NR having the largest recovery proportion (91.3%) in high-severity areas, followed by H-L-NR (84.3%), H-NL-AP (84.1%), and H-L-AR (78.7%). For high-severity areas with active forest restoration, H-L-AR has the best recovery rate in years 10–20 and a similar recovery proportion to that of non-logged natural regeneration as the recovery progresses. H-NL-AP maintains a stable and high recovery rate during the entire recovery period. Overall, more than 90% of the study area had DI values of less than 3 in 2011, indicating that the disturbed forest areas of the study area had recovered effectively.
Figure 10. Spatial distribution of recovered forests obtained by DI < 3 in burn area, showing on pre-fire image (1986), fire image (1987), and post-fire images (1989, 1993, 1997, 2001, 2005, and 2011).
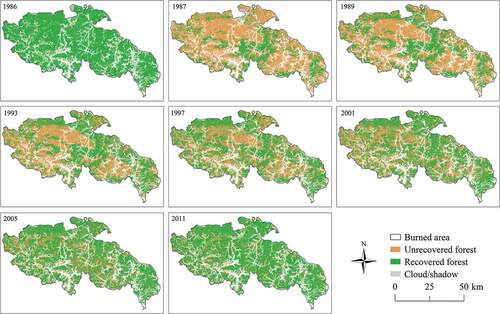
Figure 11. Cumulative proportion of each recovery pattern that has reached forest recovery in 1988–2011. The acronyms were composed of three parts: the first part indicated burn severity, including unburned (U), low severity (L), moderate severity (M), and high severity (M); the second part indicated forest logging, including logged forest (L) and non-logged forest (NL); the third part indicated recovery approaches, including natural regeneration (NL), artificial regeneration (AR), and assisted natural regeneration (AP).
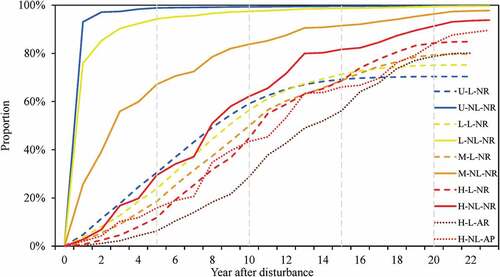
Table 3. The proportion of forest recovery in each recovery pattern at a five-year interval.
We generate a forest-recovery RI in a five-year interval by scaling the recovery with the magnitude of disturbance. suggests that except for low-severity areas, post-fire non-logged forest areas of each burn severity have higher RI in years 1–5, and post-fire logged forest areas have higher RI in years 6–20. With increasing burn severity, the RI values of both post-fire non-logged and logged forest areas decrease in years 1–5 (except for L-NL-NR). As with the proportion of forest recovery, H-NL-AP has relatively high RI in years 1–5 compared to H-L-NR and H-L-AR and is second only to H-NL-NR. Compared with H-NL-NP and H-L-NR respectively, H-NL-AP and H-L-AR have higher RI in years 6–20. Overall, the RI values for each recovery pattern are generally consistent with the proportion of forest recovery in a five-year interval. indicates the dominant species in the areas follow by active forest restoration is Dahurian larch, whereas the dominant species in other areas is birch. In addition, the proportion of Dahurian larch in the areas underwent post-fire forest logging has decreased compared with non-logged areas.
Figure 12. The proportion of dominant species in each recovery pattern by forest inventory data in 2018.
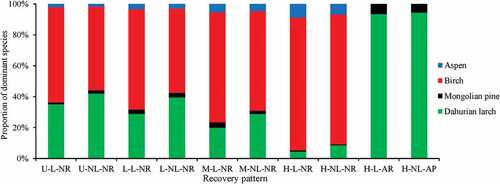
Table 4. The proportion of relative forest recovery in each recovery pattern at a five-year interval.
5. Discussion
Understanding interactions between multiple disturbance agents and subsequent recovery approaches is crucial for long-term carbon sequestration and sustainable development of forest ecosystems (Nguyen et al. Citation2018; Kennedy et al. Citation2015; Pan et al. Citation2011). As highlighted in previous studies, the complex interactions among burn severity, BL management, and active forest restoration generate spatial heterogeneity of disturbed forests and further affect the process of ecological recovery in structural complexity and compositional diversity (Franklin and MacMahon Citation2000; Franklin, Mitchell, and Palik Citation2007). In the present study, we proposed the new mDI based on signature discrepancies of the normalized brightness () and wetness (
) components between fire and forest logging. Then, with the method of mDI threshold and image differencing and with Landsat time series from GEE, we detected the spatiotemporal distribution of post-fire forest logging. To improve the understanding of interaction effects, we differentiated the recovery patterns and examined the variability in recovery trends of them by means of DI at landscape scale. Our results offer a scientific basis for choosing natural-regeneration or active-restoration approaches to post-fire forest recovery. In the presence of sufficient larch seed trees, natural regeneration allows for forest recovery while maintaining the complexity of the forest structure (Juchun Citation2002; Wang et al. Citation2003). However, coniferous trees tend to recover slowly under natural conditions in areas of high severity that lack seed trees, and active-restoration approaches can accelerate forest regeneration by tree planting or artificial seeding (Chu, Guo, and Takeda Citation2016; Li et al. Citation2006).
Accurate and comprehensive forest-disturbance mapping of multiple disturbance agents provides important information for forest managers to carry out effective management and conservation strategies (Nguyen et al. Citation2018; White et al. Citation2017). Conventional methods of mapping multiple disturbance agents rely on change-detection algorithms, which can smooth some change characteristics in time-series information and lead to an underestimation of the magnitude and frequency of disturbances (Hermosilla et al. Citation2015; Kennedy et al. Citation2015; Nguyen et al. Citation2018). Nevertheless, few previous studies have focused on post-fire forest logging by RS approaches (Schroeder et al. Citation2012), and existing methods of mapping multiple disturbance agents struggle to detect consecutive disturbance events subject to stand replacement (Zhu Citation2017). Moreover, it is easier to detect stand-replacement disturbances than low-severity events with optical satellite data (Nguyen et al. Citation2018). Although numerous vegetation indices have been used to characterize post-disturbance recovery (Chu and Guo Citation2013), our mDI incorporates disturbance mapping and disturbance-agent attribution, which conventional spectral vegetation indices and change-detection algorithms cannot achieve. Even with a conservative threshold of mDI and , our method achieved an OA of 85% in post-fire forest detection. However, note that post-fire forest logging may be more widespread than we have assessed because of the presence of forest logging with low intensity. Our results are consistent with those of other studies that showed that large-scale post-fire forest logging was conducted mainly in the high-severity areas and peaked in 1989, preventing economic losses resulting from insect damage to burned wood (Li et al. Citation2006; Xu Citation1998). Such management interventions create a more homogeneous post-fire environment (Franklin, Mitchell, and Palik Citation2007), amplifying erosion risk, increasing ground temperature (Leverkus et al. Citation2021), and hindering regeneration (Donato et al. Citation2006).
Forest recovery is a complicated and essential ecological process influenced by many factors, such as site condition, burn severity, seed availability, and artificial management (Chu and Guo Citation2013). Time series of optical satellite imagery (e.g. Landsat) are now the primary data source for monitoring forest recovery capacity over various ecosystems (Griffiths et al. Citation2014; Nguyen et al. Citation2018; White et al. Citation2017). In addition to optical remote sensing data, SAR (spaceborne synthetic aperture radar) and LiDAR (light detection and ranging) imagery has been shown to be sensitive to forest canopy structure, which provides a more comprehensive characterization of different forest successional stages (Chu and Guo Citation2013; Tanase et al. Citation2011). Previous studies have assessed recovery differences of each burn severity or between natural regeneration and active forest restoration by years (Chen et al. Citation2014a; Chu, Guo, and Takeda Citation2016; Li et al. Citation2006), but they ignored the impact of post-fire logging on the trajectory and proportion of forest recovery, causing great fluctuation in temporal trajectory and masking the real signal of vegetation recovery. Our results indicate that using multiple indices for which SWIR bands are dominant can provide an indication of changing forest structural complexity after multiple disturbances have occurred. In the present study, the initial conditions were altered significantly by burn severity, BL management, and active forest restoration, thereby influencing the future pattern of recovery after fire for decades (Johnstone et al. Citation2004). Unlike previous studies that attributed the slow recovery trend of the post-fire forest simply to the tree mortality caused by a single fire event (Chen et al. Citation2014a; Chu, Guo, and Takeda Citation2016; Li et al. Citation2006), our results show that post-fire forest logging was the true reason for the high DI in 1988–1998 and the low recovery rate of some post-fire forest areas in years 1–5 of the post-fire period ( and ), thereby enhancing the understanding of post-fire forest dynamics at landscape scale in the Greater Hinggan Mountain area. Salvage logging led to loss of BLs and worsened habitat conditions, including seed trees surviving from the fire, seed banks, standing dead trees, snags, and associated woody debris, all of which reduced the soil moisture content and delayed the development of coniferous trees in the early succession (Leverkus et al. Citation2021; Juchun Citation2002; Xu Citation1998). Hence, the loss of valuable BLs led to (i) a lower recovery rate in the early stage than that after a single fire disturbance and (ii) convergence toward early successional species (birch) (Wang et al. Citation2003; Xu Citation1998). From our results (), we conclude that regardless of the burn severity of a fire, forest managers must avoid extensive salvage clear-cutting of BLs, which is driven by economic rather than ecological goals.
Differences in the initial conditions of the post-fire forest exert a long-term influence on the species composition of a boreal forest (Brandt et al. Citation2013; Franklin and MacMahon Citation2000; Pan et al. Citation2011). Consistent with previous work (Cai et al. Citation2013; Wang et al. Citation2003), the low post-fire mortality in low-severity areas can assist in rapid recovery of mixed forests of broadleaf trees and coniferous trees, and thus natural regeneration is suitable for these areas (Wang et al. Citation2003; Wang, Wang, and Zang Citation2017). Nevertheless, in the present case, the high post-fire mortality resulting from the 5.6 Fire and the damage to surviving coniferous trees resulting from salvage logging in moderate- and high-severity areas hindered the recovery of coniferous trees (Wang et al. Citation2003; Wang, Wang, and Zang Citation2017). They were replaced by the dominant broadleaf tree species (birch) in the early succession (), causing significant decreases in recovery rate and above-ground biomass. The proportion of dominant larch populations in the Greater Hinggan Mountain area has declined significantly after nearly a century of harvesting (Xu Citation1998; Zhou Citation1991), and it may require decades or even centuries to regenerate the conifer population through natural regeneration. Our results suggest that post-fire non-logged areas followed by natural regeneration have the highest proportion of forest recovery. Previous studies have found that a great number of young birch seedlings sprouted in high-severity areas three years after the fire (Wang et al. Citation2003). Natural regeneration can rapidly achieve a higher vertical density of vegetation canopy because of the sprouting branches and lighter seeds of broadleaf trees (Chen et al. Citation2014b; Wang et al. Citation2003). Assisted natural regeneration achieved a higher recovery rate in the early stage and better overall recovery effects than did artificial regeneration because of maintaining the structural heterogeneity within a stand. Artificial regeneration had a low recovery rate in years 1–5 because of salvage logging, which could be attributed to the relatively slow growth of coniferous trees (Dahurian larch) planted by people in the early stage of forest succession (Chen et al. Citation2014b). However, it approached the recovery proportion of natural regeneration as the recovery progressed and habitat conditions improved, especially in terms of the greater recovery rate in years 10–20. Both approaches have great advantages in increasing the productivity of the coniferous population by tree planting or promoting seed germination (Great Hinggan Mountain Forest Corporation Citation1997; Wang et al. Citation2003). Therefore, because of more-frequent fire events as the climate changes (Robinne et al. Citation2018), forest managers should balance ecological services and regeneration potential while incorporating greater heterogeneity in stand structure and composition by protecting BLs and promoting conifer seedling regeneration artificially (Chu, Guo, and Takeda Citation2016; Franklin, Mitchell, and Palik Citation2007; Juchun Citation2002).
In future work, several approaches could be used to improve RS mapping of post-fire forest dynamics. First, we considered only fire and forest logging in our mDI, with other low-severity disturbances such as insects, windthrow, and drought still not being addressed in mapping multiple disturbance agents; therefore, more differences in the spectral signatures of disturbances should be explored. Also, using the moderate-resolution Landsat archive may neglect mixed logging pixels attributed to forest logging with low intensity, and the description of forest dynamics would be improved by using satellite data with higher spatial resolution (e.g. Sentinel-2).
6. Conclusion
In this study, by proposing a new modified forest-disturbance index (mDI), we mapped consecutive stand-replacement disturbances usually underestimated by common change-detection algorithms and identified the spatiotemporal distribution of post-fire forest logging. Using Landsat images in the GEE platform, we integrated burn severity, BL management, and active forest restoration to characterize the recovery dynamics in each recovery pattern. Our study showed that using multiple indices is expected to characterize forest structural complexity after multiple disturbances have occurred. After the 5.6 Fire, large-scale BLs were clear-cut, which peaked in the second year after the fire and was concentrated in moderate- and high-severity areas. Post-fire forest logging explained the fluctuation and high DI of the conventional temporal trajectory and the slow rate of forest recovery in the early stage of forest recovery. In areas of high burn severity, although non-logged natural regeneration realized the highest recovery proportion of forest, assisted natural regeneration also achieved a high recovery rate in the early stage and a high forest-recovery proportion. Salvage logging followed by artificial regeneration was advantageous in terms of recovery rate in years 10–20 and approached the recovery proportion of non-logged natural regeneration as the recovery progressed. Both assisted natural regeneration and artificial regeneration outperformed natural regeneration in regenerating the coniferous population, with assisted natural regeneration being preferable in moderate- and high-severity areas. Ultimately, maintaining the structural and compositional heterogeneity of forest development requires both appropriate protection of BLs and active forest restoration.
Supplemental Material
Download Zip (36.9 MB)Data availability statement
Google Earth Engine (https://code.earthengine.google.com/) is a free and open platform. All data, models, and code generated and/or used during this study are available from the corresponding author upon request.
Disclosure statement
The authors declare that they have no known competing financial interests or personal relationships that could have appeared to influence the work reported in this paper.
Supplementary material
Supplemental data for this article can be accessed online at https://doi.org/10.1080/15481603.2023.2188674
Additional information
Funding
References
- Anderson-Teixeira, K. J., A. D. Miller, J. E. Mohan, T. W. Hudiburg, B. D. Duval, and E. H. DeLucia. 2013. “Altered Dynamics of Forest Recovery Under a Changing Climate.” Global Change Biology 19: 2001–22. doi:10.1111/gcb.12194.
- Bar, S., B. R. Parida, G. Roberts, A. C. Pandey, P. Acharya, and J. Dash. 2021. “Spatio-Temporal Characterization of Landscape Fire in Relation to Anthropogenic Activity and Climatic Variability Over the Western Himalaya, India.” GIScience & Remote Sensing 58: 281–299. doi:10.1080/15481603.2021.1879495.
- Bartels, S. F., H. Y. Chen, M. A. Wulder, and J. C. White. 2016. “Trends in Post-Disturbance Recovery Rates of Canada’s Forests Following Wildfire and Harvest.” Forest Ecology and Management 361: 194–207. doi:10.1016/j.foreco.2015.11.015.
- Bonan, G. B., and H. H. Shugart. 1989. “Environmental Factors and Ecological Processes in Boreal Forests.” Annual Review of Ecology and Systematics 20: 1–28. doi:10.1146/annurev.es.20.110189.000245.
- Bond, W. J., and J. E. Keeley. 2005. “Fire as a Global ‘Herbivore’: The Ecology and Evolution of Flammable Ecosystems.” Trends in Ecology & Evolution 20: 387–394. doi:10.1016/j.tree.2005.04.025.
- Bowman, D. M., J. K. Balch, P. Artaxo, W. J. Bond, J. M. Carlson, M. A. Cochrane, C. M. D’antonio, R. S. DeFries, J. C. Doyle, and S. P. Harrison. 2009. “Fire in the Earth System.” Science 324: 481–484. doi:10.1126/science.1163886.
- Brandt, J. P., M. Flannigan, D. Maynard, I. Thompson, and W. Volney. 2013. “An Introduction to Canada’s Boreal Zone: Ecosystem Processes, Health, Sustainability, and Environmental Issues.” Environmental Reviews 21: 207–226. doi:10.1139/er-2013-0040.
- Cai, W., J. Yang, Z. Liu, Y. Hu, and P. J. Weisberg. 2013. “Post-Fire Tree Recruitment of a Boreal Larch Forest in Northeast China.” Forest Ecology and Management 307: 20–29. doi:10.1016/j.foreco.2013.06.056.
- Chen, W., K. Moriya, T. Sakai, L. Koyama, and C. Cao. 2014a. “Monitoring of Post-Fire Forest Recovery Under Different Restoration Modes Based on Time Series Landsat Data.” European Journal of Remote Sensing 47: 153–168. doi:10.5721/EuJRS20144710.
- Chen, W., K. Moriya, T. Sakai, L. Koyama, and C. Cao. 2014b. “Post-Fire Forest Regeneration Under Different Restoration Treatments in the Greater Hinggan Mountain Area of China.” Ecological Engineering 70: 304–311. doi:10.1016/j.ecoleng.2014.06.016.
- China Forestry Publishing House. (1987). Integrated Investigation Report of Forest Resources Restoration and Ecological Environment of Great Hinggan Mountain Fire Disaster Area (In Chinese).
- China Meteorological Administration. (2022). China Meteorological Data Sharing Service System. Accessed June 1 2022. https://data.cma.cn/dataService/cdcindex/datacode/SURF_CLI_CHN_MUL_MYER_19812010/show_value/normal.html.
- Chu, T., and X. Guo. 2013. “Remote Sensing Techniques in Monitoring Post-Fire Effects and Patterns of Forest Recovery in Boreal Forest Regions: A Review.” Remote Sensing 6: 470–520. doi:10.3390/rs6010470.
- Chu, T., X. Guo, and K. Takeda. 2016. “Remote Sensing Approach to Detect Post-Fire Vegetation Regrowth in Siberian Boreal Larch Forest.” Ecological Indicators 62: 32–46. doi:10.1016/j.ecolind.2015.11.026.
- Cohen, W. B., and S. N. Goward. 2004. “Landsat’s Role in Ecological Applications of Remote Sensing.” Bioscience 54: 535–545. doi:10.1641/0006-3568(2004)054[0535:LRIEAO]2.0.CO;2.
- Cohen, W. B., Z. Yang, and R. Kennedy. 2010. “Detecting Trends in Forest Disturbance and Recovery Using Yearly Landsat Time Series: 2. TimeSync—tools for Calibration and Validation.” Remote Sensing of Environment 114: 2911–2924. doi:10.1016/j.rse.2010.07.010.
- Crist, E. P., and R. C. Cicone. 1984. “A Physically-Based Transformation of Thematic Mapper Data—the TM Tasseled Cap.” IEEE Transactions on Geoscience and Remote Sensing GE-22: 256–263. doi:10.1109/TGRS.1984.350619.
- Cuevas‐gonzález, M., F. Gerard, H. Balzter, and D. Riano. 2009. “Analysing Forest Recovery After Wildfire Disturbance in Boreal Siberia Using Remotely Sensed Vegetation Indices.” Global Change Biology 15: 561–577. doi:10.1111/j.1365-2486.2008.01784.x.
- de Groot, W. J., M. D. Flannigan, and A. S. Cantin. 2013. “Climate Change Impacts on Future Boreal Fire Regimes.” Forest Ecology and Management 294: 35–44. doi:10.1016/j.foreco.2012.09.027.
- DeVries, B., M. Decuyper, J. Verbesselt, A. Zeileis, M. Herold, and S. Joseph. 2015. “Tracking Disturbance-Regrowth Dynamics in Tropical Forests Using Structural Change Detection and Landsat Time Series.” Remote Sensing of Environment 169: 320–334. doi:10.1016/j.rse.2015.08.020.
- DFPRC (Department of Forestry of PR China). 1994. Statistics of China’s Forest Resources (1989–93). Beijing: Department of Forestry of PR China.
- Didham, R. K., J. M. Tylianakis, N. J. Gemmell, T. A. Rand, and R. M. Ewers. 2007. “Interactive Effects of Habitat Modification and Species Invasion on Native Species Decline.” Trends in Ecology & Evolution 22: 489–496. doi:10.1016/j.tree.2007.07.001.
- Donato, D., J. B. Fontaine, J. Campbell, W. Robinson, J. Kauffman, and B. E. Law. 2006. “Post-Wildfire Logging Hinders Regeneration and Increases Fire Risk.” Science 311: 352. doi:10.1126/science.1122855.
- Foody, G. M. 2002. “Status of Land Cover Classification Accuracy Assessment.” Remote Sensing of Environment 80: 185–201. doi:10.1016/S0034-4257(01)00295-4.
- Franklin, J. F., and J. A. MacMahon. 2000. “Messages from a Mountain.” Science 288: 1183–1184. doi:10.1126/science.288.5469.1183.
- Franklin, J. F., R. J. Mitchell, and B. J. Palik. 2007. Natural Disturbance and Stand Development Principles for Ecological Forestry. Gen. Tech. Rep. NRS-19. Newtown Square, PA: US Department of Agriculture, Forest Service, Northern Research Station. 44 p., 19.
- Frazier, R. J., N. C. Coops, and M. A. Wulder. 2015. “Boreal Shield Forest Disturbance and Recovery Trends Using Landsat Time Series.” Remote Sensing of Environment 170: 317–327. doi:10.1016/j.rse.2015.09.015.
- Goetz, S. J., G. J. Fiske, and A. G. Bunn. 2006. “Using Satellite Time-Series Data Sets to Analyze Fire Disturbance and Forest Recovery Across Canada.” Remote Sensing of Environment 101: 352–365. doi:10.1016/j.rse.2006.01.011.
- Great Hinggan Mountain Forest Corporation. 1997. Tenth Anniversary of Forest Resources Restoration and Ecological Environment of Great Hinggan Mountain Fire Disaster Area (1987-1997) (In Chinese).
- Griffiths, P., T. Kuemmerle, M. Baumann, V. C. Radeloff, I. V. Abrudan, J. Lieskovsky, C. Munteanu, K. Ostapowicz, and P. Hostert. 2014. “Forest Disturbances, Forest Recovery, and Changes in Forest Types Across the Carpathian Ecoregion from 1985 to 2010 Based on Landsat Image Composites.” Remote Sensing of Environment 151: 72–88. doi:10.1016/j.rse.2013.04.022.
- Healey, S. P., W. B. Cohen, Y. Zhiqiang, and O. N. Krankina. 2005. “Comparison of Tasseled Cap-Based Landsat Data Structures for Use in Forest Disturbance Detection.” Remote Sensing of Environment 97: 301–310. doi:10.1016/j.rse.2005.05.009.
- Hermosilla, T., M. A. Wulder, J. C. White, and N. C. Coops. 2019. “Prevalence of Multiple Forest Disturbances and Impact on Vegetation Regrowth from Interannual Landsat Time Series (1985–2015).” Remote Sensing of Environment 233: 111403. doi:10.1016/j.rse.2019.111403.
- Hermosilla, T., M. A. Wulder, J. C. White, N. C. Coops, and G. W. Hobart. 2015. “Regional Detection, Characterization, and Attribution of Annual Forest Change from 1984 to 2012 Using Landsat-Derived Time-Series Metrics.” Remote Sensing of Environment 170: 121–132. doi:10.1016/j.rse.2015.09.004.
- Huang, Z., C. Cao, W. Chen, M. Xu, Y. Dang, R. P. Singh, B. Bashir, B. Xie, and X. Lin. 2020. “Remote Sensing Monitoring of Vegetation Dynamic Changes After Fire in the Greater Hinggan Mountain Area: The Algorithm and Application for Eliminating Phenological Impacts.” Remote Sensing 12: 156. doi:10.3390/rs12010156.
- Huang, C., S. N. Goward, J. G. Masek, N. Thomas, Z. Zhu, and J. E. Vogelmann. 2010. “An Automated Approach for Reconstructing Recent Forest Disturbance History Using Dense Landsat Time Series Stacks.” Remote Sensing of Environment 114: 183–198. doi:10.1016/j.rse.2009.08.017.
- Johnson, E. A. 1992. Fire and Vegetation Dynamics: Studies from the North American Boreal Forest. Cambridge, UK: Cambridge University Press.
- Johnstone, J. F., F. Chapin Iii, J. Foote, S. Kemmett, K. Price, and L. Viereck. 2004. “Decadal Observations of Tree Regeneration Following Fire in Boreal Forests.” Canadian Journal of Forest Research 34: 267–273. doi:10.1139/x03-183.
- Juchun, L. 2002. “Influence of forest fire disaster on forest ecosystem in Great Xing’anling.” Journal of Beijing Forestry University 24: 101–107.
- Keane, R. E., J. K. Agee, P. Fule, J. E. Keeley, C. Key, S. G. Kitchen, R. Miller, and L. A. Schulte. 2008. “Ecological Effects of Large Fires on US Landscapes: Benefit or Catastrophe? A” International Journal of Wildland Fire 17: 696–712. doi:10.1071/WF07148.
- Kennedy, R. E., Z. Yang, J. Braaten, C. Copass, N. Antonova, C. Jordan, and P. Nelson. 2015. “Attribution of Disturbance Change Agent from Landsat Time-Series in Support of Habitat Monitoring in the Puget Sound Region, USA.” Remote Sensing of Environment 166: 271–285. doi:10.1016/j.rse.2015.05.005.
- Kennedy, R. E., Z. Yang, and W. B. Cohen. 2010. “Detecting Trends in Forest Disturbance and Recovery Using Yearly Landsat Time Series: 1. LandTrendr—temporal Segmentation Algorithms.” Remote Sensing of Environment 114: 2897–2910. doi:10.1016/j.rse.2010.07.008.
- Kennedy, R. E., Z. Yang, W. B. Cohen, E. Pfaff, J. Braaten, and P. Nelson. 2012. “Spatial and Temporal Patterns of Forest Disturbance and Regrowth Within the Area of the Northwest Forest Plan.” Remote Sensing of Environment 122: 117–133. doi:10.1016/j.rse.2011.09.024.
- Lambert, J., C. Drenou, J. -P. Denux, G. Balent, and V. Cheret. 2013. “Monitoring Forest Decline Through Remote Sensing Time Series Analysis.” GIScience & Remote Sensing 50: 437–457. doi:10.1080/15481603.2013.820070.
- Langmann, B., B. Duncan, C. Textor, J. Trentmann, and G. R. Van Der Werf. 2009. “Vegetation Fire Emissions and Their Impact on Air Pollution and Climate.” Atmospheric Environment 43: 107–116. doi:10.1016/j.atmosenv.2008.09.047.
- Lentile, L. B., Z. A. Holden, A. M. Smith, M. J. Falkowski, A. T. Hudak, P. Morgan, S. A. Lewis, P. E. Gessler, and N. C. Benson. 2006. “Remote Sensing Techniques to Assess Active Fire Characteristics and Post-Fire Effects.” International Journal of Wildland Fire 15: 319–345. doi:10.1071/WF05097.
- Leverkus, A. B., B. Buma, J. Wagenbrenner, P. J. Burton, E. Lingua, R. Marzano, and S. Thorn. 2021. “Tamm Review: Does Salvage Logging Mitigate Subsequent Forest Disturbances?” Forest Ecology and Management 481: 118721. doi:10.1016/j.foreco.2020.118721.
- Lindenmayer, D. B., and J. F. Franklin. 2002. Conserving Forest Biodiversity: A Comprehensive Multiscaled Approach. Washington DC, USA: Island press.
- Liu, G. 2001. Chronicles of the Great Hinggan Mountain. Beijing: Fangzhi Publishing Press.
- Li, X., F. Xie, X. Wang, and F. Kong. 2006. “Human Intervened Post-Fire Forest Restoration in the Northern Great Hing’an Mountains: A Review.” Landscape and Ecological Engineering 2: 129–137. doi:10.1007/s11355-006-0010-z.
- Loboda, T. V., N. H. French, C. Hight-Harf, L. Jenkins, and M. E. Miller. 2013. “Mapping Fire Extent and Burn Severity in Alaskan Tussock Tundra: An Analysis of the Spectral Response of Tundra Vegetation to Wildland Fire.” Remote Sensing of Environment 134: 194–209. doi:10.1016/j.rse.2013.03.003.
- Masek, J. G., E. F. Vermote, N. E. Saleous, R. Wolfe, F. G. Hall, K. F. Huemmrich, F. Gao, J. Kutler, and T. -K. Lim. 2006. “A Landsat Surface Reflectance Dataset for North America, 1990-2000.” IEEE Geoscience and Remote Sensing Letters 3: 68–72. doi:10.1109/LGRS.2005.857030.
- Mitchell, M., and F. Yuan. 2010. “Assessing Forest Fire and Vegetation Recovery in the Black Hills, South Dakota.” GIScience & Remote Sensing 47: 276–299. doi:10.2747/1548-1603.47.2.276.
- Nguyen, T. H., S. D. Jones, M. Soto-Berelov, A. Haywood, and S. Hislop. 2018. “A Spatial and Temporal Analysis of Forest Dynamics Using Landsat Time-Series.” Remote Sensing of Environment 217: 461–475. doi:10.1016/j.rse.2018.08.028.
- Oliver, C. D., and B. A. Larson. 1996. Forest Stand Dynamics. New York, NY: John Wiley and Sons.
- Olofsson, P., G. M. Foody, M. Herold, S. V. Stehman, C. E. Woodcock, and M. A. Wulder. 2014. “Good Practices for Estimating Area and Assessing Accuracy of Land Change.” Remote Sensing of Environment 148: 42–57. doi:10.1016/j.rse.2014.02.015.
- Pan, Y., R. A. Birdsey, J. Fang, R. Houghton, P. E. Kauppi, W. A. Kurz, O. L. Phillips, A. Shvidenko, S. L. Lewis, and J. G. Canadell. 2011. “A Large and Persistent Carbon Sink in the World’s Forests.” Science 333: 988–993. doi:10.1126/science.1201609.
- Pickell, P. D., T. Hermosilla, R. J. Frazier, N. C. Coops, and M. A. Wulder. 2016. “Forest Recovery Trends Derived from Landsat Time Series for North American Boreal Forests.” International Journal of Remote Sensing 37: 138–149. doi:10.1080/2150704X.2015.1126375.
- Robinne, F. -N., J. Burns, P. Kant, M. Flannigan, M. Kleine, B. de Groot, and D. Wotton. 2018. Global Fire Challenges in a Warming World. Vienna, Austria: IUFRO.
- Rodman, K. C., R. A. Andrus, T. T. Veblen, and S. J. Hart. 2021. “Disturbance Detection in Landsat Time Series is Influenced by Tree Mortality Agent and Severity, Not by Prior Disturbance.” Remote Sensing of Environment 254: 112244. doi:10.1016/j.rse.2020.112244.
- Running, S. W. 2006. “Is Global Warming Causing More, Larger Wildfires?” Science 313: 927–928. doi:10.1126/science.1130370.
- Schroeder, T. A., M. A. Wulder, S. P. Healey, and G. G. Moisen. 2012. “Detecting Post-Fire Salvage Logging from Landsat Change Maps and National Fire Survey Data.” Remote Sensing of Environment 122: 166–174. doi:10.1016/j.rse.2011.10.031.
- Sessions, J., P. Bettinger, R. Buckman, M. Newton, and J. Hamann. 2004. “Hastening the Return of Complex Forests Following Fire: The Consequences of Delay.” Journal of Forestry 102: 38–45.
- Stanturf, J. A., B. J. Palik, and R. K. Dumroese. 2014. “Contemporary Forest Restoration: A Review Emphasizing Function.” Forest Ecology and Management 331: 292–323. doi:10.1016/j.foreco.2014.07.029.
- Tanase, M., J. de la Riva, M. Santoro, F. Pérez-Cabello, and E. Kasischke. 2011. “Sensitivity of SAR Data to Post-Fire Forest Regrowth in Mediterranean and Boreal Forests.” Remote Sensing of Environment 115: 2075–2085. doi:10.1016/j.rse.2011.04.009.
- Wang, X., X. Li, F. Kong, Y. Li, B. Shi, and Z. Gao. 2003. “Model of Vegetation Restoration Under Natural Regeneration and Human Interference in the Burned Area of Northern Great Hing’an Mountains.” Chinese Journal of Ecology 22: 30–34.
- Wang, J., C. Wang, and S. Zang. 2017. “Assessing Re-Composition of Xing’an Larch in Boreal Forests After the 1987 Fire, Northeast China.” Remote Sensing 9: 504. doi:10.3390/rs9050504.
- White, P. S., and S. T. A. Pickett. 1985. “Natural disturbance and patch dynamics: An introduction.” In The ecology of natural disturbance and patch dynamics, edited by S. T. A. Pickett and P. S. White, 3–13. Orlando: Academic Press.
- White, J. C., M. A. Wulder, T. Hermosilla, N. C. Coops, and G. W. Hobart. 2017. “A Nationwide Annual Characterization of 25 Years of Forest Disturbance and Recovery for Canada Using Landsat Time Series.” Remote Sensing of Environment 194: 303–321. doi:10.1016/j.rse.2017.03.035.
- Xu, H. 1998. Da Hinggan Ling Mountains Forests in China. Beijing: Science Press (in Chinese).
- Zhou, Y. 1991. Vegetation in Great Xing’an Mountains of China. Beijing: Science Press.
- Zhu, Z. 2017. “Change Detection Using Landsat Time Series: A Review of Frequencies, Preprocessing, Algorithms, and Applications.” Isprs Journal of Photogrammetry and Remote Sensing 130: 370–384. doi:10.1016/j.isprsjprs.2017.06.013.
- Zhu, Z., and C. E. Woodcock. 2012. “Object-Based Cloud and Cloud Shadow Detection in Landsat Imagery.” Remote Sensing of Environment 118: 83–94. doi:10.1016/j.rse.2011.10.028.