
 ?Mathematical formulae have been encoded as MathML and are displayed in this HTML version using MathJax in order to improve their display. Uncheck the box to turn MathJax off. This feature requires Javascript. Click on a formula to zoom.
ABSTRACT
The Mountain-Oasis-Desert System (MODS) is the fundamental landscape component within the vast arid region of Central Asia. Human activities and natural processes cause surface displacement in the MODS, resulting in geoenvironmental issues and hazards. However, surface displacement and its driving mechanisms in the MODS are not understood. In this study, we used the time-series interferometric synthetic aperture radar (InSAR) method to detect deformation in the MODS in north Tianshan Mountain, Xinjiang and investigated its attribution from the geological conditions, groundwater level changes, and climate variability. The results along the vertical gradient indicate that decorrelation is severe in the high mountain areas with ice-marginal environments (over 3600 m above sea level (a.s.l.)) and the forest-covered mid-mountainous belt (1700–2800 m asl), rendering effective detection unfeasible. Dynamic characteristics are identified in subalpine areas with an elevation of 2800–3600 m asl, with maximum horizontal and vertical displacements of −80.2 mm/year and −58.6 mm/year, respectively. The seasonal acceleration is influenced by the combined effects of temperature and precipitation changes. We observed dense subsidence funnels and ground fissures associated with coal mining in the foreland hills (700–1700 m asl). Ground displacements here exceeded −50 mm/year two years after mining activities had ceased. Subsidence has expanded in the oases with elevations of less than 700 m asl, due to extensive groundwater extraction for agricultural irrigation. The correlation coefficient between groundwater level and displacement was 0.89 and 0.45 at wells in the agricultural and desert areas, respectively. The deformation exhibited seasonal variations associated with groundwater level. The deformation remains relatively stable in the surrounding oasis-affected desert areas, with weak fluctuations influenced by seasonal variations in groundwater level.
1. Introduction
The arid region of Central Asia is the largest in the Northern Hemisphere. It is also an ecologically fragile area with relatively abundant natural resources and energy reserves (Chen et al. Citation2015). The Mountain-Oasis-Desert System (MODS) is a complex and integrated inland landscape and represents Central Asia’s most distinctive and fundamental geographical unit (Yao et al. Citation2022). With population growth, social development, and technological advancements in recent years, human activities have continuously altered the natural world, affecting the material cycles and energy flows within the MODS (Fu et al. Citation2017). As such, this system’s natural environment faces serious challenges. Due to both natural processes and human activities, the ground surface within the MODS is experiencing displacement, which has resulted in a series of geoenvironmental issues and hazards (Luo et al. Citation2010). In the context of global warming, the reduced stability of slopes and the degradation of permafrost result in ground subsidence and higher likelihood of landslides in mountainous, ice-marginal environments (Jin, Qing-Bai, and Romanovsky Citation2021; Patton, Rathburn, and Capps Citation2019). In the foreland hills between the mountains and plains, increasingly intensive human activities like mining, high-speed construction, and reservoirs are linked to severe geological disasters that include cracks, collapses, and landslides. These pose serious threats to the safety of residents and infrastructure (Bing et al. Citation2022). The oasis has affected the surrounding desert areas; reports from the southern margin of the Junger Basin cite serious ground subsidence problems caused by long-term over-extraction of groundwater for agricultural irrigation (Wang, Feng, Li, Xu, Wang et al. Citation2022). Therefore, comprehensive detection and accurate understanding of surface deformation within the MODS is crucial for disaster prevention and mitigation, resource management, and socio-economic development in arid Central Asia. However, comprehensive studies of surface deformation in the MODS are still limited, and the driving mechanisms of deformation as well as their spatial and temporal distribution remain unclear.
High-precision monitoring of ground displacement is usually conducted through in-situ field mapping and measurement (Niu et al. Citation2017; Zhang et al. Citation2020). Most field-based observations have limited spatial or temporal resolution and are thus insufficient to identify the spatial pattern of ground deformation at a regional scale. Over the past three decades, Interferometric Synthetic Aperture Radar (InSAR) has been widely used to investigate geological and geophysical problems across a variety of spatial and temporal scales (Hellwich and Ebner Citation2000; Massonnet and Feigl Citation1998). InSAR images provide detailed observations of crustal deformation associated with earthquakes and volcanoes (Amelung et al. Citation2000; Fialko Citation2006). With the rapid development of Synthetic Aperture Radar (SAR) sensors and the accumulation of an archive of SAR images, a variety of multi-temporal InSAR methods have been increasingly used for near-surface deformation monitoring (Chen et al. Citation2022; Kamali et al. Citation2021; Wang et al. Citation2022). Such methods include permanent scatterer InSAR (Ferretti, Prati, and Rocca Citation2000), Small Baseline Subset InSAR (SBAS-InSAR) (Berardino et al. Citation2002) and SqueeSAR (Ferretti et al. Citation2011). InSAR has been identified as one of the most cost-effective technologies capable of measuring large-area surface deformation at the meter-scale with acceptable spatial resolution, and at centimeter-scale accuracy under favorable conditions (Junle and Lohman Citation2021; Zhao et al. Citation2018). Currently, research on the MODS using SAR data sources is limited. These studies mainly focus on monitoring the surface deformation of individual landform features, and most are conducted in one-dimensional Line-Of-Sight (LOS) (Bing et al. Citation2022; Wang, Feng, Li, Xu; Wang et al. Citation2022). By integrating multi-source SAR datasets to retrieve detailed displacements across the entire vertical gradient of the MODS, and distinguishing Two-Dimensional (2D) deformation signatures at specific locations within individual MODS landform zones, new research will provide valuable insights into the kinematics and driving mechanisms of surface deformation for various geomorphic units in arid regions, using remote sensing techniques.
The Sangong River Watershed (SRW) is an arid inland basin characterized by a landscape typical in the MODS (Zhang et al. Citation2016). The water resources in the basin strongly depend on the meltwater from high mountain glaciers and snow. Complex geological conditions with unstable rock formations and fracture zones make the region’s mountainous area susceptible to geological disasters like landslides that are triggered by external forces such as dissolution, rainfall, and earthquakes (Liu et al. Citation2019; Yao and Hui Yao Citation2013a). There are also abundant coal resources in the watershed, and coal mining activities often result in surface subsidence and fissures that disrupt the integrity of the coal seam overburden and create environmental issues like declining Groundwater Level (GWL) (Tan et al. Citation2019). Furthermore, the oasis area within the watershed serves as a long-term, large-scale site for soil and water development typical of the arid zone of northwest China (Luo et al. Citation2008; Wang et al. Citation2018). The development of irrigated agriculture has the potential to alter the hydrological cycle of the MODS, representing a typical evolution of the region’s oasis-desert system (Yin et al. Citation2021). The watershed is affected extensively by surface displacements associated with natural and anthropogenic activities, a phenomena supported by a solid foundation of data. For these reasons, the SRW can serve as an excellent case study to gain an in-depth understanding of surface deformation in the MODS and how natural and human activities like meteorological factors, mining operations, and the development of irrigated agriculture influence it.
In this study, we measured surface deformation in the SRW using the time-series InSAR method with Advanced Land Observing Satellite (ALOS) PALSAR and Sentinel-1 data. In addition, we validated and analyzed the deformation results using Global Navigation Satellite System (GNSS), GWL, and geological and meteorological data sets. The study has two primary objectives: (1) to obtain the spatiotemporal characteristics of surface deformation in the SRW and evaluate its applicability, and (2) to better understand the potential driving factors of deformation. This study provides data that are valuable to support resource development, disaster prevention, and control in the SRW and serves as a useful reference for other areas with characteristics similar to the MODS.
2. Material and methods
2.1. Study area
The study area is located on the northern slope of the Tianshan Mountains (Bogda Mountains), 80 km from Bogda Peak to the Gurbantunggut Desert, and has an elevation gradient ranging from 430 to 5445 m asl (). The high mountain areas are above 3600 m and covered with snow year-round, and the subalpine (2800–3600 m asl) area is located above the distribution line of the arboreal forest and below the perennial snow line. The development of modern glaciers in the high mountain and subalpine areas is the primary source of surface water and groundwater recharge. The area is ecologically fragile and sensitive to climatic changes. The mountain’s geological strata are primarily metamorphic rock of Proterozoic Eonothem, Paleozoic Erathem, and Mesozoic Erathem, and are characterized by exposed rocks and fissures. Water from atmospheric precipitation and glacial melt infiltrates into the bedrock of the cracks to form fissure water. The middle mountain zone (1700–2800 m asl) is the natural forest area and the main summer pasture in the SRW. The lithology of the foreland hills (700–1700 m asl) is mainly gravel, sandstone, and argillaceous sandstone, and is rich in mineral resources. The oasis plain (450–700 m asl) consists of loose sediments of the Quaternary System and a water-bearing rock group with a binary structure of alluvial and floodplain. Groundwater is primarily stored in the Quaternary System within loose pore aquifer (Yin et al. Citation2021). River and irrigation infiltration dominate recharge, while evaporation and artificial extraction dominate discharge. From 1978 to 2014, the irrigated area in the SRW almost doubled, with a sharp increase at the end of 2002 (Yin et al. Citation2021). Agricultural irrigation uses account for approximately 90% of available water resources, and about 46% of water used for agricultural irrigation comes from groundwater (Gao and Han Citation2020).
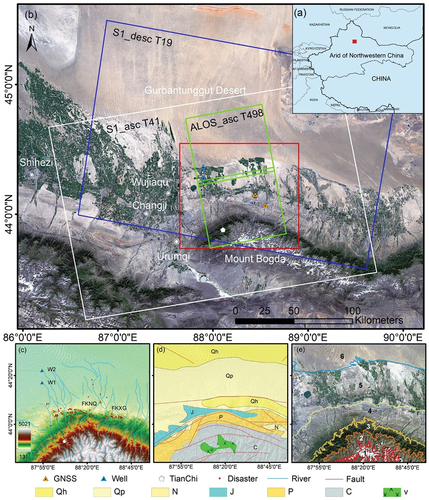
Figure 1. (A) location of the SRW in the arid region of Northwest China. The red rectangle shows the location of the study area; (b) Landsat 8 image of the study area, outlined in red. The other boxes show the coverage of the SAR datasets. Landsat 8 imagery was acquired on 2021/06/10 and processed and provided by the U.S. Geological survey (USGS) (Brian, Markham, and Irons James Citation2013); (c) the digital elevation Model (DEM) of the study area, released in 2015 by the Japan Aerospace Exploration Agency (JAXA) (Takaku et al. Citation2016). The DEM is accessible at http://www.Eore.jaxa.jp/ALOS/en/aw3d30/. The red dots represent the locations of catalogued geological hazards; (d) a geological structure map of the study area. qh: holocene series, qp: pleistocene series, N: neogene System, J: jurassic System, P: permian System, C: carboniferous System, V: Gabbro; (e) characterization of the landforms in vertical gradient zone. 1: high mountain areas, 2: subalpine areas, 3: mid-mountainous belt, 4: foreland hills, 5: plains oasis area, 6: desert areas.
2.1.1. Datasets
Two consecutive frames of the same ascending track of L-band ALOS, and ascending and descending track datasets of C-band Sentinel-1 SAR images of the study area were used for this analysis. The joint use of co-polarized and cross-polarized data can provide additional information and result in more candidate coherent pixels, making it more effective in areas with complex terrain and vegetation cover (Navarro-Sanchez, Lopez-Sanchez, and Vicente-Guijalba Citation2010). However, this method is computationally intensive and requires rich a priori knowledge. Moreover, the method produces a limited increase in the number of effective coherent pixels and does not affect the deformation patterns obtained from the data (Azadnejad et al. Citation2023; Esmaeili and Motagh Citation2016). Current research on large-scale time series deformation detection is usually done by co-polarization (Shi and Xie Citation2023; Tang et al. Citation2023). Therefore, in this study, we use the HH polarization mode of ALOS and the VV polarization mode of Sentinel-1 as our experimental data. The Sentinel-1 data, provided by the European Space Agency (ESA), and the ALOS-1 PALSAR imagery, provided by JAXA, were both downloaded from the Alaska Satellite Facility (ASF) website, accessible at https://search.asf.alaska.edu/#/. presents the basic parameters of the three sets of SAR data. The 30 m resolution ALOS World 3D DEM was used to remove the topographical phase and for geocoding. The ESA also provides precise orbital ephemeris data for interferometry with the Sentinel-1 dataset. Additionally, we collected data from two GNSS stations to verify the accuracy of deformation monitoring (). To evaluate the correlation between ground subsidence and GWL changes in the oasis areas, we used the GWL dataset from 2006 to 2021 at Fukang Desert Field Observation Station, which is part of the China Ecosystem Research Network (CERN) (Zhu et al. Citation2017). The GWL dataset consists of one observation well in an agricultural area and one in the desert. In addition, climatic data for 2019–2020 from the weather station of TianChi, located in the mountainous area, was used to analyze the role of temperature and precipitation on surface displacement in the subalpine belt.
Table 1. Basic parameters of SAR datasets.
Table 2. The geographical information of the observation sites.
2.2. Methodology
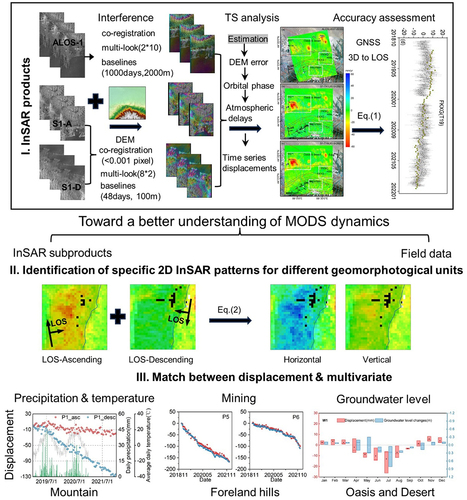
We first used time-series InSAR analysis to measure LOS displacements in the radar imaging geometry from multi-temporal SAR datasets. We then distinguished location-specific 2D deformation signatures for various geomorphological zones of the MODS. Finally, we integrated in-situ measurements, including GWL and meteorological records, to identify the primary controls modulating the heterogeneous displacement patterns across the MODS terrain ().
Figure 2. The sequential data processing workflow implemented in this study. S1-A and S1-D are abbreviations for Sentinel-1-ascending and Sentinel-1-descending, respectively.
2.2.1. Time series InSAR image processing
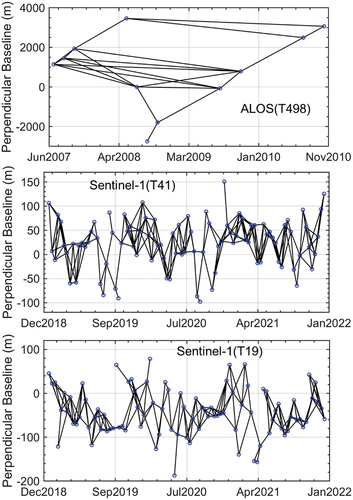
We selected SAR images from July 15, 14 June 2008, 2020, and 7 June 2020, as reference images for the ALOS, S1-A, and S1-D datasets, respectively. Other SAR images were then co-registered and resampled to the reference image’s spatial reference system. Thresholds were set for time and spatial baselines, with 1000 days and 2000 meters for the ALOS dataset and 48 days and 100 meters for the Sentinel-1 dataset (). On this basis, multi-looking interferograms were generated with 2 × 10 and 8 × 2 in the range × azimuth directions, respectively. The Goldstein filter with a 32 × 32 window was used to enhance the coherence of the InSAR time-series analysis (Baran et al. Citation2003). Then, the 2D minimum-cost flow method was used for phase unwrapping, and a coherence threshold of 0.15 was used to mask noise pixels (such as those in water or dense vegetation areas) (Costantini, Farina, and Zirilli Citation1999). Finally, a bilinear model was used to estimate the long-wavelength signal caused by inaccurate orbit information through the unwrapped interferograms.
Figure 3. Interferometric baseline configurations of the three SAR datasets.
The time-series displacement in the LOS direction was extracted from the unwrapped interferograms through the coherence-based SBAS method (Tong and Schmidt Citation2016). This method uses coherence as a weight to invert each pixel, preserving low coherence pixels while reducing noise weight and generating a coherent spatial signal with dense pixels (Tang et al. Citation2023). Additionally, the residual phase of the DEM was retrieved through the least-squares method, utilizing the linear relationship between the terrain residual and the baseline. Furthermore, atmospheric delays were eliminated by linearly fitting the elevation height and the unwrapped phase. Finally, the displacement velocity was obtained from the linear regression of the solved displacement time series after removing various noise sources.
2.2.2. Two-dimensional deformation inversion
The deformation obtained from InSAR is the projection of the three-dimensional surface deformation in the satellite LOS direction (Shi and Xie Citation2023), i.e.
dU, dE, and dN correspond to the vertical, eastward, and north directions displacements. α and θ are the satellite’s heading and incidence angles, respectively. dLOS and δLOS represent the observed LOS displacement and error.
In mountainous areas, the terrain is characterized by significant undulations or fluctuations, and the displacements of the same target, monitored by the ascending and descending track datasets, may not be consistent, thereby challenging the understanding of the InSAR measurement results (Kang et al. Citation2021). When the north-south displacement accounts for a small proportion of the displacement of the target, the horizontal and vertical displacements of the ground target can be solved by combining the displacement results of the ascending and descending track monitoring (Rouyet et al. Citation2021; Shi et al. Citation2019).
The superscripts A and D correspond to the parameters and measurements derived from the ascending and descending track datasets. It should be noted that this assumption isn’t suitable for slopes that face south or north.
It is shown that for the plain oasis area, GWL change, and ground subsidence are coupled (Tang et al. Citation2023; Wang, Feng, Li, Xu; Wang et al. Citation2022). As such, in the oasis area, we pay more attention to the vertical displacement measured by InSAR. For the Sentinel-1 data with both ascending and descending tracks, the spatial coverage of the ascending track data was used as a reference, and the LOS-oriented displacement of the time series is decomposed into the vertical and east-west directions by Equationequation (2)(2)
(2) in combination with the descending track data for the corresponding dates. Furthermore, studies have indicated that horizontal displacements in this region are minimal (Wang, Feng, Li, Xu, Wang et al. Citation2022, Citation2022). Therefore, the horizontal displacements can be disregarded for ALOS data with only an ascending track, and the vertical displacements can be obtained by dividing the LOS displacements by the cosine of the incidence angle (Andaryani et al. Citation2019).
3. Results
3.1. Larger-scale analysis
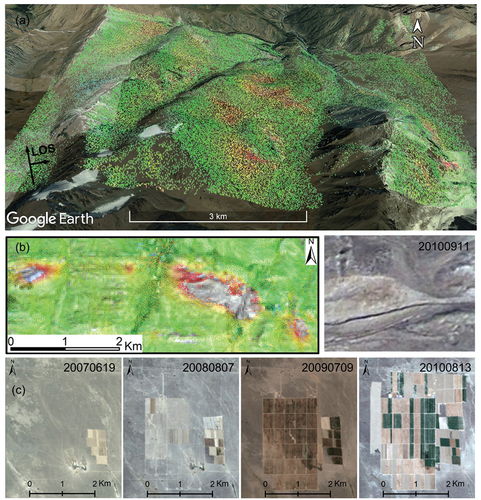
Only deformation rates from −60 to 60 mm/year were rendered in to highlight the main spatial characteristics of deformation. Due to severe decoherence, none of the three datasets were able to effectively detect ground displacements in the ice-marginal environments of the southernmost high mountain areas and forest-covered mid-mountain belt. As shown in , in the subalpine, the ascending track from ALOS detected the active slope toward the east, while only a few Measurement Points (MPs) were captured on the western slope due to the limitation of the side-view imaging geometry (). Notably, the hills exhibited dense subsidence funnels with a maximum deformation rate of −39.3 mm/year. Furthermore, thick cracks resulting from ground collapse were present in the historical image from 2010 (). The maximum displacement in the LOS direction at the northeastern edge of the oasis area reaches −89.2 mm/year. Additionally, a funnel-shaped deformation zone was observed in the middle of the oasis. Historical image-assisted analysis shows that this area was transformed from desert to cropland between 2008–2010 (). Additionally, the ALOS measurements indicated stability in the northernmost desert.
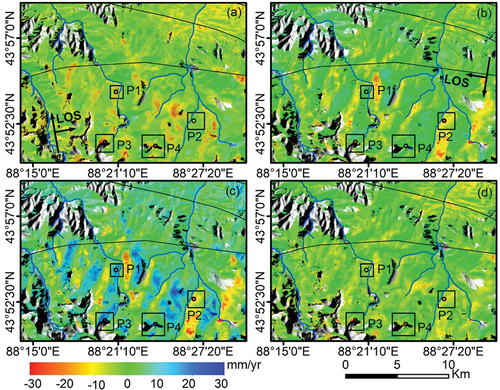
Figure 4. Displacement rates from (a) ALOS-ascending, (b) S1-A, and (c) S1-D in the LOS directions of the SRW.
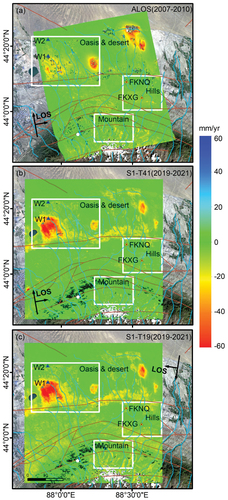
Figure 5. Surface characteristics corresponding to deformation monitored by ALOS datasets (2007–2010), (a) mountains, (b) hills, and (c) oases.
The observed displacements in the subalpine show significant differences using the combined measurements of S1-A and S1-D, indicating that the combination of ascending and descending tracks enables more comprehensive detection of displacements in mountainous areas with large topographic undulations (). For the foreland hills, oases, and deserts with flat topography, there is good agreement between ascending and descending track measurements of the spatial distribution of displacements. However, significant changes have occurred in the spatial distribution and magnitude of displacements in the oasis compared to the displacements observed by ALOS between 2007 and 2010. The maximum displacement rates in the oasis measured from the S1-A and S1-D are −100.3 mm/year and −101.3 mm/year, respectively. In sum, both ALOS (2007–2010) and Sentinel-1 (2019–2021) measurements indicate that significant deformations exist in the region’s oases, foreland hills, and subalpine areas.
3.2. Accuracy assessment
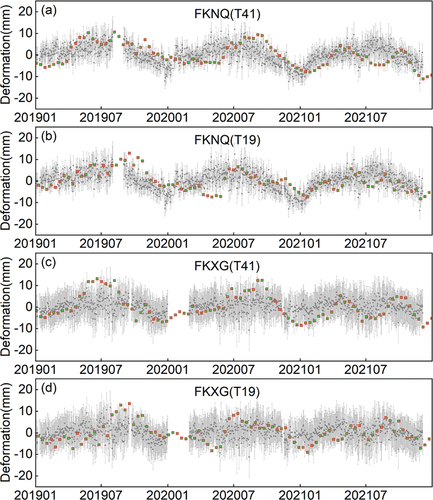
To verify the accuracy of InSAR monitoring results, we projected the three-dimensional displacements recorded by two GNSS stations onto the LOS direction of the corresponding Sentinel-1 track. The nearest InSAR measurement point was then selected for comparison (). Both GNSS stations on the bedrock exhibit displacement characteristic of thermal expansion and contraction. The maximum positive displacement occurs in July when the temperature is highest, and the maximum negative displacement occurs in January when the temperature is lowest. InSAR measurements can capture this trend of thermal expansion and contraction. The standard deviations between the displacements observed by GNSS station FKXG and the results of the ascending (T41) and descending (T19) tracks were 4.8 mm and 4.6 mm, respectively, as shown in ). Similarly, the standard deviations between the displacements observed by GNSS station FKNQ and the result of the ascending (T41) and descending (T19) tracks were 5.5 mm and 5.7 mm, respectively, as shown in ). Based on this analysis, the results of the InSAR time series showed good agreement with the GNSS observations.
Figure 6. The time-series InSAR result (green squares) compared with the GNSS observation (gray squares).
3.3. Small-scale analysis
3.3.1. Mountain (the subalpine)
The topography of the subalpine is generally oriented in a north-south direction, forming east-west slopes. For the same active slope, there was a significant difference (in magnitude and trend) between the monitoring results of the ascending and descending tracks (). Therefore, we decompose the deformation into horizontal (east-west) and vertical directions using Equationequation (2)(2)
(2) . Negative values for horizontal displacements indicate westward displacement, while positive values indicate eastward displacement. The range of horizontal displacements is from −80.2 mm/year (westward) to 50.8 mm/year (eastward). As expected, displacements with westward horizontal velocity (negative values) are located on the west-facing slope, while those with eastward horizontal velocity (positive values) are located on the east-facing slope. The vertical displacement ranged from −58.6 mm/year (downward) to 9.9 mm/year (upward), with most points having a distribution of ±10 mm/year (97%). ().
Figure 7. Average deformation of the subalpine area from 2019 to 2021. Linear deformation rates in LOS direction are from (a) ascending track 41 and from (b) descending track 19. Negative values in (a) and (b) indicate movement away from the satellite and positive values indicate movement toward the satellite. (c) horizontal (east-west), and (d) vertical deformation rate maps. The negative values in (c) and (d) represent westward and downward movements, respectively.
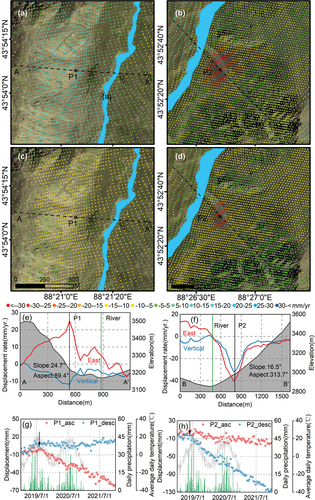
We also analyzed the time-series displacement of typical active slopes by combining meteorological and terrain data. shows the two slopes, P1 and P2, which face east (slope direction: 89.4°) and northwest (slope direction: 313.7°), respectively, and are covered with Quaternary loess deposits. The maximum displacement for both occurred in the lower-middle part of the slope, with slope angles of 24.7° and 16.5°, respectively. Horizontal displacement occurs along with vertical displacement on the slope such that the displacement rate gradually increases as the slope angle decreases. Displacement rate reaches its maximum in the lower-middle part of the slope, then rapidly decreases as the slope flattens. For slope P1, the ascending and descending track LOS displacement rates were −18.39 mm/year and 8.91 mm/year, respectively, with the data from the ascending track being more sensitive to its displacement. Notably, a significant acceleration was observed on NaN Invalid Date NaN, during the rainy season and the year’s highest temperature. For slope P2, the descending track was more sensitive to displacement, with ascending and descending track rates of −7.38 mm/year and −45.14 mm/year, respectively. It is worth mentioning that a significant acceleration was observed simultaneously in the ascending and descending track in early June 2019, when the temperature was around 15°C and the daily rainfall was greater than 30 mm.
Figure 8. Displacement rates from (a), (b) eastward and (c), (d) vertical directions of the P1 and P2 slopes. Optical image from google Earth™, acquired on September 16, 2019; cross-sections (e) AA’ and (f) BB’ of P1 and P2, locations of the profiles is marked in ), respectively; time-series displacement in the LOS direction for P1(g) and P2(h).
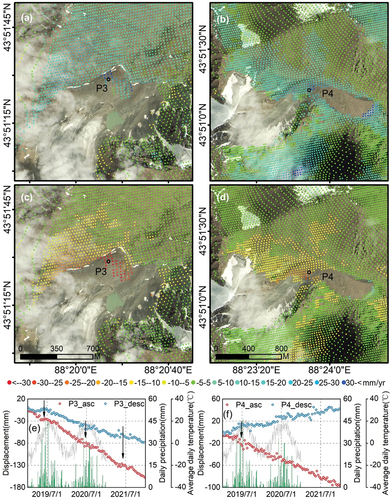
The displacement is most significant in the subalpine in the southern part of the study area above 3500 meters in elevation. As shown in , both P3 and P4 formed earth flows in the downslope direction due to erosion. The length of the P3 earth flow is 840 m, with a height difference of 88 m (3696–3608 m), and the length of the P4 earth flow is 930 m, with a height difference of 190 m (3656–3466 m). There is an ice-water mixture detectable in the upper part of the landslide, and the image was acquired on 16 September 2019, when the temperature recorded by the meteorological station was 7.4°C. Due to phase ambiguity, the monitoring results of the ascending and descending tracks did not yield valid MPs in the region of maximum deformation. The displacement rates for P3 measured in the ascending and descending tracks were −52.32 mm/year and −28.02 mm/year, respectively. Meanwhile, the time-series of displacement for P3 showed seasonal characteristics, with an annual acceleration in displacement rate in mid-June when the mountain area had abundant rainfall and a temperature around 15°C. The displacement rates for P4 were, −34.08 mm/year and 14.23 mm/year, respectively, and showed less significant seasonal characteristics than P3. The acceleration process was observed in early July 2019, and displacement in the summers of 2020 and 2021 showed fluctuations, but the acceleration was not obvious.
Figure 9. Displacement rates from (a), (b) eastward and (c), (d) vertical directions of the P3 and P4 slopes. Optical image from google Earth™, acquired on September 16, 2019; time-series displacement in the LOS direction for the P3(e) and P4(f).
3.3.2. Foreland hills
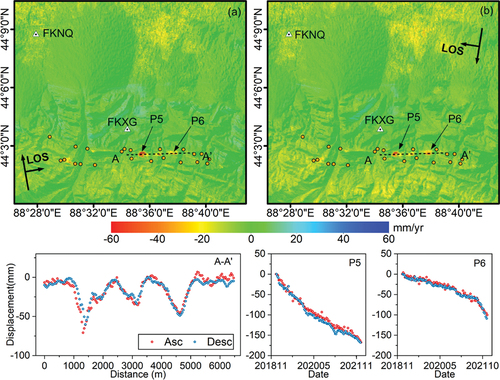
The foreland hills have low vegetation and relatively flat terrain, yielding similar observation geometry for the ascending and descending tracks at incident angles of 39.04° and 39.09°, respectively. The high coherence of this region enables the extraction of dense MPs, and the displacements have good consistency in spatial distribution (). Several deformation regions are distributed throughout the mining belt in the east-west direction, which is consistent with the spatial distribution of cataloged geological hazard sites. The magnitude and trend of the ascending and descending track monitoring results are generally consistent along the spatial profile line A – A.’ The cumulative deformation variables in the two obvious deformation areas of P5 and P6 reached −167 mm and −105 mm, respectively. The ascending and descending track monitoring results show a good consistency in time and space, which serves as cross-validation. Historical images indicate that P5 is a coal mine that had been emptied and backfilled in 2019, and P6 is an underground coal mine that is still active.
Figure 10. Velocity field in the foreland hills. The LOS average velocity from (a) S1-A and (b) S1-D was measured with InSAR time series. The orange points are the locations of catalogued geological hazards.
3.3.3. Oasis and desert
EquationEquations (2)(2)
(2) and (Equation3
(3)
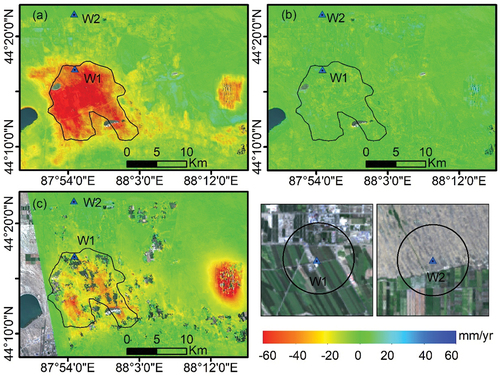
(3) ) are utilized to convert the LOS displacements from Sentinel-1 and ALOS into the vertical () and east-west () directions, respectively. The vertical displacements observed in the 2019–2021 Sentinel-1 data revealed subsidence covering an area of 127 km2 in dense farmland (), with a maximum displacement rate of −120.6 mm/year and an average displacement rate of −50.1 mm/year. Results from the ALOS data (200707 to 201,010) showed a maximum deformation rate of −68.1 mm/year and an average displacement rate of −20.9 mm/year. The extent and magnitude of subsidence has increased significantly in the last three years, compared to the 2007–2010 period. For areas where deformation was caused by land development, the intensity of deformation decreased during the last three years of monitoring. Agricultural GWL observation Well 1 (W1) is located within the subsidence range, while desert GWL observation Well 2 (W2) does not show significant ground deformation at the edge of the oasis.
Figure 11. Displacement rates from (a) S1-vertical, (b) S1-horizontal (west-east), and (c) ALOS-vertical directions for the oasis and desert. Landsat 8 imagery (acquired on 2021/06/10) corresponding to W1 and W2 was processed and provided by the USGS. The black circles around W1 and W2 have a radius of 1500 meters.
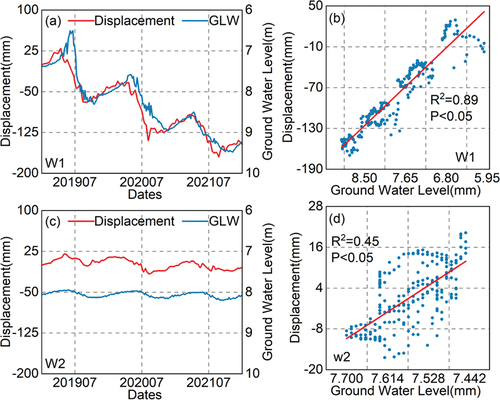
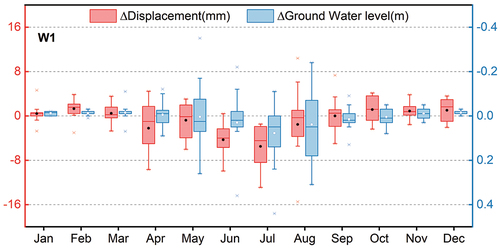
A time-series analysis on W1 and W2 () indicated that W1 had noticeable seasonal changes in GWL. The multi-year average GWL decreased by 0.97 m from April to September during the years 2019–2021 and recovered from October to March to yield an average annual decrease of 0.62 m at a depth of the GWL over the three year period. The displacement also showed obvious seasonality, with a multi-year average displacement of −86.4 mm during the months of April to September (2019–2021) that recovered during the months of October to March to yield an average displacement rate of −57.1 mm for the three year period. W2, which is located about 0.35 km from the agricultural area, showed a seasonal variation of GWL. It decreased from April to September and gradually recovered from October to March, exhibiting weak variation at a stable state. InSAR can capture small amplitude GWL signal changes, which are expressed as a small amplitude seasonal displacement. Further analysis of the correlation between displacement and GWL showed that the squares of the Pearson correlation coefficient within the 95% confidence range (P < 0.05) were 0.89 and 0.45 for W1 and W2, respectively (). The dense time-series of InSAR measurements indicated seasonal displacement trends at both W1 and W2, which correspond, respectively, to the strong and weak seasonal changes in the area’s GWL. This demonstrates the capability of multi-temporal InSAR for characterizing subtle, seasonal deformation patterns associated with hydrological processes in arid regions. The high temporal resolution that is achievable through time-series InSAR facilitates detailed analysis of seasonal correlations between displacement and GWL dynamics.
Figure 12. The time-series InSAR vertical displacements in comparison with the GWL in W1 and W2.
4. Discussion
4.1. Potential deformation drivers in the subalpine region
The deformation of slopes in the subalpine region is caused by a combination of factors, including gravity, tectonic movement, rainfall, river erosion, and freeze-thaw cycles.
The SRW is located on the Fukan-Jimusaer fault zone in the eastern Tianshan Mountains of Xinjiang, China where tectonic movement and rock erosion have caused deformation of the geological layers. The vertical slip rate of the far segment of the fault is relatively small, ranging from 0.1 to 0.4 mm/year, while the middle segment has a higher vertical slip rate of 0.4 to 1.43 mm/year due to stronger thrusting (You, Ren, and Zhang Citation2003). Resolving such slow signals of deformation on slopes using InSAR methods is challenging. Tectonic movement can intensify rock fragmentation, leading to the formation of cracks and loose materials, which in turn reduce the mechanical strength of the rock and soil mass (Shi and Xie Citation2023).
Gravity is universally present and usually forms the basic framework for other influencing factors. It mainly affects linear deformation (Kang et al. Citation2021). Rainfall is an important triggering factor, mainly related to the acceleration or deceleration of displacement (Shi et al. Citation2022). When rainfall occurs, the increase in soil moisture content increases the weight of the soil and reduces the slope stability. When the pore water pressure reaches or exceeds the shear strength of the soil or rock, displacement of the slope will accelerate under gravity. In addition, heavy rainfall can saturate the ground surface and rapidly form runoff on the slopes. These turbulent flows erode soil and rock, further weakening their structure and causing deformation and sliding of rock and other materials (Shi and Xie Citation2023).
Meanwhile, the ice-marginal environment at the southern end of the subalpine belt is strongly affected by freeze-thaw cycles. The change in temperature causes changes in the amount of water in glaciers and rivers, which in turn leads to soil erosion and landslides (Rouyet et al. Citation2021). In the four typical active slopes analyzed in this article, the displacements show a trend of acceleration in the summer when the temperature increases and precipitation is abundant; This is evidenced by P3 and P4 which are in the high-elevation region and have more significant displacements under dissolution.
Multi-year trends of climate change in the study area indicate increasing warmth and humidity (Fan et al. Citation2013; Zengyun et al. Citation2014). In such conditions, the upper active layer of solid glaciers and permafrost deepens, and the excess ice or ice-rich deposits produced during melting can lead to long-term ground subsidence (Chen et al. Citation2022). In addition, the increase in precipitation will cause the GWL to rise, which in turn will affect the process of water circulation, causing more severe erosion, and increasing frequency of phenomena like rock spalling and landslides (Cui et al. Citation2013). Surface displacement as a response to climate change is a subtle and long-term process. With the accumulation of InSAR data and the continuous acquisition of other observation data, we will be able to assess this process quantitatively, and such assessment is essential for a deeper understanding of regional water cycle dynamics.
4.2. InSAR monitoring geological hazards in the foreland hills
Previous studies in the foreland hills have shown that mining activities can cause changes in the stress structure of rocks, leading to collapse (Conway Citation2016). These unevenly stressed collapses have created dense ground fissures in the foreland hills, making it the area most severely affected by geological hazards in the SRW (Yao and Hui Yao Citation2013b). In this study, we also collected data on geological hazard sites in the SRW. The areas where hazards are most concentrated align with the detected deformation zones (), further supporting the theory that regional mining activities are the primary factor causing surface deformation in the foreland hills. The mining area’s dry climate, sparse vegetation, and low topographic relief make it ideal for deformation monitoring with InSAR. By mapping the boundary of the subsidence area with dense MPs, the geohazard inventory can be updated promptly and could help identify the areas where mitigation measures should be implemented (Moretto, Bozzano, and Mazzanti Citation2021). To improve the accuracy of updating the geological hazard list, we could combine the extent of the mining area’s claim line, high-resolution images, and other supporting information to exclude non-hazardous regions (Wang, Deng, and Zheng Citation2020; Shi et al. Citation2021). It is important to note that the center of the settlement funnel is often inaccessible to MPs and thus might be severely underestimated in some rapidly changing regions due to the limitation of phase ambiguity (Höser Citation2018). For these cases, pixel offset tracking techniques can be used as an alternative observation scheme (Wang, Deng, and Zheng Citation2020).
4.3. Subsidence in the oasis area with groundwater processes as the main controlling factor
For the plain oasis area, there is a close relationship (R2 = 0.89) between displacement in subsidence areas and GWL. Displacement exhibits significant seasonal fluctuations as GWL changes. Within the oasis area of the SRW, change in GWL is the main cause of ground subsidence in agricultural areas, which is consistent with research in other agricultural areas (Peng et al. Citation2022; Kamali et al. Citation2021; Béjar-Pizarro et al. Citation2017; Riel et al. Citation2018). The oasis in the SRW is composed of loose sediments from the Quaternary System. The agricultural water demand period begins annually in April (Yin et al. Citation2021). The GWL shifts from recharge uplift to abstraction decline. In July, when the agricultural water demand is at its peak, the GWL drops to its lowest point of the year as the soil continues to lose water. As a result, the pore space contracts and causes widespread ground subsidence. The agricultural water demand decreases from September to October and the groundwater enters the replenishment period until March of the following year. During this period, the soil pore space is filled with water and the soil expands, and displacement gradually recovers (). The months of May, July, and August exhibited the highest error bars in our study. This can be attributed to the increased demand for agricultural water during this period which leads to significant groundwater extraction for irrigation. As a result, the GWL showed greater variability and unevenly distributed data with larger error bars.
Figure 13. The displacement changes correspond to the GWL changes, with a time scale of 5 days (interpolating the displacement time series to the corresponding groundwater observation dates).
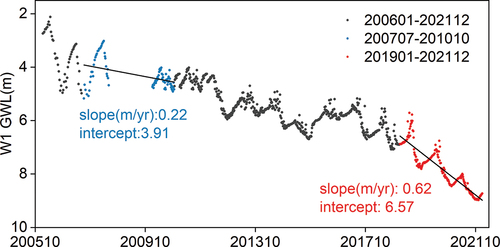
The area of agricultural land in the SRW was 418.68hm2 in 2004 and increased by 19.65% to 500.97hm2 in 2014 (Zhang et al. Citation2016). The area of agricultural land has remained stable since 2014, but this increase in arable land has led to more groundwater extraction for agricultural irrigation (Yin et al. Citation2021). From July 2007 to October 2010, the average GWL at W1 was 4.3 m, with a groundwater table decline rate of 0.22 m/year. From January 2019 to December 2021, the average was 7.8 m, with a groundwater table decline rate of 0.62 m/year (). The continued decline of the GWL aggravates ground subsidence. Currently, ground subsidence in the SRW is at a recoverable level of deformation. However, land subsidence may cause permanent compaction of the aquifer system, reducing storage capacity and groundwater inventory (Fetter Citation2018). It was also noted that, at the beginning of the farmland opening (2007–2010), the farmland’s soil structure was loose for newly developed arable land. Along with improvements in farmland soil conditions (increased soil moisture and reduced salinization), changes in the physicochemical properties of the soil caused contraction of the soil structure and significant subsidence of the ground (Wang et al. Citation2007; Zeng et al. Citation2016). The surface deformation will stabilize with plowing, and the magnitude of deformation will decrease accordingly.
Figure 14. The GWL in W1 from 2006 to 2021.
Use of water-saving irrigation combined with restrictions on land reclamation and adaptation of water management measures is the most effective way to maintain the sustainable development of the MODS and inland dryland areas (Yin et al. Citation2021). InSAR can measure regional deformation at meter-level spatial resolution and millimeter-level accuracy (Junle and Lohman Citation2021). GWL and displacement are strongly correlated in the SRW. Therefore, modeling the GWL with InSAR measurements will effectively assist water resource managers in finding a balance between water resources development, utilization, and conservation.
4.4. Limitations and prospects
Due to severe decoherence in ice-marginal environments and the study area’s forest-covered mid-mountainous belt, effective detection could not be performed. Future advances in time-series InSAR methods might enhance monitoring capabilities in areas of severe decorrelation. More advanced dual-polarization optimization algorithms can be explored using combined polarizations (VV/VH), or distributed scatterers can be integrated with persistent scatterers to obtain more coherent pixels (Esmaeili and Motagh Citation2016). Additionally, time-series InSAR could be combined with other techniques like pixel offset tracking to improve deformation monitoring in the complex MODS environment (Shi et al. Citation2015).
This study provides a valuable reference for future research on surface deformation in the MODS. Based on the methods and results of this study, future studies could consider analyzing the impacts of surface deformation on surrounding communities and infrastructure, and vice versa. This has important value for engineering applications. The findings of this study could also provide a scientific basis for land use management in the region and help implement beneficial practices like optimizing water use for agricultural irrigation and controlling groundwater exploitation to mitigate land subsidence. Overall, the application and extension of the research findings warrant further exploration, which will help increase the application value of the research. We will endeavor to expand the application scope and influence of the research from these aspects in our future work.
5. Conclusions
In this study, we measured surface displacement of the MODS in the SRW using the time-series InSAR method with the ALOS dataset (2007–2010) and the ascending and descending datasets of Sentinel-1 (2019–2021). These displacement measurements were also compared to the data from GNSS stations to verify the reliability of the results. Finally, we integrated GWL measurements and geological and meteorological observations to identify the spatial and temporal characteristics of surface displacements in the SRW, as well as their potential driving mechanisms. Due to the impact of decorrelation, effective deformation results could not be obtained for the high mountain areas with ice-marginal environments and forest-covered mid-mountainous belts. The subalpine zone is a dynamic environment with maximum horizontal and vertical displacements of −80.2 mm/year and −58.6 mm/year, respectively. The southern end of the subalpine belt has the most pronounced displacement under dissolution, with temperature and precipitation being two important driving factors. The ground displacement in the foreland hills is closely related to mining activities, and ground deformations higher than 50 mm/year can still be observed in the mining backfill area two years after mining has ceased. These findings will help update the disaster map inventory of mining areas and provide guidance for implementing disaster prevention measures. The deformation of the oasis due to over-exploitation of groundwater for agricultural irrigation was more severe in 2019–2021 compared to 2007–2010. The displacements show seasonal variations related to agricultural activities, with the largest displacement during July when demand for irrigation water is highest. Deformation remained relatively stable in the surrounding desert areas affected by the oasis, with weak fluctuations influenced by seasonal changes in GWL. The correlation coefficients (R2) of GWL and displacements observed in agricultural and desert wells were 0.89 and 0.45, respectively. Our study demonstrates that multi-temporal InSAR remote sensing can accurately detect surface displacement in the MODS. The combination with in-situ observational data can serve as a powerful tool to assess the driving factors of surface deformation in complex environments of arid regions. These results can support the study of groundwater processes, the management of mining operations, and the improvement of hazard assessments.
Acknowledgments
We would like to thank Dr. Daniel Petticord at the University of Cornell for his assistance with English language and grammatical editing of this manuscript. This research was supported by The Third Xinjiang Scientific Expedition Program (Grant No. 2021×jkk0903) and the High-End Foreign Experts Project (Grant No. E0600101). The authors express their gratitude to the European Space Agency (ESA) for providing unrestricted access to Sentinel-1 data and to the Japan Aerospace Exploration Agency (JAXA) for providing ALOS-1/PALSAR images. Both the ALOS-1/PALSAR images and the Sentinel-1 data were downloaded from the Alaska Satellite Facility (ASF).
Disclosure statement
No potential conflict of interest was reported by the authors.
Data availability statement
Data used in this study is available upon reasonable request to the first author Binbin Fan ([email protected])
Additional information
Funding
References
- Amelung, F., S. Jónsson, H. Zebker, and P. Segall. 2000. “Widespread Uplift and ‘Trapdoor’faulting on Galapagos Volcanoes Observed with Radar Interferometry.” Nature 407 (6807): 993–23.
- Andaryani, S., V. Nourani, D. Trolle, M. Dehghani, and A. Mokhtari Asl. 2019. “Assessment of Land Use and Climate Change Effects on Land Subsidence Using a Hydrological Model and Radar Technique.” Canadian Journal of Fisheries and Aquatic Sciences 578:124070. https://doi.org/10.1016/j.jhydrol.2019.124070.
- Azadnejad, S., M. Esmaeili, Y. Maghsoudi, S. Donohue, and M. Khoshlahjeh Azar. 2023. “Extending Polarimetric Optimization of Multi-Temporal InSar Techniques on Dual Polarized Sentinel-1 Data.” Advances in Space Research 72 (2): 349–360. https://doi.org/10.1016/j.asr.2023.03.009.
- Baran, I., M. P. Stewart, B. M. Kampes, Z. Perski, and P. Lilly. 2003. “A Modification to the Goldstein Radar Interferogram Filter.” IEEE Transactions on Geoscience & Remote Sensing 41 (9): 2114–2118. https://doi.org/10.1109/TGRS.2003.817212.
- Berardino, P., G. Fornaro, R. Lanari, and E. Sansosti. 2002. “A New Algorithm for Surface Deformation Monitoring Based on Small Baseline Differential SAR Interferograms.” IEEE Transactions on Geoscience & Remote Sensing 40 (11): 2375–2383. https://doi.org/10.1109/tgrs.2002.803792.
- Bing, Y., J. She, G. Liu, M. Deying, R. Zhang, Z. Zhou, and B. Zhang. 2022. “Coal Fire Identification and State Assessment by Integrating Multitemporal Thermal Infrared and InSar Remote Sensing Data: A Case Study of Midong District, Urumqi, China.” Isprs Journal of Photogrammetry & Remote Sensing 190:144–164. https://doi.org/10.1016/j.isprsjprs.2022.06.007.
- Brian, L., C. S. J. Markham, and R. Irons James. 2013. “Landsat Data Continuity Mission, Now Landsat-8: Six Months On-Orbit.” In Paper presented at the Proceeding, San Diego, California, United States, SPIE. https://doi.org/10.1117/12.2025290.
- Chen, J., W. Tonghua, D. Zou, L. Liu, W. Xiaodong, W. Gong, X. Zhu, et al. 2022. “Magnitudes and Patterns of Large-Scale Permafrost Ground Deformation Revealed by Sentinel-1 InSar on the Central Qinghai-Tibet Plateau.” Remote Sensing of Environment 268:112778. https://doi.org/10.1016/j.rse.2021.112778.
- Chen, Y., L. Zhi, Y. Fan, H. Wang, and H. Deng. 2015. “Progress and Prospects of Climate Change Impacts on Hydrology in the Arid Region of Northwest China.” Environmental Research 139:11–19. https://doi.org/10.1016/j.envres.2014.12.029.
- Conway, B. D. 2016. “Land Subsidence and Earth Fissures in South-Central and Southern Arizona, USA.” Hydrogeology Journal 24 (3): 649–655. https://doi.org/10.1007/s10040-015-1329-z.
- Costantini, M., A. Farina, and F. Zirilli. 1999. “A Fast Phase Unwrapping Algorithm for SAR Interferometry.” IEEE Transactions on Geoscience & Remote Sensing 37 (1): 452–460. https://doi.org/10.1109/36.739085.
- Cui, P., G. D. Z. Gordon, X. H. Zhu, and J. Q. Zhang. 2013. “Scale Amplification of Natural Debris Flows Caused by Cascading Landslide Dam Failures.” Geomorphology 182:173–189. https://doi.org/10.1016/j.geomorph.2012.11.009.
- Esmaeili, M., and M. Motagh. 2016. “Improved Persistent Scatterer Analysis Using Amplitude Dispersion Index Optimization of Dual Polarimetry Data.” Isprs Journal of Photogrammetry & Remote Sensing 117:108–114. https://doi.org/10.1016/j.isprsjprs.2016.03.018.
- Fan, B., G. Luo, Z. H. Ch Zhang, C. Li, Y. Wang, and L. Bai. 2013. “Evaluation of Summer Precipitation of CFSR, ERA-Interim and MERRA Reanalyses in Xinjiang.” Geographical Research 32: 1602–1612. https://doi.org/10.11821/dlyj201309003.
- Ferretti, A., A. Fumagalli, F. Novali, C. Prati, F. Rocca, and A. Rucci. 2011. “A New Algorithm for Processing Interferometric Data-Stacks: SqueeSar.” IEEE Transactions on Geoscience & Remote Sensing 49 (9): 3460–3470. https://doi.org/10.1109/tgrs.2011.2124465.
- Ferretti, A., C. Prati, and F. Rocca. 2000. “Nonlinear Subsidence Rate Estimation Using Permanent Scatterers in Differential SAR Interferometry.” IEEE Transactions on Geoscience & Remote Sensing 38 (5): 2202–2212.
- Fetter, C. W. 2018. Applied Hydrogeology. Waveland Press.
- Fialko, Y. 2006. “Interseismic Strain Accumulation and the Earthquake Potential on the Southern San Andreas Fault System.” Nature 441 (7096): 968–971.
- Fu, Q., B. Li, Y. Hou, X. Bi, and X. Zhang. 2017. “Effects of Land Use and Climate Change on Ecosystem Services in Central Asia’s Arid Regions: A Case Study in Altay Prefecture, China.” Science of the Total Environment 607-608:633–646. https://doi.org/10.1016/j.scitotenv.2017.06.241.
- Gao, W. H., and R. Han. 2020. Xinjiang Statistical Yearbook. Beijing, China: China Statistics Press.
- Hellwich, O., and H. Ebner. 2000. “Geocoding SAR Interferograms by Least Squares Adjustment.” Isprs Journal of Photogrammetry & Remote Sensing 55 (4): 277–288. https://doi.org/10.1016/S0924-2716(00)00025-3.
- Höser, T. 2018. Analysing the Capabilities and Limitations of InSar Using Sentinel-1 Data for Landslide Detection and Monitoring. Germany: Department of Geography, University of Bonn Bonn.
- Jin, H.-J., W. Qing-Bai, and V. E. Romanovsky. 2021. “Degrading Permafrost and Its Impacts.” Advances in Climate Change Research 12 (1): 1–5. https://doi.org/10.1016/j.accre.2021.01.007.
- Junle, J., and R. B. Lohman. 2021. “Coherence-Guided InSar Deformation Analysis in the Presence of Ongoing Land Surface Changes in the Imperial Valley, California.” Remote Sensing of Environment 253:112160. https://doi.org/10.1016/j.rse.2020.112160.
- Kamali, E., I. P. Muhagir, C. Loupasakis, A. Abuelgasim, K. Omari, and C. Kontoes. 2021. “Monitoring of Land Surface Subsidence Using Persistent Scatterer Interferometry Techniques and Ground Truth Data in Arid and Semi-Arid Regions, the Case of Remah, UAE.” Science of the Total Environment 776:145946. https://doi.org/10.1016/j.scitotenv.2021.145946.
- Kang, Y., L. Zhong, C. Zhao, X. Yuankun, J.-W. Kim, and A. J. Gallegos. 2021. “InSar Monitoring of Creeping Landslides in Mountainous Regions: A Case Study in Eldorado National Forest, California.” Remote Sensing of Environment 258. https://doi.org/10.1016/j.rse.2021.112400.
- Liu, Q., Z. Yang, H. Shi, and Z. Wang. 2019. “Ecological Risk Assessment of Geohazards in Natural World Heritage Sites: An Empirical Analysis of Bogda, Tianshan.” Open Geosciences 11 (1): 327–340. https://doi.org/10.1515/geo-2019-0026.
- Luo, G., Y. Feng, B. Zhang, and W. Cheng. 2010. “Sustainable Land-Use Patterns for Arid Lands: A Case Study in the Northern Slope Areas of the Tianshan Mountains.” Journal of Geographical Sciences 20 (4): 510–524. https://doi.org/10.1007/s11442-010-0510-5.
- Luo, G. P., C. H. Zhou, X. Chen, and Y. Li. 2008. “A Methodology of Characterizing Status and Trend of Land Changes in Oases: A Case Study of Sangong River Watershed, Xinjiang, China.” Journal of Environmental Management 88 (4): 775–783. https://doi.org/10.1016/j.jenvman.2007.04.003.
- Marta, B.-P., P. Ezquerro, G. Herrera, R. Tomás, C. Guardiola-Albert, J. M. Ruiz Hernández, J. A. Fernández Merodo, M. Marchamalo, and R. Martínez. 2017. “Mapping Groundwater Level and Aquifer Storage Variations from InSar Measurements in the Madrid Aquifer, Central Spain.” Canadian Journal of Fisheries and Aquatic Sciences 547: 678–689. https://doi.org/10.1016/j.jhydrol.2017.02.011.
- Massonnet, D., and K. L. Feigl. 1998. “Radar Interferometry and Its Application to Changes in the Earth’s Surface.” Reviews of Geophysics 36 (4): 441–500.
- Mimi, P., L. Zhong, C. Zhao, M. Motagh, L. Bai, B. D. Conway, and H. Chen. 2022. “Mapping Land Subsidence and Aquifer System Properties of the Willcox Basin, Arizona, from InSar Observations and Independent Component Analysis.” Remote Sensing of Environment 271: 112894. https://doi.org/10.1016/j.rse.2022.112894.
- Moretto, S., F. Bozzano, and P. Mazzanti. 2021. “The Role of Satellite InSar for Landslide Forecasting: Limitations and Openings.” Remote Sensing 13 (18): 3735.
- Navarro-Sanchez, V. D., J. M. Lopez-Sanchez, and F. Vicente-Guijalba. 2010. “A Contribution of Polarimetry to Satellite Differential SAR Interferometry: Increasing the Number of Pixel Candidates.” IEEE Geoscience & Remote Sensing Letters 7 (2): 276–280. https://doi.org/10.1109/LGRS.2009.2033013.
- Niu, F., L. Anyuan, J. Luo, Z. Lin, G. Yin, M. Liu, H. Zheng, and H. Liu. 2017. “Soil Moisture, Ground Temperatures, and Deformation of a High-Speed Railway Embankment in Northeast China.” Cold Regions Science & Technology 133: 7–14. https://doi.org/10.1016/j.coldregions.2016.10.007.
- Patton, A. I., S. L. Rathburn, and D. M. Capps. 2019. “Landslide Response to Climate Change in Permafrost Regions.” Geomorphology 340: 116–128. https://doi.org/10.1016/j.geomorph.2019.04.029.
- Riel, B., M. Simons, D. Ponti, P. Agram, and R. Jolivet. 2018. “Quantifying Ground Deformation in the Los Angeles and Santa Ana Coastal Basins Due to Groundwater Withdrawal.” Water Resources Research 54 (5): 3557–3582. https://doi.org/10.1029/2017WR021978.
- Rouyet, L., O. Karjalainen, P. Niittynen, J. Aalto, M. Luoto, T. R. Lauknes, Y. Larsen, and J. Hjort. 2021. “Environmental Controls of InSAR-Based Periglacial Ground Dynamics in a Sub-Arctic Landscape.” Journal of Geophysical Research: Earth Surface 126 (7): e2021JF006175. https://doi.org/10.1029/2021JF006175.
- Shi, X., J. Wang, M. Jiang, S. Zhang, W. Yunlong, and Y. Zhong. 2022. “Extreme Rainfall-Related Accelerations in Landslides in Danba County, Sichuan Province, as Detected by InSar.” International Journal of Applied Earth Observation and Geoinformation 115:103109. https://doi.org/10.1016/j.jag.2022.103109.
- Shi, X., and H. Xie. 2023. “Characterization of Landslide Displacements in an Active Fault Zone in Northwest China.” Earth Surface Processes and Landforms. n/a (n/a). https://doi.org/10.1002/esp.5594.
- Shi, M., H. Yang, B. Wang, J. Peng, Z. Gao, and B. Zhang. 2021. “Improving Boundary Constraint of Probability Integral Method in SBAS-Insar for Deformation Monitoring in Mining Areas.” Remote Sensing 13 (8): 1497.
- Shi, X., C. Yang, L. Zhang, H. Jiang, M. Liao, L. Zhang, and X. Liu. 2019. “Mapping and Characterizing Displacements of Active Loess Slopes Along the Upstream Yellow River with Multi-Temporal InSar Datasets.” Science of the Total Environment 674:200–210. https://doi.org/10.1016/j.scitotenv.2019.04.140.
- Shi, X., L. Zhang, T. Balz, and M. Liao. 2015. “Landslide Deformation Monitoring Using Point-Like Target Offset Tracking with Multi-Mode High-Resolution TerraSAR-X Data.” Isprs Journal of Photogrammetry & Remote Sensing 105:128–140. https://doi.org/10.1016/j.isprsjprs.2015.03.017.
- Takaku, J., T. Tadono, K. Tsutsui, and M. Ichikawa. 2016. “VALIDATION of “AW3D” GLOBAL DSM GENERATED from ALOS PRISM.” ISPRS Ann Photogramm Remote Sens Spatial Inf Sci III-4:25–31. https://doi.org/10.5194/isprs-annals-III-4-25-2016.
- Tang, W., X. Zhao, B. Gang, M. Chen, S. Cheng, M. Liao, and Y. Wenjun. 2023. “Quantifying Seasonal Ground Deformation in Taiyuan Basin, China, by Sentinel-1 InSar Time Series Analysis.” Canadian Journal of Fisheries and Aquatic Sciences 622:129654. https://doi.org/10.1016/j.jhydrol.2023.129654.
- Tan, B., F. Zhang, Q. Zhang, H. Wei, and Z. Shao. 2019. “Firefighting of Subsurface Coal Fires with Comprehensive Techniques for Detection and Control: A Case Study of the Fukang Coal Fire in the Xinjiang Region of China.” Environmental Science and Pollution Research 26 (29): 29570–29584. https://doi.org/10.1007/s11356-019-06129-3.
- Tong, X., and D. Schmidt. 2016. “Active Movement of the Cascade Landslide Complex in Washington from a Coherence-Based InSar Time Series Method.” Remote Sensing of Environment 186:405–415. https://doi.org/10.1016/j.rse.2016.09.008.
- Wang, L., K. Deng, and M. Zheng. 2020. “Research on Ground Deformation Monitoring Method in Mining Areas Using the Probability Integral Model Fusion D-Insar, Sub-Band InSar and Offset-Tracking.” International Journal of Applied Earth Observation and Geoinformation 85:101981. https://doi.org/10.1016/j.jag.2019.101981.
- Wang, Y., G. Feng, L. Zhiwei, X. Wenbin, H. Wang, H. Jun, S. Liu, and H. Lijia. 2022. “Estimating the Long-Term Deformation and Permanent Loss of Aquifer in the Southern Junggar Basin, China, Using InSar.” Canadian Journal of Fisheries and Aquatic Sciences 614:128604. https://doi.org/10.1016/j.jhydrol.2022.128604.
- Wang, Y., G. Feng, L. Zhiwei, X. Wenbin, J. Zhu, H. Lijia, Z. Xiong, and X. Qiao. 2022. “Retrieving the Displacements of the Hutubi (China) Underground Gas Storage During 2003–2020 from Multi-Track InSar.” Remote Sensing of Environment 268:112768. https://doi.org/10.1016/j.rse.2021.112768.
- Wang, C. L., C. X. Jiang, Q. Xie, and T. Feng. 2007. “Change in Microstructure of Salty Soil During Crystallization.” Journal of Southwest Jiaotong University 42 (1): 66–69.
- Wang, Z., J. Pan, Q. Hou, Y. Bensheng, L. Meng, and Q. Niu. 2018. “Anisotropic Characteristics of Low-Rank Coal Fractures in the Fukang Mining Area, China.” Fuel 211:182–193. https://doi.org/10.1016/j.fuel.2017.09.067.
- Yao, J., Y. Chen, X. Guan, Y. Zhao, J. Chen, and W. Mao. 2022. “Recent Climate and Hydrological Changes in a Mountain–Basin System in Xinjiang, China.” Earth Science Review 226:103957. https://doi.org/10.1016/j.earscirev.2022.103957.
- Yao, C. H., and Q. Hui Yao. 2013a. “The Hydrogeological Feature and Geological Hazard Prevention of M Coal Mine in Xinjiang Fukang.” Applied Mechanics & Materials 405-408:562–565. https://doi.org/10.4028/www.scientific.net/AMM.405-408.562.
- Yao, C. H., and Q. Hui Yao. 2013b. “The Hydrogeological Feature and Geological Hazard Prevention of M Coal Mine in Xinjiang Fukang.” Applied Mechanics & Materials 405: 562–565. https://doi.org/10.4028/www.scientific.net/AMM.405-408.562.
- Yin, X., Q. Feng, X. Zheng, W. Xue, M. Zhu, F. Sun, and L. Yan. 2021. “Assessing the Impacts of Irrigated Agriculture on Hydrological Regimes in an Oasis-Desert System.” Canadian Journal of Fisheries and Aquatic Sciences 594:125976. https://doi.org/10.1016/j.jhydrol.2021.125976.
- Yin, X., Q. Feng, X. Zheng, M. Zhu, W. Xue, Y. Guo, W. Min, and L. Yan. 2021. “Spatio-Temporal Dynamics and Eco-Hydrological Controls of Water and Salt Migration within and Among Different Land Uses in an Oasis-Desert System.” Science of the Total Environment 772:145572. https://doi.org/10.1016/j.scitotenv.2021.145572.
- You, H. C., L. S. Ren, and Y. M. Zhang. 2003. “Structural Geometry and Activities of the Fukang-Jimsar Fualt Zone, Xinjiang.” Seismology and Geology 25 (3): 375–384.
- Zeng, R. Q., X. M. Meng, F. Y. Zhang, S. Y. Wang, Z. J. Cui, M. S. Zhang, Y. Zhang, and G. Chen. 2016. “Characterizing Hydrological Processes on Loess Slopes Using Electrical Resistivity Tomography – a Case Study of the Heifangtai Terrace, Northwest China.” Canadian Journal of Fisheries and Aquatic Sciences 541:742–753. https://doi.org/10.1016/j.jhydrol.2016.07.033.
- Zengyun, H., C. Zhang, Q. Hu, and H. Tian. 2014. “Temperature Changes in Central Asia from 1979 to 2011 Based on Multiple Datasets.” Journal of Climate 27 (3): 1143–1167. https://doi.org/10.1175/jcli-d-13-00064.1.
- Zhang, Q., G. Luo, L. Li, M. Zhang, N. Lv, and X. Wang. 2016. “Modern Oasis Evolution Analysis Based on Land-Use and Land-Cover Change: A Case Study in Sangong River Basin on the Northern Slope of Tianshan Mountains.” Acta Geographica Sinica 71 (7): 1157–1171.
- Zhang, H.-W., X.-Y. Wang, X. Zhao, and P.-F. Liu. 2020. “In-Situ Experiment Investigations of Hydrothermal Process of Highway in Deep Seasonal Frozen Soil Regions of Inner Mongolia, China.” Journal of Central South University 27 (7): 2082–2093.
- Zhao, C., C. Liu, Q. Zhang, L. Zhong, and C. Yang. 2018. “Deformation of Linfen-Yuncheng Basin (China) and Its Mechanisms Revealed by Π-RATE InSar Technique.” Remote Sensing of Environment 218:221–230. https://doi.org/10.1016/j.rse.2018.09.021.
- Zhu, Z., X. Tang, G. Yuan, X. Zhang, X. Sun, and X. X. Chang. 2017. “A Dataset of Groundwater Level in Chinese Ecosystem Research Network (2005–2014).” China Scientific Data 1: 45–65. https://doi.org/10.11922/csdata.170.2016.0099.