
 ?Mathematical formulae have been encoded as MathML and are displayed in this HTML version using MathJax in order to improve their display. Uncheck the box to turn MathJax off. This feature requires Javascript. Click on a formula to zoom.
ABSTRACT
Watershed ecosystems play a crucial role in the global carbon cycle, and the feedback effects of carbon cycling will have significant implications for future climate change. Therefore, this study utilizes MODIS data to estimate the vegetation carbon use efficiency (CUE) of the Yangtze River Basin (hereafter referred to as the YRB) aiming to explore its spatiotemporal patterns. Additionally, partial correlation analysis is employed to investigate the driving forces of climate and ecosystem types on vegetation CUE. Furthermore, an ecological network is constructed to examine the impact of CUE changes on the stability of the ecosystems.The results indicate that the CUE values in the vegetation ecosystems of the YRB exceed the threshold of 0.5, a constant CUE value commonly used in numerous ecological models. However, even within the same geographical region, different ecosystem types exhibit distinct CUE values, underscoring the complexity of the ecological landscape.Over the past 15 years, there has been an observable declining trend in CUE for the vegetation ecosystems within the YRB. Moreover, future projections suggest a continued decrease in CUE at the pixel scale, with land use changes possibly serving as a primary contributing factor. Interestingly, within the same ecosystem, higher temperatures and reduced precipitation appear to enhance CUE, implying that under adverse environmental conditions, plants may enhance their efficiency in converting atmospheric carbon into terrestrial biomass.Ultimately, an ecological network is established to investigate the influence of CUE changes on the stability of the ecosystems. Notably, alterations in CUE within the upstream ecological source areas of the Yangtze River exhibit a particularly pronounced impact on the overall ecosystem stability.These research findings hold paramount significance, deepening our understanding of carbon cycling variations in the YRB, while also providing valuable insights for safeguarding the ecological environment and formulating strategies to address the challenges posed by climate change.
1. Introduction
Global warming persistently exerts detrimental effects on the Earth’s ecological systems, concurrently hindering the advancement and progression of human societies (Ji et al. Citation2023; L.; Li et al. Citation2022; Ma et al. Citation2023). The “China Climate Change Blue Book (Citation2022)” indicates that China’s warming rate exceeds the world on average over the same time span., making it a sensitive region to global climate change. In response to this challenge, China has explicitly set goals to achieve “carbon peaking” by 2030 and “carbon neutrality” by 2060 (J. Chen et al. Citation2021). However, the latest global carbon budget results reveal that the total global carbon emissions not only failed to decrease but also increased in 2022. The latest assessment from the Global Carbon Project (GCP) reveals that the remaining “carbon budget” to limit global warming to 1.5 degrees Celsius, which represents the amount of carbon dioxide emissions that can still be released with a 50% probability of staying below 1.5°C, stands at 3800 billion tons of carbon dioxide (GtCO2). At the current emission rate, this budget is projected to be depleted within nine years (Bauer et al. Citation2023; Pan et al. Citation2023). Therefore, achieving the dual-carbon goals is not only important for promoting high-quality commercial growth, but also crucial for improving the ecological environment.
Ecological system carbon sink refers to the process, activity, or mechanism by which ecosystems remove carbon dioxide from the atmosphere (Zeng et al. Citation2023; Zhang, Zhao, and Jiansheng Citation2023). Measures such as afforestation, forest management, and vegetation restoration can utilize photosynthesis in plants to absorb atmospheric carbon dioxide and sequester it in plants and soil, thus decreasing the levels of greenhouse gases in the atmosphere. However, the carbon uptake capacity varies among different terrestrial ecosystems. Forests and grasslands are two significant components of terrestrial ecosystems. Land use changes caused by human disturbances have had unexpected impacts on global carbon stocks (C. Chen et al. Citation2019; Scharlemann et al. Citation2014).
Vegetation Carbon Use Efficiency (hereafter referred to as CUE) is a critical indicator for assessing the ability of organisms to sequester carbon and is a key determinant of carbon stocks within ecosystems. CUE is defined as the ratio of Net Primary Productivity (NPP) to Gross Primary Productivity (GPP) (Chambers et al. Citation2004), representing the proportion of carbon allocated to growth out of the total carbon assimilated from the environment.Quantifying and analyzing CUE facilitate the exploration of carbon cycling variations in different ecosystems, assessment of the carbon sequestering capacity of forest ecosystems and the elucidation of carbon accounting mechanisms, thus contributing significantly to research on ecosystem responses under conditions of global change (Cao et al. Citation2021).
As a critical characteristic of ecosystem functioning, CUE is at the core of the world carbon cycling (Keenan et al. Citation2013). From individuals to entire ecosystems, CUE is considered a flexible and scale-dependent index (Manzoni et al. Citation2018). In recent years, numerous scientists around the world have undertaken extensive studies of forest ecosystem CUE at various spatial scales, including regional and community levels, and at various times scales (B. Li et al. Citation2019). The spatiotemporal characteristics of vegetation CUE are affected by multiple drivers such as cultivation conditions, environmental conditions, and human activities (Chen et al. Citation2019). The impact of various parameters on the level of CUE varies across multiple spatial dimensions (Chuai et al. Citation2020), and the elements that influence forest ecosystem CUE often vary over time scales. The constant CUE of 0.5 has been extensively employed in classical models of terrestrial carbon cycling and other fields (Du et al. Citation2021). Forest CUE data estimated by Delucia using the biomass and modeling methods yielded CUE between 0.20 and 0.83 for different types of forests (DeLucia et al. Citation2007) Changes in CUE with latitude are lower than changes with longitude and are strongly associated with altitude (Chuai et al. Citation2020). On the time scale, the average CUE of forest ecosystems was highest in the fall, second highest in the summer, and lowest in the spring and winter (B. Li et al. Citation2019). Additionally, forest CUE is highly susceptible to temperature and growth stage (Dillaway and Kruger Citation2014).
The YRB functions as an indispensable ecological niche for diverse biological populations, asserting its critical ecological value. Attributable to its intricate geological activities, historical climatic fluctuations, and variegated topographic conditions, the YRB is distinguished by its copious forest resources, elevated levels of species and genetic diversity, along with a wealth of natural resources and complex ecosystems. Consequently, it emerges as a beacon of biodiversity, not only within China but also globally. Delving into the CUE within the YRB is of utmost importance for elucidating the forest carbon sequestration potential, unraveling the mechanisms of carbon cycling, preserving the ecological environment, and devising efficacious strategies to combat climate change.
In the milieu of these evolving environmental conditions, our research is dedicatedly focused on the YRB as the pivotal subject area. We undertake an exhaustive analysis of the spatiotemporal fluctuations and the key determinants influencing CUE within this region. Additionally, this study intricately constructs a CUE ecological network, delving into the effects of CUE variability on the network’s resilience and stability throughout the basin. The results of this investigation provide invaluable empirical data, significantly enriching our comprehension of carbon dynamics and utilization trends in the YRB. These insights are crucial for promoting sustainable development strategies within forest ecosystems, in tandem with global environmental change adaptation. Furthermore, this research offers a solid, scientifically substantiated foundation for the formulation of policies and strategies aimed at optimizing the carbon-oxygen nexus and enhancing carbon sequestration and emissions mitigation efforts.
2. Materials and methods
2.1. Study area
The Yangtze River () is the largest river in Asia and China, and the third-longest river in the world, with a total length of approximately 6,300 kilometers. Spanning across three major economic regions in eastern, central, and western China, The YRB comprises a territory of 1.8 million square kilometers, which accounts for 18.8% of China’s national territory, and is the third-largest basin in the world. This basin boasts abundant natural resources.
Figure 1. Overview of the Yangtze River Basin. (a) Is the map of the annual average temperature distribution in the Yangtze River Basin. (b) Is the digital elevation model (DEM) distribution map of the Yangtze River Basin. (c) Is the land use and cover (Yang and Huang Citation2021) type map of the Yangtze River Basin.
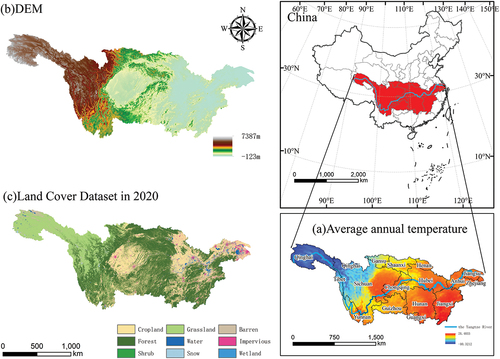
The YRB has a multi-step terrain The annual average temperature shows an east-west and south-north distribution trend, with the central and lower reaches being warmer than the upper reaches, and the Jiangnan region being warmer than the Jiangbei region. The source of the Yangtze River, located in the Qinghai-Tibet Plateau, represents the region within the entire basin with the lowest mean annual temperature.
2.2. Data sources and processing
The GPP and NPP data are sourced from the MOD17A2H Version 6 remote sensing product in the Moderate-resolution Imaging Spectroradiometer (MODIS) series, which was downloaded from the NASA website (http://modis.gsfc.nasa.gov/) with a pixel size of 500 meters. The data product includes information on GPP and photosynthesis (PSN), the latter derived by subtracting maintenance respiration (MR) from GPP (Duan et al. Citation2017). The dataset also contains a PSN Quality Control (QC) layer, which incorporates quality information pertaining to GPP and PSN.
Precipitation data was obtained from the CHIRPS Daily dataset (Funk et al. Citation2015), which is a quasi-global precipitation dataset with a coverage of over 35 years.
Temperature data was acquired from the ERA5-Land dataset (https://cds.climate.copernicus.eu/cdsapp#!/dataset/reanalysis-era5-land-monthly-means?tab=overview). The data was converted to Celsius.Land use data, on the other hand, was sourced from Earth System Science Data (Yang and Huang Citation2021).This dataset, derived from Landsat imagery, meticulously categorizes land cover across China into nine distinct classes, establishing itself as one of the most precision-oriented land-use classification datasets presently available.
2.3. Calculation of CUE
GPP refers to the quantity of energy and carbon that the ecosystem captures and stores as biomass (primarily green vegetation) in a period of time through photosythesis. The MYD17A2H product is an 8-day cumulative composite dataset that provides continuous estimates of GPP for the entire global vegetated land surface (Sjostrom et al. Citation2013).
NPP refers to the amount of biomass produced by plants that can be utilized in other parts of the food chain. NPP is calculated by subtracting the Ra from GPP (Gebremichael and Barros Citation2006). NPP demonstrates the efficiency of plants in transforming photosynthetic substances and determines the amount of material and energy that can be used by heterotrophic organisms. Monthly NPP is determined by computing the 8-day Net Photosynthesis .
represents the cost of producing fixed biomass by photosynthesis.
represents autotrophic respiration in plants and can be further divided into maintenance respiration (
) and growth respiration (
).
CUE refers to the ability of vegetation to convert absorbed carbon dioxide into carbon storage in the ecosystem, as well as the effect of self-replenishing vegetation production (Chen, Guirui, and Wang Citation2019). CUE serves as a crucial indicator for comparing carbon cycling differences across various ecosystems. A high CUE indicates a higher growth-to-transfer ratio of carbon per unit, signifying a greater potential for carbon sequestration in the biological system. Based on the GPP and NPP datasets, CUE is calculated as follows:
2.4. Theil-Sen Median slope estimation and mann-kendall trend analysis
The Theil-Sen Median method is a non-parametric statistical approach that is used to analyze trends in long-term data sets (Sen Citation1968). It is insensitive to measurement errors and outlier data, making it suitable for trend analysis in various applications (Deng et al. Citation2020). In this study, we employed this method to forecast the trend of CUE. The calculation formula is as follows:
In the equation, m and n represent different years or months. Median () represents the median value. If is greater than zero, it indicates an increasing trend in CUE; conversely, if
is less than zero, it indicates a decreasing trend.
The Mann-Kendall test (Kendall Citation1948) is a non-parametric test commonly used in combination with Theil-Sen Median test. Unlike other parametric tests, the MK test does not assume any specific distribution for the samples and is less affected by outliers, making it suitable for analyzing sequential variables.
The calculation formula for the test statistic S is as follows:
In the equation, m and n represent different years or months, represents the sign function, and its calculation formula is as follows:
2.5. Hurst index
The Hurst Index is an especially powerful tool for geographical applications to describe spatial similarity and long-run relationships (Hurst Citation1951). Rescaled Range Analysis (R/S) is a time series analysis method based on the concept of long-range dependence(Y.-Z. Wang et al. Citation2011). R/S analysis method is used to calculate the Hurst exponent, which can reflect the future short-term trends in regional vegetation CUE. The calculation method is as follows:
At the pixel scale, for any positive integer , the following is defined for the time series:
is the range of the first
values and
is their standard deviation.The ratio
, and if there exists a proportionality relationship
, This signifies the existence of the Hurst effect in the time series analyzed, H being the Hurst index.
2.6. Partial correlation coefficient
Due to the complex relationships between the study variables, this study computes partial correlation coefficients at the pixel scale based on the long sequence dataset to reflect the correlation between two variables (van Aert and Goos Citation2023). The formula for computing the first-order partial correlation coefficient is as follows:
Where is the partial correlation coefficient of variables X and Y in a given pixel when variable Z is controlled.
,
, and
are the simple correlation factors between variables X, Y, and Z, respectively.
2.7. Establishment of ecological network
2.7.1. Ecological source extraction
Ecological source areas, as fundamental components of ecological networks, represent regions characterized by relatively stable ecosystems and hold significant landscape value (Qiu et al. Citation2023). Ecological source areas play a crucial role in regional ecological processes and functions, serving as core principles and bottom lines for ecological conservation. In this study, the MSPA (Multi-Scale Landscape Patch Analysis) method is employed to determine ecological source areas.
MSPA accurately identifies habitat patches at the pixel level that play a crucial role in landscape connectivity and distinguishes landscape types and structures (X. Chen et al. Citation2023). In comparison to traditional methods that combine landscape patch morphology indices and vegetation indices for ecological hotspot extraction, this approach relies solely on land use data and offers enhanced precision.
2.7.2. Ecological resistance surface construction and ecological corridor extraction
In the process of ecological energy flow, various factors such as elevation, vegetation cover, land use types, and density factors exhibit varying degrees of impediment to ecological energy transmission. Ecological processes are closely linked to species migration; hence, ecological flows tend to occur through areas of lower resistance. Considering existing research and regional context, smaller resistance coefficients facilitate easier spatial movement of species, resulting in reduced loss of ecological services and ecosystem functionality during the flow process (Guo et al. Citation2021).
The formula for the Minimum Cumulative Resistance model is as follows:
In the formula, MCR represents the Minimum Cumulative Resistance, and reflects the minimum resistance at any point in space, positively correlated with its distance to all sources and interface characteristics.
is the spatial distance from ecological source i to land unit j, and
is the resistance coefficient of land unit i to the movement process.
Potential ecological corridors refer to the paths of least resistance in the ecological energy transmission process. By superimposing all resistance factors, the comprehensive ecological cumulative resistance surface is calculated using the Cost-distance module in ArcGIS. Subsequently, the Cost-path model is employed to generate ecological corridors along the paths of minimum resistance.
2.7.3. Ecological network topological properties
In this study, a combined approach involving latent ecological networks, complex network theory, and graph theory was employed to describe the topological characteristics of ecological spatial networks by calculating various topological metrics and integrating ecological significance.
Node degree signifies the number of ecological corridors connected to an ecological node, with higher degrees indicating enhanced capacity for material information exchange with surrounding ecological nodes. Closeness centrality refers to the reciprocal of the shortest distance from an ecological node to all other reachable nodes; higher closeness centrality implies a core position within the ecological network. Betweenness centrality quantifies the number of ecological corridors passing through a given ecological node along the shortest paths, emphasizing nodes with higher betweenness centrality possess significant control within the ecological network. Clustering coefficient reveals the degree of aggregation among ecological nodes, where elevated clustering coefficient indicates heightened stability and resistance to disturbances. Eigenvector centrality reflects the importance of adjacent ecological nodes (F. Wang et al. Citation2023).
2.7.4. Ecological network robustness
Robustness refers to the ability of a network to maintain its original functionality under damaged conditions (Qiu et al. Citation2022). This study analyzes the connectivity robustness and recovery robustness of CUE ecological networks in the YRB. Connectivity robustness reflects the network’s ability to maintain connections among remaining nodes when some nodes in the network are damaged. On the other hand, recovery robustness describes the ability of the network to restore its functionality after elements have been damaged, achieved through the implementation of simple strategies (Zhou and Elmokashfi Citation2018).
The attack patterns on complex networks are categorized into malicious attacks and random attacks. Malicious attack patterns exhibit a preference for targeting nodes with higher degrees or their associated edges, whereas random attack patterns involve the indiscriminate selection of nodes or edges for attack.
3. Results
3.1. Spatial patterns of CUE
The temporal variation of CUE in the YRB from 2005 to 2020 is shown in . The mean CUE for the basin is 0.56, ranging from a minimum of 0.07 to a maximum of 0.79, with a standard deviation of 0.11. Furthermore, it is important to note that there is a marked heterogeneity in plant CUE across different geographic regions and ecosystem types.
Figure 2. The spatial distribution characteristics of average vegetation carbon use efficiency in the Yangtze River Basin from 2005 to 2020.
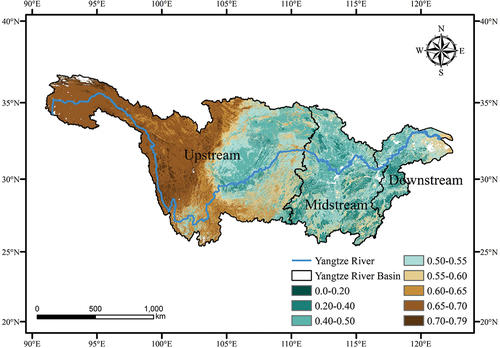
Specifically, the upstream areas of the YRB exhibit higher CUE values, while the midstream areas have lower values, and the downstream areas show slightly higher values than the midstream. Regions with elevated CUE values are often situated in cold and arid regions, where vegetation has a high carbon sequestration potential and energy demand for crop production is relatively low. Generally, forest ecosystems have generally lower CUE values compared to shrub and herbaceous vegetation (Y. Zhang et al. Citation2009). The regions with higher CUE values are distributed primarily in the high-altitude and low-temperature areas of Qinghai Province and Tibet Autonomous Region, which are part of the Qinghai-Tibetan Plateau. These areas primarily consist of grassland ecosystems, with a high coverage of grassland in mountainous or hilly regions. In contrast, cropland CUE values are lower in the middle and lower reaches of the basin, specifically in Hunan Province, Hubei Province, and Jiangxi Province. The spatial distribution of the annual average CUE is clearly associated with the distribution of different ecosystem types. Even under similar climatic conditions, CUE values vary due to the differences in ecosystem types.
3.2. Temporal patterns of CUE
displays the temporal patterns of CUE in the YRB from 2005 to 2020. During this period, noticeable trends in CUE are observed in different provinces. Specifically, Shaanxi Province, Hubei Province, and Jiangsu Province exhibit a clear increasing trend in CUE, while the eastern part of Sichuan Province, the western part of Hunan Province, and the northern part of Guizhou Province show a distinct decrease in CUE.
Figure 3. The distribution of vegetation carbon use efficiency changes in the Yangtze River Basin from 2005 to 2020.
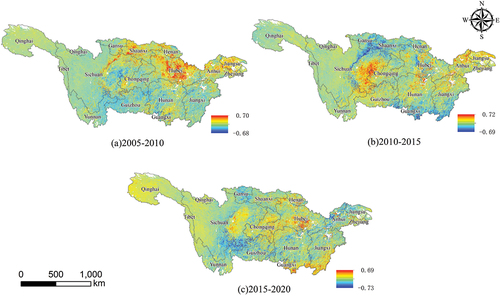
From 2015 to 2020, a continued significant increase in CUE is observed in the southern parts of Hubei Province and Jiangxi Province, whereas the southern part of Sichuan Province, Gansu Province, and the northern part of Anhui Province experience a notable decline in CUE. In contrast, the CUE in Qinghai Province and the western part of Sichuan Province remains relatively stable.
The Sen’s slope estimator and Mann-Kendall (MK) trend analysis were applied to the long-term CUE data in the YRB. The combined analysis of these two methods categorized the trend changes into seven classes. illustrates the frequency and percentage of each trend reversal class, including Very Significant Increase (VSI), Increase Significantly (IS), No Significant Increase (NSI), No Change (NC), No Significant Reduction (NSR), Significant Reduction (SR), and Very Significant Reduction (VSR). Within the YRB, 58.14% of the area shows a falling tendency in CUE, of which 63.24% are classified as No Significant Reduction and are mainly distributed in the broad-leaved forest, coniferous forest, mixed forest, and forest-grass transition zones in the upstream, middle, and downstream regions. The areas exhibiting a significant or very significant decrease in CUE accounted for 25.54%, mainly located in the upstream region, including the forest ecosystems in the southern part of Sichuan Province and the western part of Guizhou Province. Additionally, 38.38% of the area shows an increasing trend in CUE, with 71.08% of that area exhibiting a non-significant increase trend, primarily distributed in the grassland ecosystems of the upstream and downstream. Moreover, 19.42% of the area exhibits a significant or very significant increase, mainly concentrated in the eastern part of Sichuan Province in the upstream and the cultivated land ecosystems in the central parts of Zhejiang Province and Jiangsu Province in the downstream.
Figure 4. The spatiotemporal pattern of vegetation carbon use efficiency in the Yangtze River Basin. (a) Presents the trend significance results obtained using the Theil-Sen and Mann-Kendall methods. (b) Shows the Hurst index results. (c) Depicts the future trend of CUE.
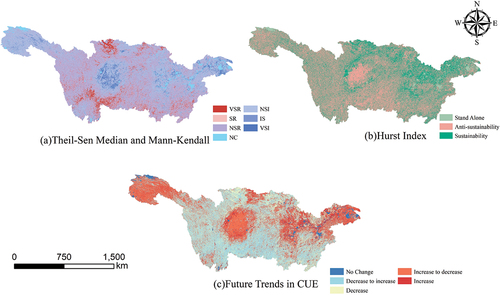
Furthermore, the Hurst index method was used to identify the sustainability of CUE changes in the YRB over time. The results, as shown in . The analysis shows that 59.69% of the regions exhibit the “Anti-sustainability” feature, indicating that the trend in the coming years will be opposite to the present trend. About 36.82% of the regions demonstrate the “Sustainability” aspect, suggesting that the future trend will be in line with the current trend and is primarily observed in forest and grassland ecosystems.
By integrating the long-term trend analysis from the Hurst index with the Sen’s slope estimator and MK trend analysis, the future CUE changes in the YRB are visualized in , including No Change, Decrease to Increase, Decrease, Increase, and Increase to Decrease categories. The results show that 36.95% of the area exhibits a transition from a declining trend to an increasing trend, mainly distributed in the central and eastern parts of the basin in forested areas and mixed forest-grass zones along the riverbanks. 22.75% of the area exhibits a transition from an increasing trend to a declining trend, primarily found in the western grasslands of Qinghai Province and the cultivated lands in the central part of Sichuan Province. Areas with a persistent increase in CUE account for 21.20%, mainly appearing in the evergreen broad-leaved forests and cultivated lands in the middle and lower reaches of the Yangtze River. Lastly, 15.63% of the area exhibits a continuous decline in CUE, mainly distributed in the northern part of the upstream and the southern part of the middle reaches.
3.3. Monthly and annual CUE
Typical monthly CUE for the YRB in 2020 is shown in .According to the monthly CUE data for the YRB in the year 2020, two peaks are appeared in April and October, with values of 0.61 and 0.63, respectively (). These peaks align with the phenology of vegetation in the YRB. During the spring months (March to May), as vegetation activity resumes, leaf and stem growth rapidly increases, and more photosynthesis is allocated to the growth and accumulation of Net Primary Productivity (NPP). However, during the summer months (June to August), CUE starts to decline and remains at lower levels, with the lowest CUE observed in July at 0.49. This phenomenon is attributed to the intense respiratory consumption by plants during the summer, resulting in slower NPP growth at the same level of photosynthetic intensity. This phenomenon is a fundamental characteristic of plant growth.
Figure 5. The vegetation carbon utilization rate results for typical months in the Yangtze River Basin in 2020. (a) Is for January (winter). (b) Is for April (spring). (c) Is for July (summer). (d) Is for October (autumn).
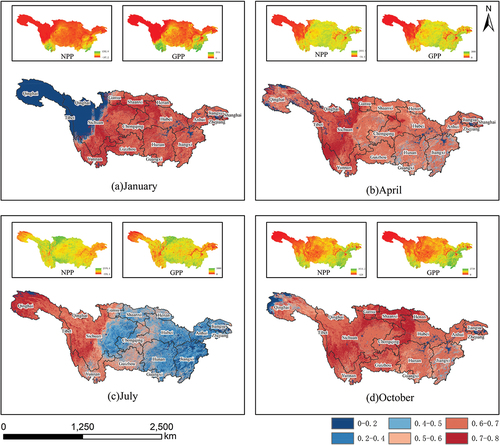
Figure 6. The monthly vegetation carbon utilization rate results for the Yangtze River Basin in 2020.
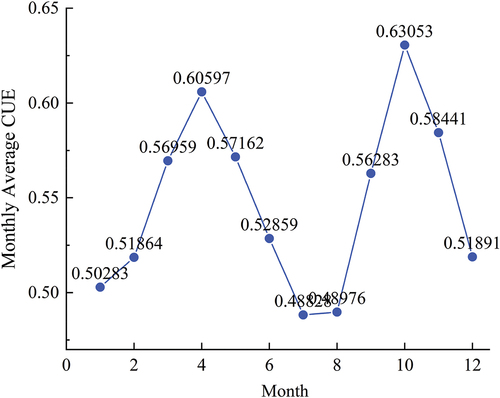
Simultaneously, CUE in winter is relatively low and exhibits substantial variation, as plants are in a dormant state during this season. This indicates that during winter, photosynthetic and growth activities of plants slow down, leading to relatively lower CUE values.
. shows the calculated average annual CUE values for all ecosystems in the YRB from 2005 to 2020, the annual average CUE has consistently remained around the level of 0.56. There is a slight overall declining trend in annual average CUE, although not statistically significant.
Figure 7. The annual average vegetation carbon use efficiency from 2005 to 2020 in the Yangtze River Basin.
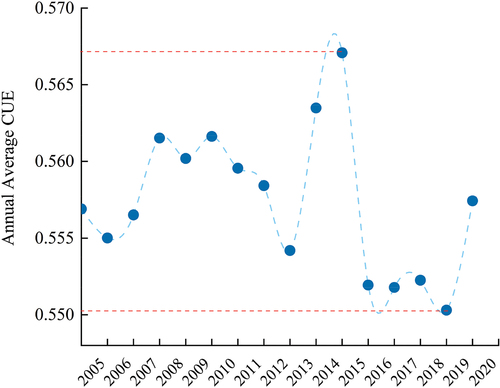
The highest annual average CUE is calculated to be 0.5671 in 2015, with the lowest value occurring in 2019 at 0.5503. From 2005 to 2013, CUE demonstrates relative stability with minor fluctuations. However, post-2013, there is a notable increase in the amplitude of CUE fluctuations. The period from 2013 to 2015 witnesses a rapid increase in CUE, followed by a significant decrease from 2015 to 2016, eventually recovering to 0.5574 in 2020.
3.4. CUE in different ecosystems
To extract the corresponding ecosystem extent based on land use types, a spatial overlay method was employed in ArcGIS software to extract the average CUE data for six ecosystem types in the YRB from 2005 to 2020. The CUE statistics for each ecosystem type are presented in . The average CUE values for these six ecosystem types range from 0.52 to 0.64. Among them, grassland ecosystems exhibit the highest average CUE value of 0.64, with a relatively stable range of 0.65. Desert ecosystems rank second with a CUE of 0.61, and they also show a relatively small variation range. In contrast, the average CUE value for cropland ecosystems is the lowest at 0.52, and it displays a larger variation range, covering only 26.41% of the entire basin. Despite being the second-largest ecosystem, cropland ecosystems still have relatively low CUE values.
Figure 8. The vegetation carbon utilization rates in different ecosystem types within the Yangtze River Basin.
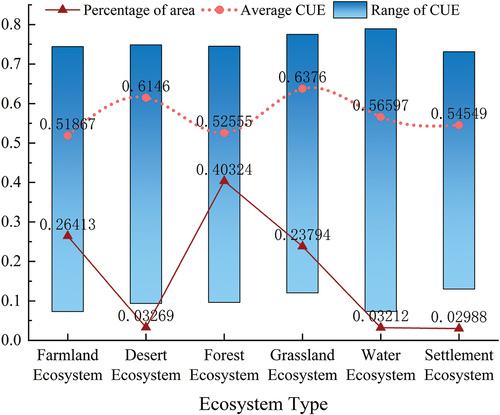
Forests account for the majority of ecosystems, with 40.32% of the land area, with a CUE of 0.53 and a moderate variation range. Grassland ecosystems demonstrate the highest ability to sequester carbon from the environment into the biomass of the soil, resulting in their highest CUE, despite their lower accumulated biomass. This is attributed to the lower autotrophic respiration in grasslands, allowing them to accumulate more NPP compared to other ecosystems with the same GPP.
Based on the secondary classification of land use types, we examined the CUE characteristics of cropland, grassland, and forest ecosystems. illustrates the distribution of CUE values for each land use type within these three ecosystems.
Figure 9. Secondary land use vegetation carbon use efficiency. (a) Represents the average value and range of CUE. (b) Shows the annual average precipitation for that land use type.
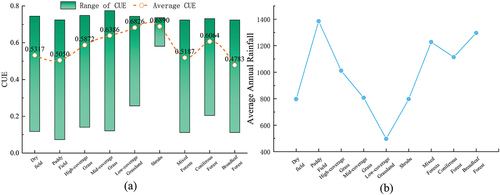
Within the forest ecosystem, broad-leaved forests exhibit the lowest CUE values and the widest variation range, primarily in the middle and lower portions of the YRB. Hilly and mountainous drylands are widespread in the middle and lower reaches of the basin, with higher CUE values than paddy fields. In the cropland ecosystem, the CUE values of different land use types follow the same order as the water stress intensity (i.e. higher water stress with less precipitation). Specifically, drylands, with lower precipitation and higher water stress, have higher CUE values, whereas paddy fields, with more precipitation and lower water stress, exhibit lower CUE values. This indicates that higher water stress in cropland results in increased CUE values.
In the grassland ecosystem, we observed a similar pattern to croplands, where lower coverage is associated with higher CUE values. This is also related to the water supply in grassland ecosystems. Grasslands with lower coverage have the highest CUE values, accounting for 26.34% of the grassland ecosystem, mainly found in desert grasslands in the arid region of Qinghai Province, with precipitation ranging from 200 to 400 millimeters. However, medium and high coverage grasslands typically exhibit a decrease in CUE values as the precipitation gradient increases.
Within the forest ecosystem, different land use types also show that lower tree canopy density corresponds to higher CUE values. The order of CUE values from low to high is as follows: broad-leaved forests, mixed forests, coniferous forests, and shrublands.
3.5. Influence of climatic factors on CUE
The YRB showcases a three-tiered geomorphology, ranging from high plateaus, hilly mountains, to expansive plains. Most parts of the basin experience a subtropical monsoon climate, characterized by pronounced seasonal variations, including periodic changes in precipitation and temperature. The onset of the rainy season leads to elevated temperatures, triggering seasonal phenological shifts in the region’s vegetation. In this study, we employ partial correlation coefficients and significance testing formulas, leveraging comprehensive datasets encompassing monthly temperature, precipitation, and CUE records spanning from 2005 to 2020, with the aim of investigating the relationship between CUE and climate factors at the pixel scale. By conducting our research at the individual image level, we can exercise greater influence over extraneous factors and decrease the impact of noise caused by temperature, precipitation, and CUE values that are subject to extreme or rapid changes.
Under the controlled influence of precipitation factors, we computed the partial correlation coefficients between CUE and temperature in the YRB and conducted significance testing, as shown in . The partial correlation coefficients between CUE and temperature ranged from −0.96 to 0.95. Regions exhibiting a positive correlation between CUE and temperature accounted for 32.36% of the total area, primarily distributed west of 113°E. Strong positive correlations (r > 0.6) were observed in the upstream regions, including grasslands in Qinghai Province and forests in Guizhou Province. On the other hand, regions displaying a negative correlation between CUE and temperature constituted 67.64% of the total area, mainly distributed east of 113°E. Strong negative correlations (r < −0.6) were evident in grasslands in Yunnan Province, forests with small canopy sizes, and grasslands in Sichuan Province, as well as forests and croplands in the middle and lower reaches, including Hubei Province, Anhui Province, and Jiangxi Province.
Figure 10. Variations in the impact of climate factors on vegetation carbon use efficiency. (a) Represents temperature factors. (b) Represents precipitation factors.
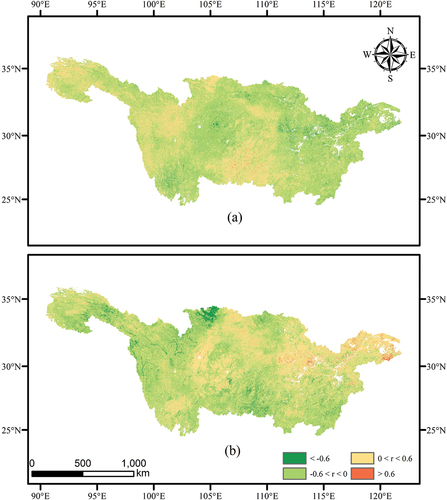
Similarly, we also calculated the partial correlation coefficients between CUE and precipitation, after eliminating the influence of temperature factors, and conducted significance testing, as shown in . The partial correlation coefficients between CUE and precipitation in the YRB ranged from −0.96 to 0.94. Regions displaying a positive correlation between CUE and precipitation accounted for 40.10% of the total area, mainly concentrated east of 102°E. Small areas with positive correlations were found in grasslands in Qinghai Province, while regions with higher correlations (r > 0.6) were distributed in urban areas and croplands in the middle and lower reaches. Conversely, regions showing a negative correlation between CUE and precipitation constituted 59.92% of the total area, primarily distributed west of 102°E. Regions with lower correlations (r < −0.6) were mainly located in croplands in Gansu Province and grasslands in Qinghai Province in the upstream regions.
Based on the above research results, we observed distinct differences in the impacts of temperature and precipitation on CUE in the YRB, particularly in the transition zone between 102°E and 113°E. Temperature changes were found to have a more pronounced effect on CUE. Previous global-scale studies have demonstrated a strong relationship between mean annual CUE of forest cover and mean annual temperature (Piao et al. Citation2010). By scaling down the time frame to monthly data, our findings align with this pattern. CUE in the YRB exhibits higher sensitivity to precipitation, while its correlation with temperature is relatively weaker.
3.6. Time series carbon utilization efficiency ecological network
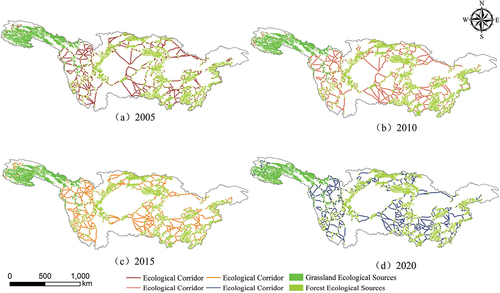
Based on the context of the YRB, this study employs the MSPA method to delineate ecological source areas. Additionally, utilizing the cost path model in ArcGIS software, an ecological spatial network of corridors is successfully generated for the period from 2005 to 2020. The analysis yields the following data ().
Table 1. Number of ecological sources and corridors.
Notably, the changes in the number of ecological corridors mirror those in ecological source areas. Further analysis reveals that the middle and downstream regions of the YRB have relatively fewer ecological corridors and ecological source areas, resulting in longer corridor lengths and sparser source distributions. In contrast, the upstream regions exhibit shorter ecological corridors and denser distributions of ecological source areas (). The downstream areas have poorer ecological conditions, indicating a need for optimization and strengthening of landscape spatial patterns.
Figure 11. The ecological network of vegetation carbon utilization efficiency in the Yangtze River Basin from 2005 to 2020.
The topological properties of CUE ecological network in the YRB for the year 2020 are depicted in . The network consists of 30 nodes with a degree greater than or equal to 6, and among them, Node 248 has the highest degree of 13, indicating its significant role in the network. The minimum degree is 1, indicating that each node is connected to at least one other node, and there are no isolated nodes.
Figure 12. The topological properties of the ecological network in the Yangtze River Basin. (a) Degree. (b) Betweenness centrality. (c) Clustering. (d) Eigenvector centrality. (e) Closeness centrality.
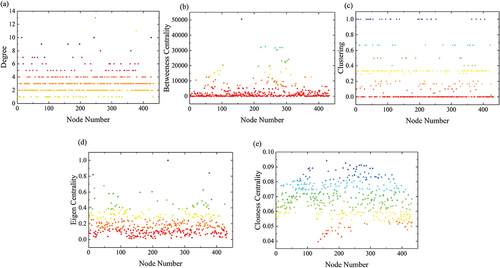
There are 60 nodes with a clustering coefficient greater than 0.5, and 28 of these nodes have a clustering coefficient of 1, signifying strong similarity with their connected nodes. On the other hand, 218 nodes have a clustering coefficient of 0, indicating greater heterogeneity with their connected nodes. The Closeness Centrality values show relatively little variation, with 409 nodes having values greater than 0.05. Node 161 has the highest closeness centrality value of 0.09, indicating its central position in the network. In terms of Betweenness Centrality, 362 nodes have values greater than 1.000, with Node 161 having the highest centrality value of 50,490, suggesting its importance in facilitating energy transfer. Conversely, 65 nodes have a centrality value of zero, indicating their limited contribution to material and energy exchange. Additionally, there are 13 nodes with Eigenvector Centrality greater than 0.5, and Node 248 has the maximum value of 1, indicating its significance along with its connected nodes.
In summary, the CUE ecological network of the YRB in 2020 exhibits numerous important nodes, showcasing both significant similarity and heterogeneity among the nodes. Node 161 plays a crucial role in the network and facilitates energy transfer.
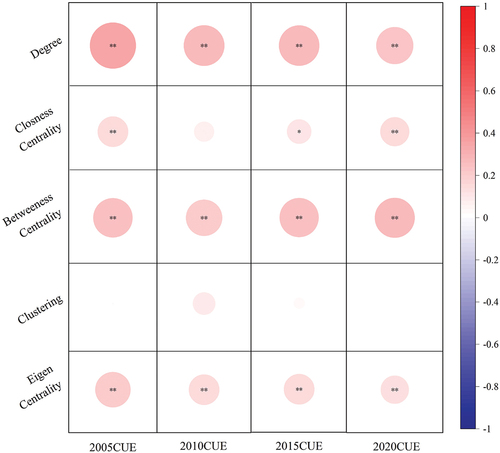
This study employed Pearson correlation analysis to establish the relationship between carbon utilization efficiency and topological indicators, as depicted in . Our findings indicate that, except for Closeness Centrality and Clustering, topological indicators across all years exhibit a highly significant correlation with carbon utilization efficiency, demonstrating a consistently significant positive correlation. Enhancing these topological indicators can effectively improve the CUE of the source region. For example, the augmentation of corridors connecting pivotal source sites serves to effectively elevate node degrees. The introduction of stepping stone patches between two source areas mitigates the challenge of overly extended corridors, thereby amplifying the betweenness centrality of central source sites. Alternatively, optimizing the ecological functionalities of source areas fortifies their impact on surrounding locales, consequently bolstering the CUE of source areas through strategic modifications to their topological characteristics.
Figure 13. The correlation between topological indicators and vegetation carbon utilization efficiency. Asterisks indicate statistical significance: **p < 0.01.
3.7. The effect of CUE on the stability of ecological networks
According to , from 2005 to 2020, the average CUE of the upstream ecological source areas in the YRB exhibit an initial increase followed by a decrease.
Figure 14. The changes in average vegetation carbon utilization efficiency in ecological source areas from 2005 to 2020.
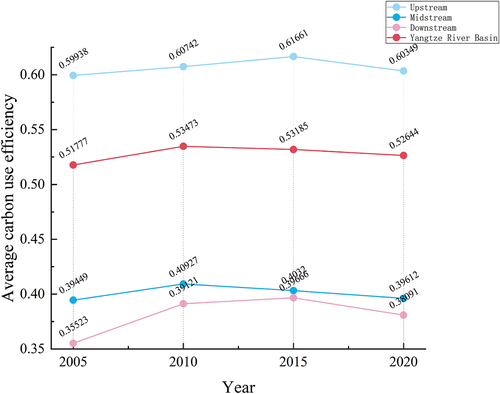
Specifically, from 2005 to 2015, it increases from 0.5994 to 0.6166, and then from 2015 to 2020, it decreases to 0.6035. Similarly, the average CUE of the midstream ecological source areas also shows an initial increase and subsequent decrease. From 2005 to 2010, it rises from 0.3945 to 0.4093, and then from 2010 to 2020, it declines to 0.3961. As for the downstream ecological source areas, the average CUE displays an initial increase followed by a decrease. From 2005 to 2010, it significantly increases from 0.3552 to 0.3912, reaches a peak in 2015 at 0.3967, and then decreases to 0.3809 in 2020.Overall, the carbon utilization efficiency of the ecological source areas in the YRB exhibit an increasing trend from 2005 to 2010 and a decreasing trend from 2015 to 2020.
The figure in illustrates the changes in edge and node recovery robustness of the CUE ecological network in the YRB when subjected to random and malicious attacks from 2005 to 2020.
Figure 15. The changes in edge recovery robustness and node recovery robustness of the ecological network of vegetation carbon utilization efficiency in the Yangtze River Basin from 2005 to 2020 under malicious and random attacks.
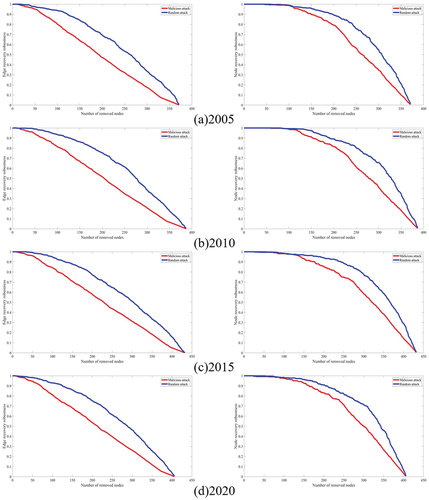
Overall, from 2005 to 2010, the average carbon utilization efficiency of the ecological source areas in the upstream, midstream, and downstream regions increases, indicating an overall improvement in the stability of the ecological network. From 2010 to 2015, the average carbon utilization efficiency in the upstream increases, while it decreases in the midstream and downstream areas, but the network’s stability continues to improve. From 2015 to 2020, the average carbon utilization efficiency in all three regions (upstream, midstream, and downstream) decreases, leading to a deterioration in the network’s stability. Notably, the carbon utilization efficiency of the upstream ecological source areas has a more significant impact on the overall stability of the ecological network.
4. Discussion
4.1. Drivers of CUE changes
The variability in vegetation CUE is influenced by a confluence of natural factors such as geographical location, seasonality, altitude, climate, and ecosystem type. Predominantly, the type of ecosystem and the specific vegetation type emerge as the primary drivers shaping the trends and patterns of CUE fluctuations. Concurrently, other elements like seasonal changes, temperature, and precipitation demonstrate non-linear relationships with CUE. In addition, the geographical context and the encompassing environmental conditions of the vegetation indirectly modulate the discerned patterns of CUE, indicating the complex interplay of localized and broader ecological dynamics (Anderson-Teixeira and Kannenberg Citation2022; Wei and Shen Citation2022).
In the upstream regions of the Yangtze River, grasslands demonstrate notably higher productivity compared to other vegetation types, contributing to a relatively stable CUE during the growth period. However, elevated temperatures have been observed to impede vegetation productivity, likely due to increased respiration rates and diminished carbon assimilation as a result of plant stomatal closure, ultimately leading to a reduction in vegetation CUE. Both evergreen needle-leaf and deciduous vegetations exhibit similar levels of productivity and mean CUE, yet their response to climatic fluctuations varies significantly owing to their distinct geographical locations. For example, the CUE of evergreen broadleaf forests in the upstream areas tends to decrease with rising temperatures, while vegetation in the downstream coastal regions shows an increase in CUE under warmer conditions.Furthermore, specific landscapes, such as valley floors and canyons, prove to be more responsive to both temperature and rainfall, suggesting that vegetation CUE is more adaptable under stressful environmental stressors than under growth-enhancing conditions (Bradford and Crowther Citation2013). NPP/GPP/CUE dynamics in shrublands, grasslands, croplands, and wastelands demonstrate prominent seasonal variations, with lower vegetation coverage resulting in higher CUE instability and heightened sensitivity to climate changes.
In conclusion, the variability observed in vegetation CUE is governed by a multitude of factors. Thoroughly understanding the impact of these diverse factors on CUE is instrumental in acquiring a more profound comprehension of the ecological responses and adaptability of vegetation types. This knowledge is crucial for predicting and managing the impacts of environmental changes on vegetation dynamics and ecosystem functioning.
4.2. Impacts of CUE changes on watersheds
For a significant period, safeguarding vegetation has remained a fundamental element of ecological restoration. Plants are acknowledged as the sole carbon sink method that does not deplete energy, making substantial contributions toward achieving the “dual carbon” objectives(S. Cao et al. Citation2023). Nevertheless, quantifying the impact of CUE on the stability of watershed ecosystems has posed persistent challenges. In recent years, scholars have proposed employing the stability of ecological networks to characterize the stability of corresponding ecosystems, by simulating the interactions of matter and energy within these ecological systems and abstracting and simplifying their constituent elements. Building ecological networks facilitates a deeper exploration of the internal topological connections in the model and provides a basis for developing optimization strategies.
Watershed ecosystems are complex ecological entities, comprising a diverse array of components including rivers, lakes, wetlands, forests, grasslands, and agricultural lands. These components are interlinked and interdependent, collectively maintaining the ecological equilibrium of the watershed. Notably, alterations within any single component can have cascading effects throughout the entire watershed, leading to temporal shifts that span beyond a mere annual scope, manifesting in a prolonged series of ecological fluctuations. This study introduces the development of an ecological network within the Yangtze River Basin (YRB) to assess the influence of Carbon Use Efficiency (CUE) on the overall stability of the watershed’s ecosystems. The findings indicate an improvement in the ecological state of the YRB, marked by increases in forest and grassland coverage and extents, thereby contributing to enhanced carbon utilization efficiency across the basin.However, the ecological spatial network reveals distinctive trends in the CUE of ecological source areas across the upstream, midstream, and downstream regions. During the period from 2005 to 2010, the average CUE of ecological source areas in these regions witnessed an increase, contributing to an overall enhancement of the ecological network’s stability. From 2010 to 2015, while the upstream experienced an upsurge in average CUE, the midstream and downstream exhibited a decrease; nevertheless, the ecological network’s stability continued to advance. Subsequently, from 2015 to 2020, the average CUE in all regions declined, resulting in a reduction of the network’s stability. Evidently, the CUE of ecological source areas in the upstream exerted a more pronounced influence on the overall stability of the ecological network.
Building ecological networks in watersheds facilitates a comprehensive comprehension of ecological source areas within the entire watershed ecosystem, elucidates the interconnections among diverse ecosystems within the watershed, and emphasizes the interdependence of its constituents.
The combination of worldwide climate change and human activities has led to severe dryland conversion, resulting in soil nutrient depletion, desertification, and exacerbated water stress for grassland vegetation (Li et al. Citation2014; Zhang et al. Citation2018). As a result, the conservation of forested areas, along with the maintenance and augmentation of forest productivity, emerge as critical undertakings. These initiatives are instrumental in mitigating grassland degradation, curbing soil erosion, and preventing the expansion of steppes. Moreover, they significantly contribute to augmenting the carbon storage capacity of forest ecosystems. Such measures are vital for fostering the sustainable evolution of ecosystems, ensuring their resilience and ecological balance in the face of environmental challenges.
4.3. Non-linear characterization of ecological networks
The elucidation of interrelationships among constituent elements within complex systems represents a paramount area of current scholarly focus. In actual complex systems, a conspicuous contradiction often manifests: system variables exhibit positive correlation at certain junctures, yet at other instances, they demonstrate no correlation or even inverse correlation. This phenomenon is likely contingent on the prevailing state of the system (Rigal et al. Citation2023; Sugihara et al. Citation2012). Such state-dependent dynamics are quintessential indicators of complex nonlinear systems, with nonlinearity being a ubiquitous characteristic in myriad ecological systems (Jie and Convertino Citation2021).
While correlation itself is not a definitive criterion for establishing causation, it is often a pivotal concept in discussing relationships among elements within ecological frameworks. Nonetheless, the lack of correlation should not be misconstrued as evidence for the absence of causal relationships. Therefore, despite the observed modest correlation between CUE and the topological characteristics of ecological source areas, the possibility of an underlying causal connection cannot be summarily dismissed. This stance is rooted in the recognition that complex ecological systems operate as cohesive wholes, characterized by a constant state of dynamic interaction among their internal components.
4.4. Limitations and prospects
Existing research indicates that CUE is affected by a multitude of conditions, including exposure to daylight, CO2 content, soil composition, forest architecture, and human behavior (Liu et al. Citation2022; Yu et al. Citation2016). However, this paper did not delve into these specific factors. Among them, the impact of human activities is of paramount importance, but quantifying its effects can be challenging, especially concerning deforestation, the environmental disruption caused by engineering projects, and the implementation of policies such as afforestation and reforestation, which are crucial in studying long-term CUE variations. Overall, it is crucial to recognize that CUE is not a constant value; rather, its fluctuations are driven by both internal forest conditions and external environmental factors (Street et al. Citation2013). However, the exact mechanisms underpinning these observations require additional exploration. Watershed ecosystems are typically composed of a diverse array of ecosystem types, and the patterns of CUE within these systems on a global scale warrant further in-depth study. This highlights the need for a more comprehensive understanding of the interplay between different ecosystem types within watersheds and their collective impact on global CUE regularities.
Considering that this study is fundamentally anchored in watershed ecosystems, the inherent directed diffusion within the topological structure of river networks has been both theoretically and empirically substantiated as a crucial factor underpinning ecosystem stability. This understanding underscores the significant role of river network dynamics in maintaining ecological equilibrium and resilience, highlighting the interconnectivity and systemic dependencies within watershed ecosystems (Rinaldo, Gatto, and Rodriguez-Iturbe Citation2018). Its pronounced effects are intimately connected with the development or decline of biodiversity, population dynamics including biological invasions, and the spread of water-borne diseases. A critical direction for future research involves integrating river network structures within existing ecological networks, assessing the influence of these river networks on the overall stability of the system, and understanding the mechanisms driving this influence.
The interplay between ecological networks and CUE is inherently bidirectional, reflecting their role in facilitating interactions among diverse ecosystem components and modulating energy flow. Detailed examination of the symbiosis between ecological networks and CUE establishes a strong scientific foundation for the conservation and rejuvenation of the entire watershed ecosystem. This insight empowers policy-makers to craft strategies focused on the preservation of critical ecological zones, prioritizing ecosystems with higher CUE to enhance carbon sequestration and augment climate change mitigation initiatives. Furthermore, this enhanced understanding provides a deeper insight into ecosystem adaptability in response to climatic variations, thereby aiding in the formulation of more effective strategies for climate change mitigation and adaptation.
5. Conclusions
This research utilizes data from the MODIS covering the period from 2005 to 2020 to estimate CUE in the terrestrial ecosystems of the YRB. It investigates the spatiotemporal patterns of CUE across diverse ecosystems within the basin and unravels the principal factors driving these patterns. Additionally, an ecological network for the YRB has been developed to map interconnections among various ecosystems, and the stability of each ecosystem is quantified through comprehensive ecological network analysis. The key findings of this study are outlined as follows: (1)The terrestrial ecosystems within the YRB exhibit a higher CUE value than the commonly defined CUE value of 0.5 in many ecological models. The CUE value varies with different ecosystem types. The spatial distribution of the annual average CUE is evidently correlated with the distribution of ecosystems within the region.
The CUE is significantly influenced by seasonality and is closely associated with plant phenology. Over the past 16 years, the carbon uptake efficiency within the YRB has exhibited a declining trend. Projections indicate a shift from decline to an increasing trend in the future for the central and eastern forested areas as well as the forest-grass mix zones along the valley sides within the Yangtze River Basin.
The partial correlation coefficient between CUE and temperature in the YRB ranges from −0.96 to 0.95, while the partial correlation coefficient between CUE and precipitation ranges from −0.96 to 0.94. Within the transitional area of 102°E to 113°E, the impact of temperature and precipitation on CUE differs distinctly between the eastern and western regions, with temperature changes demonstrating a more pronounced influence on CUE.
From 2005 to 2020, there was a slight decline in carbon storage in the YRB, which aligns with the trend of CUE changes. The stability of the ecological network varies with CUE fluctuations, as alterations in CUE can impact the overall ecological system stability. The carbon utilization efficiency of the upstream ecological source areas has a more pronounced influence on the overall ecological system stability of the YRB.
Disclosure statement
No potential conflict of interest was reported by the author(s).
Data availability statement
The data that supported the findings of this study were obtained from publicly available datasets, and the websites providing access to these datasets were included in the article.
Correction Statement
This article has been republished with minor changes. These changes do not impact the academic content of the article.
Additional information
Funding
References
- Anderson-Teixeira, K. J., and S. A. Kannenberg. 2022. “What Drives Forest Carbon Storage? The Ramifications of Source-Sink Decoupling.” New Phytologist 236 (1): 5–22. https://doi.org/10.1111/nph.18415.
- Bauer, N., D. P. Keller, J. Garbe, K. Karsten, F. Piontek, W. von Bloh, W. Thiery, et al. 2023. “Exploring Risks and Benefits of Overshooting a 1.5 Degrees C Carbon Budget Over Space and Time.” Environmental Research Letters 18 (5): 054015. https://doi.org/10.1088/1748-9326/accd83.
- Bradford, M. A., and T. W. Crowther. 2013. “Carbon Use Efficiency and Storage in Terrestrial Ecosystems.” New Phytologist 199 (1): 7–9. https://doi.org/10.1111/nph.12334.
- Cao, Q., W. Kang, M. Jawad Sajid, and M. Cao. 2021. “Research on the Optimization of Carbon Abatement Efficiency in China on the Basis of Task Allocation.” Journal Of Cleaner Production 299 (May): 126912. https://doi.org/10.1016/j.jclepro.2021.126912.
- Cao, S., H. Yi, L. Zhang, Q. Sun, Y. Zhang, H. Li, X. Wei, and Y. Liu. 2023. “Spatiotemporal Dynamics of Vegetation Net Ecosystem Productivity and Its Response to Drought in Northwest China.” Giscience & Remote Sensing 60 (1): 2194597. https://doi.org/10.1080/15481603.2023.2194597.
- Chambers, J. Q., E. S. Tribuzy, L. C. Toledo, B. F. Crispim, N. Higuchi, J. dos Santos, A. C. Araujo, B. Kruijt, A. D. Nobre, and S. E. Trumbore. 2004. “Respiration from a Tropical Forest Ecosystem: Partitioning of Sources and Low Carbon Use Efficiency.” Ecological Applications 14 (4): S72–88. https://doi.org/10.1890/01-6012.
- Chen, J., H. Cui, Y. Xu, and G. Quansheng. 2021. “Long-Term Temperature and Sea-Level Rise Stabilization Before and Beyond 2100: Estimating the Additional Climate Mitigation Contribution from China’s Recent 2060 Carbon Neutrality Pledge.” Environmental Research Letters 16 (7): 074032. https://doi.org/10.1088/1748-9326/ac0cac.
- Chen, Z., Y. Guirui, and Q. Wang. 2019. “Magnitude, Pattern and Controls of Carbon Flux and Carbon Use Efficiency in China’s Typical Forests.” Global And Planetary Change 172 (January): 464–473. https://doi.org/10.1016/j.gloplacha.2018.11.004.
- Chen, X., B. Kang, M. Li, Z. Du, L. Zhang, and H. Li. 2023. “Identification of Priority Areas for Territorial Ecological Conservation and Restoration Based on Ecological Networks: A Case Study of Tianjin City, China.” Ecological Indicators 146 (February): 109809. https://doi.org/10.1016/j.ecolind.2022.109809.
- Chen, C., T. Park, X. Wang, S. Piao, B. Xu, R. K. Chaturvedi, R. Fuchs, et al. 2019. “China and India Lead in Greening of the World Through Land-Use Management.” Nature Sustainability 2 (2): 122–129. https://doi.org/10.1038/s41893-019-0220-7.
- Chuai, X., X. Guo, M. Zhang, Y. Yuan, J. Li, R. Zhao, W. Yang, and J. Li. 2020. “Vegetation and Climate Zones Based Carbon Use Efficiency Variation and the Main Determinants Analysis in China.” Ecological Indicators 111 (April): 105967. https://doi.org/10.1016/j.ecolind.2019.105967.
- DeLucia, E. H., J. E. Drake, R. B. Thomas, and M. Gonzalez-Meler. 2007. “Forest Carbon Use Efficiency: Is Respiration a Constant Fraction of Gross Primary Production?.” Global Change Biology 13 (6): 1157–1167. https://doi.org/10.1111/j.1365-2486.2007.01365.x.
- Deng, Y., S. Wang, X. Bai, G. Luo, L. Wu, Y. Cao, H. Li, et al. 2020. “Variation Trend of Global Soil Moisture and Its Cause Analysis.” Ecological Indicators 110 (March): 105939. https://doi.org/10.1016/j.ecolind.2019.105939.
- Dillaway, D. N., and E. L. Kruger. 2014. “Trends in Seedling Growth and Carbon-Use Efficiency Vary Among Broadleaf Tree Species Along a Latitudinal Transect in Eastern North America.” Global Change Biology 20 (3): 908–922. https://doi.org/10.1111/gcb.12427.
- Duan, S.-B., Z.-L. Li, J. Cheng, and P. Leng. 2017. “Cross-Satellite Comparison of Operational Land Surface Temperature Products Derived from MODIS and ASTER Data Over Bare Soil Surfaces.” ISPRS Journal of Photogrammetry and Remote Sensing 126 (April): 1–10. https://doi.org/10.1016/j.isprsjprs.2017.02.003.
- Du, L., F. Gong, Y. Zeng, L. Ma, C. Qiao, and W. Hongyue. 2021. “Carbon Use Efficiency of Terrestrial Ecosystems in Desert/Grassland Biome Transition Zone: A Case in Ningxia Province, Northwest China.” Ecological Indicators 120 (January): 106971. https://doi.org/10.1016/j.ecolind.2020.106971.
- Funk, C., P. Peterson, M. Landsfeld, D. Pedreros, J. Verdin, S. Shukla, G. Husak, et al. 2015. “The Climate Hazards Infrared Precipitation with Stations—A New Environmental Record for Monitoring Extremes.” Scientific Data 2 (1): 150066. https://doi.org/10.1038/sdata.2015.66.
- Gebremichael, M., and A. P. Barros. 2006. “Evaluation of MODIS Gross Primary Productivity (GPP) in Tropical Monsoon Regions.” Remote Sensing of Environment 100 (2): 150–166. https://doi.org/10.1016/j.rse.2005.10.009.
- Guo, H., Q. Yu, Y. Pei, G. Wang, and D. Yue. 2021. “Optimization of Landscape Spatial Structure Aiming at Achieving Carbon Neutrality in Desert and Mining Areas.” Journal of Cleaner Production 322 (November): 129156. https://doi.org/10.1016/j.jclepro.2021.129156.
- Hurst, H. E. 1951. “Long-Term Storage Capacity of Reservoirs.” Transactions of the American Society of Civil Engineers 116 (1): 770–799. https://doi.org/10.1061/TACEAT.0006518.
- Jie, L., and M. Convertino. 2021. “Inferring Ecosystem Networks as Information Flows.” Scientific Reports 11 (1): 7094. https://doi.org/10.1038/s41598-021-86476-9.
- Ji, Y., J. Fu, Y. Lu, and B. Liu. 2023. “Three-Dimensional-Based Global Drought Projection Under Global Warming Tendency.” Atmospheric Research 291 (August): 106812. https://doi.org/10.1016/j.atmosres.2023.106812.
- Keenan, T. F., D. Y. Hollinger, G. Bohrer, D. Dragoni, J. W. Munger, H. P. Schmid, and A. D. Richardson. 2013. “Increase in Forest Water-Use Efficiency as Atmospheric Carbon Dioxide Concentrations Rise.” Nature 499 (7458): 324±. https://doi.org/10.1038/nature12291.
- Kendall, M. G. 1948. “Rank Correlation Methods.” In Rank Correlation Methods. Oxford, England: Griffin.
- Li, B., F. Huang, S. Chang, and N. Sun. 2019. “The Variations of Satellite-Based Ecosystem Water Use and Carbon Use Efficiency and Their Linkages with Climate and Human Drivers in the Songnen Plain, China.” Advances in Meteorology 2019:8659138. https://doi.org/10.1155/2019/8659138.
- Li, B., F. Huang, L. Qin, H. Qi, and N. Sun. 2019. “Spatio-Temporal Variations of Carbon Use Efficiency in Natural Terrestrial Ecosystems and the Relationship with Climatic Factors in the Songnen Plain, China.” Remote Sensing 11 (21): 2513. https://doi.org/10.3390/rs11212513.
- Liu, Z., Z. Chen, G. Yu, M. Yang, W. Zhang, T. Zhang, and L. Han. 2022. “Ecosystem Carbon Use Efficiency in Ecologically Vulnerable Areas in China: Variation and Influencing Factors.” Frontiers in Plant Science 13 (December): 1062055. https://doi.org/10.3389/fpls.2022.1062055.
- Li, L., Y. Zhang, T. Zhou, K. Wang, C. Wang, T. Wang, L. Yuan, K. An, C. Zhou, and G. Lu. 2022. “Mitigation of China’s Carbon Neutrality to Global Warming.” Nature Communications 13 (1): 5315. https://doi.org/10.1038/s41467-022-33047-9.
- Li, J., L. Zhao, B. Xu, X. Yang, Y. Jin, T. Gao, H. Yu, F. Zhao, H. Ma, and Z. Qin. 2014. “Spatiotemporal Variations in Grassland Desertification Based on Landsat Images and Spectral Mixture Analysis in Yanchi County of Ningxia, China.” IEEE Journal of Selected Topics in Applied Earth Observations & Remote Sensing 7 (11): 4393–4402. https://doi.org/10.1109/JSTARS.2014.2348612.
- Manzoni, S., P. Capek, P. Porada, M. Thurner, M. Winterdahl, C. Beer, V. Bruchert, et al. 2018. “Reviews and Syntheses: Carbon Use Efficiency from Organisms to Ecosystems - Definitions, Theories, and Empirical Evidence.” Biogeosciences 15 (19): 5929–5949. https://doi.org/10.5194/bg-15-5929-2018.
- Ma, X., T. Peng, Y. Zhang, L. Wang, and X. Pan. 2023. “Accelerating Carbon Neutrality Could Help China?s Energy System Align with Below 1.5?C.” Journal Of Environmental Management 337 (July): 117753. https://doi.org/10.1016/j.jenvman.2023.117753.
- Pan, X.-Z., F. Teng, Y. Robiou Du Pont, and H.-L. Wang. 2023. “Understanding Equity-Efficiency Interaction in the Distribution of Global Carbon Budgets.” Advances in Climate Change Research 14 (1): 13–22. https://doi.org/10.1016/j.accre.2022.08.002.
- Piao, S., S. Luyssaert, P. Ciais, I. A. Janssens, A. Chen, C. Cao, J. Fang, P. Friedlingstein, Y. Luo, and S. Wang. 2010. “Forest Annual Carbon Cost: A Global-Scale Analysis of Autotrophic Respiration.” Ecology 91 (3): 652–661. https://doi.org/10.1890/08-2176.1.
- Qiu, S., M. Fang, Q. Yu, T. Niu, H. Liu, F. Wang, C. Xu, M. Ai, and J. Zhang. 2023. “Study of Spatialtemporal Changes in Chinese Forest Eco-Space and Optimization Strategies for Enhancing Carbon Sequestration Capacity Through Ecological Spatial Network Theory.” Science of the Total Environment 859 (February): 160035. https://doi.org/10.1016/j.scitotenv.2022.160035.
- Qiu, S., Q. Yu, T. Niu, M. Fang, H. Guo, H. Liu, and S. Li. 2022. “Study on the Landscape Space of Typical Mining Areas in Xuzhou City from 2000 to 2020 and Optimization Strategies for Carbon Sink Enhancement.” Remote Sensing 14 (17): 4185. https://doi.org/10.3390/rs14174185.
- Que, Qingchen. 2022. China Climate Change Blue Book. China: Science Press.
- Rigal, S., V. Dakos, H. Alonso, A. Auniņš, Z. Benkő, L. Brotons, T. Chodkiewicz, et al. 2023. “Farmland Practices Are Driving Bird Population Decline across Europe.” Proceedings of the National Academy of Sciences 120 (21): e2216573120. https://doi.org/10.1073/pnas.2216573120.
- Rinaldo, A., M. Gatto, and I. Rodriguez-Iturbe. 2018. “River Networks as Ecological Corridors: A Coherent Ecohydrological Perspective.” Advances in Water Resources 112 (February): 27–58. https://doi.org/10.1016/j.advwatres.2017.10.005.
- Scharlemann, J. P. W., E. V. J. Tanner, R. Hiederer, and V. Kapos. 2014. “Global Soil Carbon: Understanding and Managing the Largest Terrestrial Carbon Pool.” Carbon Management 5 (1): 81–91. https://doi.org/10.4155/CMT.13.77.
- Sen, P. K. 1968. “Estimates of the Regression Coefficient Based on Kendall’s Tau.” Journal of the American Statistical Association 63 (324): 1379–1389. https://doi.org/10.1080/01621459.1968.10480934.
- Sjostrom, M., M. Zhao, S. Archibald, A. Arneth, B. Cappelaere, U. Falk, A. de Grandcourt, et al. 2013. “Evaluation of MODIS Gross Primary Productivity for Africa Using Eddy Covariance Data.” Remote Sensing Of Environment 131 (April): 275–286. https://doi.org/10.1016/j.rse.2012.12.023.
- Street, L. E., J.-A. Subke, M. Sommerkorn, V. Sloan, H. Ducrotoy, G. K. Phoenix, and M. Williams. 2013. “The Role of Mosses in Carbon Uptake and Partitioning in Arctic Vegetation.” New Phytologist 199 (1): 163–175. https://doi.org/10.1111/nph.12285.
- Sugihara, G., R. May, H. Ye, C.-H. Hsieh, E. Deyle, M. Fogarty, and S. Munch. 2012. “Detecting Causality in Complex Ecosystems.” Science 338 (6106): 496–500. https://doi.org/10.1126/science.1227079.
- van Aert, R. C. M., and C. Goos. 2023. “A Critical Reflection on Computing the Sampling Variance of the Partial Correlation Coefficient.” Research Synthesis Methods 14 (3): 520–525. https://doi.org/10.1002/jrsm.1632.
- Wang, Y.-Z., B. Li, R.-Q. Wang, J. Su, and X.-X. Rong. 2011. “Application of the Hurst Exponent in Ecology.” Computers & Mathematics with Applications 61 (8): 2129–2131. https://doi.org/10.1016/j.camwa.2010.08.095.
- Wang, F., Q. Yu, S. Qiu, C. Xu, J. Ma, and H. Liu. 2023. “Study on the Relationship Between Topological Characteristics of Ecological Spatial Network and Soil Conservation Function in Southeastern Tibet, China.” Ecological Indicators 146 (February): 109791. https://doi.org/10.1016/j.ecolind.2022.109791.
- Wei, J., and M. Shen. 2022. “Analysis of the Efficiency of Forest Carbon Sinks and Its Influencing Factors-Evidence from China.” Sustainability 14 (18): 11155. https://doi.org/10.3390/su141811155.
- Yang, J., and X. Huang. 2021. “The 30 M Annual Land Cover Dataset and Its Dynamics in China from 1990 to 2019.” Earth System Science Data 13 (8): 3907–3925. https://doi.org/10.5194/essd-13-3907-2021.
- Yu, G., W. Ren, Z. Chen, L. Zhang, Q. Wang, X. Wen, N. He, et al. 2016. “Construction and Progress of Chinese Terrestrial Ecosystem Carbon, Nitrogen and Water Fluxes Coordinated Observation.” Journal Of Geographical Sciences 26 (7): 803–826. https://doi.org/10.1007/s11442-016-1300-5.
- Zeng, J., T. Zhou, Q. Wang, X. Yixin, Q. Lin, Y. Zhang, W. Xuemei, J. Zhang, and X. Liu. 2023. “Spatial Patterns of China’s Carbon Sinks Estimated from the Fusion of Remote Sensing and Field-Observed Net Primary Productivity and Heterotrophic Respiration.” Ecological Informatics 76 (September): 102152. https://doi.org/10.1016/j.ecoinf.2023.102152.
- Zhang, G., C. M. Biradar, X. Xiao, J. Dong, Y. Zhou, Y. Qin, Y. Zhang, F. Liu, M. Ding, and R. J. Thomas. 2018. “Exacerbated Grassland Degradation and Desertification in Central Asia During 2000-2014.” Ecological Applications 28 (2): 442–456. https://doi.org/10.1002/eap.1660.
- Zhang, Y., M. Xu, H. Chen, and J. Adams. 2009. “Global Pattern of NPP to GPP Ratio Derived from MODIS Data: Effects of Ecosystem Type, Geographical Location and Climate.” Global Ecology and Biogeography 18 (3): 280–290. https://doi.org/10.1111/j.1466-8238.2008.00442.x.
- Zhang, D., Y. Zhao, and W. Jiansheng. 2023. “Assessment of Carbon Balance Attribution and Carbon Storage Potential in China’s Terrestrial Ecosystem.” Resources, Conservation and Recycling 189 (February): 106748. https://doi.org/10.1016/j.resconrec.2022.106748.
- Zhou, D., and A. Elmokashfi. 2018. “Network Recovery Based on System Crash Early Warning in a Cascading Failure Model.” Scientific Reports 8 (1): 7443. https://doi.org/10.1038/s41598-018-25591-6.