
 ?Mathematical formulae have been encoded as MathML and are displayed in this HTML version using MathJax in order to improve their display. Uncheck the box to turn MathJax off. This feature requires Javascript. Click on a formula to zoom.
ABSTRACT
In China, a nation facing farmland scarcity, accurate mapping of winter fallow arable lands is crucial for enhancing crop rotation and land use efficiency. The Dynamic Threshold (DT) method commonly used in phenology and winter fallow land studies often employs empirically set subjective thresholds. This approach tends to uniformly apply a single threshold across diverse vegetation types and geographical regions, neglecting the variations in physiological traits and spatial heterogeneity. This study developed a multitemporal overlapping area minimization threshold method (MOAMT). This approach constructed Normalized difference vegetation index (NDVI) probability density functions for both winter fallow and non-winter fallow arable land across a time series to attain a statistically significant threshold. We use MOAMT and DT methods for winter fallow arable land extraction in southern China, respectively. And then, comparison of identification accuracy between MOAMT and DT has been implemented by using confusion matrix method. Compared to the DT method, MOAMT exhibits better performance. The mapping of winter fallow arable lands highlighted their predominant distribution in the middle and lower reaches of the Yangtze River (MLR-YR) Basin, covering approximately 20.8 million hectares, with potential for development. This study will provide information support for the optimization of planting layouts in China, offering new opportunities for further increasing grain production. While in the sense of research approach, this study indicates the superiority of threshold obtained through statistical probability calibration over empirical universal thresholds for classification accuracy. We advocate for prioritizing threshold calibration in future applications of threshold classification methods.
1. Introduction
Winter fallow arable land refers to arable land that remains fallowed after the autumn harvest until the spring planting of the subsequent year. This land is sufficient for the cultivation of at least one seasonal crop. Therefore, they are seasonally fallow, unlike long-term abandoned lands (Alcantara et al. Citation2013; Y. Jiang et al. Citation2023; Su et al. Citation2023), and possess the potential for reuse. In southern China, there is a large amount of winter fallow land, primarily due to labor migration caused by socioeconomic development, which has led to a reduction of rice-based crop rotation systems in the region. This results in extensive seasonal fallowing (Dawe, Frolking, and Li Citation2004; M. Jiang et al. Citation2018; Liang et al. Citation2016; Ma et al. Citation2019). In particular, the area reduction was the most significant in the double-cropping rice system. In recent decades, many double-cropping rice arable lands have been converted to single-cropping arable lands, leaving farmlands idle during the growing season from autumn to the following year (S. Li et al. Citation2021; Zhai, Xu, and Jiang Citation2012).
These fallow lands can contribute to China’s energy and food security through the planting of winter crops. Planting rapeseed on fallow land in the middle and lower reaches of the Yangtze River (MLR-YR) during winter is estimated to reduce soybean imports by approximately 50% under future climatic conditions (Tian et al. Citation2021). This has significant economic benefits (L. Liu et al. Citation2018). Planting cover crops (such as green manure) on winter fallow arable land can effectively improve soil fertility and reduce net greenhouse gas emissions (Y. Wang and Tao Citation2023). Improving the farming intensity of croplands is an effective method of increasing cropland productivity (Iizumi and Ramankutty Citation2015; L. Liu et al. Citation2013; Wu et al. Citation2018). The Chinese government has continuously emphasized the importance of developing winter fallow fields for many years and has issued a series of policies to promote winter rapeseed cultivation in these fields (No. 1 central document for 2021–2023, https://www.moa.gov.cn/). Therefore, it is necessary to map the spatial distribution of winter fallow arable land in Southern China.
Many studies have used remote sensing to identify winter fallow arable land in China. Methodologies for extracting winter fallow arable land are mainly categorized into two types. At the provincial and larger spatial scales, the threshold method was mainly used to extract winter fallow arable land. MODIS is the most commonly used image source and NDVI is the most commonly used vegetation index. The winter fallow period was determined using the vegetation index (VI) curve of the time series.Some studies mapped winter fallow arable land in southern China, especially in the MLR-YR, employing dynamic threshold method (Fu et al. Citation2020; M. Li Citation2015; S. Li et al. Citation2021; W. Li et al. Citation2010; Y. Wang et al. Citation2014; Zhai, Xu, and Jiang Citation2012). For smaller research areas, the use of supervised classification methods, including Random Forest and Decision Trees, is prevalent (Tang Citation2021; H. Wang et al. Citation2020). The use of higher spatial resolution image sources, such as Gaofen-1 (GF-1), Sentinel-2, and Landsat, is often preferable. Among them, Gaofen-1 (GF-1) is the first high-resolution optoelectronic satellite operated by the China National Space Administration (CNSA) and is equipped with two cameras: panchromatic (2 m) and multispectral (8 m) (http://en.spacewillinfo.com/english/). It has a temporal resolution of 4 days. Ma et al. (Citation2019) extracted winter crops for three consecutive years from 2015 to 2017 in Huoqiu County, Anhui Province, based on GF-1 images and extracted winter fallow land by comparing winter crop planting information for three years.
The threshold method is simple and efficient; however, it is difficult to determine the threshold value which usually has a direct effect on the results (Zeng et al. Citation2020). The dynamic threshold (DT) method in previous studies often directly used empirical thresholds from other studies that were applied to different land-use types and geographical environments without threshold calibration. It obscures the phenological differences among various vegetation types (H. Li et al. Citation2023). Research on winter fallow fields based on supervised classification lacked analysis of the length of winter fallow arable lands lacked analysis of the length of winter fallow arable lands. Although supervised classification methods are capable of comparing land-use changes by utilizing temporal images and classification results from different time nodes (Shahid et al. Citation2021; Shahid, Cong, and Zhang Citation2018), they present considerable challenges in terms of training data and computational resources, especially in large-scale applications, compared with threshold methods. Owing to the different growth cycles of different crops and the complexity of crop rotation systems, determining winter fallow lands has become very difficult.
MODIS is primarily used at provincial and larger spatial scales because of its high temporal resolution (twice observation per day). However, the relatively coarse spatial resolution (250 -1000 m) of MODIS, which leads to a mixed pixel problem, limits its accuracy in identifying winter fallow arable land in southern China (Ozdogan and Woodcock Citation2006). The reason for this was that arable lands in China mainly showed fragmented patches or plots, 80% of which was smaller than 0.6 ha (Fritz et al. Citation2015; Tan et al. Citation2013), even 0.04 ha (J. Li et al. Citation2006). Therefore, from a spatial resolution perspective, the GF-1, Sentinel-2, and Landsat series are more suitable for extracting winter fallow arable land data in southern China. However, on a large regional scale, the impact of cloud cover on the quality of time-series images still needs to be considered during the revisit period (4–16 days). The use of these images is limited by their revisit intervals, which are highly sensitive to atmospheric conditions and cloud effects. In recent years, many studies have combined the advantages of high spatial resolution and temporal resolution through the spatiotemporal fusion of multi-source images to compensate for the lack of time series in high-spatial-resolution images. Common image fusion methods included: Gap Filling and the Savitzky – Golay filter (GF-SG) (Y. Chen et al. Citation2021), Improved Flexible Spatiotemporal Data Fusion (M. Liu et al. Citation2019), Fill-and-Fit (FF) (Yan and Roy Citation2020), SaTellite dAta IntegRation (STAIR) (Luo, Guan, and Peng Citation2018), Enhance Spatial and Temporal Adaptive Reflectance Fusion Model (ESTARFM) (Feng et al. Citation2006; Zhu, Chen, et al. Citation2010). Fusion algorithms are often complex and consume a large amount of computing resources; therefore, computational efficiency is an important factor in method selection. Among them, GF-SG is a Landsat NDVI time-series reconstruction method suitable for large spatial scales through the GEE platform, which combines accuracy and efficiency, fully integrating the high spatial resolution of Landsat with the high temporal resolution of MODIS and reconstructing 8 days resolution Landsat NDVI time series (Cao et al. Citation2018; J. Chen et al. Citation2004; Y. Chen et al. Citation2021). High-precision background data were provided for large-scale refined winter fallow extraction.
In addition, the development and utilization of winter fallow arable land are strongly dependent on the timeliness of winter fallow monitoring. In general, previous research on the extraction of winter fallow arable lands has paid less attention, especially provincial and larger-scale studies that mainly focused on the period from 2000 to 2015. However, in recent decades, the cultivation intensity of farmland has been constantly changing owing to the ongoing trend of shifting from multiple cropping to single cropping systems, predominantly rice-based in the south, and there has been a significant change in the intensity of cultivated land planting (M. Jiang et al. Citation2018). Previous studies have not accurately described the current spatiotemporal dynamics of winter fallow arable land in southern China. We proposed a Multi-Temporal Overlapped Area Minimization Threshold (MOAMT) method that differs from traditional dynamic thresholds by obtaining thresholds with statistical significance rather than setting them based on subjective user experience. Based on the duration of winter fallow for the MOAMT and the lifecycle of local crops, a comprehensive map accurately representing the distribution of winter fallow farmland was drawn.
2. Materials and methods
2.1. Study area
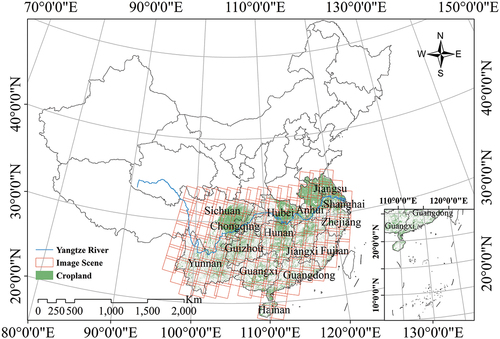
Croplands in the following 15 provinces and municipalities in China were selected as the study regions: Hunan, Hubei, Jiangxi, Jiangsu, Sichuan, Anhui, Yunnan, Guizhou, Chongqing, Zhejiang, Fujian, Hainan, Guangdong, Guangxi, and Shanghai (). According to China’s Third National Land Survey (https://gtdc.mnr.gov.cn/), the total cropland area of the 15 provinces and municipalities is approximately 44.6 million ha, accounting for approximately 35% of the total national cropland area. The middle and lower reaches of the Yangtze River region are concentrated in southern China (China Statistical Yearbook Citation2023). The planting system in this region is a rice-based rotation system (Dawe, Frolking, and Li Citation2004). The northeast of the research area (Jiangsu, Anhui) is a rice-winter wheat rotation area, the middle and lower reaches of the Yangtze River are mainly double-cropping rice and rice-winter rapeseed rotations, the southern region is rice-winter wheat, and the southwestern region is rice-winter rapeseed. However, over the past few decades, this crop rotation pattern has been continuously shifting toward single-season planting with a consistent decrease in area, leading to a large amount of farmland being seasonally fallow (Liang et al. Citation2016). In recent years, the government has promoted winter rapeseed cultivation in winter fallow fields to increase oil production.
Figure 1. Location map of the study region (Chinese basemap from the Standard map Service of Tianditu, approval number: GS(2020)4619, https://www.tianditu.gov.cn/).
2.2. Pre-processing of landsat and MODIS images and NDVI time-series data
To identify the distribution of winter fallow arable lands in southern China during 2021–2022, we calculated the normalized difference vegetation index (NDVI) (Eq. ) using surface reflectance data from the Landsat 8 and MODIS MOD09Q1 products (https://developers.google.com/earth-engine/datasets/) on the GEE platform (Gorelick et al. Citation2017). We also used the gap-filling and Savitzky (GF-SG) filtering methods proposed by Chen et al. (Citation2021) to obtain high-quality NDVI time series data (https://code.earthengine.google.com/3a883c9e84ad119045bcb88e4de77b47?noload=true). Landsat 8 satellite imagery has a 16-d revisit cycle and 30-m resolution. The MODIS MOD09Q1 product underwent atmospheric correction and had an 8-d composite at a resolution of 250 m. After reconstruction, the NDVI time-series images had an 8-d composite and 30-m spatial resolution (), meeting the large-scale, high-precision extraction requirements of this study. The NDVI (Tucker Citation1979) was calculated as follows:
Figure 2. NDVI time-series curve for image fusion based on GF-SG method.
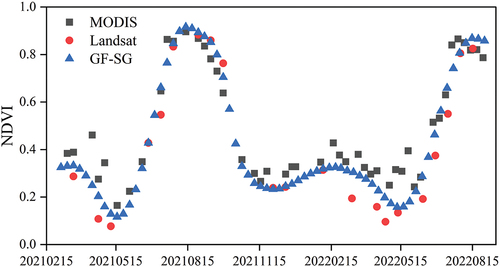
where RED and NIR are the spectral reflectance values of the visible red (630–680 nm) and near-infrared (845–885 nm) bands, respectively.
2.3. Sample labelling of winter and non-winter fallow arable lands
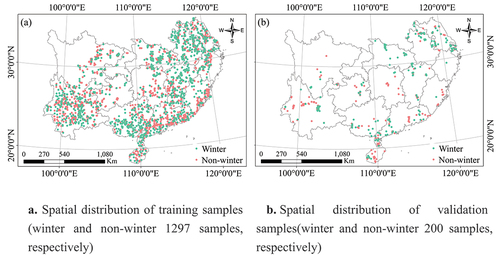
We adopted the cropland layer from the Chinese Land Cover Dataset (CLCD) (Yang and Huang Citation2021) (). The study region was gridded into fishnets at a spatial resolution of 100 km using ArcGIS Desktop (version 10.7, Esri). The fishnet assisted labeling personnel in ensuring that the sample points were distributed evenly. Fish nets were used for task allocation. In each fishnet, 30–40 true sample points of winter and non-winter fallow arable land were positioned via visual interpretation on the Google Earth Pro platform and recorded along with the longitude, latitude, and dates of the remote sensing images. We identified the following decision rules for selecting true sample points: (1) the sample labelling time is limited to the winter of 2018–2022 (Late November, December, January, Early February) and should be concentrated as much as possible in 2022 to reflect the latest farmland utilization situation; (2) as far as possible, the true sample points were collected from the center of cropland plots, and a distance of over 30 m between the true sample point and edge was selected to avoid the existence of a mixed pixel; and (3) 11 well-trained experts inspected and multiple cross-checked the sample points to ensure accuracy. Finally, 3,418 valid points were obtained over three months, 1,921 of which belonged to winter fallow arable lands, with the rest being non-winter ones.
As described in the previous section, samples were obtained from November 2018 to February 2022. From the obtained sample dataset, we established a training dataset of 1297 winter fallow and 1297 non-winter fallow samples to support the development of the new algorithm (). In addition, there are 272 winter and 200 non-winter fallow sites from 2021 to 2022 (). Therefore, it is necessary to use samples from the same period (November 2021 to February 2022) for validation. Thus, 200 winter fallow and 200 non-winter fallow samples (November 2021–February 2022) distributed evenly in space were selected to validate the results.
Figure 3. Spatial distribution of all the samples for this study.
2.4. Multi-temporal overlapped area minimization threshold method
As shown in , there are four winter fallow periods between 2018 and 2022. The specific winter fallow period to which they belonged was determined based on the Google Earth imagery timestamps corresponding to each sample point. Subsequently, NDVI time-series curves based on the GF-SG method were extracted using Google Earth Engine (GEE). Each sample point corresponds to an individual NDVI curve. As a result, NDVI value curves across the four time periods were categorized as either winter fallow arable land or non-winter fallow arable land. (). In , at each time node of the time-series curve, there are 1297 NDVI values for winter fallow samples and 1297 NDVI values for non-winter fallow training samples. The expected value and standard deviation of the NDVI values for both winter and non-winter fallow samples were calculated for each date.
Table 1. Summary of training samples usage.
Figure 4. (a) NDVI curves of the training samples for winter and non-winter fallow from March 1st to September 1st. The error bars represented the range between half of the standard deviation of the NDVI expected value on each date when NDVI values were available and (b) Fitting normal probability distribution curves of the winter and non-winter fallow arable lands on the best timing date when the overlapped area between two curves was minimum. NWF and WF represent non-winter fallow and winter fallow, respectively.
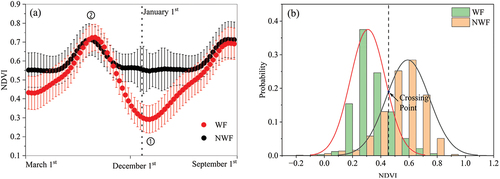
Subsequently, the NDVI values of winter fallow and non-winter fallow for each date were fitted to normal probability distribution curves. In , ① represents the date where the overlapped area between the normal probability distribution curves of winter and non-winter fallow was minimal (), and represents the date where the overlapped area was maximum. The date ① was the best time to identify winter fallow, differing from non-winter fallow, where the overlapped area was minimal.
The NDVI value for the crossing point (NDVIcrossing point) between the two curves of winter and non-winter fallow was selected as the threshold value (0.445) to obtain winter fallow arable land. From a statistical perspective, on the left side of the NDVIcrossing point, the probability of a pixel being a winter fallow field was higher than that of a pixel being a non-winter fallow field. The opposite was applied to the right side of the NDVIcrossing point.
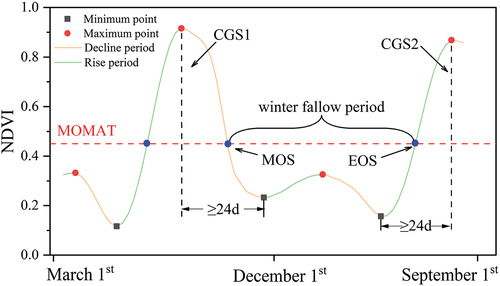
We used the Google Earth Engine (GEE) to implement the MOAMT algorithm because of the massive amount of data in this study. As described in Section 2.2, we obtained an 8-day NDVI time-series curve using the GF-SG method for each pixel. The crop growth season will be identified in the following procedure: (1) Extremes values of the NDVI curves could be available by making first-order and second-order derivation (); (2) the temporal length from the extreme maximum (should more than threshold value) points to the neighboring extreme minimum (should be less than threshold value) points should be longer than 24 days(consecutive 3 NDVI dates); (3) all the crop growth season from NaN Invalid Date NaN to NaN Invalid Date NaN for each pixel could be accessible in . All NDVI values between the MOS (maturity date of crop growth season) and EOS (emergence date of crop growth season) in should be less than the threshold value, and the length between the MOS and EOS is the duration of winter fallow for the pixel.
Figure 5. Winter fallow arable lands identification based on multi-temporal overlapped area minimization threshold method for MOAMT (the CGS represents crop growth season).
In this study, the dynamic threshold method (constant value of 20%) was used for an accuracy comparison (S. Li et al. Citation2021; W. Li et al. Citation2010; Y. Wang et al. Citation2014; Zhai, Xu, and Jiang Citation2012).
2.5. Accuracy assessment
We validated the identification results using the land-use change accuracy assessment process suggested by Olofsson et al. (Citation2014). First, a error matrix is constructed based on the estimated area proportions. Then, an unbiased estimator is used to quantify the classification accuracy and evaluation area and to calculate confidence intervals to quantify the variability of the estimated area and accuracy. For the calculation steps for the area and accuracy confidence intervals, please refer to Olofsson et al. (Citation2013) and Stehman (Citation2013, Citation2014).
where i is the map (predicted) class, j is the reference(true) class, and is an unbiased estimator of the proportion of area in cells i and j of the error matrix. where
is the proportion of the area of the sample with map class i and reference class j, and Wi is the proportion of the area mapped as class i to the total area. nij is the sample count of the pixels in cell (i, j). where UA is the user accuracy (Eq.3), PA is the producer accuracy (Eq.4), OA is the overall accuracy (Eq.5), and
is represents the number of correct identifications for each category.
and
the correct numbers for map class
and reference class
, respectively, and
and
is the total number of true samples for map class
and the total number of samples predicted as reference class
, respectively.
In addition, the CLCD, as determined by remote sensing, shows a 30% to 50% higher than the cropland area reported in the third national land survey (https://gtdc.mnr.gov.cn/Share#/). When calculating the winter fallow arable land area statistics, to avoid unreasonable results of the winter fallow area exceeding the total cultivated land area, we distributed the error across each pixel. Based on the error ratio between the CLCD cultivated land area of each province and that published in the national land survey, a proportion coefficient was used to adjust the estimated winter fallow arable land area.
3. Results
3.1. Comparison of accuracy of the MOAMT and DT methods
A summary of the sample classification results and accuracy assessments is presented in , respectively. The overall accuracies of the MOAMT and DT methods were 0.83 and 0.73, respectively. Compared with the DT method, the MOAMT method had higher accuracy and lower variability whereas the PA and UA of the MOAMT methods exceeded 80% (). It proved that MOAMT had a better effect on the extraction of winter fallow arable lands in southern China.
Table 2. Summary of the sample classification results of the MOAMT and DT methods (map class are the rows while the reference class are the columns).
Table 3. Estimated error matrix based on .
3.2. Spatial distribution of duration for winter fallow arable lands based on the MOAMT and DT methods
Based on the definition of winter fallow, the fallow period during winter must be sufficiently long to allow crops to mature and harvest. Thus, when applying a map of winter fallow fields in southern China, it is essential to account for the duration that permits crops to complete their growth seasons. Short-growth season crops, such as vegetables, generally end their life cycle in approximately 40–50d in southern China (Zhu, Pang, et al. Citation2010). Food crops generally have a longer growing season than vegetables. Even early-maturing varieties of these food crops (such as potatoes) require 60–70 days to reach maturity(from seeding to harvest) (Devaux, Kromann, and Ortiz Citation2014). In terms of relevant reference, “rush-harvesting and rush-planting” for the rotation of crops required 10 days, respectively, amounting to a total of 20 days for both activities combined (R. Wang et al. Citation2019). Moreover, the EOS in should be the emergence date, owing to its NDVI values; therefore, it requires 20 days (generally for food crops) to look back at the seeding date. Thus, excluding the duration of the crop growth season, another 40 days should be considered to identify the length of the winter fallow field which could be used. In this study, 40 and 60 days were regarded as the minimum duration of the growth season for vegetables and food crops, respectively, and the shortest periods for winter fallow were set to 80 and 100 days, respectively ().
Figure 6. Spatial distribution of duration of winter fallow arable lands based on MOAMT method and DT method. a, b illustrated the spatial distribution of the winter fallow arable lands with a duration of >80 days based on MOAMT and DT, respectively.
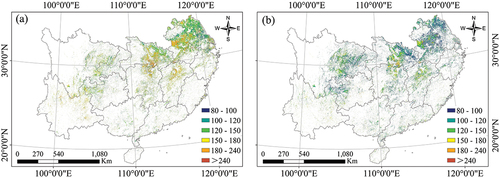
The difference between the acreages of winter fallow arable lands with a duration > 80 d derived from MOAMT and DT was approximately 5.6% (). However, acreage differed in different provinces. In Jiangsu and Anhui provinces, the MOAMT results were much higher than those of DT. This area serves as a convergence zone between the single-cropping and double-cropping regions, where rice-winter wheat rotation is the primary agricultural practice. Variations in thresholds exhibit greater uncertainty in regions with high heterogeneity in cropping systems. Concurrently, winter wheat is in its overwintering phase and its growth is weak, challenging the accuracy of generic thresholds. On the contrary, in Sichuan. When the duration exceeds 80 days, the difference between the two methods surpasses 30%, but the duration greater than 100 days, it reduces to only 7%.This area is a mixed zone of single-season rice and other double-season crops (Qiu et al. Citation2022), where the complexity of crop types and the differences in crop growth cycles of different crops impact the identification results. This poses a considerable challenge to determining thresholds.
Table 4. Areas (×10,000 ha) of winter fallow arable lands with different growing durations based on the MOAMT and DT methods.
3.3. Spatial distribution of the MOS and EOS of winter fallow arable lands based on MOAMT and DT
MOS derived from MOAMT was mainly concentrated in October and November; moreover, MOS was primarily present in October, with very little concentration in November and December (). In the provinces of Guizhou, Yunnan, Sichuan, and Chongqing, the MOS was evenly distributed from October to December. Compared with MOAMT, MOS derived from DT was predominantly observed in November and December (including the regions in the middle and lower reaches of the Yangtze River), with comparatively little in October. In the Guizhou, Yunnan, Sichuan, and Chongqing municipalities, December dominated the MOS, and a small number of areas started in October and November.
Figure 7. The MOS and EOS of winter fallow (a and b was for the MOS and EOS of MOAMT method, respectively; c and d was for the MOS and EOS of DT method).
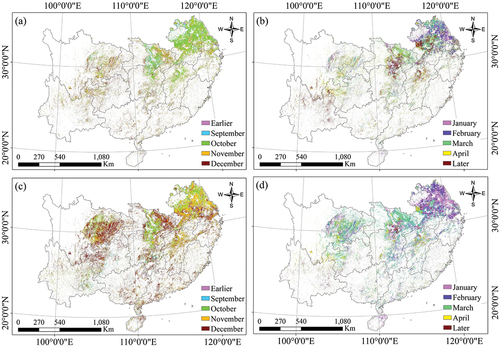
The EOS derived from the MOAMT occurred mainly in March and later. In the middle and lower reaches of the Yangtze River, the EOS is evenly distributed from January to March and after April. In southwest China in the Yunnan and Guizhou provinces, EOS increased from March to May, whereas in the provinces of Sichuan and Chongqing, EOS increased from February to April. Compared to MOAMT, the EOS derived from DT in the middle and lower reaches of the Yangtze River was mainly concentrated in January and February. In Southwest China and Hubei, the EOS for DT was distributed in March and April.
3.4. Spatial differentiation of MOAMT threshold value and its effect on accuracy
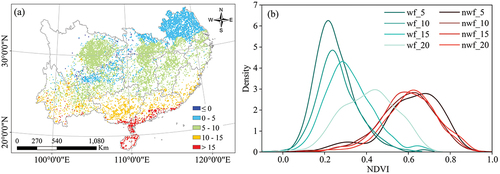
The relationship between the latitude and NDVI values of winter and non-winter fallow training samples was analyzed, as shown in . The study area was regionalized into subzones by dividing averaged temperature in winter (November to February) for 40 years from 1983–2022 (Peng et al. Citation2019) into several classes of ≤ 5°C, 5–10°C, 10–15°C, and > 15°C (). From north to south, with a decreasing trend in latitude and increasing average temperature, the NDVI values of winter fallow samples increased, while those of non-winter fallow samples remained stable (). This means that in the southern part of the study area, the acreage of winter fallow arable land was underestimated, whereas that of non-winter fallow arable land was overestimated, whereas in the northern part, the situation was contrary. In the middle latitudes of the study area, the accuracy of the identification results should be better, and it has been proven that the number of misidentified points in the MOAMT is less than that in the DT.
Figure 8. Kernel density estimation of NDVI values for training samples at different latitude (a, b was the winter and non-winter fallow, respectively).
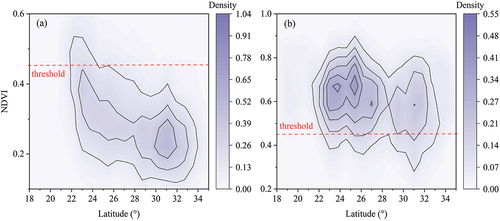
Figure 9. (a) Is the winter average temperature distribution of study area and (b) is the NDVI distribution of different climate regions; the four curves represent the NDVI distribution of samples located at ≤ 5°C, 5–10°C, 10–15°C, and > 15°C, respectively.
4. Discussion
4.1. The significance of this work
MOAMT obtains thresholds with statistical significance based on sample data from Google Earth images and demonstrates better performance than the DT method in extracting winter fallow fields in the study area (). The DT method is most commonly used in winter fallow field research. These studies typically involve directly setting an empirical threshold (20%) derived from relevant references, despite significant differences in the study areas or objects, and a common threshold has been widely used for different vegetation types (Beck et al. Citation2006; Heumann et al. Citation2007; Jonsson and Eklundh Citation2002; Yu et al. Citation2014). A common threshold, often employed without adequately considering the physiological characteristics of different vegetation types, tends to obscure the phenological variability among these types (H. Li et al. Citation2023). This oversight was the primary source of uncertainty affecting the accuracy of the DT method. For MOAMT, the process of minimizing the overlapping area between the NDVI curves of winter and non-winter fallow arable land is dynamic (Fig. S1 in the Supplementary Material). This approach significantly outperformed the results derived from a single date based on the available NDVI values. Using this method, we can identify the moment within a year when the difference in NDVI between winter fallow and non-winter fallow is at its maximum and obtain a customized threshold for the study area. Furthermore, this study combines MOAMT with high-resolution background data and GEE to, for the first time, achieve a 30-meter resolution that covers the distribution and duration of winter fallow fields across the entire southern of China. The identification of fragmented farmlands in southern China effectively reduced the problem of pixel confusion.
The 20.08 million hectares of winter fallow land, accounts for approximately 16% of the current arable land area. China heavily relies on imported oil and feed crops. It imports approximately 100 million tons of soybeans annually (http://www.customs.gov.cn/). China’s current soybean yield levels (National Bureau of Statistics, https://data.stats.gov.cn/staticreq.htm) are equivalent to the import of 49.33 million hectares of arable land. If these winter fallow lands were developed and utilized effectively to fully realize their cultivation potential, they would undoubtedly play an important role in addressing the issue of food import security. In recent years, the national government has paid special attention to the utilization of winter fallow land in its land use strategy. The government has consistently proposed the exploration and utilization of developable idle land in the Central No. 1 document over several years. This includes implementing policies such as rice-oil crop rotation and vigorously developing the use of winter fallow lands for planting oil crops, such as rapeseed, to increase the cultivation area of oilseed crops. In this context, identifying the distribution of winter fallow land is of significant strategic importance.
4.2. Potential sources of uncertainty and limitations for MOAMT
The main sources of uncertainty in this study arose from two aspects: the quality of sample labeling and external data sources (Land Use Cover (LUC) dataset and multi-source image synthesis).
The accuracy of the MOAMT method relies heavily on the sample labeling quality. Due to the COVID-19 pandemic, the samples for this study were primarily obtained through Google Earth. Additionally, the subjective differences among participants inevitably affect the quality of the samples, despite our efforts in conducting repeated cross-checks. Limited by the timing of Google imagery captures, relying solely on samples from 2021–2022 would result in too few samples. Therefore, we annotated samples from the four years spanning 2018–2022 to build our dataset. The minimum overlapped area of the two NDVI curves for winter and non-winter fallow arable lands was the comprehensive result for the four periods, and not just for 2021–2022.
The accuracy of the LUC dataset affected the accuracy of the MOAMT. Although the CLCD product showed higher accuracy than other datasets (Yang and Huang Citation2021), the total cropland area reported in this dataset was significantly higher 30%-50% than the arable land area recorded in national statistical surveys (a similar issue is also present in other datasets). Thus, CLCD accuracy uncertainty is unavoidable when transferring to the results of MOAMT. In addition, to achieve a balance between temporal and spatial resolution, we chose to use the time-series NDVI obtained from multi-source image fusion for the extraction of winter fallow lands. For areas frequently experiencing cloudy and rainy weather, such as the Yunnan and Guizhou provinces, the accuracy of NDVI curve reconstruction is inevitably affected (Y. Chen et al. Citation2021).
The MOAMT itself has limitations. The threshold obtained is essentially a fixed threshold method that cannot be dynamically adjusted according to the characteristics of different pixel vegetation growth curves, such as dynamic thresholds. It is suitable for simple classification scenarios, such as two-category classification. MOAMT has only been tested in known cultivated areas in southern China, and its effectiveness has not been tested in other complex classification scenarios or vegetation types. Increased vegetation index use can lower the uncertainty (L. Liu et al. Citation2020; C. Wang et al. Citation2017). Because NDVI is the most widely used and standardized VI product worldwide, we selected NDVI to conduct this study on a large spatial scale. From the perspective of data practicality, availability, and accessibility, a single NDVI application still has significance, especially at a large scale. In future research, more VI data should be included to provide more information for identification (An et al. Citation2021).
4.3. Comparison of EOS, MOS and duration of winter fallow based on MOAMT and DT
The main production zone of “double-season” paddy rice and rice-wheat rotation in the study area is mainly spatially concentrated in the middle and lower reaches of the Yangtze River (Dong et al. Citation2020; Luo, Zhang, Li, et al. Citation2020; Qiu et al. Citation2022). The change from “double-season” to “single-season” paddy rice and winter wheat abandonment was the predominant cause of arable lands being left idle in winter (Dawe, Frolking, and Li Citation2004; M. Jiang et al. Citation2018; Ma et al. Citation2019). In light of relevant references (Luo, Zhang, Chen, et al. Citation2020) and monitoring records of crop phenology obtained from agricultural meteorological stations(http://www.nmc.cn/publish/agro/), late-maturity paddy rice ripened in October and November, and meanwhile “single-season” paddy rice was transplanted from April to May in the next year, which meant that the duration of winter fallow for arable lands lasted for more than approximately 150 days. Compared to the map derived from the DT in , the MOAMT result showed greater reasonability (L. Liu et al. Citation2018).
In southwest China, “single-season” paddy rice was transplanted from March to May (Y. Liu et al. Citation2019), and the maturity period spanned October and November. The fallow duration in winter will last for more than 120 days, which is more adhered to the results of MOMAT.
5. Conclusion
Our study proposed a threshold method (MOAMT) based on sample probability which facilitated the identification of winter fallow arable land in southern China and had higher accuracy than the DT method. The MOAMT establishes a phenological threshold with statistical significance that is superior to subjectively set dynamic thresholds. Owing to the improved accuracy of the MOAMT threshold, the EOS, MOS, and duration of winter fallow derived from the MOAMT were more reasonable than those derived from the DT. Based on MOAMT and GEE, our study has, for the first time, mapped the distribution and duration of winter fallow in the full southern part of China at a resolution of 30 m. This could help the agricultural sector further explore how to reuse backup arable land resources and contribute to the long-term monitoring of China’s winter fallow fields.
Authors contribution
Yingbin He: Conceptualization, Methodology Yan Zha: Methodology Shanjun Luo: Writing-Reviewing and Editing Xiangyi Wang: Data curation, Writing-Original draft preparation Huicong Chen: Software, Supervision Shengnan Han: Resources, Data curation, Validation Anran Feng: Resources, Data curation Xiuying Wu: Resources, Data curation Yongye Wang: Resources, Data curation Jiong Ning: Resources, Data curation
S1_Supplementary material.gif
Download GIF Image (1.2 MB)
Acknowledgments
We sincerely express our gratitude to the State Key Laboratory of Efficient Utilization of Arid and Semi-arid Arable Land in Northern China (the Institute of Agricultural Resources and Regional Planning, Chinese Academy of Agricultural Sciences, Beijing 100081, China) for the support provided to this study; Professor Huang Sanwen, president of Chinese Academy of Tropical Agricultural Sciences for his great support for our work, and to Professor Qian Wanqiang, Professor Cheng Xu, Professor Zhang Chunzhi, and Associate Professor Fan Ziyao from the Agricultural Genomics Institute of Chinese Academy of Agricultural Sciences (CAAS) for their constructive comments on this study.
Disclosure statement
No potential conflict of interest was reported by the author(s).
Data availability statement
The data that support the findings of this study are available upon request by contact with corresponding authors.
Supplementary Material
Supplemental data for this article can be accessed online at https://doi.org/10.1080/15481603.2024.2333587
Additional information
Funding
References
- Alcantara, C., T. Kuemmerle, M. Baumann, E. V. Bragina, P. Griffiths, P. Hostert, J. Knorn, et al. 2013. “Mapping the Extent of Abandoned Farmland in Central and Eastern Europe Using MODIS Time Series Satellite Data.” Environmental Research Letters 8 (3): 035035. https://doi.org/10.1088/1748-9326/8/3/035035.
- An, C., Z. Dong, H. Li, W. Zhao, and H. Chen. 2021. “Assessment of Vegetation Phenological Extractions Derived from Three Satellite-Derived Vegetation Indices Based on Different Extraction Algorithms Over the Tibetan Plateau.” Frontiers in Environmental Science 9:794189. https://doi.org/10.3389/fenvs.2021.794189.
- Beck, P. S. A., C. Atzberger, K. A. Høgda, B. Johansen, and A. K. Skidmore. 2006. “Improved Monitoring of Vegetation Dynamics at Very High Latitudes: A New Method Using MODIS NDVI.” Remote Sensing of Environment 100:321–15. https://doi.org/10.1016/j.rse.2005.10.021.
- Cao, R., Y. Chen, M. Shen, J. Chen, J. Zhou, C. Wang, and W. Yang. 2018. “A Simple Method to Improve the Quality of NDVI Time-Series Data by Integrating Spatiotemporal Information with the Savitzky-Golay Filter.” Remote Sensing of Environment 217:244–257. https://doi.org/10.1016/j.rse.2018.08.022.
- Chen, Y., R. Cao, J. Chen, L. Liu, and B. Matsushita. 2021. “A Practical Approach to Reconstruct High-Quality Landsat NDVI Time-Series Data by Gap Filling and the Savitzky–Golay Filter.” ISPRS Journal of Photogrammetry and Remote Sensing 180:174–190. https://doi.org/10.1016/j.isprsjprs.2021.08.015.
- Chen, J., P. Jönsson, M. Tamura, Z. Gu, B. Matsushita, and L. Eklundh. 2004. “A Simple Method for Reconstructing a High-Quality NDVI Time-Series Data Set Based on the Savitzky–Golay Filter.” Remote Sensing of Environment 91 (3–4): 332–344. https://doi.org/10.1016/j.rse.2004.03.014.
- China Statistical Yearbook, 2023. National Bureau of Statistics of China. http://www.stats.gov.cn/english/Statisticaldata/AnnualData/.
- Dawe, D., S. Frolking, and C. Li. 2004. “Trends in Rice–Wheat Area in China.” Field Crops Research 87 (1): 89–95. https://doi.org/10.1016/j.fcr.2003.08.008.
- Devaux, A., P. Kromann, and O. Ortiz. 2014. “Potatoes for Sustainable Global Food Security.” Potato Research 57 (3–4): 185–199. https://doi.org/10.1007/s11540-014-9265-1.
- Dong, J., Y. Fu, J. Wang, H. Tian, S. Fu, Z. Niu, W. Han, Y. Zheng, J. Huang, and W. Yuan. 2020. “Early-Season Mapping of Winter Wheat in China Based on Landsat and Sentinel Images.” Earth System Science Data 12 (4): 3081–3095. https://doi.org/10.5194/essd-12-3081-2020.
- Feng, G., J. Masek, M. Schwaller, and F. Hall. 2006. “On the Blending of the Landsat and MODIS Surface Reflectance: Predicting Daily Landsat Surface Reflectance.” IEEE Transactions on Geoscience and Remote Sensing 44 (8): 2207–2218. https://doi.org/10.1109/TGRS.2006.872081.
- Fritz, S., L. See, I. McCallum, L. You, A. Bun, E. Moltchanova, M. Duerauer, et al. 2015. “Mapping Global Cropland and Field Size.” Global Change Biology 21 (5): 1980–1992. https://doi.org/10.1111/gcb.12838.
- Fu, J., J. S. Du, D. Jiang, and D. Wang. 2020. “Anglysis of the Marginal Land Resources Suitable for Developing Liquid Biofuel in China.” Science&technology Review 38:31–40. (in Chinese).
- Gorelick, N., M. Hancher, M. Dixon, S. Ilyushchenko, D. Thau, and R. Moore. 2017. “Google Earth Engine: Planetary-Scale Geospatial Analysis for Everyone.” Remote Sensing of Environment 202:18–27. https://doi.org/10.1016/j.rse.2017.06.031.
- Heumann, B. W., J. W. Seaquist, L. Eklundh, and P. Jönsson. 2007. “AVHRR Derived Phenological Change in the Sahel and Soudan, Africa, 1982–2005.” Remote Sensing of Environment 108 (4): 385–392. https://doi.org/10.1016/j.rse.2006.11.025.
- Iizumi, T., and N. Ramankutty. 2015. “How Do Weather and Climate Influence Cropping Area and Intensity?” Global Food Security 4:46–50. https://doi.org/10.1016/j.gfs.2014.11.003.
- Jiang, Y., X. He, X. Yin, and F. Chen. 2023. “The Pattern of Abandoned Cropland and Its Productivity Potential in China: A Four-Years Continuous Study.” Science of the Total Environment 870:161928. https://doi.org/10.1016/j.scitotenv.2023.161928.
- Jiang, M., L. Xin, X. Li, M. Tan, and R. Wang. 2018. “Decreasing Rice Cropping Intensity in Southern China from 1990 to 2015.” Remote Sensing 11 (1): 35. https://doi.org/10.3390/rs11010035.
- Jonsson, P., and L. Eklundh. 2002. “Seasonality Extraction by Function Fitting to Time-Series of Satellite Sensor Data.” IEEE Transactions on Geoscience and Remote Sensing 40 (8): 1824–1832. https://doi.org/10.1109/TGRS.2002.802519.
- Li, M. 2015. Study on the Reconstruction of Time-Series MODIS-NDVI Dataset-Taking Jiangxi As an Example. Nanjing University of Information Science and Technology. (in Chinese).
- Liang, Y., J. Zho, Q. Yang, and H. Huang. 2016. “Development Status, Function and Prospect Analysis of the Multiple Cropping in Southern China.” Crop Research 30:572–578. https://doi.org/10.16848/j.cnki.issn.1001-5280.2016.05.21.
- Li, J., Y. Chen, Q. Jiang, and X. Kuang. 2006. “Reasons and Countermeasures of Cropland Fragmentation in China.” Agricultural Economics 21–23. (in Chinese).
- Li, H., F. Y. Li, J. Guo, and X. Gao. 2023. “An Improved Dynamic Threshold Method for Determining the Start of the Vegetation Greening Season in Remote Sensing Monitoring: The Case of Inner Mongolia.” Ecological Informatics 78:102378. https://doi.org/10.1016/j.ecoinf.2023.102378.
- Li, W., Z. Qin, W. Li, and H. Pei. 2010. “Information Extraction of Winter Fallow Fields in South China Based on MODIS-NDVI.” Chinese Agricultural Science Bulletin 26:324–329. (in Chinese).
- Liu, L., X. Xiao, Y. Qin, J. Wang, X. Xu, Y. Hu, and Z. Qiao. 2020. “Mapping Cropping Intensity in China Using Time Series Landsat and Sentinel-2 Images and Google Earth Engine.” Remote Sensing of Environment 239:111624. https://doi.org/10.1016/j.rse.2019.111624.
- Liu, L., X. Xu, Y. Hu, Z. Liu, and Z. Qiao. 2018. “Efficiency Analysis of Bioenergy Potential on Winter Fallow Fields: A Case Study of Rape.” Science of the Total Environment 628–629:103–109. https://doi.org/10.1016/j.scitotenv.2018.02.016.
- Liu, L., X. Xu, D. Zhuang, X. Chen, S. Li, and W. Yan. 2013. “Changes in the Potential Multiple Cropping System in Response to Climate Change in China from 1960–2010.” Public Library of Science One 8 (12): e80990. https://doi.org/10.1371/journal.pone.0080990.
- Liu, M., W. Yang, X. Zhu, J. Chen, X. Chen, L. Yang, and E. H. Helmer. 2019. “An Improved Flexible Spatiotemporal Data Fusion (IFSDAF) Method for Producing High Spatiotemporal Resolution Normalized Difference Vegetation Index Time Series.” Remote Sensing of Environment 227:74–89. https://doi.org/10.1016/j.rse.2019.03.012.
- Liu, Y., W. Zhou, and Q. Ge. 2019. “Spatiotemporal Changes of Rice Phenology in China Under Climate Change from 1981 to 2010.” Climatic Change 157 (2): 261–277. https://doi.org/10.1007/s10584-019-02548-w.
- Li, S., Y. Xie, Z. Yang, Y. Lu, and H. Li. 2021. “Examining Winter Fallow Farmland from Space and Geography: A Case Study in Guizhou, China.” Journal of Spatial Science 66 (1): 163–178. https://doi.org/10.1080/14498596.2019.1578273.
- Luo, Y., K. Guan, and J. Peng. 2018. “STAIR: A Generic and Fully-Automated Method to Fuse Multiple Sources of Optical Satellite Data to Generate a High-Resolution, Daily and Cloud-/gap-Free Surface Reflectance Product.” Remote Sensing of Environment 214:87–99. https://doi.org/10.1016/j.rse.2018.04.042.
- Luo, Y., Z. Zhang, Y. Chen, Z. Li, and F. Tao. 2020. “ChinaCropphen1km: A High-Resolution Crop Phenological Dataset for Three Staple Crops in China During 2000–2015 Based on Leaf Area Index (LAI) Products.” Earth System Science Data 12 (1): 197–214. https://doi.org/10.5194/essd-12-197-2020.
- Luo, Y., Z. Zhang, Z. Li, Y. Chen, L. Zhang, J. Cao, and F. Tao. 2020. “Identifying the Spatiotemporal Changes of Annual Harvesting Areas for Three Staple Crops in China by Integrating Multi-Data Sources.” Environmental Research Letters 15 (7): 074003. https://doi.org/10.1088/1748-9326/ab80f0.
- Ma, S., Z. Pei, F. Wang, W. Jiao, S. Jia, D. Wang, X. Han, L. Jia, M. Liu, and J. Lou. 2019. “Application on Remote Sensing Survey of Abandoned Farmlands in Winter Along the Huaihe River Based on GF-1 Image.” Transactions of the Chinese Society of Agricultural Engineering 35:227–233. (in Chinese).
- Olofsson, P., G. M. Foody, M. Herold, S. V. Stehman, C. E. Woodcock, and M. A. Wulder. 2014. “Good Practices for Estimating Area and Assessing Accuracy of Land Change.” Remote Sensing of Environment 148:42–57. https://doi.org/10.1016/j.rse.2014.02.015.
- Olofsson, P., G. M. Foody, S. V. Stehman, and C. E. Woodcock. 2013. “Making Better Use of Accuracy Data in Land Change Studies: Estimating Accuracy and Area and Quantifying Uncertainty Using Stratified Estimation.” Remote Sensing of Environment 129:122–131. https://doi.org/10.1016/j.rse.2012.10.031.
- Ozdogan, M., and C. E. Woodcock. 2006. “Resolution Dependent Errors in Remote Sensing of Cultivated Areas.” Remote Sensing of Environment 103 (2): 203–217. https://doi.org/10.1016/j.rse.2006.04.004.
- Peng, S., Y. Ding, W. Liu, and Z. Li. 2019. “1 Km Monthly Temperature and Precipitation Dataset for China from 1901 to 2017.” Earth System Science Data 11 (4): 1931–1946. https://doi.org/10.5194/essd-11-1931-2019.
- Qiu, B., X. Hu, C. Chen, Z. Tang, P. Yang, X. Zhu, C. Yan, and Z. Jian. 2022. “Maps of Cropping Patterns in China During 2015–2021.” Scientific Data 9 (1): 479. https://doi.org/10.1038/s41597-022-01589-8.
- Shahid, M., Z. Cong, and D. Zhang. 2018. “Understanding the Impacts of Climate Change and Human Activities on Streamflow: A Case Study of the Soan River Basin, Pakistan.” Theoretical and Applied Climatology 134 (1–2): 205–219. https://doi.org/10.1007/s00704-017-2269-4.
- Shahid, M., K. U. Rahman, S. Haider, H. F. Gabriel, A. J. Khan, Q. B. Pham, C. B. Pande, N. T. T. Linh, and D. T. Anh. 2021. “Quantitative Assessment of Regional Land Use and Climate Change Impact on Runoff Across Gilgit Watershed.” Environmental Earth Sciences 80 (22): 743. https://doi.org/10.1007/s12665-021-10032-x.
- Stehman, S. V. 2013. “Estimating Area from an Accuracy Assessment Error Matrix.” Remote Sensing of Environment 132:202–211. https://doi.org/10.1016/j.rse.2013.01.016.
- Stehman, S. V. 2014. “Estimating Area and Map Accuracy for Stratified Random Sampling When the Strata Are Different from the Map Classes.” International Journal of Remote Sensing 35 (13): 4923–4939. https://doi.org/10.1080/01431161.2014.930207.
- Su, Y., S. Wu, S. Kang, H. Xu, G. Liu, Z. Qiao, and L. Liu. 2023. “Monitoring Cropland Abandonment in Southern China from 1992 to 2020 Based on the Combination of Phenological and Time-Series Algorithm Using Landsat Imagery and Google Earth Engine.” Remote Sensing 15 (3): 669. https://doi.org/10.3390/rs15030669.
- Tang, M. 2021. Analysis on Characteristics of Spatio-Temporal Changes and Driving Factors of Winter Fallow Fields in Jianghan Plain. Hubei University. (in Chinese).
- Tan, M., G. M. Robinson, X. Li, and L. Xin. 2013. “Spatial and Temporal Variability of Farm Size in China in Context of Rapid Urbanization.” Chinese Geographical Science 23 (5): 607–619. https://doi.org/10.1007/s11769-013-0610-0.
- Tian, Z., Y. Ji, H. Xu, H. Qiu, L. Sun, H. Zhong, and J. Liu. 2021. “The Potential Contribution of Growing Rapeseed in Winter Fallow Fields Across Yangtze River Basin to Energy and Food Security in China.” Resources, Conservation and Recycling 164:105159. https://doi.org/10.1016/j.resconrec.2020.105159.
- Tucker, C. J. 1979. “Red and Photographic Infrared Linear Combinations for Monitoring Vegetation.” Remote Sensing of Environment 8 (2): 127–150. https://doi.org/10.1016/0034-4257(79)90013-0.
- Wang, H., X. Dan, Z. Li, and Y. Yao. 2020. “Extraction of Winter Leisure Fields in Jingmen City Based on Random Forest.” Science of Surveying & Mapping 45:101–105+118. (in Chinese). https://doi.org/10.16251/j.cnki.1009-2307.2020.05.015.
- Wang, C., J. Li, Q. Liu, B. Zhong, S. Wu, and C. Xia. 2017. “Analysis of Differences in Phenology Extracted from the Enhanced Vegetation Index and the Leaf Area Index.” Sensors 17:1982. https://doi.org/10.3390/s17091982.
- Wang, R., X. Li, M. Tan, L. Xin, X. Wang, Y. Wang, and M. Jiang. 2019. “Inter-Provincial Differences in Rice Multi-Cropping Changes in Main Double-Cropping Rice Area in China: Evidence from Provinces and Households.” Chinese Geographical Science 29 (1): 127–138. https://doi.org/10.1007/s11769-018-0972-4.
- Wang, Y., and F. Tao. 2023. “Nitrogen Nutrient Supply and Greenhouse Gas Mitigation Potentials from Cover Crops Across Chinese Croplands.” Journal of Cleaner Production 425:138881. https://doi.org/10.1016/j.jclepro.2023.138881.
- Wang, Y., D. Zhuang, D. Jiang, J. Fu, X. Yu, and H. Ju. 2014. “Indentifying Winter Fallow Fields by Combining Use of MODIS-EVI Time Series and Phenological Data.” Journal of Food, Agriculture & Environment 12:216–220.
- Wu, W., Q. Yu, L. You, K. Chen, H. Tang, and J. Liu. 2018. “Global Cropping Intensity Gaps: Increasing Food Production without Cropland Expansion.” Land Use Policy 76:515–525. https://doi.org/10.1016/j.landusepol.2018.02.032.
- Yang, J., and X. Huang. 2021. “The 30 M Annual Land Cover Dataset and Its Dynamics in China from 1990 to 2019.” Earth System Science Data 13 (8): 3907–3925. https://doi.org/10.5194/essd-13-3907-2021.
- Yan, L., and D. P. Roy. 2020. “Spatially and Temporally Complete Landsat Reflectance Time Series Modelling: The Fill-And-Fit Approach.” Remote Sensing of Environment 241:111718. https://doi.org/10.1016/j.rse.2020.111718.
- Yu, X., Q. Wang, H. Yan, Y. Wang, K. Wen, D. Zhuang, and Q. Wang. 2014. “Forest Phenology Dynamics and Its Responses to Meteorological Variations in Northeast China.” Advances in Meteorology 2014:592106. https://doi.org/10.1155/2014/592106.
- Zeng, L., B. D. Wardlow, D. Xiang, S. Hu, and D. Li. 2020. “A Review of Vegetation Phenological Metrics Extraction Using Time-Series, Multispectral Satellite Data.” Remote Sensing of Environment 237:111511. https://doi.org/10.1016/j.rse.2019.111511.
- Zhai, M., X. Xu, and X. Jiang. 2012. “A Method on Information Extraction of Winter Fallow Fields in Middle and Lower Reaches of Yangtze River by Remote Sensing.” Journal of Geo-Information Science 14 (3): 389–397. (in Chinese). https://doi.org/10.3724/SP.J.1047.2012.00389.
- Zhu, X., J. Chen, F. Gao, X. Chen, and J. G. Masek. 2010. “An Enhanced Spatial and Temporal Adaptive Reflectance Fusion Model for Complex Heterogeneous Regions.” Remote Sensing of Environment 114 (11): 2610–2623. https://doi.org/10.1016/j.rse.2010.05.032.
- Zhu, X., Y. Pang, M. Hu, and H. Zheng. 2010. “Suitable Vegetable Varieties and Cultivation Techniques for Winter Fallow Fields.” Agricultural Technology Service 27:204–205. (in Chinese).