?Mathematical formulae have been encoded as MathML and are displayed in this HTML version using MathJax in order to improve their display. Uncheck the box to turn MathJax off. This feature requires Javascript. Click on a formula to zoom.
ABSTRACT
The foundational step in constructing a digital twin involves transforming the physical world into an immersive 3D virtual environment. Unmanned aerial vehicle (UAV)-based photogrammetry, mobile mapping system (MMS), and terrestrial laser scanning (TLS) serve as powerful tools for 3D reconstruction of urban environments. Given the distinctive strengths and weaknesses of each sensor, a multi-source point cloud registration technique is imperative to achieve a detailed and precisely geolocated 3D urban model. Hence, we developed coarse-to-fine approach methods, called building exterior wall-based (BEWB) and building outline-based (BOB) algorithms, to register point clouds captured by diverse sensors in urban scenes. The BEWB algorithm coarsely registers urban point clouds by extracting building exterior walls, establishing correspondence points, and effectively removing outliers within this correspondence point set. The BOB algorithm precisely registers the urban point clouds acquired from multiple sensors by leveraging building outlines and points corresponding to the ground of the point clouds. To validate the proposed algorithms, we initially registered a UAV-based photogrammetry point cloud with the MMS point cloud and subsequently registered the TLS point clouds. Comprehensive quantitative and qualitative analyzes of the results demonstrate that our algorithms outperform existing methods in achieving precise registration. By successfully registering three distinct point clouds, we generated a comprehensive urban scene point cloud characterized by enhanced precision, point density, and geolocation accuracy.
1. Introduction
With the advent of the fourth industrial revolution, the concept of a smart city has emerged as a future urban platform capable of addressing urban challenges and enhancing the overall quality of life. A critical component in the realization of a smart city is the establishment of a real-time connection between the physical and virtual worlds through a digital twin (Deren, Wenbo, and Zhenfeng Citation2021; Jiang et al. Citation2021). The initial step toward creating a digital twin involves reconstructing the physical world in an immersive 3D virtual environment.
Unmanned aerial vehicle (UAV)-based photogrammetry, mobile mapping system (MMS), and terrestrial laser scanning (TLS) are powerful tools for 3D urban reconstruction (Chiabrando et al. Citation2019; Mohammadi et al. Citation2021; Previtali, Brumana, and Banfi Citation2022). UAV-based photogrammetry produces extensive 3D reconstructions with rich textures and comprehensive coverage. However, the resulting photogrammetric point clouds have a relatively low point density, and the use of ground control points (GCPs) is essential to ensure accurate geolocation (Nota, Nijland, and de Haas Citation2022; Padró et al. Citation2019). MMS excels at capturing precise and dense point clouds along roads, and the increasing prevalence of high-definition (HD) maps makes it more convenient to access accurately georeferenced MMS point cloud data (Won et al. Citation2019; Q. Xu et al. Citation2023). Nevertheless, MMS has limitations in capturing geospatial information beyond roadways, including areas such as roofs that are not visible on the road. TLS is adept at capturing precise and dense point clouds in inaccessible areas via MMS. However, TLS is constrained to a limited range with one station and relies on local coordinate systems. Each sensor exhibits distinct strengths and weaknesses, emphasizing the need for a multi-source point cloud registration technique to comprehensively reconstruct urban environments in a 3D model (Choi and Song Citation2022; Kim, Chen, and Cho Citation2018; Park et al. Citation2019; Zhao et al. Citation2023). This approach ensures enhanced precision, a higher point density, and superior geolocation accuracy in the final representation (Chiabrando et al. Citation2019; Previtali, Brumana, and Banfi Citation2022; J. Li, Hu, and Ai Citation2021).
The iterative closest point (ICP) algorithm (Besl and McKay Citation1992) is the predominant choice for point cloud registration (PCR). Nevertheless, the performance of the ICP algorithm relies significantly on the initial alignment because it determines correspondence points through proximity in each iteration. When confronted with a suboptimal initial alignment, the algorithm tends to converge toward the local minima or in more challenging scenarios, fails to converge. Consequently, the prevailing strategy for PCR is to adopt a coarse-to-fine approach. This involves roughly aligning the two point clouds and then progressively refining the registration for high-precision results.
Coarse registration can be performed using either local features extracted from points or clusters of primitives, or global features derived from the entire point cloud. Methods employing global features, such as the 3D normal distribution transform (NDT) (Magnusson, Lilienthal, and Duckett Citation2007) and frequency domain-based approaches (R. Huang et al. Citation2021), typically require significant overlap ratios. While effective for registering point clouds of similar scales, global feature methods are inadequate for registering between small-scale point clouds and large-scale point clouds. Therefore, this study focused on coarse registration utilizing local features because it was necessary to register small-scale TLS point clouds to a large-scale UAV-based photogrammetry point cloud.
Coarse registration utilizing local features entails extracting features, such as points, lines, and planes, from two point clouds and resolving the transformation problem through correspondence features. In a study by S. Li et al. (Citation2021), straight lines were extracted from MMS and UAV-based photogrammetry point clouds, and the two point clouds were registered using the correspondence lines. This process involved projecting both point clouds onto a horizontal plane and extracting straight lines using a line segment detector (LSD) algorithm (Wang, Neumann, and You Citation2009). Studies by B. Yang et al. (Citation2015) and Cheng et al. (Citation2018) employed building outlines and ground surfaces to register airborne laser scanner (ALS) point clouds and TLS point clouds. Yang et al. conducted horizontal registration by aligning the building outlines using geometric constraints and Laplacian matrices, while vertical registration was accomplished by utilizing the average elevation difference between points surrounding buildings of two point clouds. Cheng et al. achieved horizontal registration by utilizing the four-point congruent sets method on the extracted building outline, while vertical registration was accomplished by dividing the ground into a grid and establishing correspondence ground planes. Xu et al. (Citation2022) extracted 3D line features from two TLS point clouds and combined them to form 2-line congruent sets (2LCS). The transformation problem was solved using correspondence-congruent sets with the highest registration score in random sample consensus (RANSAC). Additionally, Y. Xu et al. (Citation2019) extracted voxel-based 4-plane congruent sets (V4PCS) from two TLS point clouds and tackled the transformation problem using correspondence-congruent sets with the highest registration score in RANSAC. Lines and planes inherently contain more geometric information than individual points do. Consequently, when lines and planes are accurately extracted from the two point clouds and the correspondence features are accurately established, solving the transformation problem becomes more straightforward compared to point-based coarse PCRs (Dong et al. Citation2020).
However, extracting identical lines or planes from the same structure in cross-source point clouds poses considerable challenges. Cross-source point clouds tend to contain more noise and outliers than same-source point clouds and exhibit different point densities and precisions, further complicating feature extraction and corresponding. Moreover, to increase the chances of success, both point clouds must comprehensively contain structures such as buildings (X. R. Huang et al. Citation2021).
The point-based coarse PCR provides a high level of generalizability and flexibility (J. J. Li, Hu, and Ai Citation2021; J. Li, Hu, and Ai Citation2021). Consequently, it has emerged as a more adaptable solution for cross-source point clouds that typically present more constraints than their same-source counterparts. In point-based coarse PCR, distinctive points among the surrounding points are first identified as keypoints using keypoint detectors, such as intrinsic shape signatures (ISS) (Yu Citation2009), local surface patches (LSP) (H. Chen and Bhanu Citation2007), and KeypointNet (Suwajanakorn et al. Citation2018). Subsequently, keypoint descriptors such as the fast point feature histogram (FPFH) (Rusu, Blodow, and Beetz Citation2009), radius-based surface descriptor (RSD) (Marton et al. Citation2010), unique shape context (USC) (Tombari, Salti, and Di Stefano Citation2010), and PPFNet (Deng, Birdal, and Ilic Citation2018) were employed to articulate the keypoints as feature vectors. The keypoints from the two point clouds are compared based on the similarity of their feature vectors, leading to the establishment of correspondence points.
However, existing 3D keypoint methods are encumbered by limitations that result in numerous outliers in the correspondence point set. The initial correspondence point set often exhibits an outlier ratio exceeding 95% (Bustos and Jun Chin Citation2018), underscoring the need for a method to achieve successful registration, even when there is a significant number of outliers within the set of correspondence points. Zhou, Park, and Koltun (Citation2016) introduced fast global registration (FGR), which effectively removed outliers using the Geman-McClure cost function and graduated nonconvexity (GNC). Yang, Shi, and Carlone (Citation2021) proposed truncated least-squares estimation and semidefinite relaxation plus plus (TEASER++), which decomposes the registration problem into scale, rotation, and translation subproblems and estimates a transformation matrix by removing outliers using a truncated least-squares cost function and adaptive voting. Similarly, J. Li, Hu, and Ai (Citation2021) decomposed the registration problem into three subproblems, and the outliers were addressed using Tukey’s biweight cost function and one-point RANSAC. Furthermore, they emphasized that their method exhibited a lower computational complexity than TEASER++. According to the experimental results (H. Yang, Shi, and Carlone Citation2021; J. Li, Hu, and Ai Citation2021), FGR demonstrated robustness with up to 80% outliers, whereas the TEASER++ and Li et al.’s algorithms achieved robustness with up to 99% outliers. However, the challenge intensifies in the context of cross-source urban scene point clouds, characterized by their large-scale and diverse noise such as clutter objects. The outlier ratio in the correspondence point set often exceeds 99%, leading to the failure of existing algorithms in achieving successful registration. Consequently, there is a crucial demand for a point-based coarse PCR method that is specifically tailored to urban scene cross-source point clouds.
The ICP algorithm is the de facto standard for fine registration, boasting numerous variants. To enhance the registration accuracy of the conventional ICP algorithm, researchers have proposed several alternative error metrics to replace point-to-point error distances. These alternatives include point-to-line (Censi Citation2008), point-to-plane (Y. Chen and Medioni Citation1992), and plane-to-plane metrics (Segal, Haehnel, and Thrun Citation2009). Addressing the challenge of outliers within a correspondence point set is crucial for the ICP algorithm. In this context, Babin, Giguere, and Pomerleau (Citation2019) introduced a robust ICP algorithm that mitigates the impact of outliers on registration. They achieved this by assigning significant weights to inliers and minimal weights to outliers using an M-estimator. Despite these advancements, the ICP algorithm and its variants struggle to perfectly filter outliers in the correspondence point set, particularly in the face of the challenges posed by cross-source urban scene point clouds. This limitation hampers the attainment of precise PCR. Consequently, there is a need for robust fine registration techniques specifically tailored to urban scene cross-source point clouds.
The findings of the analysis of related research aimed at addressing large-scale cross-source urban point cloud registration are summarized as follows: urban point clouds can be georeferenced using local or global coordinates. Therefore, to register two point clouds that use different coordinate systems, a coarse-to-fine approach involving coarse registration followed by fine registration is required. Coarse registration methods can be divided into line-, plane-, and point-based methods. Among these, point-based coarse registration with a high level of generalizability and flexibility is suitable for cross-source point cloud registration. The primary challenge in point-based coarse registration is a significantly large number of outliers in a set of putative correspondence points. However, the existing algorithms lack robustness when the outlier rate within the set of putative correspondence points exceeds 99%. In the registration of cross-source urban point clouds characterized by their large-scale and diverse noise such as clutter objects, it is common for the ratio of outliers within a set of putative correspondence points to exceed 99%. This high rate of outliers makes it challenging to achieve successful registration using the existing algorithms. The sensors used to acquire urban point clouds have two inherent advantages: they provide accurate gravity direction and have absolute scale. Therefore, by leveraging these two advantages, it is necessary to develop a point-based coarse registration method that surpasses the robustness of existing algorithms for large-scale cross-source urban point cloud registration. In fine registration, the ICP-type algorithm is commonly used as the de facto standard. However, point clouds in urban scenes often contain various types of noise, including clutter objects. Moreover, the point clouds obtained from the different sensors exhibit differences in point density and precision. Consequently, ICP-type algorithms face challenges in achieving precise registration of key structures. Therefore, by leveraging the two advantages inherent in urban point clouds, a fine registration method is required that extracts only the key structures from both point clouds and employs them as reference points.
In this study, we propose a robust registration method for coarse PCR in cross-source urban scenes, called a building exterior wall-based (BEWB) algorithm. The BEWB algorithm capitalizes on the distinctive role of the exterior walls of buildings in defining urban landscapes. We specifically focused on registering point clouds with four degrees of freedom (DOF), benefiting from the accurate gravity direction obtainable from most sensors employed to capture urban environments. Additionally, this paper presents a building outline-based (BOB) algorithm for fine registration. The BOB method utilizes building outlines and points corresponding to the ground of point clouds to achieve precise registration between the two point clouds.
To validate the performance of the proposed algorithms, we registered UAV-based photogrammetry and MMS point clouds. Subsequently, for areas requiring enhanced 3D modeling intricacy, we registered TLS point clouds with the MMS+UAV-based photogrammetry point cloud. The obtained results were analyzed quantitatively and qualitatively to assess the accuracy and reliability of PCR.
2. Methodology
2.1. Overview
As shown in , this study registered UAV-based photogrammetry and TLS point clouds with an MMS point cloud, anticipating that the accessibility of accurately georeferenced MMS point clouds will increase with the advancement of the autonomous driving industry. The initial alignment of the MMS and UAV-based photogrammetry point clouds relied on the global navigation satellite system (GNSS) information from both platforms, eliminating the need for coarse registration. Consequently, only fine registration was performed using the BOB algorithm.
Figure 1. Schematic workflow.
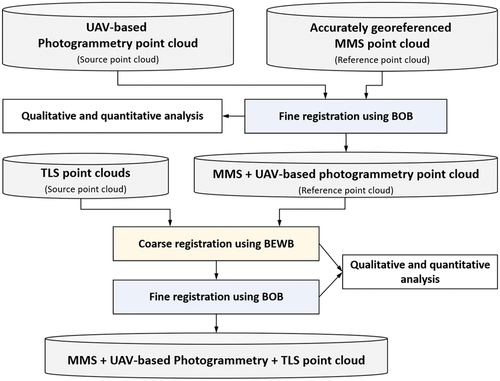
Subsequently, for areas requiring more detailed 3D reconstruction, the TLS point clouds were registered with the MMS+UAV-based photogrammetry point cloud. As the TLS point clouds were in a local coordinate system, coarse registration was conducted using the BEWB algorithm, followed by fine registration using the BOB algorithm. The results were subjected to comprehensive analysis incorporating qualitative and quantitative evaluations, as described in detail in the following section.
2.2. Coarse registration using BEWB algorithm
Sensors employed for urban environment capture, such as UAV-based photogrammetry, MMS, and TLS, offer accurate gravity direction and have absolute scale. Considering these advantages, the BEWB algorithm was introduced, as illustrated in .
Figure 2. BEWB algorithm flowchart.
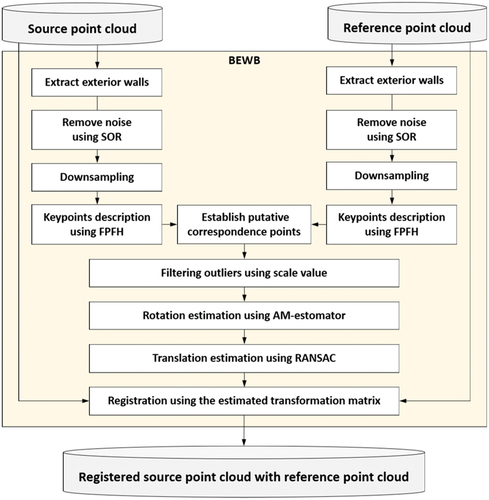
In registration problems, it is essential to establish the correct correspondence points. Therefore, the BEWB algorithm attempts to overcome the above issue in two ways: by reducing the proportion of outliers within the set of putative correspondence points and by removing outliers within the set of putative correspondence points.
First, The BEWB algorithm aims to reduce the proportion of outliers within a set of putative correspondence points. Exterior building walls play a pivotal role in defining urban landscapes. Therefore, the probability that correct correspondence points will be generated among the exterior wall points is high. The BEWB algorithm utilizes the normal vectors of the points to identify the points corresponding to the exterior walls of the building and generates putative correspondence points among them using FPFH. In this process, effectively detecting keypoints from cross-source point clouds is challenging given the differences in point density and precision between the two datasets. To overcome this challenge, the BEWB algorithm substitutes keypoint detection with downsampling, specifically by adjusting the voxel size to 1 m. Subsequently, the points of the downsampled point cloud were described in a keypoint vector format using the FPFH, thus establishing putative correspondence points.
Second, BEWB effectively removes outliers within the set of putative correspondence points. As both point clouds share the same absolute scale, the first round of outlier removal based on the scale values was applied to the putative correspondence points. Subsequently, during rotation matrix estimation using an annealing maximum likelihood-type (AM)-estimator, a second round of outlier removal was executed from the putative correspondence points. After a substantial reduction in outliers, the remaining putative correspondence points were subjected to the RANSAC algorithm to estimate the translation vector. Finally, the estimated transformation matrix is employed for the coarse registration of the two point clouds.
2.2.1. Building exterior wall extraction
Building exterior walls are typically perpendicular to the ground, and most sensors utilized for 3D mapping of urban environments offer accurate gravity direction. Hence, the BEWB algorithm extracts points corresponding to the building exterior walls by leveraging the Z-axis value of the normal vector of the points.
According to the guidelines for the safety and maintenance of facilities (Korea Authority of Land & Infrastructure Safety Citation2022) in Korea, building exterior walls with tilts greater than 1/150 (0.38) are classified as structures that necessitate emergency reinforcement, prohibition of use, or demolition. Surfaces that meet safety standards are likely to be walls. Therefore, points constituting a surface with a tilt lower than 1/30 (1.91°), which is five times the safety standard, were classified as walls, to account for point cloud noise and precision. Consequently, points with Z-axis values of the normal vectors smaller than sin (
) were extracted as walls. To reduce noise after extracting the exterior walls, we applied a statistical outlier removal (SOR) algorithm (Rusu et al. Citation2008).
Deriving putative correspondence points exclusively from points corresponding to the exterior walls of buildings has two notable advantages. First, building exterior walls play a pivotal role in shaping urban landscapes. Limiting the consideration to these points significantly diminishes the outlier ratio within the correspondence point set, unlike when using the entire point cloud. Second, this approach significantly reduces the overall number of putative correspondence points, resulting in a substantial reduction in the computational workload during subsequent processing.
2.2.2. Filtering outliers of correspondence vectors using scale value
For two given point clouds, and
, if the set of correspondence points (
) consists only of inliers, then
and
adhere to EquationEquation (1)
(1)
(1) , where
is a scale factor,
represents the rotation matrix,
denotes the translation vector, and
accounts for the measurement noise. Variables
,
, and
are unknown and must be estimated. The measurement noise
, follows a zero-mean Gaussian noise with isotropic covariance, reflecting the precision of the sensors.
This study aims to register point clouds acquired from MMS, UAV-based photogrammetry, and TLS, which provide gravity direction and have absolute scale. To obtain EquationEquation (2)(2)
(2) , we set
to 1 and fixed the
and
components of the rotation matrix
to 0, solely estimating the
component. Here,
is a 1DOF rotation matrix.
However, the correspondence point set established by the keypoint descriptor contains a significant number of outliers. Consequently, a point-based coarse PCR formulation becomes a robust estimation problem, as expressed in EquationEquation (3)(3)
(3) . Here,
is a robust function,
denotes
, and
represents a correspondence point set composed of inliers and outliers.
RANSAC is widely used for estimating the parameters of a mathematical model from a dataset containing outliers. However, a limitation of RANSAC is the exponential increase in computational time with higher outlier ratios. Therefore, a substantial portion of outliers should be preprocessed and removed before applying RANSAC. This was facilitated by leveraging the fact that the sensors employed in this study provide absolute scale.
To achieve translation invariance in EquationEquation (2)(2)
(2) , EquationEquation (2)
(2)
(2) for the
th correspondence point is subtracted from EquationEquation (2)
(2)
(2) for the
th correspondence point to yield EquationEquation (4)
(4)
(4) , which effectively eliminates the translation vector. Here,
and
represent the correspondence vectors, and
is the noise vector.
To attain rotation invariance, we apply the to EquationEquation (4)
(4)
(4) and leverage the triangle inequality to formulate EquationEquation (5)
(5)
(5) .
To remove outliers by leveraging the absolute scale of the point clouds, we divide in EquationEquation (5)
(5)
(5) to formulate EquationEquation (6)
(6)
(6) . Subsequently, we estimate the set of inliers (
) composed of the correspondence vectors that satisfy EquationEquation (6)
(6)
(6) , where,
represents the scale value of point cloud
relative to point cloud
.
2.2.3. Rotation matrix estimation
Utilizing the scale value for outlier removal can significantly reduce the proportion of outliers within the set of correspondence vectors, which typically reaches approximately 80%. However, the outlier ratio is still relatively high to apply RANSAC, which relies on randomness. Therefore, this study employs an AM-estimator (S. Z. Li, Wang, and Soh Citation1998), which is more reliable and faster than RANSAC, as shown in EquationEquation (7)(7)
(7) , to estimate the rotation matrix. Here,
represents the cost function. Rather than directly solving this problem, it can be implemented as an iteratively reweighted least-squares (IRLS) problem, as shown in EquationEquation (8)
(8)
(8) . In this context,
is the weight function, and
represents the residual calculated using the rotation matrix estimated at
th iteration. The iterations are continued until convergence occurs.
The cost and weight functions of the widely employed AM-estimator are listed in , where is the scale parameter governing the shape of the cost and weight functions, and
is the residual calculated using the rotation matrix estimated in the previous iteration. illustrates the shape of the function corresponding to different values of
. As
gradually decreased, the width of the weight function narrowed. The AM-estimator systematically reduced the value of
at a fixed rate (
) during each iteration of the IRLS calculation. This approach steadily diminishes the influence of the outliers at each iteration, thereby facilitating a robust estimation of the rotation matrix. Here,
represents the rate at which the value of
is reduced at each iteration of the AM-estimator. Consequently, a higher
value leads to a more aggressive reduction in the width of the weight function, resulting in the assignment of smaller weights to data considered outliers. However, overly aggressive narrowing of the graph width of the weight function may also assign small weights to inliers. Therefore, it is essential to determine the appropriate magnitude of parameter
. In this study, the optimal cost function type and
value were determined through simulations, and the detailed results are presented in Section 2.2.5.
Figure 3. Shape of the cost and weight functions according to .
Table 1. Cost and weight functions of the AM-estimator.
2.2.4. Translation vector estimation
The translation vector was estimated using the one-point RANSAC method, following the approach adopted by J. Li, Hu, and Ai (Citation2021). In the final iteration of the rotation matrix estimation process, the correspondence vectors with residuals smaller than can be identified and considered as a new set of inliers (
). As the correspondence vector consists of a pair of correspondence points, an inlier set of correspondence points (
) can be derived from
. Given the substantial removal of outliers in the preceding two steps, the one-point RANSAC facilitated a robust estimation of the translation vector.
2.2.5. Synthetic data experiments
Experiments were conducted using synthetic data to identify the optimal cost function type and value. The source correspondence points were generated by creating randomly distributed N (
) points within cubes
. Random
of the rotation matrix in the interval
and the random translation vector within the cube
were applied to the inliers of the source correspondence points to derive the corresponding inliers of the target correspondence points. Subsequently, outliers of the target correspondence points were generated by creating additional
randomly distributed points within the cube
and applying the previously generated random
of the rotation matrix and random translation vector. We then added zero-mean Gaussian noise with an isotropic covariance to the source and target correspondence points. The number of inliers was set to 10. We gradually increased the proportion of outliers and ascertained the success rate of PCR. For every outlier ratio, we conducted 1000 simulations and calculated the PCR success rates (
).
The PCR success rates according to the cost function type are listed in . As depicted in , the width of the weight function diminishes more significantly in the sequence of Fair, Cauchy, Welsch, and Tukey as the value of decreases. The simulation results indicated that, for Welsch and Tukey, the PCR success rate significantly decreased when the outlier ratio exceeded 97%. Similarly, the PCR success rate of the Fair cost function decreased significantly when the outlier ratio exceeded 99.5%. In contrast, the Cauchy function maintained a PCR success rate exceeding 99%, even with an outlier ratio of 99.98%. Therefore, we conclude that the Cauchy function exhibits the most suitable width reduction rate for estimating a 1DOF rotation matrix in the BEWB algorithm.
Table 2. PCR success rate according to cost function type and according to with Cauchy cost function.
The PCR success rates according to with the Cauchy cost function are shown in . The experiments were conducted by incrementally increasing
from 1.1 to 1.6 in steps of 0.1 while monitoring the success rate of the PCR. When the outlier ratio was 99.50% or lower, a 100% PCR success rate was observed regardless of the
. However, when the outlier ratio exceeded 99.98%, a success rate of 24.5% was observed at
of 1.1. As
increased, the PCR success rate also increased, peaking at 99.3% for a
of 1.3. However, from 1.4 onwards, the PCR success rate started to decline. Therefore, based on the experimental results, we set the value of
for the BEWB algorithm to be 1.3, which yielded the highest PCR success rate.
2.3. Fine registration using BOB algorithm
Point clouds in urban scenes often contain various types of noise, including clutter objects. Moreover, the point clouds obtained from the different sensors exhibit differences in point density and precision. Consequently, ICP-type algorithms struggle to achieve an accurate alignment of key structures, such as roads and building façades, during the fine registration of cross-source urban scene point clouds. To address this challenge, we propose the BOB algorithm, which utilizes building outlines and points corresponding to the ground of point clouds to achieve precise registration of urban point clouds acquired from multiple sensors. A flowchart of the BOB algorithm is shown in . Splitting the 3D registration problem into 2D (XY-plane) and 1D (Z-axis) allows the ICP algorithm within each step of BOB to establish the correct corresponding points.
Figure 4. BOB algorithm flowchart.
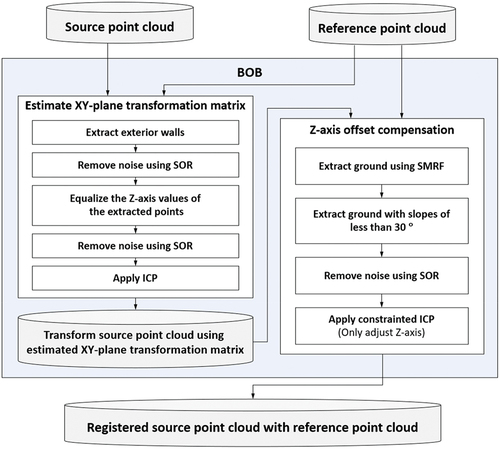
2.3.1. Building outline extraction and estimating XY-plane transformation matrix
The building exterior walls were extracted using the method employed in the BEWB algorithm to generate the building outlines. Subsequently, we set the Z-axis values of the extracted building exterior wall points to zero, creating a 2D representation of the building outline. We applied an SOR algorithm to reduce noise in the point cloud at each intermediate step. Subsequently, the ICP algorithm was applied to the 2D building outline point clouds to estimate the transformation matrix for the XY-plane.
2.3.2. Z-axis offset compensation
Even after transforming the source point cloud onto the XY-plane, the Z-axis offset persisted. Hence, we extracted points representing the ground surface with slopes of less than 30 and utilized them for the Z-axis offset correction. By employing a simple morphological filter (SMRF) algorithm (Pingel, Clarke, and McBride Citation2013), which is a widely used point cloud ground extraction technique, we identified points corresponding to the ground surface. However, utilizing the SMRF algorithm alone for ground extraction can result in the inclusion of nonground parts, such as the lower sections of buildings. To extract the actual ground surface exclusively, we filtered the SMRF results using a normal vector to extract points with slopes of less than 30
, and noise removal was performed using the SOR method.
This approach excludes inaccurately extracted lower parts of buildings using the SMRF algorithm. In addition, it enables the extraction of pristine ground surfaces with slopes of less than 30 from both the source and reference point clouds. This also reduces the number of points utilized in the Z-axis offset correction calculations, decreasing the computational workload. Because the goal is solely to correct the Z-offset, we modified the ICP algorithm to create a constrained ICP algorithm that corrects only the Z-axis values of the source points. Finally, we registered the two point clouds using the Z-offset value estimated using the constrained ICP.
3. Experiments
3.1. Study area
Yonsei University, Seoul, Korea, was selected as the study area. The study area encompasses approximately 0.2 km2, and the area features elevations ranging from 30 to 50 m. It includes both fixed-ground objects, such as buildings, playgrounds, roads, and trees, and non-fixed objects, such as people and vehicles. The tallest buildings within this area have 10 floors, and the spacing between the buildings ranges from 10 to 30 m. Vehicular roads cut through the central part of the study area.
3.2. Datasets
3.2.1. MMS point cloud
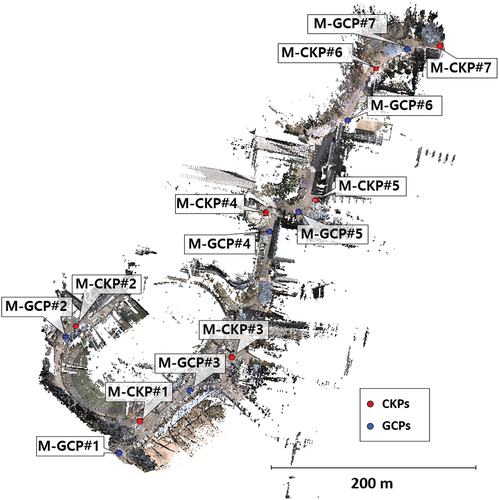
The MMS point cloud was acquired on 15 September 2020, along the road cut through the study area using a Leica Pegasus: Two. The geolocation accuracy of this system is 2 and 1.5 cm for the horizontal and vertical root mean square errors (RMSE), respectively, under open-sky conditions (Elhashash, Albanwan, and Qin Citation2022). The geolocation accuracy of the MMS point cloud was assessed using seven checkpoints (CKPs), resulting in an RMSE of 0.058 m. Further refinement was performed using seven GCPs to enhance the geolocation accuracy, resulting in an RMSE of 0.039 m. The refinement process using GCPs improved the MMS geolocation accuracy by approximately 2 cm. Both GCPs and CKPs were acquired using a Leica GS18T GNSS network real-time kinematic (RTK) rover, with horizontal and vertical accuracy of the RTK mode of 8 and 15 mm, respectively (Czaplewski et al. Citation2020). The distributions of the GCPs and CKPs are shown in . The number of points and the point density of the MMS point cloud are 111,299,614 points and 7,816 points/m2, respectively.
Figure 5. MMS point cloud and distribution of the GCPs and CKPs.
3.2.2. UAV-based photogrammetry point cloud
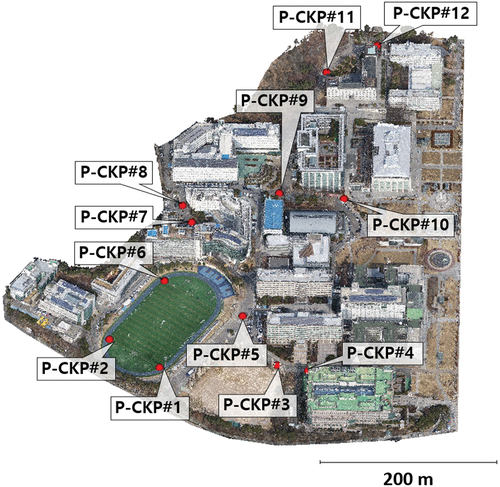
In UAV-based photogrammetry, combining nadir and oblique images has been proven effective in achieving comprehensive building reconstruction (Vacca, Dessì, and Sacco Citation2017). A total of 542 UAV images were captured on 24 February 2020, in nadir view, and 247 UAV images were captured on 8 February 2019, from an oblique view. The nadir images were captured using a Firefly 6 Pro, a fixed-wing UAV with a Sony Alpha ILCE-A6000 camera. Oblique images were obtained at a 55° angle relative to the vertical axis using a DJI Phantom 4 Pro, a rotary-wing UAV with a 1” CMOS sensor. The generation of a UAV-based photogrammetry point cloud employs the Pix4D Mapper program, and direct georeferencing was performed without GCPs. illustrates the point cloud generated through UAV-based photogrammetry and the distribution of the CKPs employed for geolocation accuracy assessment after PCR. The collection of CKPs was conducted using a Leica GS18T GNSS RTK rover for the precise assessment of geolocation accuracy. The number of points and the point density of the UAV-based photogrammetry point cloud are 32,805,778 points and 150 points/m2, respectively.
Figure 6. UAV-based photogrammetry point cloud and CKP distribution.
3.2.3. TLS point clouds
TLS point clouds, focusing on five specific areas requiring refinement after the registration of the MMS and UAV-based photogrammetry point clouds, were obtained using a Leica BLK360 imaging laser scanner. Each area consisted of 6–13 stations, and the stations within each area were meticulously registered using Leica Cyclone software. shows the five TSL point clouds and the distribution of CKPs. CKPs were collected using a Leica GS18T GNSS RTK rover for a precise geolocation accuracy assessment. The number of points and point densities of the TLS point clouds are summarized in .
Figure 7. TLS point clouds and CKP distribution.
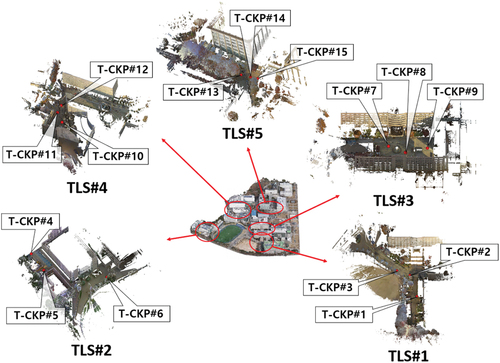
Table 3. Number of points and point densities of TLS point clouds.
3.3. MMS point cloud and UAV-based photogrammetry point cloud registration
The initial coarse alignment of the MMS and UAV-based photogrammetry point clouds utilized the GNSS information gathered from both platforms. Consequently, our attention was directed exclusively toward fine registration. We performed fine registration on the two point clouds using the BOB algorithm and compared the results with those obtained using the ICP, point-to-plane ICP, and robust ICP algorithms. However, the BOB algorithm cannot rectify errors in the Z-axis orientation. To address this limitation, we applied the ICP algorithm in conjunction with the alignment achieved by the BOB algorithm and compared the results with those of other methods. Because the two point clouds had already undergone fine registration using the BOB algorithm, we constrained the maximum distance for correspondence points in the ICP to 1 m.
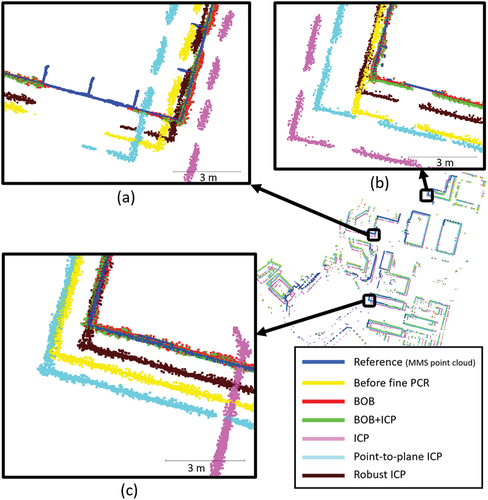
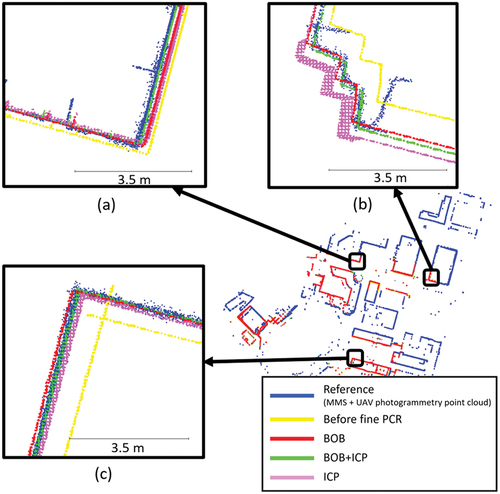
shows the building outlines after fine registration. The blue lines represent the building outlines of the reference MMS point cloud, whereas the yellow lines depict the building outlines of the UAV-based photogrammetry point cloud before the fine PCR. The building outlines of the UAV-based photogrammetry point clouds after applying the BOB or BOB+ICP algorithm were aligned precisely with those of the MMS point cloud. However, ICP, point-to-plane ICP, and robust ICP algorithms faced challenges in achieving precise alignment with the building outlines of the MMS point cloud. In particular, the ICP and point-to-plane ICP algorithms resulted in building outlines that were further offset from the reference than before fine PCR.
Figure 8. Building outlines of the UAV-based photogrammetry point clouds after the fine registration processes.
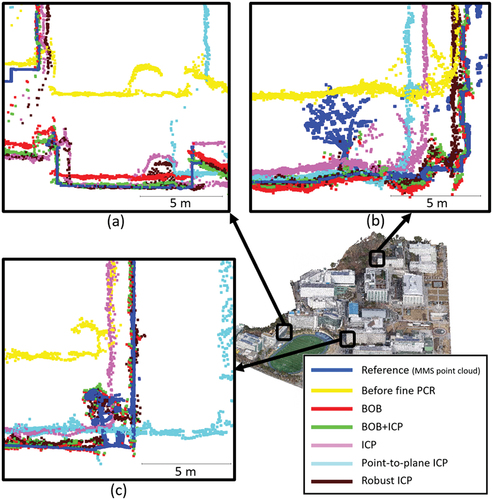
presents the road and building cross-sections following the fine registration process. All methods displayed improved vertical alignment with the reference MMS point cloud compared to that before the fine PCR. Specifically, UAV-based photogrammetry point clouds registered using BOB+ICP or robust ICP achieved precise vertical alignment with the MMS point clouds. The application of the BOB algorithm achieved an accurate vertical alignment with the MMS point cloud in certain areas, while displaying slight discrepancies in others. These discrepancies can be attributed to errors in the gravity direction provided by the sensor.
Figure 9. Road and building cross-sections of the UAV-based photogrammetry point clouds after the fine registration processes.
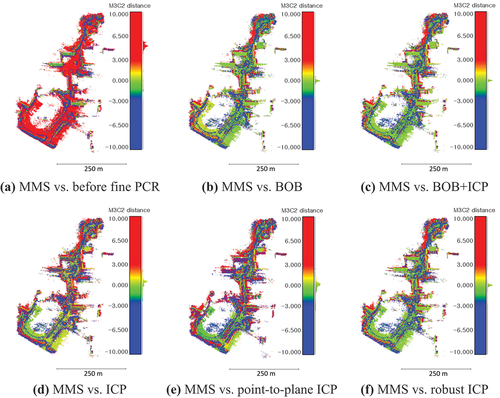
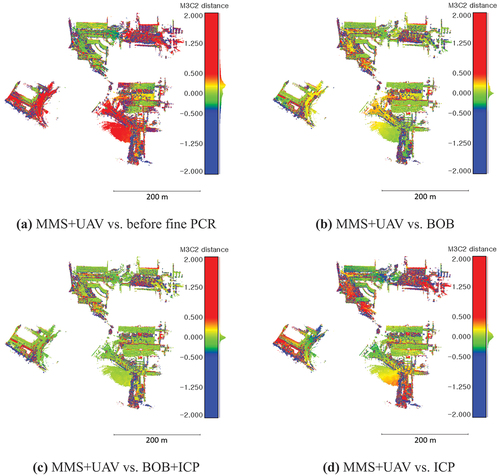
Multiscale model-to-model cloud comparison (M3C2) is a point cloud-based state-of-the-art 3D change-detection algorithm that calculates the orthogonal distance between a pair of point clouds (Lague, Brodu, and Leroux Citation2013; Winiwarter, Anders, and Höfle Citation2021). In the case of precisely aligned pairs of point clouds, M3C2 distances near zero are observed for stationary objects such as roads or buildings. Consequently, we employed the M3C2 distance to analyze the registration results thoroughly. illustrates the M3C2 distance between the MMS point cloud and UAV-based photogrammetry point clouds. Similar to prior assessments, registration using the BOB or BOB+ICP algorithm yielded M3C2 distances close to zero for the building exterior walls, whereas registration using BOB+ICP or robust ICP resulted in M3C2 distances close to zero for the ground surface.
Figure 10. M3C2 distances between the MMS and UAV-based photogrammetry point clouds.
The RMSE values for the absolute geolocations of the UAV-based photogrammetry point clouds calculated using the 12 CKPs indicated in are listed in . Notably, BOB+ICP stood out as the top performer in terms of absolute geolocation accuracy, followed by the standalone BOB algorithm. Although the robust ICP demonstrated superior vertical geolocation accuracy, its horizontal geolocation accuracy was lower than that of the BOB algorithm, resulting in diminished absolute geolocation accuracy compared to the latter. Moreover, the absolute geolocation accuracy of point-to-plane ICP deteriorated even further compared to that before fine PCR.
Table 4. Geolocation RMSE calculated by CKPs of UAV-based photogrammetry point clouds after fine PCR.
3.4. MMS+UAV-based photogrammetry point cloud and TLS point clouds registration
3.4.1. Coarse registration
TLS point clouds do not possess an inherent initial alignment with the MMS+UAV-based photogrammetry point cloud because TLS point clouds are referenced in local coordinates. Therefore, we conducted a coarse registration between the TLS point clouds and MMS+UAV-based photogrammetry point cloud using the BEWB algorithm. We used an MMS+UAV-based photogrammetry point cloud registered using the BOB+ICP algorithm with the highest absolute geolocation. The registration results of the BEWB algorithm were compared to those obtained using Li et al.’s algorithm (J. Li, Hu, and Ai Citation2021) and TEASER++ (H. Yang, Shi, and Carlone Citation2021).
To establish the putative correspondence points employed as inputs for Li et al. s algorithm and TEASER++, we replaced keypoint detection with a process involving downsampling of the source and reference point clouds with a voxel size of 1 m. Furthermore, we utilized the FPFH algorithm to describe the keypoints. EquationEquations (9)(9)
(9) and (Equation10
(10)
(10) ) were employed as metrics for quantitative assessments, where
represents the translation error,
is the ground-truth translation vector, and
is the estimated translation vector obtained using the algorithm.
denotes the rotation error,
is the ground-truth rotation matrix, and
is the estimated rotation matrix derived from the algorithm. presents the coarse PCR results of each algorithm for the five TLS point clouds and MMS+UAV-based photogrammetry point cloud. presents the coarse PCR success rates based on the permissible error thresholds.
Figure 11. Coarse PCR results of each algorithm for the five TLS point clouds and MMS+UAV-based photogrammetry point cloud. The TLS point clouds are tinted blue to differentiate them from the MMS+UAV-based photogrammetry point cloud.
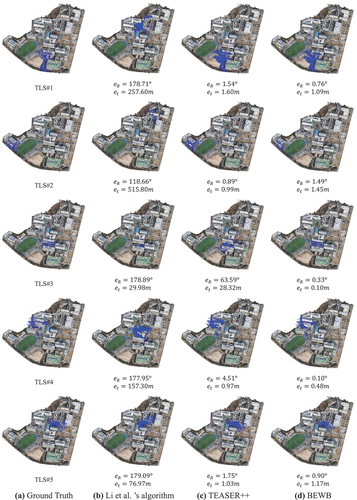
Table 5. Success rates of coarse PCR.
Experimental results demonstrated that the BEWB algorithm achieved the highest coarse PCR success rate. The algorithm of Li et al. failed in all the PCR, whereas TEASER++ achieved a PCR success rate of 80% when the permissible error thresholds were increased to and
. However, TEASER++ consistently exhibited larger errors than the BEWB algorithm, ultimately leading to PCR failure for TLS#3.
3.4.2. Fine registration
After the coarse PCR using the BEWB algorithm, fine registration was performed using the BOB, ICP, point-to-plane ICP, robust ICP, and BOB+ICP algorithms. However, point-to-plane ICP and robust ICP failed to register TLS#1, TLS#2, TLS#3, and TLS#5 and even exacerbated the misalignment between the two point clouds. The point-to-plane ICP algorithm is particularly sensitive to the initial alignment, rendering it less robust than the point-to-point ICP (P. P. Li et al. Citation2020). Consequently, point-to-plane ICP and robust ICP based on point-to-plane ICP were considered unsuccessful in cases with relatively large errors in the coarse PCR, except for TLS#4, which exhibited the smallest error in the coarse PCR. Therefore, our analysis was conducted solely based on the results of fine registration using the BOB, ICP, and BOB+ICP algorithms.
shows the building outlines after the fine registration process. Compared with before fine PCR, all methods demonstrated improved horizontal alignment with the reference MMS+UAV-based photogrammetry point cloud. Following the application of the BOB+ICP algorithm, the building outlines of the TLS point clouds were aligned almost precisely with those of the reference MMS+UAV-based photogrammetry point cloud. The building outline of the pink TLS point cloud subjected to the ICP algorithm appeared slightly thicker. This phenomenon can be attributed to a misalignment in the gravity direction of the TLS point clouds resulting from the ICP process. In contrast, the thicknesses of the building outlines in the TLS point clouds remained nearly unchanged when the BOB+ICP algorithm was applied. This suggests that the accurate initial alignment obtained using the BOB algorithm prevents the ICP from tilting erroneously in the wrong gravity direction.
Figure 12. Building outlines of the TLS point clouds after the fine registration processes.
depicts the cross-sections of the ground surface and buildings following the fine registration processes, whereas illustrates the M3C2 distance between the MMS+UAV-based photogrammetry and TLS point clouds. The TLS point clouds subjected to the BOB+ICP algorithm exhibited precise vertical alignment with the reference MMS+UAV-based photogrammetry point cloud. The M3C2 distance also exhibited values close to zero for the exterior walls of the buildings and ground surfaces when registered using the BOB+ICP algorithm.
Figure 13. Ground surface and building cross-sections of the TLS point clouds after the fine registration processes.
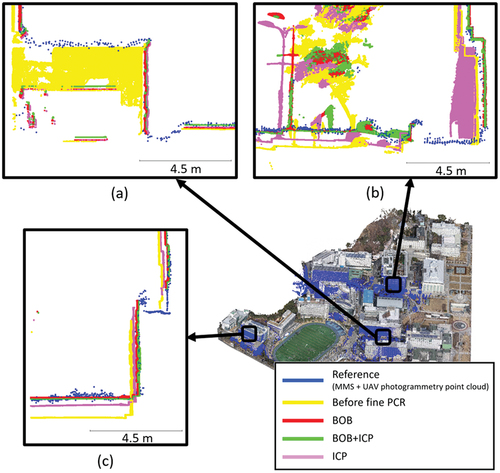
Figure 14. M3C2 distances between the MMS+UAV-based photogrammetry point cloud and the TLS point clouds.
However, the TLS point cloud with only the BOB algorithm applied displayed some discrepancies in certain areas, as shown in , with the M3C2 distance indicating values close to zero for the building exterior walls but varying for the ground surfaces. The TLS point clouds with only the ICP application exhibited substantial overall disparities with the reference point cloud, and the M3C2 distance was generally larger for both building exterior walls and ground surfaces than for the other two methods.
The RMSE values for the absolute geolocations of the TLS point clouds calculated using the 15 CKPs shown in are listed in . The absolute geolocation accuracies of the TLS point clouds registered using the BEWB+BOB+ICP and BEWB+BOB algorithms were both calculated to be 0.24 m. Although the BEWB+BOB+ICP algorithm produced the most accurate registration outcomes, the absolute geolocation accuracy of certain TLS point clouds was the highest when the BEWB+BEWB+BOB algorithm was applied. This observation can be attributed to the reference MMS+UAV-based photogrammetry point cloud with an RMSE of 0.2 m.
Table 6. Geolocation RMSE calculated by the CKPs of the TLS point clouds after fine PCR.
4. Discussion
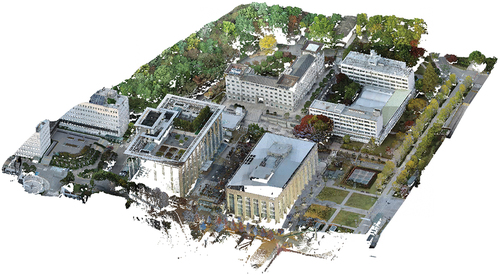
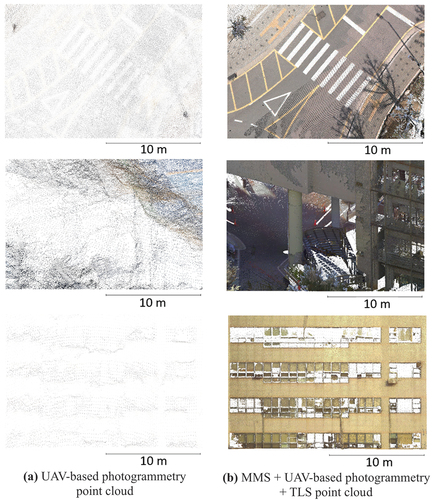
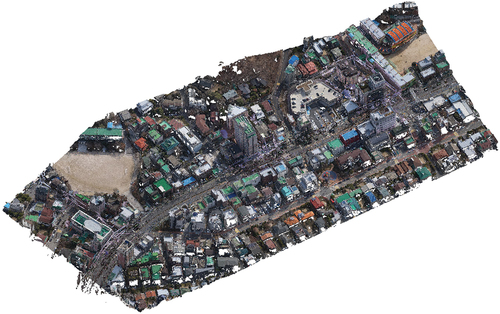
This study introduces a multi-source point cloud registration method tailored for urban environments, employing a coarse-to-fine approach to achieve a comprehensive 3D reconstruction of the urban landscape. We successfully registered the MMS, UAV-based photogrammetry, and TLS point clouds using the proposed method. The results of these registrations are shown in . compares UAV-based photogrammetry and MMS + UAV-based photogrammetry + TLS point cloud. The outcome of registering the point clouds obtained from the three sensors demonstrated a substantial improvement in point density compared to the UAV-based photogrammetry point cloud, as shown in .
Figure 15. Complete view of the MMS + UAV-based photogrammetry + TLS point cloud.
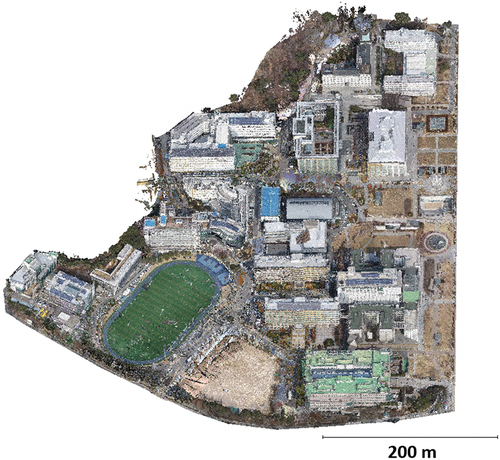
Figure 16. Comparison of the UAV-based photogrammetry point cloud and the MMS + UAV-based photogrammetry + TLS point cloud.
To verify the generality of the proposed algorithms, we conducted additional experiments on supplementary datasets representing typical urban areas, comprising MMS point cloud, UAV-based photogrammetry point cloud, and TLS point clouds. The results from these additional experiments, documented in Appendix A(see Appendix , ), are consistent with those presented in Section 3.
The applicability of the proposed methodology to the 3D reconstruction of an entire city is a crucial issue. However, applying the proposed methodology to an entire city is a challenging owing to data collection efficiency. In this methodology, comprehensive urban scenes are acquired via UAV-based photogrammetry. UAVs are constrained in coverage because of issues such as battery performance, making it challenging to map extensive areas with limited costs and time. TLS surveying also requires significant time and costs. Therefore, utilizing conventional aerial photogrammetry with manned aircraft to initially construct a 3D representation of the entire urban landscape, followed by the sequential application of this methodology to regions requiring enhanced precision, point density, and geolocation accuracy, could be a viable approach. To more effectively utilize this methodology in the 3D reconstruction of an entire city, future research needs to develop a framework to identify and prioritize areas within digital twins where high-quality 3D models are necessary.
Another critical issue is whether the proposed algorithm can be applied to complex urban areas, such as when the spacing between buildings is narrow. Because the proposed algorithms execute registration by extracting points corresponding to exterior walls, the presence of several overlapping exterior walls between two point clouds becomes a crucial factor influencing the success of the algorithms. To capture exterior walls using an MMS, it is crucial to ensure the presence of accessible roads for vehicles around the building. UAV-based photogrammetry can better capture the exterior walls of buildings by lowering the UAV altitude and utilizing oblique images captured from four directions: east, west, south, and north (Lee et al. Citation2024). The TLS can install equipment even in narrow spaces between buildings, allowing the capture of exterior walls without the issue. However, in cases where the space between buildings is narrow, the survey range achievable from one station is limited, necessitating surveys to be conducted at multiple stations. Given that surveying with TLS may not be efficient in narrow spacings between buildings, one potential approach is to acquire a point cloud using a backpack-mounted MMS (Bao et al. Citation2022).
With the rapid progress in UAV LiDAR systems, high-density UAV LiDAR point clouds have emerged as potent data sources for urban 3D modeling (B. B. Yang and Li Citation2022). Therefore, to further verify the generality of the proposed algorithms, the registration results of the UAV LiDAR point cloud and TLS point clouds are added to the Appendix B (see Appendix , ). Despite the partial occlusion of the exterior walls of the buildings in the UAV LiDAR point cloud, coarse registration proved successful in the majority of cases (see Appendix ). However, in cases where only one overlapping exterior wall exists between the UAV LiDAR point cloud and TLS point cloud, and substantial occlusion is present on that exterior wall in the UAV LiDAR data (registration between UAV LiDAR point cloud and TLS3_part3), the registration process failed. As mentioned in the previous paragraph, the proposed algorithms perform registration by extracting points corresponding to exterior walls. Therefore, it is reiterated that the presence of several overlapping exterior walls between two point clouds is a crucial factor in determining the success of the algorithms.
The main contributions of this study are as follows:
We proposed a coarse registration algorithm called the BEWB algorithm, which is tailored to coarsely register urban scene point clouds acquired from multiple sensors. As a point-based algorithm, the BEWB algorithm exhibits remarkable flexibility in handling diverse point cloud sources. It coarsely registers urban point clouds by extracting exterior walls of buildings, establishing correspondence points, and efficiently removing outliers within the set of correspondence points.
We proposed a fine registration algorithm called the BOB algorithm, which is tailored to precisely register urban scene point clouds acquired from multiple sensors. The BOB algorithm achieved precise registration in cross-source urban point clouds by leveraging building outlines and points corresponding to the ground of point clouds.
We proposed a methodology for generating a comprehensive urban scene point cloud with enhanced precision, higher point density, and superior geolocation accuracy. This was achieved by registering MMS, UAV-based photogrammetry, and TLS point clouds. With the growing prominence of the autonomous driving industry, accessibility to accurately georeferenced MMS point clouds is expected to increase significantly. We leveraged this by registering the UAV-based photogrammetry point cloud with the MMS point cloud, thereby improving geolocation accuracy. In addition, for areas requiring detailed 3D reconstruction, the registration of the TLS point clouds with the MMS+UAV-based photogrammetry point cloud enhanced the detail and comprehensiveness of the point cloud.
The limitations of this study are as follows. First, both the BEWB and BOB algorithms are applicable only to 4DOF transformation problems. They operate under the assumption that the Z-axis orientation in the point cloud is accurate and extract the points corresponding to the exterior walls of buildings based on this assumption. Consequently, their applicability is constrained when a significant error exists in the Z-axis orientation of point clouds. However, minor errors in the Z-axis can be rectified by applying the proposed algorithms, followed by the application of ICP, as demonstrated in our experiments.
Second, the scope of the BEWB and BOB algorithms is confined to areas with buildings, relying on information from the exterior walls of buildings for point cloud registration. This implies that these algorithms are unsuitable for nonurban or open landscapes. For both BEWB and BOB, the presence of several overlapping exterior walls, even with some occlusion, between the two point clouds is essential for successful registration.
Finally, as shown in , the UAV-based photogrammetry point cloud had a relatively low point density, with an interpoint spacing of 15–20 cm. Despite registering it with the MMS point cloud, the enhancement of the geolocation accuracy of the UAV-based photogrammetry point cloud was limited. Consequently, achieving a substantial improvement in the geolocation accuracy of the registered TLS point clouds was hindered. To address this issue, future studies should explore methods for obtaining a more precise and denser UAV-based photogrammetry point cloud involving approaches such as lowering UAV altitudes or using advanced optical sensors.
5. Conclusion
This study introduced a coarse-to-fine approach with BEWB and BOB algorithms, designed to register urban scene point clouds acquired from multiple sensors. These algorithms capitalize on the inherent gravity direction and absolute scale provided by commonly used sensors in urban mapping, such as MMS, UAV-based photogrammetry, and TLS. By recognizing the significance of building exterior walls and ground surfaces in shaping urban landscapes, we utilized these elements for precise registration.
To assess the performance of the proposed algorithms, experiments were conducted involving the registration of UAV-based photogrammetry point cloud with MMS point cloud and subsequent registration of TLS point clouds. The experimental results demonstrate that the proposed algorithms outperform existing methods, achieving a more precise registration of urban scene point clouds. Furthermore, this approach facilitated the generation of a comprehensive urban scene point cloud with improved precision, higher point density, and superior geolocation accuracy.
Clear_version_2st_revision_LEK_final.docx
Download MS Word (33.5 MB)Acknowledgments
We would like to thank Editage (www.editage.co.kr) for the English language editing.
Disclosure statement
No potential conflict of interest was reported by the author(s).
Data availability statement
The data are not publicly available because they are only accessible to Korean citizens, owing to legal restrictions.
Supplementary Material
Supplemental data for this article can be accessed online at https://doi.org/10.1080/15481603.2024.2341557
Additional information
Funding
References
- Babin, P., P. Giguere, and F. Pomerleau. 2019. “Analysis of Robust Functions for Registration Algorithms.” The Proceedings – IEEE International Conference on Robotics and Automation 2019:1451–35. https://doi.org/10.1109/ICRA.2019.8793791.
- Bao, S., W. Shi, P. Chen, H. Xiang, and Y. Yu. 2022. “A Systematic Mapping Framework for Backpack Mobile Mapping System in Common Monotonous Environments.” Measurement: Journal of the International Measurement Confederation 197 (April): 111243. https://doi.org/10.1016/j.measurement.2022.111243.
- Besl, P. J., and N. D. McKay. 1992. “Method for Registration of 3-D Shape.” Sensor Fusion IV: Control Paradigms and Data Structures 1611 (April 1992): 586–606. https://doi.org/10.1117/12.57955.
- Bustos, A. P., and T. Jun Chin. 2018. “Guaranteed Outlier Removal for Point Cloud Registration with Correspondences.” IEEE Transactions on Pattern Analysis & Machine Intelligence 40 (12): 2868–2882. https://doi.org/10.1109/TPAMI.2017.2773482.
- Censi, A. 2008. “An ICP Variant Using a Point-to-Line Metric.” Proceedings – IEEE International Conference on Robotics and Automation. 19–25. https://doi.org/10.1109/ROBOT.2008.4543181.
- Chen, H., and B. Bhanu. 2007. “3D Free-Form Object Recognition in Range Images Using Local Surface Patches.” Pattern Recognition Letters 28 (10): 1252–1262. https://doi.org/10.1016/j.patrec.2007.02.009.
- Cheng, X., X. Cheng, Q. Li, and L. Ma. 2018. “Automatic Registration of Terrestrial and Airborne Point Clouds Using Building Outline Features.” IEEE Journal of Selected Topics in Applied Earth Observations & Remote Sensing 11 (2): 628–638. https://doi.org/10.1109/JSTARS.2017.2788054.
- Chen, Y., and G. Medioni. 1992. “Object Modelling by Registration of Multiple Range Images.” Image and Vision Computing 10 (3): 145–155. https://doi.org/10.1016/0262-8856(92)90066-C.
- Chiabrando, F., G. Sammartano, A. Spanò, and A. Spreafico. 2019. “Hybrid 3D Models: When Geomatics Innovations Meet Extensive Built Heritage Complexes.” ISPRS International Journal of Geo-Information 8 (3). https://doi.org/10.3390/ijgi8030124.
- Choi, H., and Y. Song. 2022. “Comparing Tree Structures Derived Among Airborne, Terrestrial and Mobile LiDAR Systems in Urban Parks.” GIScience & Remote Sensing 59 (1): 843–860. https://doi.org/10.1080/15481603.2022.2076381.
- Czaplewski, K., Z. Wisniewski, C. Specht, A. Wilk, W. Koc, K. Karwowski, J. Skibicki, et al. 2020. “Application of Least Squares with Conditional Equations Method for Railway Track Inventory Using GNSS Observations.” Sensors (Switzerland) 20 (17): 1–17. https://doi.org/10.3390/s20174948.
- Deng, H., T. Birdal, and S. Ilic. 2018. “PPFNet: Global Context Aware Local Features for Robust 3D Point Matching.” Proceedings of the IEEE Computer Society Conference on Computer Vision and Pattern Recognition. 195–205. https://doi.org/10.1109/CVPR.2018.00028.
- Deren, L., Y. Wenbo, and S. Zhenfeng. 2021. “Smart City Based on Digital Twins.” Computational Urban Science 1 (1): 1–11. https://doi.org/10.1007/s43762-021-00005-y.
- Dong, Z., F. Liang, B. Yang, Y. Xu, Y. Zang, J. Li, Y. Wang, et al. 2020. “Registration of Large-Scale Terrestrial Laser Scanner Point Clouds: A Review and Benchmark.” ISPRS Journal of Photogrammetry & Remote Sensing 163 (March): 327–342. https://doi.org/10.1016/j.isprsjprs.2020.03.013
- Elhashash, M., H. Albanwan, and R. Qin. 2022. “A Review of Mobile Mapping Systems: From Sensors to Applications.” Sensors 22 (11): 1–26. https://doi.org/10.3390/s22114262.
- Huang, X., G. Mei, J. Zhang, and R. Abbas. 2021. “A Comprehensive Survey on Point Cloud Registration.” 1–17. http://arxiv.org/abs/2103.02690.
- Huang, R., Y. Xu, W. Yao, L. Hoegner, and U. Stilla. 2021. “Robust Global Registration of Point Clouds by Closed-Form Solution in the Frequency Domain.” ISPRS Journal of Photogrammetry & Remote Sensing 171 (July 2020): 310–329. https://doi.org/10.1016/j.isprsjprs.2020.11.014.
- Jiang, F., L. Ma, T. Broyd, and K. Chen. 2021. “Digital Twin and Its Implementations in the Civil Engineering Sector.” Automation in Construction 130 (July): 103838. https://doi.org/10.1016/j.autcon.2021.103838.
- Kim, P., J. Chen, and Y. K. Cho. 2018. “Automated Point Cloud Registration Using Visual and Planar Features for Construction Environments.” Journal of Computing in Civil Engineering 32 (2): 1–13. https://doi.org/10.1061/(asce)cp.1943-5487.0000720.
- Korea Authority of Land & Infrastructure Safety. 2022. “Guidelines for Safety and Maintenance of Facilities.” Korea Authority of Land & Infrastructure Safety. Accessed June 26, 2023. https://www.kalis.or.kr/www/brd/m_84/list.do.
- Lague, D., N. Brodu, and J. Leroux. 2013. “Accurate 3D Comparison of Complex Topography with Terrestrial Laser Scanner: Application to the Rangitikei Canyon (N-Z).” Isprs Journal of Photogrammetry & Remote Sensing 82:10–26. https://doi.org/10.1016/j.isprsjprs.2013.04.009.
- Lee, E., S. Park, H. Jang, W. Choi, and H. Gyoo Sohn. 2024. “Enhancement of Low-Cost UAV-Based Photogrammetric Point Cloud Using MMS Point Cloud and Oblique Images for 3D Urban Reconstruction.” Measurement: Journal of the International Measurement Confederation 226 (January): 114158. https://doi.org/10.1016/j.measurement.2024.114158.
- Li, S., X. Ge, S. Li, B. Xu, and Z. Wang. 2021. “Linear-Based Incremental Co-Registration of Mls and Photogrammetric Point Clouds.” Remote Sensing 13 (11). https://doi.org/10.3390/rs13112195.
- Li, J., Q. Hu, and M. Ai. 2021. “Point Cloud Registration Based on One-Point RANSAC and Scale-Annealing Biweight Estimation.” IEEE Transactions on Geoscience & Remote Sensing 59 (11): 9716–9729. https://doi.org/10.1109/TGRS.2020.3045456.
- Li, S. Z., H. Wang, and W. Y. C. Soh. 1998. “Robust Estimation of Rotation Angles from Image Sequences Using the Annealing M-Estimator.” Journal of Mathematical Imaging and Vision 8 (2): 181–192. https://doi.org/10.1023/A:1008281429730.
- Li, P., R. Wang, Y. Wang, and W. Tao. 2020. “Evaluation of the ICP Algorithm in 3D Point Cloud Registration.” Institute of Electrical and Electronics Engineers Access 8:68030–68048. https://doi.org/10.1109/ACCESS.2020.2986470.
- Magnusson, M., A. Lilienthal, and T. Duckett. 2007. “Scan Registration for Autonomous Mining Vehicles Using 3D‐NDT.” Journal of Field Robotics 24 (10): 803–827. https://doi.org/10.1002/rob.20204.
- Marton, Z. C., D. Pangercic, N. Blodow, J. Kleinehellefort, and M. Beetz. 2010. “General 3D Modelling of Novel Objects from a Single View.” IEEE/RSJ 2010 International Conference on Intelligent Robots and Systems, IROS 2010 – Conference Proceedings. IEEE. 3700–3705. https://doi.org/10.1109/IROS.2010.5650434.
- Mohammadi, M., M. Rashidi, V. Mousavi, A. Karami, Y. Yu, and B. Samali. 2021. “Quality Evaluation of Digital Twins Generated Based on Uav Photogrammetry and TLS: Bridge Case Study.” Remote Sensing 13 (17): 1–22. https://doi.org/10.3390/rs13173499.
- Nota, E. W., W. Nijland, and T. de Haas. 2022. “Improving UAV-SfM Time-Series Accuracy by Co-Alignment and Contributions of Ground Control or RTK Positioning.” International Journal of Applied Earth Observation and Geoinformation 109 (March): 102772. https://doi.org/10.1016/j.jag.2022.102772.
- Padró, J. C., F. Javier Muñoz, J. Planas, and X. Pons. 2019. “Comparison of Four UAV Georeferencing Methods for Environmental Monitoring Purposes Focusing on the Combined Use with Airborne and Satellite Remote Sensing Platforms.” International Journal of Applied Earth Observation and Geoinformation 75 (November 2018): 130–140. https://doi.org/10.1016/j.jag.2018.10.018.
- Park, J., P. Kim, Y. K. Cho, and J. Kang. 2019. “Framework for Automated Registration of UAV and UGV Point Clouds Using Local Features in Images.” Automation in Construction 98 (August 2018): 175–182. https://doi.org/10.1016/j.autcon.2018.11.024.
- Pingel, T. J., K. C. Clarke, and W. A. McBride. 2013. “An Improved Simple Morphological Filter for the Terrain Classification of Airborne LIDAR Data.” ISPRS Journal of Photogrammetry and Remote Sensing 77:21–30. https://doi.org/10.1016/j.isprsjprs.2012.12.002.
- Previtali, M., R. Brumana, and F. Banfi. 2022. “Existing Infrastructure Cost Effective Informative Modelling with Multisource Sensed Data: TLS, MMS and Photogrammetry.” Applied Geomatics 14:21–40. https://doi.org/10.1007/s12518-020-00326-3.
- Rusu, R. B., N. Blodow, and M. Beetz. 2009. “Fast Point Feature Histograms (FPFH) for 3D Registration.” Proceedings – IEEE International Conference on Robotics and Automation. IEEE. 3212–3217. https://doi.org/10.1109/ROBOT.2009.5152473.
- Rusu, R. B., Z. Csaba Marton, N. Blodow, M. Dolha, and M. Beetz. 2008. “Towards 3D Point Cloud Based Object Maps for Household Environments.” Robotics and Autonomous Systems 56 (11): 927–941. https://doi.org/10.1016/j.robot.2008.08.005.
- Segal, A., D. Haehnel, and S. Thrun. 2009, June. “Generalized-icp.” In Robotics: Science and Systems 2 (4): 435. https://doi.org/10.7551/mitpress/8727.003.0022.
- Suwajanakorn, S., N. Snavely, J. Tompson, and M. Norouzi. 2018. “Discovery of Latent 3D Keypoints via End-To-End Geometric Reasoning.” Advances in Neural Information Processing Systems 2018 (1): 2059–2070.
- Tombari, F., S. Salti, and L. Di Stefano. 2010. “Unique Shape Context for 3D Data Description.” 3DOR’10 - Proceedings of the 2010 ACM Workshop on 3D Object Retrieval, Co-Located with ACM Multimedia 2010, 57–62. https://doi.org/10.1145/1877808.1877821.
- Vacca, G., A. Dessì, and A. Sacco. 2017. “The Use of Nadir and Oblique UAV Images for Building Knowledge.” ISPRS International Journal of Geo-Information 6 (12). https://doi.org/10.3390/ijgi6120393.
- Wang, L., U. Neumann, and S. You. 2009. “Wide-Baseline Image Matching Using Line Signatures.” Proceedings of the IEEE International Conference on Computer Vision, no. Iccv. 1311–1318. IEEE. https://doi.org/10.1109/ICCV.2009.5459316.
- Winiwarter, L., K. Anders, and B. Höfle. 2021. “M3C2-EP: Pushing the Limits of 3D Topographic Point Cloud Change Detection by Error Propagation.” Isprs Journal of Photogrammetry & Remote Sensing 178 (October 2020): 240–258. https://doi.org/10.1016/j.isprsjprs.2021.06.011.
- Won, S. Y., J. Young Moon, S. Youn Yoon, and Y. Soo Choi. 2019. “The Future Direction of HD Map Industry Development Plan and Governance.” Journal of the Korean Association of Geographic Information Studies 22 (3): 120–132.
- Xu, Y., R. Boerner, W. Yao, L. Hoegner, and U. Stilla. 2019. “Pairwise Coarse Registration of Point Clouds in Urban Scenes Using Voxel-Based 4-Planes Congruent Sets.” Isprs Journal of Photogrammetry & Remote Sensing 151 (September 2018): 106–123. https://doi.org/10.1016/j.isprsjprs.2019.02.015.
- Xu, E., Z. Xu, and K. Yang. 2022. “Using 2-Lines Congruent Sets for Coarse Registration of Terrestrial Point Clouds in Urban Scenes.” IEEE Transactions on Geoscience & Remote Sensing 60:1–18. https://doi.org/10.1109/TGRS.2021.3128403.
- Xu, Q., F. Zhu, J. Hu, W. Liu, and X. Zhang. 2023. “An Enhanced Positioning Algorithm Module for Low-Cost GNSS/MEMS Integration Based on Matching Straight Lane Lines in HD Maps.” GPS Solutions 27 (1): 1–15. https://doi.org/10.1007/s10291-022-01362-9.
- Yang, B., and J. Li. 2022. “A Hierarchical Approach for Refining Point Cloud Quality of a Low Cost UAV LiDAR System in the Urban Environment.” Isprs Journal of Photogrammetry & Remote Sensing 183 (August 2021): 403–421. https://doi.org/10.1016/j.isprsjprs.2021.11.022.
- Yang, H., J. Shi, and L. Carlone. 2021. “Teaser: Fast and Certifiable Point Cloud Registration.” IEEE Transactions on Robotics 37 (2): 314–333. https://doi.org/10.1109/TRO.2020.3033695.
- Yang, B., Y. Zang, Z. Dong, and R. Huang. 2015. “An Automated Method to Register Airborne and Terrestrial Laser Scanning Point Clouds.” Isprs Journal of Photogrammetry & Remote Sensing 109:62–76. https://doi.org/10.1016/j.isprsjprs.2015.08.006.
- Yu, Z. 2009. “Intrinsic Shape Signatures: A Shape Descriptor for 3D Object Recognition.” 2009 IEEE 12th International Conference on Computer Vision Workshops, ICCV Workshops 2009. 689–696. IEEE. https://doi.org/10.1109/ICCVW.2009.5457637.
- Zhao, Y., J. Im, Z. Zhen, and Y. Zhao. 2023. “Towards Accurate Individual Tree Parameters Estimation in Dense Forest: Optimized Coarse-to-Fine Algorithms for Registering UAV and Terrestrial LiDAR Data.” GIScience & Remote Sensing 60 (1). https://doi.org/10.1080/15481603.2023.2197281.
- Zhou, Q. Y., J. Park, and V. Koltun. 2016. “Fast Global Registration.” Lecture Notes in Computer Science (Including Subseries Lecture Notes in Artificial Intelligence and Lecture Notes in Bioinformatics), 766–782. 9906 LNCS. https://doi.org/10.1007/978-3-319-46475-6.
Appendix A.
Additional experiments on the registration of MMS point cloud, UAV-based photogrammetry point cloud, and TLS point clouds
1. Datasets
Figure A1. MMS point cloud, UAV-based photogrammetry point cloud, and CKPs distribution: the MMS point cloud, captured by a Leica Pegasus: Two, underwent refinement utilizing five GCPs. The achieved horizontal and vertical geolocation accuracy is 3.2 cm and 3.6 cm, respectively. A UAV-based photogrammetry point cloud was generated using nadir images captured by a Firefly 6 Pro, Sony Alpha ILCE-A6000. The collection of CKPs was conducted using a Leica GS18T GNSS RTK rover.
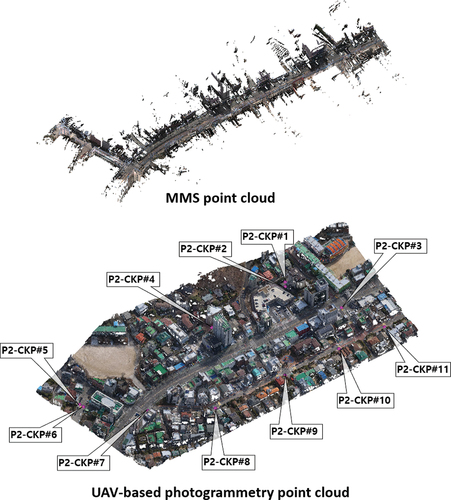
Figure A2. TLS point clouds, and CKPs distribution: TLS point clouds were captured using a Leica BLK360 imaging laser scanner. Each area consisted of 7–14 stations and registered using Leica Cyclone software. The collection of CKPs was conducted using a Leica GS18T GNSS RTK rover.
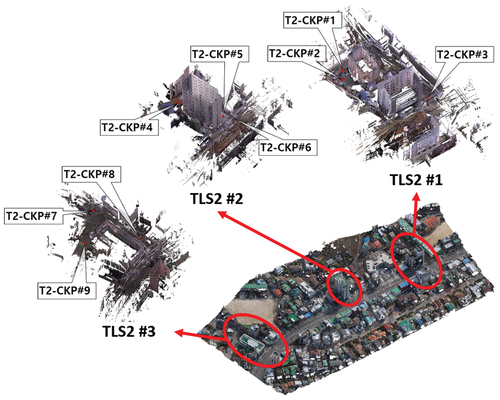
Table A1. Number of points and point densities of MMS point cloud, UAV-based photogrammetry point cloud and TLS point clouds.
2. Fine registration between MMS point cloud and UAV-based photogrammetry point cloud
Figure A3. Building outlines of the MMS point cloud and UAV-based photogrammetry point cloud after the fine registration processes.
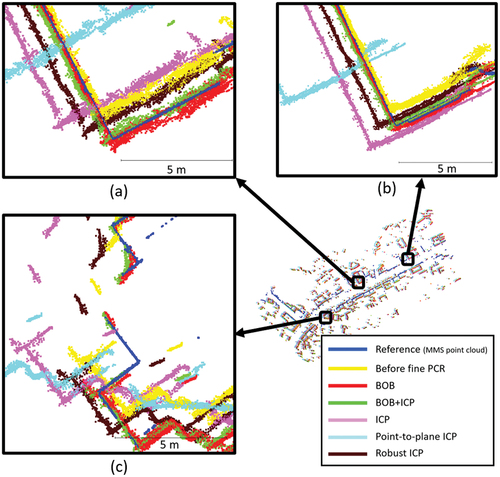
Figure A4. Road and building cross-sections of the MMS point cloud and UAV-based photogrammetry point cloud after the fine registration processes.
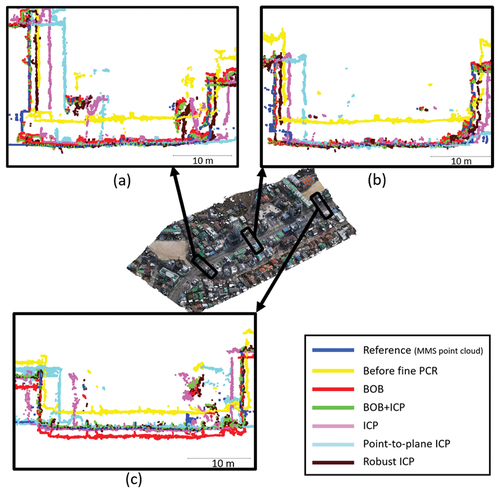
Table A2. Geolocation RMSE calculated by the CKPs of the UAV-based photogrammetry point cloud after fine PCR.
3. Coarse and fine registration between MMS+UAV-based photogrammetry point cloud and TLS point clouds
Table A3. Results and success rates of coarse PCR between MMS+UAV-based photogrammetry point cloud and TLS point clouds.
Figure A5. Building outlines of the MMS+UAV-based photogrammetry point cloud and TLS point clouds after the fine registration processes.
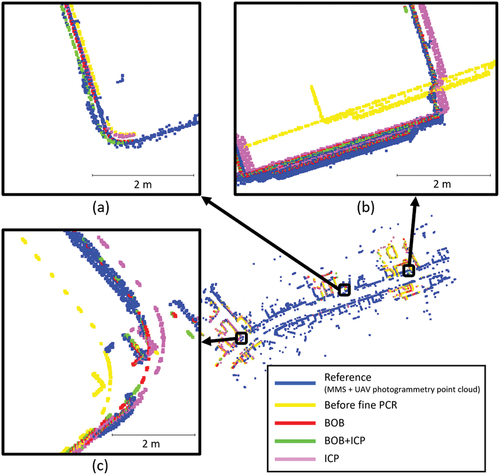
Figure A6. Ground surface and building cross-sections of the MMS+UAV-based photogrammetry point cloud and TLS point clouds after the fine registration processes.
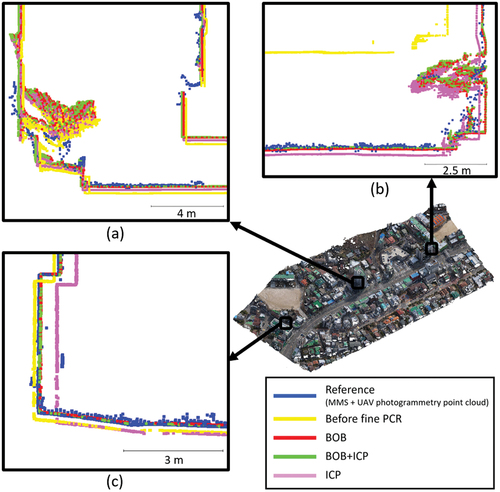
Table A4. Geolocation RMSE calculated by the CKPs of the TLS point clouds after fine PCR.
Figure A7. Complete view of the MMS + UAV-based photogrammetry + TLS point cloud.
Appendix B.
Additional experiments on the registration between UAV LiDAR point cloud and TLS point clouds
Figure B1. UAV LiDAR point cloud, TLS point clouds, and CKPs distribution: the UAV LiDAR point cloud, captured by a DJI Matrice 300 L1, was georeferenced using six GCPs. Horizontal and vertical geolocation accuracies are 5.6 cm and 2.8 cm, respectively. TLS point clouds were captured using a Leica BLK360 imaging laser scanner. TLS3 is comprised of 14 TLS stations registered using Leica Cyclone software. TLS3_part1–3 refers to one of the stations that constitute TLS3. The collection of CKPs was conducted using a Leica GS18T GNSS RTK rover.
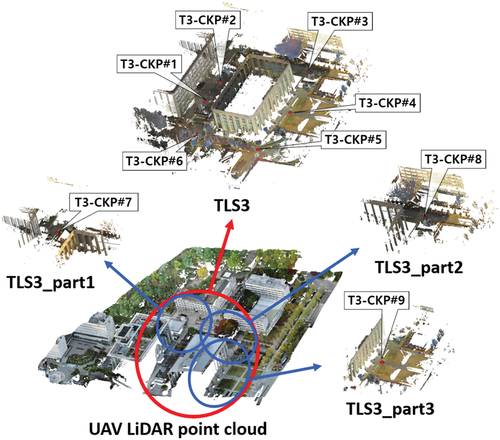
Table B1. Number of points and point densities of UAV LiDAR point cloud and TLS point clouds.
Table B2. Results and success rates of coarse PCR between UAV LiDAR point cloud and TLS point clouds.
Figure B2. Building outlines of the UAV LiDAR point cloud and TLS point cloud after the fine registration processes.
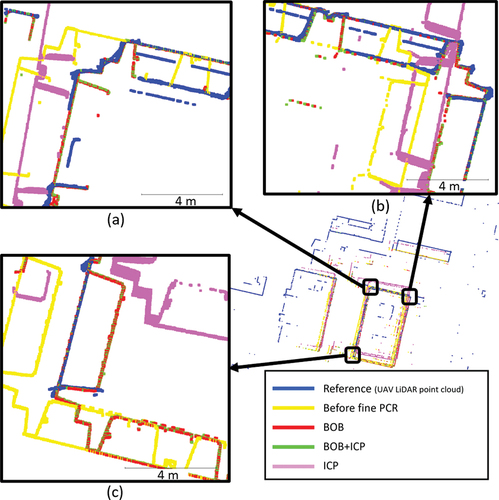
Figure B3. Ground surface and building cross-sections of the UAV LiDAR point cloud and TLS point cloud after the fine registration processes.
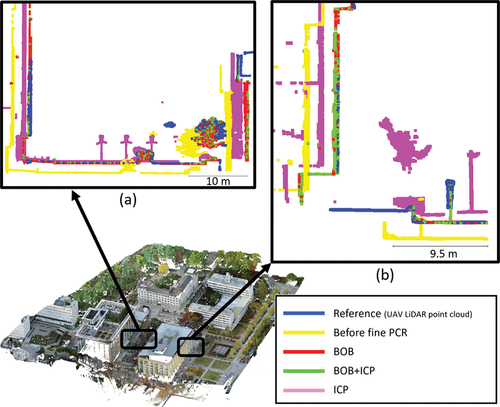
Table B3. Geolocation RMSE calculated by the CKPs of the TLS point clouds after fine PCR.
Figure B4. Complete view of registration result between UAV LiDAR point cloud and TLS point cloud.