
 ?Mathematical formulae have been encoded as MathML and are displayed in this HTML version using MathJax in order to improve their display. Uncheck the box to turn MathJax off. This feature requires Javascript. Click on a formula to zoom.
ABSTRACT
A comparative approach was carried out between artificial neural networks (ANNs) and response surface methodology (RSM) to optimize the drying parameters during infrared–convective drying of white mulberry. The drying experiments were performed at different air temperatures (40°C, 55°C, and 70°C), air velocities (0.4, 1, and 1.6 m/s), and three levels of infrared radiation power (500, 1000, and 1500 W). RSM focuses on the maximization of effective moisture diffusivity () and minimization of specific energy consumption (
) in the drying process. The optimized conditions were encountered for the air temperature of 70°C, the air velocity of 0.4 m/s, and the infrared power level of 1464.57 W. The optimum values of
and
were 1.77 × 10⁻⁹ m2/s and 166.554 MJ/kg, respectively, with the desirability of 0.9670. Based on the statistical indices, the results showed that the feed and cascade-forward back-Propagation neural systems with application of Levenberg-Marquardt training algorithm and topologies of 3–20-20-1 and 3–10-10-1 were the best neural models to predict
and
, respectively. This finding suggests that the ANN as an intelligent method with better performance compared to the RSM can be used to predict the drying parameters of the infrared-convective drying of white mulberry fruit.
Introduction
White mulberry (Morus sp.), a genus of family Moraceae, is a fruit-producing tree that can grow in a wide range of climatic, topographical, and soil conditions (Huang et al., Citation2011). Mulberry fruit is used for making confectionery products such as jam, marmalade, pulp, and paste (Vijayan et al., Citation2011).
Drying is one of the oldest and most common methods used to preserve foods and it can be carried out either traditionally, by sun drying, or industrially by solar, hot air, infrared, and other drying methods (Afolabi et al., Citation2015; Doymaz et al., Citation2016). Convective drying can improve energy efficiency and control the drying temperature and air humidity, which could be appropriate for temperature-sensitive vegetables and fruits (Fan et al., Citation2014; Liu et al., Citation2015). Infrared radiation (IR) has received much attention recently because it constitutes one possible tool for that purpose (Hammouda and Mihoubi, Citation2014; Kaveh et al., Citation2020). IR technology for drying of foods could decrease drying time, maintain uniform-contacted surface temperature in the product, and provide mostly better-quality products (Salehi and Kashaninejad, Citation2018b; Song et al., Citation2016). The increase in the demand for high-quality shelf-stable dried fruits and vegetables requires the design, modeling, and optimization of the drying processes, targeting the ultimate quality of the dried product while at the same time maximizing the efficiency of the process (Fealekari and Amiri Chayjan, Citation2014).
Response surface methodology (RSM) has been effectively employed in the process and product improvement for experimental design and model development of food processing, due to the complexity of the reactions and nonhomogeneous structure of food products (Aghilinategh et al., Citation2015). Modeling and optimizing of the process are vital factors in drying technology to increase the efficiency of the drying facilities. RSM has been repeatedly used to optimize food processes. In a research work, Sumic et al. (Citation2016) employed RSM to optimize the parameters for vacuum drying of red currants. The results of the study showed the optimal conditions for that process to be temperature of 70.2°C, pressure of 39 mbar, and drying time of 8 h. The use of RSM for optimization of osmo-vacuum drying of pear by Amiripour et al. (Citation2015) evidenced the optimal conditions for moisture content, rehydration ratio, and shrinkage to be 23.26% (w.b.), 1.46, and 67.45%, respectively. Amiri Chayjan et al. (Citation2017) investigated the optimization of pistachio nut drying in a fluidized bed dryer with microwave pretreatment applying RSM. According to their results, the optimum values of effective diffusivity (Deff), shrinkage, and specific energy consumption (SEC) were 4.865 × 10⁻⁹ m2/s, 14.22%, and 2.164 kWh, respectively.
Artificial neural networks (ANNs) constitute an alternative approach to solve problems, and their use has been increasing due to the possibility of outperforming traditional models. ANNs have been utilized successfully mainly due to their ability to adjust multivariable nonlinear functions (Golpour et al., Citation2015; Silva et al., Citation2015). In the field of drying processes, the neural networks are frequently used to model and predict the behavior of various products. Kaveh and Chayjan (Citation2015) predicted moisture ratio (MR), drying rate (DR), specific energy consumption, effective diffusivity, and shrinkage for terebinth using fluidized bed dryer by ANNs. They showed that the highest values of R2 obtained were 0.9965, 0.9730, 0.9855, 0.9932, and 0.9917, respectively, for MR, DR, SEC, Deff, and shrinkage. Accordingly, Taghinezhad et al. (Citation2019) used ANNs for the prediction of effective moisture diffusivity, specific energy consumption, color, and shrinkage in quince drying. The results of the research work showed ANNs had good predictive capability with values of R2 higher than 0.97 for predicting all parameters. Rad et al. (Citation2018) compared three methods of fuzzy logic, artificial neural network, and mathematical model to predict the white mulberry drying kinetics. Results demonstrated that output parameters were more accurately predicted by fuzzy model than by the ANN and mathematical models. Concerning the proper combinations of air temperature, infrared power, and air velocity for optimum responses in combined convective and infrared drying, limited studies have been done up to now. Therefore, the overall objective of this study was to develop a predictive optimization model by coupling the two approaches of ANN and RSM as an alternative to conventional procedures to predict the optimal conditions for the convective-infrared drying parameters of mulberry fruit, leading to minimum specific energy consumption and to maximum moisture diffusivity.
Materials and Methods
Sample Preparation
White mulberry fruits were obtained from the forests of Nalas city, West Azarbaijan province, Iran, in June 2018. The white mulberry samples were cleaned and stored at a refrigeration temperature of 4 ± 1°C. The initial moisture content of the fresh white mulberry samples was 2.43% (d.b.) that was determined in triplicate by applying a hot air oven at 70°C for 24 h, allowing reaching constant weight (Kaveh et al., Citation2018). About 40 g of white mulberry fruits was used in each experiment.
Drying Equipment
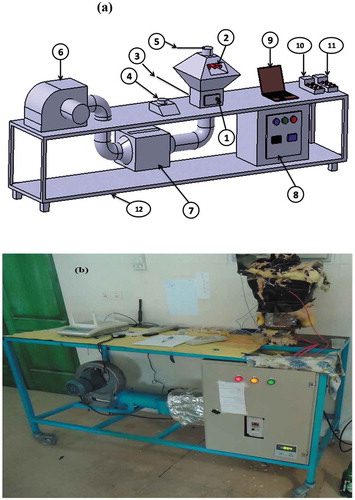
For this study, a laboratory infrared–convection dryer was developed at the Biosystems Engineering Department of Bu-Ali Sina, University, Hamedan, Iran (). The essential parts of the drying system mainly consisted of an adjustable centrifugal blower, four infrared lamps (Philips, Belgium) with 2000 W power, electrical air heating chamber (2.4 kW), drying chamber, inverter (LS, Korea), thermostat (Atbin, Iran), and a tray sample. Mean values of air ambient temperature and relative humidity were variable in the ranges 25–31°C and 24–29%, respectively. During the drying experiments, the ambient air temperature, air relative humidity, and inlet and outlet temperatures of the drying chamber were recorded at every 2 minutes. After 30 min, when the conditions inside the drier reached the steady state, the dryer was loaded with 40 ± 1 g of white mulberry and the drying process started. Experiments were performed at 40°C, 55°C, and 70°C. For each air temperature, three air velocities (0.4, 1.0, and 1.6 m/s) and three IR lamp radiations (500, 1000, and 1500 W) were used. Samples were weighed during the drying process by a digital balance (AND GF6000, Japan) with 0.01 g accuracy. The drying process continued until the final moisture content fell from an initial moisture of about 2.43% (d.b.) to or below 0.15% (d.b.).
Figure 1. (a) The scheme of the laboratory scale infrared dryer used: 1-drying chamber, 2-lamp infrared, 3-air temperature sensor, 4-precision balances, 5-air velocity sensor, 6-fan and electrical motor, 7-electrical heater, 8-inverter and thermostat, 9-computer, 10-thermometer, 11-psychrometer, 12-chassis; (b) The laboratory-scale infrared dryer
Effective Moisture Diffusivity
Fick’s second law is usually used to describe the drying characteristics of biological products during falling rate periods in diffusion mode (Cruz et al., Citation2015; Golpour et al., Citation2017).
The effective moisture diffusivity () can be estimated based on the drying data through Eq. (1), that applies to samples comparable to an infinite slab (Guiné et al., Citation2011).
where is the dimensionless moisture ratio,
is the moisture content at any time (% d.b.),
is the equilibrium moisture content (% d.b.),
is the initial moisture content (% d.b.),
is the number of terms taken into consideration,
is the drying time (s),
is the effective moisture diffusivity (m2/s), and r is the cylinder radius. Moisture ratio (
) can be simplified to
because
was relatively small compared to
and
(Omolola et al., Citation2018). If the second and following terms in the sum in Eq. (2) are neglected due to their small contribution, then the equation can be written in the logarithmic form as (Mota et al., Citation2010):
The slope () is calculated by plotting
against
as follows:
Specific Energy Consumption
The total energy needed for drying one charge of the drier together with the energy requirements for drying 1 kg of fresh mulberry fruit was computed for each drying experiment by the following Eq. (4) (Kaveh et al., Citation2018):
where is the specific energy consumption (kJ/kg) at each set of experimental conditions, Q is the inlet airflow to drying chamber (m3/min), t is the total drying time (min),
is the mass of removed water (kg),
and
are the specific heat capacity of vapor and air, respectively (1004.16 and 1828.8 J/kg.°C),
is the air absolute humidity (kgvapor/kgdry air),
is the air specific volume (m3/kg) and
and
are the air temperatures, entering the chamber and in the ambient surrounding (°C), respectively.
Response Surface Methodology Modeling
Experimental Design
The effect of three independent variables, A (air temperature), B (air velocity), and C (infrared power), on two responses (effective moisture diffusivity and specific energy consumption) was evaluated by RSM. In total, 20 experiments were established based on a face-centered central composite design (FCCD) by applying the design expert statistical software (V7) for simultaneous optimization of the multiple responses. These 20 experiments were generated including six replicates of the center point to calculate the repeatability of the method.
The levels of each independent variable applied are shown in , whereas the combination of variables and the corresponding responses for RSM analysis is shown in . In this design of experiments, three coded levels for each variable were selected: −1, 0, and +1 corresponding to the low, medium, and high levels for each independent variable, respectively (). The central values (level zero) chosen for experiment design to develop the regression equation were 55°C for air temperature, 1 m/s for air velocity, and 1000 W for infrared power.
Table 1. Coding of levels for the parameters used in designing natural experiments for the optimization of the infrared-convective drying process of white mulberry fruit
Table 2. Experimental design of combined convective with infrared drying and corresponding responses
Model Development
The obtained models were developed from regression coefficients under a range of experimental factors. The behavior of the response surface was studied for each of the response variables (Yi). The experimental data were fitted to a quadratic polynomial model which allowed estimating the regression coefficients. The generalized quadratic polynomial model proposed to predict the response variables is as follows:
where ,
,
, and
are the interaction coefficients of constant, linear, quadratic, and the second-order terms, respectively, while
are the coded independent variables for air temperature, air velocity, and Infrared power. Modeling started with a quadratic model including linear, squared, and interaction terms, and the adequacies of the model were checked in terms of the values of
, adjusted
, and prediction error sum of squares (PRESS).
Statistical Analysis
The ranges and levels of independent variables are presented in . The experimental plan for optimization included three dependent variables: temperature (40°C, 55°C, and 70°C), air velocity (0.4, 1 and 1.6 m/s), and infrared power (500, 1000, and 1500 W). All experiments were replicated three times. Using software Design Expert (V7), analysis of regression, and statistical analysis of variance (ANOVA) were conducted by fitting Eq. (5) to the experimental data to evaluate the regression coefficients and statistical significance of model terms. Accordingly, ANOVA was implemented for checking the adequacy and accuracy of the fitted models (Changrue et al., Citation2008). The significance of the model terms was assessed by F-ratio at a probability (P) of 0.05. The values of , adjusted-
, predicted error sum of squares (PRESS) and lack-of-fit of models were evaluated to check the model adequacies. The regression coefficients were employed to establish statistical computations for generating the response surface plots from the regression models. Finally, the optimum values of the selected variables were obtained by solving the regression equation and by analyzing the response surface contour plots.
Optimizing the Drying Process
The desired goal for each independent variable and response was established. The independent variables were kept within the range of experimental conditions selected while the responses were set to maximum for diffusivity and minimum for SEC. Equal weights were assigned to each goal to adjust the shape of the desirability function for optimization of the multiple responses (). Second-order polynomial models were used in this study for each response to determine the specified optimum conditions.
Table 3. Optimization criteria for independent variables and responses obtained from RSM
In order to find an optimum solution, the goals were combined into an overall composite function D(x), called desirability function, whose value for n responses, which can be defined as (Fealekari and Amiri Chayjan, Citation2014):
For any response, the desirability can vary from a minimum of zero, when one or more responses fall outside the desirable limits, to a maximum of one, which is the ideal case.
ANN Design
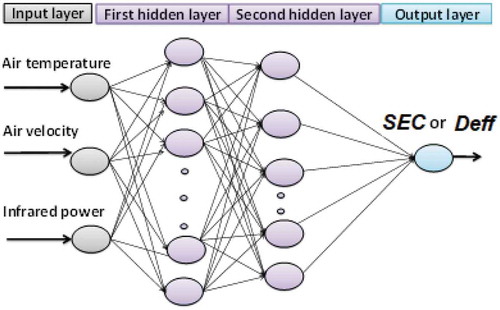
The schematic structure of ANNs used in this research work to predict the diffusivity and SEC is shown in . Input variable levels, boundaries, and levels of input parameters are shown in . In this study, the neural network toolbox using the 2017 version of MATLAB software was used to predict output variables. The 27 data patterns, achieved from various experimental data, were randomly divided into 19 (70%) and 8 (30%), which were used for training and testing the neural networks, respectively (Golpour et al., Citation2015; Kaveh et al., Citation2017). The input layer had three neurons (drying air velocity, air temperature, and infrared power) and the network output layer had one neuron (diffusivity or SEC). The number of neurons varied from 2 to 20 in both hidden layers.
Table 4. Input variables for artificial neural networks and their boundaries for the prediction of effective moisture diffusivity and specific energy consumption of white mulberry fruit
Figure 2. Artificial neural network topology for modeling effective moisture diffusivity or energy consumption of white mulberry fruit
A multilayer perceptron (MLP) neural network with different hidden layers (one and two) was trained and tested. MLP is a layered feed-forward back propagation (FFBP) and cascade-forward back-propagation (CFBP) network typically trained with static back propagation. Its main advantages are easiness to use and approximation of any input/output parameters.
In this study, the effect of several error minimization algorithms such as Bayesian regulation (BR) and Levenberg-Marquardt (LM) was examined on the performance of the ANN model. Different transfer functions, like the hyperbolic tangent sigmoid (TANSIG), the logarithmic sigmoid (LOGSIG), and linear (PURELIN), were used to assess the neuron output. After using appropriate learning algorithms and transfer functions, the effect of neuron number and training epochs on ANN performance were studied. To develop a statistical model, networks were trained three times and the best values were recorded for each parameter.
About 70% of the experimental data were separated for network training to find a suitable structure. The goodness of fit of the optimal ANN was based on coefficient of determination (), mean square error (
), and mean absolute error (
) for the tested models, as follows (Khazaei et al., Citation2013; Serrano et al., Citation2020):
where is the network output in
neuron and
pattern,
is the target output at
neuron and
pattern,
is the number of output neurons,
is the number of training patterns,
is the network output for
pattern, and
is the target output for
pattern. To increase the accuracy and processing velocity of network, input data were normalized at domain of [0, 1]. Data normalization has been done by application of the following equation (Serrano et al., Citation2020):
where Zr and Znorm define the measured and normalized values and also Zmin and Zmax represent the minimum and maximum values of the measured parameters, respectively.
Results and Discussion
RSM Modeling
The optimization of and
for dried white mulberry was based on maximizing
and minimizing
. In order to reduce the number of parameters to be tested, several parameters were previously evaluated in a wide range of values prior to RSM optimization (Bey et al., Citation2013). According to the results, a quadratic model was significant for obtaining the desired responses. The second-order polynomial equation was fitted to the experimental results obtained on the basis of a face-centered central composite design (FCCD).
Experimental Design
The final modified quadratic models for relation between responses ( and
) and input variables are given in Eqs. (11) and (12) in terms of coded factors:
where the values of parameters A, B, and C are defined in .
The equations aimed to determine the effect of individual variables or a combination of several variables over the responses. Positive coefficient values reveal the positive interaction of factors and the impact on combined convective with infrared drying process, whereas the negative coefficient values point to the detrimental and interfering effect of the parameters on overall drying. From Eq. (10), it is clear that all individual factors (A, B, C) had a positive effect on the response of . All the linear variables, except infrared power (C), had a positive relation with
whereas the SEC raised with increasing air temperature (A) and air velocity (B) levels. Therefore, infrared power had a negative effect on SEC, increasing energy consumption and, consequently, the cost.
Effective Moisture Diffusivity Response
The ANOVA results for different drying experiments are illustrated in . The p-value accounts for the significance of each coefficient describing the interactions between the independent variables. The lower the p-values, the more significant are the model terms. For p < .05 the model term is significant (Das et al., Citation2014), considering 95% confidence. According to the results obtained, air temperature (P < .0001), air velocity (P = .0109), and infrared power (P = .0038), all had significant effect on (). Also, the interaction of air temperature with air velocity and infrared power had a significant effect on
but the interaction of quadratic values of air velocity and air temperature had no significant effect on
(P > .05) ().
Table 5. Analysis of variance for the experimental results of effective moisture diffusivity
The model F-value was calculated as ratio of mean square regression and mean square residue. The ANOVA for shows an F-value of 17.71, which is significant according to the corresponding p-value (). Coefficient of determination (
) and adjusted R2 (adj-
) were calculated to check the adequacy and fitness of the model. According to the results presented in , for
the quadratic model with
was the best model. The adequacy and fitness of the models were tested by ANOVA, and the results showed that the equation adequately represented the real relation between a set of independent variables and the responses ( and ).
Table 6. Adequacy of the model for xxxx
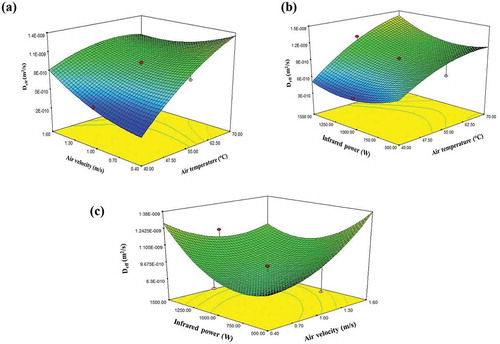
To visualize the combined effect of the two factors on the response, the response surface and contour plots were generated for each of the models in the function of two independent variables, while keeping the remaining independent variable at the central value ( a-c). illustrates the 3D surface of versus air temperature, air velocity, and infrared power. According to , it was observed that both air temperature and velocity simultaneously influenced
. With increasing air temperature, air velocity, and infrared power,
was increased. However, the effect of air temperature was more pronounced when compared with the other independent variables. Also, the effect of infrared power was more intense than that of air velocity. Increase in air temperature led to increasing the drying rate. Also, at the initial stage of the drying process, when the water vapor at the surface of the sample was more concentrated, increasing air velocity led to higher mass transfer between the surrounding air and the samples and, subsequently, an increase in
(Motevali and Tabatabaei, Citation2017). Similar results have been observed in drying of some agricultural products such as apple slices (Zhu et al., Citation2010), rough rice (Khir et al., Citation2011), soybean (Niamnuy et al., Citation2012), jujube (Chen et al., Citation2015), potato (Onwude et al., Citation2018). The increase in air temperature from 40°C to 70°C and air velocity from 0.4 to 1.6 m/s increased
to a maximum value of 1.77 × 10⁻⁹ m2/s.
Figure 3. Profile of response surface and contour plots showing the effect of different drying conditions on effective moisture diffusivity (a) air temperature (oC) and air velocity (m/s), (b) air temperature (oC) and infrared power (W), and (c) air velocity (m/s) and infrared power (W)
Specific Energy Consumption Response
ANOVA results for SEC are shown in . The model can be considered as statistically significant if the p-value is lower than 0.05 and the value of F is high. The model F-value of 16.28 together with the very low p-value (P < .0001) for the dependent variable implies that the model is significant.
Table 7. Analysis of variance for the experimental results of specific energy consumption
The coefficient estimates and the corresponding p-values suggest that, among the independent variables used in the study, the linear terms A (air temperature), B (air velocity), and C (infrared power) (P < .0001) had the greatest effect on the response variable (SEC). The interaction of air temperature with air velocity and interaction of air velocity with infrared power (P < .05), quadratic value of air temperature (P < .0001), quadratic values of air velocity, and quadratic values of infrared power, had a significant effect on . The statistical analysis gave a high significant level, confirming the goodness of fit of the model in case of the
(P < .0001). The contribution of the quadratic model was significant (P < .05) for the response of the dependent variable
(). The ANOVA analysis indicates a good model performance, with
= 0.9932 for
(). A high coefficient of determination indicates that the variables adequately fit the regression equation, which means that the empirical model well described the variations during drying. The use of an adjusted R2 (adj-
) aims to evaluate the model adequacy and fitness, by correcting the
value for the sample size as well as the number of terms in the model. The adj-
value (0.9870 for
) indicates a high fitting capacity of the model ().
Table 8. Adequacy of the model for xxxx
The best way of expressing the effect of any independent variable on the was to generate surface response plots of the model, which were done by varying two variables within the experimental range under investigation and holding the other variable at its central level (0 level). The effect of process parameters on SEC is shown in . Minimum
was recorded when the air temperature, air velocity, and infrared power were 40°C, 0.4 m/s, and 150 W, respectively, while the maximum was at 70°C, 1.6 m/s, and 500 W, respectively ().
Figure 4. Profile of response surface and contour plots showing the effect of different drying conditions on specific consumption energy (a) air temperature (oC) and air velocity (m/s), (b) air temperature (oC) and infrared power (W), and (c) air velocity (m/s) and infrared power (W)
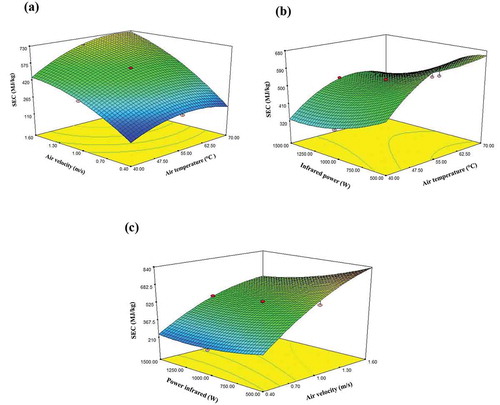
Both air temperature and velocity exhibit a positive linear effect on SEC, whereas the infrared power exerts a negative linear effect, as shown in . Hence, SEC decreased substantially with increase in infrared power ( b, c) and increased with increasing drying temperature and air velocity. Due to the reduction of water vapor in the surface of the samples, increase in drying rate, and subsequently decrease in drying time, the lowest SEC was obtained at the lowest air velocities. Similar results have been reported in drying shiitake mushroom (Kantrong et al., Citation2014) and apple (El-mesery and Mwithiga, Citation2015).
Optimization of Process Parameters
Optimum conditions for convective–infrared drying of mulberry were determined to obtain maximum and minimum
. Using the desirability function method, 20 solutions were obtained for the optimum covering indicators with a desirability value of 0.9670. Optimum values of process variables were: 0.4 m/s for air velocity, 70°C for air temperature, and 1464.57 W for infrared power. The values of
and SEC at these drying conditions were predicted as 1.77 × 10⁻⁹ m2/s and 166.55 MJ/kg, respectively. The positive effect of temperature on
leads to proposing high desirability. The study accomplished by Sharma and Prasad (Sharma and Prasad, Citation2006) proposed the maximum air temperature (70°C) for the optimization of microwave drying process of garlic. Also, the maximum air temperature was selected for the optimization of processing parameters of horse mackerel (Shi et al., Citation2008).
Artificial Neural Networks (Anns)
and summarize a list of the best neural network topology structures, threshold functions, and different applied algorithms in predicting and
. Most applied topologies and threshold functions have proper training errors. Therefore, ANN is suitable for modeling the drying of white mulberry. The main reason for ANN convergence might be the large amount of the input patterns.
Table 9. Best selected topologies including training algorithm, different layers, and neurons for prediction
Table 10. Best selected topologies including training algorithm, different layers, and neurons for prediction
Two strategies, which included similar and various threshold functions for all layers, were used to study the effect of different threshold functions on FFBP and CFBP outputs ( and ). These strategies, together with learning algorithms of LM and BR, were used for training the FFBP and CFBP networks. Various topologies were chosen as the best results from each network, training algorithm, and threshold functions.
and present the results of ANN modeling of and
variations during drying of white mulberry samples. The effects of hidden layer number and neuron number in each hidden layer on the precision of the predicting can be seen from the Tables. Among the applied networks for predicting
, the FFBP network with a topology of 3–20-20-1,
,
, TANSIG-TANSIG-TANSIG, and LM training algorithm at 30 training epochs had the best estimation with minimum MSE as shown in .
A similar finding has been reported for the fluidized drying of pomegranate seed cultivars, in which case the Deff was predicted using artificial neural network with R2 = 0.9972 (Amiri Chayjan et al., Citation2012). Also, Amiri Chayjan et al. (Citation2014) reported the best results for the FFBP neural network for Deff of sour cherry drying belonged to TANSIG threshold function with LM algorithm with in the first strategy. In another research work, the prediction of moisture ratio (MR) in drying of the mulberry fruit was done. The authors predicted the MR with a correlation coefficient (R2 = 0.9990) (Rad et al., Citation2018).
The results show that among the applied networks to predict the SEC the CFBP network with a topology of 3–10-10-1, ,
, TANSIG-PURELIN-TANSIG and LM training algorithm in 15 epochs had the best estimation with the minimum MSE (). These findings are in agreement with results reported by Kaveh et al. (Citation2018) for drying properties of pistachio nuts, squash, and cantaloupe seeds under fixed and fluidized bed using Cascade forward back-propagation network for predicting SEC with
at 60 training epochs.
compares for both variables and
the predicted values with the desired output values, using the optimal ANN, and shows the data points are banded around a 45° straight line, demonstrating the suitability of the selected static multilayer feed-forward ANNs for the infrared-convective drying of white mulberry. Therefore, it can be seen that the predicted energy consumption and
by applying the optimal topology of ANN are very close to those of experiment data.
Figure 5. Predicted values of effective moisture diffusivity () and specific energy consumption (
) using artificial neural networks versus experimental values for testing data set
The findings of this study reveal that the optimized ANN model can certainly replace the mathematically constitutive models in predicting the drying parameters of mulberry fruit because it takes passable efficiency of experimental data into account and automatically improves itself through learning. In addition, the ANN models have the capability to ameliorate their efficiency with results obtained from further new experiments, with or without new processing situations. This provides the gradual possibility of establishment of a singular powerful model which can be of premier significance in an automatic control system.
Conclusions
This study evaluated the performance of RSM and ANN methods for the optimization of drying parameters and the prediction of output variables ( and
) using the experimental data in the infrared-convective drying of white mulberry. Based on the profiles of response surface, drying at higher air temperature, velocity, and infrared power allowed obtaining higher values of
, whereas higher retention of SEC was found for drying at lower infrared power. The results indicated that the quadratic model could work well for the prediction of the two studied variables. Air temperature of 70°C, air velocity of 0.4 m/s, and infrared power of 1464.57 W were proposed as optimum independent variables. Optimum values of
and
were 1.77 × 10⁻⁹ m2/s and 166.554 MJ/kg, respectively, with a desirability of 0.9670. Taking into consideration the results from modeling analyses, it can be concluded that ANN and RSM models demonstrated reasonable performance in predicting
and
. The results further showed that the LM training algorithm of back-propagation with the minimum MSE was suitable for predicting the drying parameters. The values of the coefficient of determination were acceptable for both models (
for
and
for
).
Compliance with ethical requirements
This article does not contain any studies with human or animal subject.
Disclosure Statement
There are no conflicts to declare.
References
- Afolabi, T.J., T.Y. Tunde-akintunde, and J.A. Adeyanju. 2015. Mathematical modeling of drying kinetics of untreated and pretreated cocoyam slices. J. Food Sci. Technol. 52(5):2731–2740. doi: 10.1007/s13197-014-1365-z.
- Aghilinategh, N., S. Rafiee, S. Hosseinpour, M. Omid, and S.S. Mohtasebi. 2015. Optimization of intermittent microwave–convective drying using response surface methodology. Food Sci. Nutrition 3(4):331–341. doi: 10.1002/fsn3.224.
- Amiri Chayjan, R., M. Kaveh, N. Dibagar, and M.Z. Nejad. 2017. Optimization of pistachio nut drying in a fluidized bed dryer with microwave pretreatment applying response surface methodology. Chem. Prod. Process Model. 12(3). doi: 10.1515/cppm-2016-0048.
- Amiri Chayjan, R., M. Kaveh, and S. Khayati. 2014. Modeling some drying characteristics of sour cherry (Prunus cerasus L.) under infrared radiation using mathematical models and artificial neural networks. Agric. Eng. Int. 16(1):265–279.
- Amiri Chayjan, R., K. Salari, and H. Barikloo. 2012. Modelling moisture diffusivity of pomegranate seed cultivars under fixed, semi fluidized and fluidized bed using mathematical and neural network methods. Acta Sci. Polym. Technol. Aliment 11(2):137–49: 10. doi: 1515/cppm-2013-0009.
- Amiripour, M., M.B. Habibi-najafi, M. Mohebbi, and B. Emadi. 2015. Optimization of osmo-vacuum drying of pear (Pyrus communis L.) using response surface methodology. Food Measure 9(3):269–280. doi: 10.1007/s11694-015-9232-9.
- Bey, M.B., H. Louaileche, and S. Zemouri. 2013. Optimization of phenolic compound recovery and antioxidant activity of light and dark dried fig (Ficus carica L.) varieties. Food Sci Biotechnol. 22: 1613–1619. doi. 10.1007/s10068-013-0258-7.
- Changrue, V., V. Orsat, G.S.V. Raghavan, and D. Lyew. 2008. Effect of osmotic dehydration on the dielectric properties of carrots and strawberries. J. Food Eng. 88(2):280–286. doi: 10.1016/j.jfoodeng.2008.02.012.
- Chen, Q., J. Bi, X. Wu, J. Yi, L. Zhou, and Y. Zhou. 2015. Drying kinetics and quality attributes of jujube (Zizyphus jujuba Miller) slices dried by hot-air and short- and medium-wave infrared radiation. LWT - Food Sci Technol 64(2):759–766. doi: 10.1016/j.lwt.2015.06.071.
- Cruz, A.C., R.P.F. Guiné, and J.C. Gonçalves. 2015. Drying kinetics and product quality for convective drying of apples (cvs. Golden Delicious and Granny Smith). Int. J. Fruit Sci. 15(1):54–78. doi: 10.1080/15538362.2014.931166.
- Das, A., U. Raychaudhuri, and R. Chakraborty. 2014. Optimization of wheatgrass fortified steamed rice cake using response surface methodology. J Food Res Technol 2(2):24–30.
- Doymaz, I., S. Karasu, and M. Baslar. 2016. Effects of infrared heating on drying kinetics, antioxidant activity, phenolic content, and color of jujube fruit. Food Measure 10(2):283–291. doi: 10.1007/s11694-016-9305-4.
- El-mesery, H.S., and G. Mwithiga. 2015. Performance of a convective, infrared and combined infrared- convective heated conveyor-belt dryer. J. Food Sci. Technol. 52(5):2721–2730. doi: 10.1007/s13197-014-1347-1.
- Fan, H., S.Q. Shao, and C.Q. Tian. 2014. Performance investigation on a multi-unit heat pump for simultaneous temperature and humidity control. Appl. Energy 113(6):883–890. doi: 10.1016/j.apenergy.2013.08.043.
- Fealekari, M., and R. Amiri Chayjan. 2014. Optimization of convective drying process for Persian shallot using response surface method (RSM). Agric. Eng. Int CIGR J 16(2):157–166.
- Golpour, I., R. Amiri Chayjan, J. Amiri Parian, and J. Khazaei. 2015. Prediction of paddy moisture content during thin layer drying using machine vision and artificial neural networks. J. Agric. Sci. Technol. 17(2):287–298.
- Golpour, I., M.Z. Nejad, R.A. Chayjan, A.M. Nikbakht, R.P. Guiné, and M. Dowlati. 2017. Investigating shrinkage and moisture diffusivity of melon seed in a microwave assisted thin layer fluidized bed dryer. Food Measure 11(1):1–11. doi: 10.1007/s11694-016-9365-5.
- Guiné, R.P.F., S. Pinho, and M.J. Barroca. 2011. Study of the convective drying of pumpkin (Cucurbita maxima). Food Bioprod. Process 89(4):422–428. doi: 10.1016/j.fbp.2010.09.001.
- Hammouda, I., and D. Mihoubi. 2014. Comparative numerical study of kaolin clay with three drying methods: Convective, convective–microwave and convective infrared modes. Energy Conver. Manag.. 87:832–839. doi: 10.1016/j.enconman.2014.07.085.
- Huang, L., D. Wu, H. Jin, J. Zhang, Y. He, and C. Lou. 2011. Internal quality determination of fruit with bumpy surface using visible and near infrared spectroscopy and chemometrics: A case study with mulberry fruit. Biosystem Eng 109(4):377–384. doi: 10.1016/j.biosystemseng.2011.05.003.
- Kantrong, H., A. Tansakul, and G.S. Mittal. 2014. Drying characteristics and quality of shiitake mushroom undergoing microwave-vacuum drying and microwave-vacuum combined with infrared drying. J. Food Sci. Technol. 51(12):3594–3608. doi: 10.1007/s13197-012-0888-4.
- Kaveh, M., R. Amiri Chayjan, and A.M. Nikbakht. 2017. Mass transfer characteristics of eggplant slices during length of continuous band dryer. Heat Mass Transf 53(6):2045–2059. doi: 10.1007/s00231-016-1961-8.
- Kaveh, M., and R.A. Chayjan. 2015. Mathematical and neural network modeling of terebinth fruit under fluidized bed drying. Res Agric. Eng. 61(2):55–65. doi: 10.17221/56/2013-RAE.
- Kaveh, M., R.A. Chayjan, E. Taghinezhad, V.R. Sharabiani, and A. Motevali. 2020. Evaluation of specific energy consumption and GHG emissions for different drying methods (case study: Pistacia atlantica). J. Clean. Prod. 259:120963. doi: 10.1016/j.jclepro.2020.120963.
- Kaveh, M., V.R. Sharabiani, R. Amiri Chayjan, E. Taghinezhad, Y. Abbaspour-Gilandeh, and I. Golpour. 2018. ANFIS and ANNs model for prediction of moisture diffusivity and specific energy consumption potato, garlic and cantaloupe drying under convective hot air dryer. Inform Process Agric.. 5:372–387. doi: 10.1016/j.inpa.2018.05.003.
- Khazaei, N.B., T. Tavakoli, H. Ghassemian, M.H. Khoshtaghaza, and A. Banakar. 2013. Applied machine vision and artificial neural network for modeling and controlling of the grape drying process. Comput. Electron Agric.. 98:205–213. doi: 10.1016/j.compag.2013.08.010.
- Khir, R., Z. Pan, A. Salim, B.R. Hartsough, and S. Mohamed. 2011. Moisture diffusivity of rough rice under infrared radiation drying. LWT - Food Sci. Technol. 44(4):1126–1132. doi: 10.1016/j.lwt.2010.10.003.
- Liu, Y., Y. Sun, S. Miao, F. Li, and D. Luo. 2015. Drying characteristics of ultrasound assisted hot air drying of Flos Lonicerae. J. Food Sci. Technol. 52(8):4955–4964. doi: 10.1007/s13197-014-1612-3.
- Mota, C.L., C. Luciano, A. Dias, M.J. Barroca, and R.P.F. Guiné. 2010. Convective drying of onion: Kinetics and nutritional evaluation. Food Bioprod. Process 88(2–3):115–123. doi: 10.1016/j.fbp.2009.09.004.
- Motevali, A., and S.R. Tabatabaei. 2017. A comparison between pollutants and greenhouse gas emissions from operation of different dryers based on energy consumption of power plants. J. Clean. Prod. 154:455–461. doi: 10.1016/j.jclepro.2017.03.219.
- Niamnuy, C., M. Nachaisin, N. Poomsa-ad, and S. Devahastin. 2012. Kinetic modelling of drying and conversion/degradation of isoflavones during infrared drying of soybean. Food Chem. 133(3):946–952. doi: 10.1016/j.foodchem.2012.02.010.
- Omolola, A.O., P.F. Kapila, and H.M. Silungwe. 2018. Mathematical modeling of drying characteristics of Jew’s mallow (Corchorus olitorius) leaves. Inform. Process Agric. 6(1):109–115. doi: 10.1016/j.inpa.2018.08.003.
- Onwude, D.I., N. Hashim, K. Abdan, R. Janius, and G. Chen. 2018. Investigating the influence of novel drying methods on sweet potato (Ipomoea batatas L.): Kinetics, energy consumption, color, and microstructure. J. Food Process. Eng. 41(4):e12686. doi: 10.1111/jfpe.12686.
- Rad, S.J., M. Kaveh, V.R. Sharabiani, and E. Taghinezhad. 2018. Fuzzy logic, artificial neural network and mathematical model for prediction of white mulberry drying kinetics. Heat Mass Transfer 54(11):3361–3374. doi: 10.1007/s00231-018-2377-4.
- Salehi, F., and M. Kashaninejad. 2018b. Modeling of moisture loss kinetics and color changes in the surface of.lemon slice during the combined infrared-vacuum drying. Inform Process Agric. 5(4):516–523. doi: 10.1016/j.inpa.2018.05.006.
- Serrano, D., I. Golpour, and S. Sánchez-Delgado. 2020. Predicting the effect of bed materials in bubbling fluidized bed gasification using artificial neural networks (ANNs) modeling approach. Fuel. 266:117021. doi: 10.1016/j.fuel.2020.117021.
- Sharma, G.P., and P. Prasad. 2006. Optimization of process parameters for microwave drying of garlic cloves. J. Food Eng. 75(4):441–446. doi: 10.1016/j.jfoodeng.2005.04.029.
- Shi, Q.L., C.H. Xue, Y. Zhao, Z.J. Li, X.Y. Wang, and D.L. Luan. 2008. Optimization of processing parameters of horse mackerel (Trachurus japonicus) dried in a heat pump dehumidifier using response surface methodology. J Food Eng 87(1):74–81. doi: 10.1016/j.jfoodeng.2007.11.010.
- Silva, B.G.D., A.M.F. Fileti, and O.P. Taranto. 2015. Drying of Brazilian Pepper-Tree Fruits (Schinus terebinthifolius Raddi): Development of classical models and artificial neural network approach. Chem. Eng. Commun. 202(8):1089–1097. doi: 10.1080/00986445.2014.901220.
- Song, X., H. Hao, and Z. Baoling. 2016. Drying characteristics of chinese yam (Dioscorea opposita Thunb.) by far-infrared radiation and heat pump. J. Saudi Soc. Agric. Sci.17(3):290–296. doi: 10.1016/j.jssas.2016.05.008.
- Sumic, Z., A. Vakula, A. Tepic, J. Cakarevic, J. Vitas, and B. Pavlic. 2016. Modeling and optimization of red currants vacuum drying process by response surface methodology (RSM). Food Chem. 203:465–475. doi: 10.1016/j.jssas.2016.05.008.
- Taghinezhad, E., M. Kaveh, A. Jahanbakhshi, and I. Golpour. 2019. Use of artificial intelligence for the estimation of effective moisture diffusivity, specific energy consumption, color and shrinkage in quince drying. J. Food Process Eng e13358. doi: 10.1111/jfpe.13358.
- Vijayan, K., B. Saratchandra, and J.A.A. Silva. 2011. Germplasm conservation in mulberry (Morus spp.). Scientia Horticulturae 2011(128):371–379. doi: 10.1016/j.scienta.2010.11.012.
- Zhu, Y., Z. Pan, T.H. Mchugh, D.M. Barrett, M. Amiripour, M.B. Habibi-Najafi, M. Mohebbi, and B. Emadi. 2010. Processing and quality characteristics of apple slices processed under simultaneous infrared dry-blanching and dehydration with intermittent heating. J. Food Eng. 97(1):8–16. doi: 10.1016/j.jfoodeng.2009.07.021.