
 ?Mathematical formulae have been encoded as MathML and are displayed in this HTML version using MathJax in order to improve their display. Uncheck the box to turn MathJax off. This feature requires Javascript. Click on a formula to zoom.
ABSTRACT
This study is aimed at producing economical and high-quality phalsa diet squash (DSP) by partial or full replacement of sucrose with an equivalent sweetness from the safe artificial sweeteners, such as sucralose and saccharine. A zero-order, first-order, and second-order models were used to describe the kinetics degradation of vitamin C, toftal anthocyanin content, phenolic, and phosphorus contents, in addition to quality evaluation. The interaction between storage days and treatments of the samples showed significant differences. The titratable acidity decreased with the increase in pH and total soluble solids as the storage days increased. Phenolic contents, vitamin C, and phosphorus content decreased gradually during entire storage. The zero-order and second-order exhibited good fitting among the models for vitamin C and TAC, FRAP, TPC, and phosphorus, respectively, based on the statistical interpretation. Based on sensory evaluation, DSP4 (50% sucralose and 50% saccharine) was found the most acceptable by the panel as compared to other samples.
Introduction
Phalsa (Grewia asiatica L.) is a highly nutritious and medicinal yet underrated berry fruit crop of South Asia, especially in Pakistan. It is enriched with anthocyanins, tannins, phenols and flavonoids, iron, vitamin C & A, amino acids, potassium, and so on (Vyas et al., Citation2016). The consumption of this valuable fruit is reported to protect against several diseases like cancer, aging, fever, rheumatism, and diabetes. It is a short season fruit crop of summer and popular due to its pleasing sour and sweet taste, appealing color (red to dark purple), and consumed as whole fruit like other berry fruits without a need to remove the seeds and skin. Mature phalsa fruits are eaten fresh as a dessert or processed into ready-to-serve energy drinks that provide soothing taste and instant energy to cope with the hot weather that prevails in Pakistan. A major drawback to its marketing potential as a fresh fruit is its short postharvest storage life. The fruits are highly perishable, and hence the fresh fruits are only available in nearby regions of their cultivation and mainly converted into several by-products like juices, jams, squashes, chutneys, and so on to take long-term benefits of this nutritional fruit crop.
This fruit has an incredible potential to be utilized in value-added products, such as sugar-free phalsa squash to make this underrated fruit crop into a commercial fruit crop. These kinds of drinks are presumably the most perceived and globally accepted drinks (Pangotra et al., Citation2018). The consumption of diet beverages is increasing all over the world due to consumer preference. Consumers demand beverages that not only fulfill their thirst but also have some nutritional value (Abdullah and Cheng, Citation2001). In different studies, alternative sugars have been used in food industries to decrease the consumption of sucrose (Parpinello et al., Citation2001; Schulze et al., Citation2004). Non-nutritive sweeteners are nowadays used in food, beverages, and the pharmaceutical industry (Zygler et al., Citation2009). These sweeteners overcome the problems associated with nutritive sweeteners, such as obesity, cardiovascular, dental caries, and diabetes (Anderson, Citation1997; Sun and Empie, Citation2007). In Pakistan, utilization of non-nutritive sweeteners is not common yet being cost-effective. It can be useful in controlling diabetes and other related diseases. Safety issues and objectionable aftertaste may be the limitations of these non-nutritive sweeteners. Thus, using synthetic sweeteners completely or partially with sucrose is the best combination in keeping quality, reducing health problems and cost of diet production. There are a variety of non-nutritive sweeteners accessible in the market, including cyclamate, sucralose, stevia, saccharin, and aspartame, etc. These are artificial sweeteners that are not utilized by the body and do not contribute any calories to the diet. The consumption of artificial sweeteners could improve the dietary quality of people (Ahmed et al., Citation2008).
One of the major advantages of sucralose is its stability making it suitable for heat-processed food, low pH, and neutral products. The effect of storage was noted on cola drinks made with different sweeteners like sucrose (control), sucralose, aspartame, and blend of aspartame/acesulfame-K for a storage period of 6 months at 20℃ at pH 3 by Quinlan et al. (Citation1999).
Combined with all these facts, this study aimed to replace sucrose with artificial sweeteners for hot pasteurization of phalsa squash as a storage function. Changes in physicochemical, phenolic, and vitamin C were quantitatively focused as a module for storage time and treatments. Two steps have been taken in this regard: first, to describe the changes of different parameters quantitatively using kinetic modeling as a monitoring device on the quality changes during storage; and second, to explain the mutual importance of all quality parameters and sensory evaluation of the product.
Material and Methods
Standards, Chemicals, and Reagents
Folin-Ciocalteau phenol regent, ferric chloride (FeCl3.6H2O), and 2, 4, 6-tripyridyl-S-triazine (TPTZ) were purchased from Yuanye Biological Technology, Ltd. (Shanghai, China). Ascorbic acid, 2, 6 Dichlorophenol indophenols (dye) were purchased from Sigma Aldrich Co. (Shanghai, China). Absolute methanol, ethanol, and n-hexane were acquired from Fuyi Fine Co., Ltd (Tianjin). All other materials and solvents were of analytical grades unless otherwise indicated.
Fruit Material
Fully ripe fresh phalsa fruit (Grewia asiatica) was acquired from the phalsa orchard in Dera Ismail Khan, KPK, Pakistan. The fruit was brought to the food processing laboratory of Gomal University, Dera Ismail Khan, Khyber Pakhtunkhwa, Pakistan, where all the fruits were swilled with clean water to acquit them from dirt and dust. Apart from the basic analysis and storage experiments, the chemical analysis and kinetic modeling were performed at the Dept. of Food Engineering, Jiangsu University, Zhenjiang, China.
Squash Preparation and Preservation
The extraction of juice was done by using an electrical juicer. The control squash was prepared by mixing juice, water, and sweetener according to the standard 3:1:4 formula, whereas the treated samples were prepared on the sucrose “sweetness equivalency basis.” Product acidity was maintained by adding citric acid (1%) while sodium metabisulphite (0.1%) was added as a chemical preservative in all samples. The detail of treatments is given below (Symbol “Con” and “DSP” specifies as Control and Diet Squash Phalsa)
Control (CON) = 100% Sucrose
DSP1 = 100% Saccharine
DSP2 = 100% Sucralose
DSP3 = 50% Sucrose, 25% Saccharine 25% Sucralose
DSP4 = 50% Saccharine 50% Sucralose
All squash samples were filled in transparent 250 mL plastic bottles. The bottles were sealed with plastic caps. Squash samples were stored in normal daylight at room temperature (30 ± 2 oC) for 90 days. Physicochemical, phytochemicals analysis, and sensory analysis were performed after every 15 days.
Physicochemical Analysis
pH and titratable acidity (TA) were determined by AOAC (Citation2000). TSS was obtained using a hand refractometer (0–32, model no. 91706, Shibuya, and 28–62, models no. 8792, Fuji Koki LTD. Japan).
Phenolic Compound Analysis
Ascorbic Acid
Vitamin C was estimated as portrayed by Tseng et al. (Citation2008) with slight changes. 1 mL of sample was extricated with 10 mL of oxalic acid 1% (w/v) for 45 min at ambient temperature and then filtered. The filtrate (1 mL) was blended in with 9 mL of 2,6-dichloroindophenol and the absorbance was measured at 515 nm against a blank. Vitamin C was calculated using the L-ascorbic acid calibration curve and the results were presented as mg AA.100 mL−1.
Total Anthocyanins Content (TAC)
Anthocyanins were extracted according to the method depicted by Djermoune et al. (Citation2019). Briefly, 1 mL of sample was extricated with 1.0 mL methanol and 0.1 N HCl for 30 min and then extract emptied. Afterward, 20 μL of the extract was added to 980 μL methanol 0.1 N HCl, and anthocyanins absorbance was measured at 530 nm. The TAC is expressed as mg Quercetin equivalent per 100 g of the new weight (mg QR/100 mL−1).
Phosphorus Content (PC)
According to Dahdouh et al. (Citation2015), the PC content was measured after sample ignition by inductively coupled plasma atomic absorption technique (ICPAB).
Total Phenolic Content (TPC)
The TPC was measured by the method of Rashid et al. (Citation2019a). 1 mL was homogenized in 80% methanol for 1 min. The extract was filtered and then centrifuged at 3500 rpm for 15 min. Each extract (100 µl) was mixed with 1.58 ml of water, 100 µl of Folin-Ciocalteau’s reagent, and 300 µl of sodium carbonate solution (200 g/l) the mixture. The absorbance of the samples was assessed at 765 nm with a UV-spectrophotometer (Tu-1810; Universal Instrument Purkinje Co., Ltd., Beijing, China) using ascorbic acid as blank. The data were expressed as gallic acid equivalents in mg GAE. 100 mL−1.
Ferric Reducing Antioxidant Power (FRAP)
The FRAP scavenging assay was measured as depicted by Rashid et al. (Citation2019b). The FRAP reagent was freshly prepared from 0.3 mol L−1 acetate buffer (pH 3.6), 10 mmol L−1 2,4,6-tripyridyl-s-triazine (TPTZ), and 20 mmol L−1 FeCl3. Three solutions were mixed in the ratio of 10:1:1 (v/v/v). An aliquot of 1 ml of the extract solution (25 mg mL−1) was mixed with a 9 ml FRAP reagent. The absorption of the reaction mixture was measured at 593 nm after 30 min incubation at 37°C. The results of FRAP were presented as ascorbic acid equivalent antioxidant capacity g AEAC.100 mL−1.
Kinetic Approach
Three kinetics models, namely zero-order, first- and second-order, were used to evaluate key parameters to relate the degradations in the diet phalsa squash during the storage process and the models are expressed in EquationEq.22
2 –Equation4
4
4 .
where is the initial value at time zero,
is the value at time t,
are the kinetic parameters. The regression analysis was made possible by Origin-Pro 9.2 (Origin Lab Corporation, Northampton, MA, USA) and the efficiency of the model was examined using the coefficient of determination (R2), the root-mean-square error (RMSE), and the reduced chi-square (χ2) (Sarpong et al., Citation2019).
Sensory Evaluations
The sensory evaluation of diet phalsa squash was performed to evaluate the selected parameters including appearance, taste, flavor, aftertaste, and the overall acceptability by using a 9-point hedonic scale where 9 represents a highly desirable, while 1 represents an undesirable product. The samples were presented to 20 trained panel members between the ages of 20 and 45 using a completely randomized design (CRD). The appearance of each squash sample was presented in a 100 mL beaker while ready-to-drink squash samples were served in a 500 ml beaker for taste, flavor, and after-taste. Normal drinking water was used for oral rinsing after each sample.
Statistical Analysis
Statistical analysis was done for the entire data obtained from physicochemical and sensory evaluation by using the IBM SPSS ver 25.0 software package (SPSS Inc. USA). Two-factor ANOVA (DMR Test, significant p < .05) was applied to find out the significant difference between squash samples and storage period. Principal component analysis (PCA) was applied to analyze the relationship between squash samples and storage time regarding physicochemical parameters using SPSS ver 25.0 software package (SPSS Inc. USA).
Results and Discussion
Effect of Storage on Physicochemical of Phalsa Squash Formulation
The effect of using different ratios of sucrose, sucralose, and saccharine on the physicochemical composition of the produced phalsa squash are presented in . An increase in pH was noted in all samples, especially when treated with saccharine and sucralose (DSP1, DSP2, DSP3, and DSP4) showed a much increase in pH as compared to control (). Consequently, the increase in pH was statistically non-significant (P < .01) between treatments and storage days but the pH remains significant among treatments. This significant increase may be due to the ambient temperature gradient as stated by Rashid et al. (Citation2018) and Paracha et al. (Citation2009) in preparation of full caloric and low caloric guava squash for the storage period of 90 days. Moreover, the gradual increase in pH during the entire storage period could be due to the reduction of microbial load, which would produce organic acid from the sugar present in fruit (Vyas et al., Citation2016).
Figure 1. pH, TA, and TSS of the diet phalsa squash formulation during storage
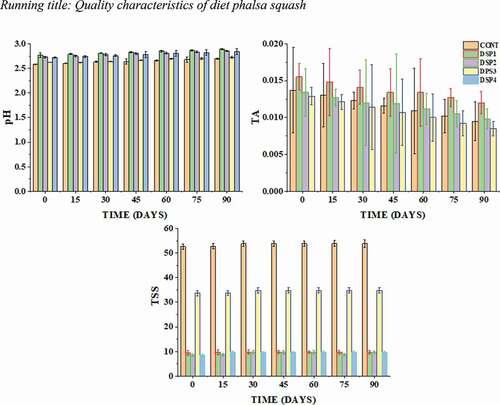
Acidity (tartness) plays a significant role in the acceptance of the product. Tartness gives a distinctive sourness to the product. The purpose of addition 1% citric acid was to maintain the characteristic flavor of phalsa squash. The data regarding titratable acidity of diet phalsa squash is presented in . Data showed that treated samples differ from control for the parameter of acidity. A declining trend was noted during the overall storage period. Interaction between storage days and treatments had a significant (P < .01) effect on acidity. The highest value was noted at zero-day in DSP1 (0.0155), followed by DSP2 (0.0134%), and gradually decreased to 90 days. The possible decrease in acidity may be due to the degradation of pectic acid which increases pH and reduces acidity (Saddozai et al., Citation2012). The decrease in acidity may also be due to the utilization of organic acidity which not only decreases acidity but also increases pH (Vyas et al., Citation2016). A similar trend was noted by Ahmed et al. (Citation2008) during the preparation of mandarin diet drinks.
In general, a gradual increase in TSS content was recorded in all treatments, including control (P > .05). The TSS increased from the initial level of 52.64 to 52.73 °Brix in the control sample. After 1 month of storage, the highest TSS in control was recorded at 52.81 °Brix which remains constant until 90 days storage period. Similarly, the sample (DSP3) treated with the combination sucrose, saccharine, and sucralose had lower TSS and shown a similar trend to control. Other treatments such as DSP1, DSP2, and DSP4 which were treated alone or with a combination of saccharine and sucralose showed much lower (oBrix) than control and DSP1. These readings presented a wide gap among the values of squash without sucrose and squash with sucrose. This is greatly influenced by the addition of sucrose into control and DSP1. Although the TSS increases gradually increase during storage, a non-significant relation was noted between treatments and storage and their interaction. The possible rise in TSS was due to the formation of pectic substances from protopectin and monosaccharides from disaccharides, i.e., degradation of sucrose into fructose and glucose, and possibly due to partial hydrolysis of complex carbohydrates into simple carbohydrates (Pangotra et al., Citation2018). A similar increase of TSS was reported by Pangotra et al. (Citation2018) and Prakash et al. (Citation2014) during the storage of phalsa-pear squash and phalsa squash, respectively.
Effect of Storage on Phenolic and Vitamin C Content in Phalsa Squash Formulation
Marginal variation in ascorbic acid content is observed in . Initially, the highest ascorbic acid content was recorded in DSP2 (4.96 mg AA.100 mL−1) and the lowest of 4.03 mg AA.100 mL−1 were recorded in control and DSP4. In this study, the levels of AA in treated and untreated squash decreased with increased storage time, the same as in all treatments (P < .01) decreased significantly. The treated samples contained 100% sucralose and saccharine has higher ascorbic acid than other samples. The decrease in ascorbic acid content was due to oxidation in plastic glass bottles, the formation of dehydroascorbic acid, exposure to light, and storage temperature. A similar decreasing trend of ascorbic acid content in storage was also reported by Rashid et al. (Citation2018) in guava diet squash, Pangotra et al. (Citation2018) in phalsa: pear blend squash, Prakash et al. (Citation2014) in phalsa squash and Ahmed et al. (Citation2008) in ready-to-serve RTS mandarin diet drink.
Figure 2. The phenolic and Vitamin C content of diet phalsa squash formulation during storage
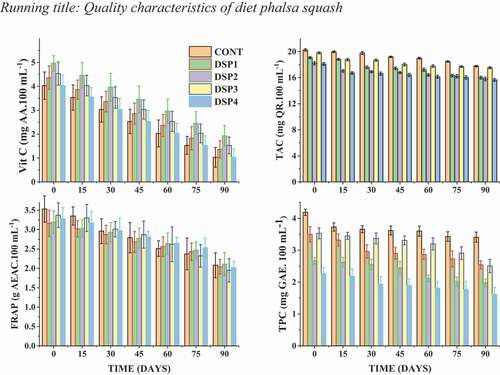
Anthocyanins are a group of phenolic compounds that exist in many fruits and vegetables in red and blue color and are beneficial to human health (García-Alonso et al., Citation2004). The concentration of anthocyanins in control and treated phalsa squash samples during storage is presented in , which reveals that all the samples had a non-significant (p > .05) decreasing increment in the total anthocyanins throughout the storage period, which shows the stability of the diet squash up to 3-month storage period. However, the interaction between treatments and storage was found to be significant. At a one-month storage period, control (sucrose) recorded the highest anthocyanin content of 19.77 mg QR/100 mL−1, followed by DSP1 (18.81 mg QR/100 mL−1). After 3 months of the storage period, the highest anthocyanin content was recorded in control (17.76 mg QR/100 mL−1) and DSP3 (17.53 mg QR/100 mL−1). The higher decrease in anthocyanins content was noted in samples DSP1 and DSP2 which were treated with 100% saccharin and sucralose, respectively. This loss in anthocyanin content is attributed to many factors, including tartness, pH, phenolic compounds, and sugar degradation products (Pangotra et al., Citation2018). These results are in line with Sharma (Citation2012) in a by-product of Jamun (Syzygium cumini L).
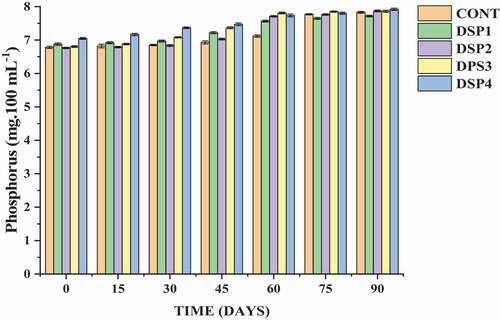
Figure 3. The phosphorus content of diet phalsa squash formulation during storage
The antioxidant capacity (AC) of fruits and vegetables depends on, to a large extent, many individual antioxidants or the combined effects of antioxidants (Rai et al., Citation2011). Many authors report that the antioxidant effect is mainly due to the radical scavenging activity of phenolic compounds (Rahman and Moon, Citation2007). AC of the control sample was noted to be highest at zero-day (3.53 g AEAC.100 mL−1), followed by DSP1 (3.37 g AEAC.100 mL−1) at 15 days and minimum in DSP4 (2.02 g AEAC.100 mL−1) at 90 days (). This trend showed that treated samples contain more bioactive ingredients, such as AA, TPC, and TAC in phalsa squash. The storage period led to a significant reduction in antioxidant activity between treatments (P < .01), while the interaction between storage days and treatment was not significant. It was observed that after 3 months of storage, the AC of DSP1 and DSP2 decreased from 3.16 to 2.04, 3.19 to 2.11, respectively. The decrease in AC may be associated with a decrease in ascorbic acid and phenolic compounds during storage (Klimczak et al., Citation2007). Similarly, antioxidant activity decreases during a long storage period, which may be attributed to the reduction of anthocyanins as the main phenolic compound that contributes to antioxidant activity.
Phenols in vegetables and fruits can have beneficial effects by removing free radicals (Chun et al., Citation2003). Thus, phenolic compounds can help protect cells from oxidative damage caused by free radicals (Wada and Ou, Citation2002). describes the changes in TPC as a function of treatment and storage time. For the treated and control squash sample, TPC decreased significantly (p < .05) gradually over the entire storage period. After the 30 days storage period, samples treated with saccharine and sucralose other than control exhibited higher TPC in DSP1 (3.37 mg GAE. 100 mL−1), followed by DSP2 (2.96 mg GAE. 100 mL−1) and DSP3 (2.55 mg.100 ml) which continued to reduce until 90 days. Incorporation of saccharine and sucralose in DSP1, DSP2, and DSP4 without sucrose retained better polyphenols that exerted minimal degradation retaining more bioactive compounds than control (sucrose) and DSP3 (sucrose, saccharine, and sucralose) (Mitra et al., Citation2013). The reduction in phenolic content may be attributed to the volatile nature of phenolic compounds that get easily oxidized (Kapoor and Ranote, Citation2016). The current results are in accordance with Kapoor and Ranote (Citation2016) who worked on Jamun powder supplemented pear juice.
Effect of Storage on Phosphorus Content in Phalsa Squash Formulation
After 90 days of the storage period, the highest content of phosphorus was recorded in DSP4 (7.05 mg.100 ml−1), followed by DSP1 (6.88 mg.100 ml−1), while the lowest was in DSP2 (6.76 mg.100 ml−1). A significant decrease (P < .01) was noted in the entire storage period, whereas the interaction between storage days and treatments was found to be non-significant. The decrease in phosphorus content may be attributed to room temperature and exposure to light. Our results are in accordance with Pangotra et al. (Citation2018) in the preparation of the phalsa-pear blended beverage. The current findings are supported by Vidhya and Narain (Citation2011) who reported the loss of phosphorus content to the extent of 5.81% and 10.7% in fruit bar in 90 days of storage period.
Kinetic Degradation of Phenolic Compound and Vitamin C in Phalsa Diet
Phalsa diet was stored for 90 days to evaluate the phenolic compounds and vitamin C degradation and the kinetics models are displayed in . Three kinetic models, namely zero-order, first-order, and second-order, were evaluated using three statistical parameters (R2 χ2 and RMSE) and the results are depicted in . In the case of vitamin C, the degradation kinetics followed the zero-order model as a result of the highest R2 (0.99991–1.000) and lowest χ2 (1.58 × 10⁻³¹-1.29 × 10⁻⁴) and RMSE (3.97 × 10⁻¹⁶-0.0113).
Table 1. Estimation of the model for phenolic compound and vitamin C degradation by examining the R2, χ2 and RMSE of zero-order, first-order, and second-order model
A similar observation was reported by (Sapei and Hwa, Citation2014) for vitamin C degradation kinetics in strawberry juices. Implications of this degradation reaction order revealed that vitamin C in the phalsa diet is expected not to vary at a specific storage time (Sarpong et al., Citation2019). This kind of degradative reaction is highly predictive and is equated to the rate constant (k), quite different from first-order and second-order reactions. This implies that vitamin C degradation will come to a halt after a period of storage when there is depletion of vitamin C in the diet.
The degradative rate constant of the vitamin C ranged −0.03333 – −0.03355 day−1 suggesting a little variation in the reaction rate for the various formulations of the phalsa diet squash. The negative figures observed signify that the concentration of the vitamin C in the phalsa diet squash decreases over storage time and the rate of decrease was highest in DPS3 (−0.03355) and lowest in CON (−0.03333). Sucrose is the additive in CON formulation and is efficient in retarding vitamin C degradation in the phalsa diet squash. A similar observation was made by (Sapei and Hwa, Citation2014) in fresh strawberry juices and reported that sugar addition retarded vitamin C degradation. This was attributed to a decrease in the concentration of dissolved oxygen which delayed oxidation reaction (Hsieh and Harris, Citation1993). In other words, sucrose is said to inhibit ascorbic acid oxidation which is a critical component for vitamin C degradation. However, the result from the DPS3 formulation revealed that the sucrose with other saccharides effects on vitamin C degradation could be antagonistic rather than synergistic.
The reaction order for the phenolic compounds including TAC, FRAP, TPC, and Phosphorus exhibited a second-order kinetic model, owing to the highest R2 and lowest χ2 and RMSE. From , all the models exhibited a significant difference (p < .05) in predicting the parameters and therefore could be used for future prediction of the phenolic compounds and phosphorus in the phalsa diet. However, the second-order exhibited good fitting among the models by the statistical parameters of the highest R2 in the range of 0.84715–0.95453, 0.89191–0.97970, 0.83473–0.96328, and 0.83687–0.93500 for TAC, FRAP, TPC, and phosphorus, respectively. Similarly, the lowest χ2 and RMSE were observed in the second-order model for TAC, FRAP, TPC, and phosphorus when compared with zero-order and first-order models. The explanation given to the second-order phenomena could mean that the TAC, FRAP, TPC, and phosphorus degraded linearly over storage at a rate proportional to the square of reactants (vitamin C) which could vary over time (Marie, Citation2020).
Table 2. The constants for zero-order and second-order model compound degradation
For TAC, the rate of degradation ranged from 7.83 × 10⁻⁵ to 1.13 × 10⁻⁴ per day depending on the formulation of the phalsa diet squash. The maximized degradation reaction was observed in DSP2 (1.13 × 10⁻⁴) whilst the minimized reaction was seen in DSP4 (7.83 × 10⁻⁵) which is attributed to the various formulations with statistically significant differences (p < .05) among the diet squash. A similar variation in the degradative rate was noted in FRAP, TPC, and Phosphorus contents in the phalsa diet squash. The DSP3 formulation recorded the highest degradation reaction in FRAP (−0.0024 day−1) and phosphorus (−2.76 × 10⁻⁴ day−1) whilst the DSP4 observed the highest reaction in TPC (0.00187 day−1) which is attributed to oxidative stabilities, that is in the presence (depending on the concentration) or absence of anti- and pro-oxidants in the diet (Farhoosh, Citation2018). In other words, the presence or absence of the anti- and pro-oxidants could determine the kinetic path of the degradation reaction in the diet squash which is significantly (p < .05) dependent on the saccharide’s presence in a formulation.
Statistical Interpretation of Key Parameters Degradation Mechanism
To statistically examine the key parameters of the degradation mechanism and simplify the complexity of the effect of physicochemical, phenolic and vitamin C on the various formulations of the phalsa diet squash, principal component analysis (PCA) was performed and is depicted in Supplementary Fig. S1. Observably, the total variance of the first two components is summed up to be 86.17%, quite a workable figure to explain the similarities and differences among clustered samples in the four groups. Again, based on Kaiser criterion (Kaiser, Citation1960) the eigenvalues of the first two components were 5.416 and 2.339, respectively, which are greater than one (>1) and statistically considered significant when compared with another component with lesser eigenvalues (<1).
From Fig. S1, DSP4 is in the first group of the negative side of PCA1 and the positive side of PCA2 that is strongly correlated with FRAP, MI, and PHOS (phosphorus content). Thus, changes in the nutrient content of DSP4 are highly dependent on these parameters, rather than on TPC, TA, Vit C, and others. The second group was portrayed by DSP2 and characterized by pH, TSS, and Vit C degradation mechanism. Hence, sucralose degradation led to increased pH of the DSP2 phalsa diet squash which affected vitamin C and TSS coherently. The third group composed of the positive and negative sides of PCA1 and PCA2, respectively, was characterized by TPC but did not exhibit any phalsa diet squash signifying the lower impact of TPC among the diets. This meant that various formulations including sucrose, saccharine, and sucralose in a diet could not alter the amount of TPC and, if it did, had a little effect. The last group consists of the positive side of PCA1 and PCA2 which is characterized by TAC and TA in the DSP1 and CON regions. In effect, sugar and saccharine could alter the TA and TAC in the phalsa diet than other saccharides present.
Effect of Storage on Sensory Evaluation of Diet Phalsa Squash
Variances were established among appearance, flavor, taste aftertaste, and overall acceptability ratings given by the judge’s panel for phalsa squash incorporated in non-nutritive sweeteners have been depicted in . On the preparation day, the maximum appearance score was noted in all treatments except DSP3. The treatments shared non-significant variations among each other. With the increase in the storage period, a slight decrease in the appearance of squash was observed. However, storage had a significant effect on the perception of diet phalsa squash. The loss in appearance was noted by a similar study by Rashid et al., (Citation2018) on the storage stability of guava squash. The highest values of flavor were noted in DSP1 (8.00), followed by DSP4 (7.66) and the control sample (7.33) on the zero days of storage interval. A significant difference was observed in the perception of squash at various storage levels. A significant (p < .05) reduction was noted in flavor during the entire storage period. The loss in flavor may be attributed to volatile compounds in squash. Similar findings were noted by Ahmed et al. (Citation2008) in the preparation of the RTS mandarin diet drink. In sensory studies, taste is a very important factor after appearance and flavor. Statistical analysis revealed a significant effect on storage days and treatments. The highest taste score was noted at zero-day in DSP4 (9.00), followed by control (8.66). Meanwhile, the lowest taste score was noted in DSP2 (4.33) which was treated by only 100% saccharine, while in combination, taste sensation was acceptable due to bitterness of single sweetener was masked by the blend of other sweeteners. During the storage period, a decline rate was noted in all treatments until 90 days. The difference and reduction in taste may be probably due to temperature, time and storage duration. Similar results were revealed by Jain et al. (Citation2003) on the sensory properties of orange drinks. The aftertaste is a very important parameter in a way to know the taste remaining in the mouth after eating or drinking. So, based on this, the treatment DSP4 which was the blend of two sweeteners (sucralose and saccharine) got a maximum score (8.66) at zero-day and remained stable with little reduction until 90 days because of no aftertaste. However, the treatment DSP2 which was treated with 100% saccharine got a lower score (4.33) from the judge’s panel which makes it not suitable for consumers. Similarly, all other treatments showed a declining trend during the whole storage period. Rashid et al., (Citation2018) revealed similar decline trend in aftertaste during storage studies of guava squash.
Figure 4. Sensory evaluations of diet phalsa squash
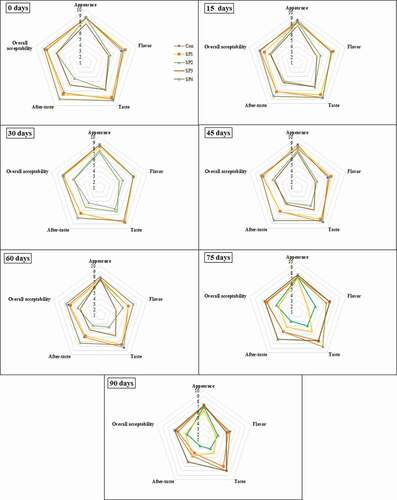
The overall acceptability of phalsa squash makes the products suitable for quality and for consumers as well. Therefore, based on this, maximum score for sensory characteristics was found in DSP4 (8.50) from a combination of sweeteners like sucralose and saccharine and the lowest was found in DSP2 (6.25). The declining trend in overall acceptability was the same as other parameters of sensory evaluation. The current findings revealed similar results as Barwal et al. (Citation2005) of the RTS dietetic bitter guard drink.
Conclusion
This research has resulted in the establishment of the best diet squash from artificial sweeteners (sucralose and saccharine) for commercial production of safe, high quality, and low-cost phalsa squash that meet consumer and market demand. Among all treatments, the combined treatment DSP4 was found to be better in retaining physicochemical, phenolic, and phosphorus contents. The overall acceptability scores were highest for the blended treatment DSP4 containing 50% of sucralose and saccharine. Appearance scores were highly significant for all treatments, including control, while taste and flavor retained better in DSP2, DSP3, and DSP4. The blending of sucralose and saccharine resulted in enhanced antioxidant activity, TAC, pH, and phosphorus content. During the storage period, all the physicochemical, phenolic, vitamin C and decreased significantly except pH, TAC, and phosphorus content. The degradation of vitamin C, TAC, FRAP, TPC, and PHOS was successfully described by zero-order and first-order kinetic models for all treatments. Conclusively, sucrose can be successfully replaced by blended sweeteners having improved physicochemical and phenolic characteristics of the subsequent drinks. Future possibilities lie in the use of dietary phalsa fruits in processed fruit products to increase nutrition and encourage the use of minor fruit crops.
Acknowledgments
The authors wish to express their deep gratitude and appreciation for the support obtained from the national high-tech research and development program of China (2013AA102203-02), the policy guidance program, research cooperation of Jiangsu (BY201072-03), and the social development program (General Project) of Jiangsu Project (BE2016779).
Declaration of Competing Interest
The authors confirm that they have no known competing financial interests or personal relationships that could have appeared to influence the work reported in this paper.
Additional information
Funding
References
- Abdullah, A., and T.C. Cheng. 2001. Optimization of reduced-calorie tropical mixed fruits jam. Food Qual Prefer 12(1):63–68. doi: https://doi.org/10.1016/S0950-3293(00)00030-6.
- Ahmed, M., A. Ahmad, Z.A. Chatha, and S.M.R. Dilshad. 2008. Studies on preparation of ready to serve mandarin (Citrus reticulata) diet drink. Pak. J. Agri. Sci. 45(4):470–476. Retrieved from: http://pakjas.com.pk/papers/140.pdf
- Anderson, G.H. 1997. Sugars and health: A review. Nutr. Res. 17(9):1485–1498. doi: https://doi.org/10.1016/S0271-5317(97)00139-5.
- AOAC. 2000. Official methods of analysis of AOAC International Assoc. Off. Anal. Chem. Int. Method ce. Assoc. Off.l Anal. Chem. Int. doi:https://doi.org/10.3109/15563657608988149
- Chun, O.K., D.O. Kim, and C.Y. Lee. 2003. Superoxide radical scavenging activity of the major polyphenols in fresh plums. J. Agric. Food Chem. 51(27):8067–8072. doi: https://doi.org/10.1021/jf034740d.
- Dahdouh, L., C. Wisniewski, A. Kapitan-Gnimdu, A. Servent, M. Dornier, and M. Delalonde. 2015. Identification of relevant physicochemical characteristics for predicting fruit juices filterability. Sep. Purif. Technol. 141:59–67. doi: https://doi.org/10.1016/j.seppur.2014.11.030.
- Djermoune, L.A., S. Bellili, L. Khenouce, F. Benmeziane, K. Madani, and L.B. Makhlouf. 2019. Effect of domestic cooking on physicochemical parameters, phytochemicals and antioxidant properties of Algerian tomato (Solanum Lycopersicum L. Var. Marmande). J. Food Technol. Res. 6(1):1–17. doi: https://doi.org/10.18488/journal.58.2019.61.1.17.
- Farhoosh, R. 2018. Reliable determination of the induction period and critical reverse micelle concentration of lipid hydroperoxides exploiting a model composed of pseudo-first and -second-order reaction kinetics. Lwt. 98:406–410. doi: https://doi.org/10.1016/j.lwt.2018.09.003.
- García-Alonso, M., G. Rimbach, J.C. Rivas-Gonzalo, and S. De Pascual-Teresa. 2004. Antioxidant and cellular activities of anthocyanins and their corresponding vitisins A - Studies in platelets, monocytes, and human endothelial cells. J. Agric. Food Chem. 52(11):3378–3384. doi: https://doi.org/10.1021/jf035360v.
- Hsieh, Y.H.P., and N.D. Harris. 1993. Effect of sucrose on oxygen uptake of ascorbic acid in a closed aqueous system. J. Agric. Food Chem. 41(2):259–262. doi: https://doi.org/10.1021/jf00026a023.
- Jain, S., S. Ap, A. Dashora, and A.K. Sankhla. 2003. Physiochemical and sensory properties of orange drink. J. Food Sci. Tech. India 40(6):656–659.
- Kaiser, H.F. 1960. The application of electronic computers to factor analysis. Educ Psychol Meas 20(1):141–151. doi: https://doi.org/10.1177/001316446002000116.
- Kapoor, S., and P.S. Ranote. 2016. Antioxidant components and physicochemical characteristics of Jamun powder supplemented pear juice. J. Food Sci. Technol. 53(5):2307–2316. doi: https://doi.org/10.1007/s13197-016-2196-x.
- Klimczak, I., M. Małecka, M. Szlachta, and A. Gliszczyńska-Świgło. 2007. Effect of storage on the content of polyphenols, vitamin C, and the antioxidant activity of orange juices. J. Food Compos. Anal. 20(3–4):313–322. doi: https://doi.org/10.1016/j.jfca.2006.02.012.
- Marie, H.A. 2020. What Is a Second Order Reaction in Chemistry? Retrieved from https://www.thoughtco.com/second-order-reaction-examples-609202
- Mitra, P., V. Meda, and R. Green. 2013. Effect of drying techniques on the retention of antioxidant activities of Saskatoon berries. Int.l J. Food Stud. October. 2:224–237. doi: https://doi.org/10.7455/ijfs/2.2.2013.a8.
- Pangotra, B., N. Gupta, J. Bandral, M. Sood, and J. Singh. 2018. Formulation and evaluation of phalsa-pear blended beverage. Pharm. Innov. J. 7(10):25–29. Retrieved from: http://www.thepharmajournal.com/archives/2018/vol7issue10/PartA/7-9-25-196.pdf
- Paracha, G.M.U., A.B. Khattak, C.M. Ashraf, Z. Alam, and A.W. Khalil. 2009. Development and storage stability of low caloric guava squash. Adv. Food Sci. 31(3):127–131. Retrieved from: https://www.cabdirect.org/cabdirect/abstract/20093252984
- Parpinello, G.P., A. Versari, M. Castellari, and S. Galassi. 2001. Stevioside as a replacement of sucrose in peach juice: Sensory evaluation. J Sens Stud 16(5):471–484. doi: https://doi.org/10.1111/j.1745-459X.2001.tb00314.x.
- Prakash, V., C. Ahirwar, and V. Prashad. 2014. Studies on preparation and preservation of beverages from Phalsa fruit (Grewia subinaequalis L.). Ann. Hortic. 7(1):92–96. Retrieved from: http://www.indianjournals.com/ijor.aspx?target=ijor:ah&volume=7&issue=1&article=018
- Quinlan, M., V. Mialon, and M. Everitt. 1999. Effect of storage on the flavors of cola drinks sweetened with different sweetener systems. World Rev Nutr Diet. 85:58–63. doi: https://doi.org/10.1159/000059703.
- Rahman, M.A.A., and S.S. Moon. 2007. Antioxidant polyphenol glycosides from the plant Draba nemorosa. Bull. Korean Chem. Soc. 28(5):827–831. doi: https://doi.org/10.5012/bkcs.2007.28.5.827.
- Rai, D.R., S. Chadha, M.P. Kaur, P. Jaiswal, and R.T. Patil. 2011. Biochemical, microbiological, and physiological changes in Jamun (Syzyium cumini L.) kept for long term storage under modified atmosphere packaging. J. Food Sci. Technol. 48(3):357–365. doi: https://doi.org/10.1007/s13197-011-0254-y.
- Rashid, M.T., M.M. Hashim, A. Wali, L. Guo, X. Jian, and H. Ma. 2018. Effect of storage on physicochemical, microbial analysis, and sensory characteristics of diet guava squash. J. Food Safety Food Qual. 69(1):19–25. doi:https://doi.org/10.2376/0003-925X-69-19.
- Rashid, M.T., A. Belščak-Cvitanović, S. Karača, H. Ma, and D. Komes. 2019a. Longan (Dimocarpus longan) and lychee (Litchi chinensis): Functional ingredients in chocolate pralines. J. Food Biochem. 43:10. doi: https://doi.org/10.1111/jfbc.12811.
- Rashid, M.T., H. Ma, M.A. Jatoi, A. Wali, H.S. El-Mesery, Z. Ali, and F. Sarpong. 2019b. Effect of infrared drying with multifrequency ultrasound pretreatments on the stability of phytochemical properties, antioxidant potential, and textural quality of dried sweet potatoes. J. Food Biochem. 43:4. doi: https://doi.org/10.1111/jfbc.12809.
- Saddozai, A.A., S. Raza, and S. Arshad. 2012. Microbial count and shelf life of strawberry juice. J. Agri. Res. 25:3. Retrieved from: http://www.pjar.org.pk/Issues/Vol28_2015No_4/j_63.pdf
- Sapei, L., and L. Hwa. 2014. Study on the kinetics of vitamin c degradation in fresh strawberry juices. Procedia Chem. 9:62–68. doi: https://doi.org/10.1016/j.proche.2014.05.008.
- Sarpong, F., H. Jiang, P. Oteng-Darko, C. Zhou, L.P. Amenorfe, A.T. Mustapha, and M.T. Rashid. 2019. The mitigating effect of relative humidity (RH) on 2-furoylmethyl-Amino acid formation. Lwt. 101:551–558. doi: https://doi.org/10.1016/j.lwt.2018.11.077.
- Schulze, M.B., J.A.E. Manson, D.S. Ludwig, G.A. Colditz, M.J. Stampfer, W.C. Willett, and F.B. Hu. 2004. Sugar-sweetened beverages, weight gain, and incidence of type 2 diabetes in young and middle-aged women. J. Am. Med. Assoc. 292(8):927–934. doi: https://doi.org/10.1001/jama.292.8.927.
- Sharma, D. 2012. Processing of Jamun (Syzygium cumini L.) into value-added products. Sher-e-Kashmir Univ. Agric. Sci. Technol., Jammu, India, PhD Dissertation
- Barwal, V.S., R. Sharma, and T.K. Singh. 2005. Development and evaluation of dietetic bitter gourd ready-to-serve. J. Food Sci. Technol. Mysore. 42(2):202-205. Retrieved from: https://www.researchgate.net/publication/286782422
- Sun, S.Z., and M.W. Empie. 2007. Lack of findings for the association between obesity risk and usual sugar-sweetened beverage consumption in adults - A primary analysis of databases of CSFII-1989-1991, CSFII-1994-1998, NHANES III, and combined NHANES 1999-2002. Food Chem. Toxicol. 45(8):1523–1536. doi: https://doi.org/10.1016/j.fct.2007.02.012.
- Tseng, Y.H., J.H. Yang, and J.L. Mau. 2008. Antioxidant properties of polysaccharides from Ganoderma tsugae. Food Chem. 107(2):732–738. doi: https://doi.org/10.1016/j.foodchem.2007.08.073.
- Vidhya, R., and A. Narain. 2011. Development of preserved products using underexploited fruit, wood apple (limonia acidissima). Am. J. Food Technol. 6(4):279–288. doi: https://doi.org/10.3923/ajft.2011.279.288.
- Vyas, P.B., V.R. Rao Tadapaneni, and V.R. Thakkar. 2016. Chemical elicitors improve the shelf life of phalsa (Grewia asiatica L.) by inducing antioxidants and controlling microbes. Fruits 71(5):307–317. doi: https://doi.org/10.1051/fruits/2016018.
- Wada, L., and B. Ou. 2002. Antioxidant activity and phenolic content of Oregon caneberries. J. Agric. Food Chem. 50(12):3495–3500. doi: https://doi.org/10.1021/jf011405l.
- Zygler, A., A. Wasik, and J. Namieśnik. 2009. Analytical methodologies for determination of artificial sweeteners in foodstuffs. TrAC - Trends Anal. Chem. 28(9):1082–1102. doi: https://doi.org/10.1016/j.trac.2009.06.008.