
ABSTRACT
SIN3, a transcriptional corepressor has been implicated in varied functions both as transcription activator and repressor. Recent studies associated Sin3 with the macroautophagic/autophagic process as a negative regulator of Atg8 and Atg32. Though the role of SIN3 in autophagy is being explored, little is known about the overall effect of SIN3 deletion on the survival of an organism. In this study using a Caenorhabditis elegans sin-3(tm1279);him-5(e1490) strain, we demonstrate that under in vivo conditions SIN-3 differentially modulates autophagy and lifespan. We provide evidence that the enhanced autophagy and decreased lifespan observed in sin-3 deletion mutants is dependent on ROS and intracellular oxidative stress. Inability of the mutant worms to maintain redox balance along with dysregulation of enzymatic antioxidants, depletion of GSH and NADP reserves and elevation of ROS markers compromises the longevity of the worms. It is possible that the enhanced autophagic process observed in sin-3(tm1279);him-5(e1490) worms is required to compensate for oxidative stress generated in these worms.
Abbreviations: cat: catalase; DCFDA: 2ʹ,7ʹ-dichlorodihydrofluoroscein diacetate; GSH: reduced glutathione; GSSG: oxidized glutathione; H2O2: hydrogen peroxide; HDAC: Histone deacetylase; HID: HDAC interacting domain; him-5: high incidence of males; HLH-30: Helix Loop Helix-30; HNE: 4-hydroxyl-2-noneal; LIPL: LIPase Like; MDA: malondialdehyde; NGM: nematode growth medium; PAH: paired amphipathic α-helix; PE: phosphatidylethanolamine; RFU: relative fluorescence unit; ROS: reactive oxygen species; sin-3/SIN3: yeast Switch Independent; SOD: superoxide dismutase; NADP: nicotinamide adenine dinucleotide phosphate; SQST-1: SeQueSTosome related-1; ATG: AuTophaGy related
Introduction
Spatial and temporal coordinated control of gene expression through orchestrated activation and repression of the genetic elements is the very basis, which determines cellular survival and fitness. Proteins with various functions such as recruitment, corepression and/or chromatin modification are involved in formation of chromatin remodeling complexes which in turn bring about the activation or silencing of genes [Citation1]. The SIN3-HDAC corepressor complex is one such multi-protein chromatin remodeling complex mediating gene repression through compaction of chromatin. SIN3 acts as a master transcriptional scaffolding agent and interacts with HDAC and other accessory proteins in the complex [Citation2]. Though Sin3/SIN3 has primarily been associated with gene repression [Citation3–Citation5], its association with transcription-activating complexes has been well documented [Citation6].
SIN3 is a large acidic protein, structurally similar to the helix-loop-helix dimerization domain of the MYC family of transcription factors and is conserved across the eukaryotic phyla. Sin3 protein has multiple paired amphipathic α-helix (PAH), involved in interaction with DNA binding transcription factors like HCFC1/HCF-1 [Citation7], Ume6 [Citation8,Citation9], and Mad1 [Citation10]. Studies have implicated Sin3 in various cellular processes involved in development, protein stability, cellular senescence, oncogenic transformations and cell survival [Citation11,Citation12], as well as in the regulation of metabolism [Citation13]. Profiling of Drosophila cell lines has shown regulation of several metabolic processes such as glucose metabolism, oxidative phosphorylation, mitochondrial biogenesis and protein synthesis by SIN3 [Citation5]. Studies in fly and yeast models point towards SIN3-mediated perturbations in the mitochondrial activity [Citation14], generation of oxidative stress and longevity [Citation15].
Longevity or lifespan of an organism is governed by factors such as oxidative stress, autophagy, dietary restrictions, accumulated DNA damage and disruption in protein homeostasis [Citation16–Citation18]. Reactive Oxygen species (ROS) are oxygen molecules containing highly reactive species that can cause genotoxic and physiological damage when produced in excess. Accumulated oxidative stress linked damage overwhelms the innate antioxidant defense mechanism, creating oxidizing conditions within the cell. Such cellular insults cause DNA damage, altered gene expression profiles, interference in the signaling cascades, lipid peroxidation and dysregulation of protein homeostasis [Citation19]. ROS, however, also act as a signaling molecule affecting different pathways [Citation20]. Studies have established ROS-mediated augmentation in cellular self defense mechanisms such as autophagy, enabling it to return to the homeostatic state. Autophagy is an evolutionarily conserved process by which a cell survives in multiple adverse conditions/stress through massive degradation of proteins and damaged organelles generating substantial amino acid reservoirs and thereby increasing resistance to such stimuli [Citation21]. Intriguingly, using various animal models, autophagy has been shown to promote longevity and delay in aging [Citation22].
A recent report indicates that the HDAC complex containing Sin3 and Rpd3 along with Ume6, acts as a negative regulator of expression of yeast Atg8 (whose mammalian orthologs include microtubule associated protein1 light chain 3 MAP1LC3/LC3), and that a similar mechanism is also present in mammalian cells [Citation23]. Atg8 covalently modifies phosphatidylethanolamine (PE) and forms Atg8–PE, which regulates autophagy by altering the size of the autophagosome, a double-membrane vesicle that carries the material to the vacuole/lysosome for degradation. The Sin3-Rpd3-Ume6 complex also regulates the expression of Atg32, a mitophagy indispensable protein, in Saccharomyces cerevisiae (Sc), fermentative yeast. During induction of mitophagy, Atg32 is phosphorylated, followed by interaction with Atg11, a scaffold protein for selective autophagy [Citation24].
Of the various eukaryotic systems available, Caenorhabditis elegans, a soil nematode, is an excellent model system for studying various biological phenomena including lifespan and autophagy. This is primarily due to its short lifespan, easy availability to genetic manipulation techniques and availability of a well-annotated genome.
The first report supporting the role of autophagy in extending lifespan originates from the observation that mutations in the insulin-like signaling pathway (daf-2/IGFR) causes enhanced autophagy and extends lifespan in C. elegans. The RNAi-mediated inactivation of autophagy genes, however, abolished the observed phenotypes [Citation25]. Subsequently, mutation in several genes such as eat-2/CHRNA7 (a model of dietary restriction) [Citation26], the TP53/TRP53 ortholog CEP-1 [Citation27], mutants with lowered mitochondrial respiration [Citation28], and PPP3/calcineurin [Citation29], show a positive correlation between autophagy and lifespan. Transgenic overexpression of sir-2.1/SIRT2 also leads to the extension of lifespan [Citation30] and induces autophagy in C. elegans [Citation31]. Furthermore, depletion of BEC-1/BECN1 suppresses both the induction of autophagy and longevity induced by SIR-2.1 in C. elegans [Citation32]. Various pharmacological manipulators that resulted in lifespan extension also modulated autophagic process through these factors. For example, rapamycin functions by inhibiting CRTC1/TORC1, and resveratrol is an indirect activator of SIR-2.1 [Citation31,Citation32], whereas spermidine administration alters the epigenetic deacetylation through modulation of histone acetyltransferases (HAT) and deregulating the autophagy genes [Citation33]. Several studies have shown positive regulation between autophagy and lifespan or cellular survival [Citation27,Citation34,Citation35]. However, sufficient evidence is documented establishing autophagy as a regulator of cell death in lung and microglial cells [Citation36–Citation38].
Despite several studies showing parallel modulation of autophagy and lifespan the common regulatory intermediates of the 2 pathways are poorly identified. SIN3 is an established transcription regulator and also interacts with HDAC and modulates ATG8 and ATG32 expression but its role in regulating longevity is not well understood [Citation24]. In the current study, we seek to understand the function of SIN3 and establish the role of its ortholog sin-3 in C. elegans. We further investigate the effect of sin-3 deletion on autophagy and lifespan in C. elegans under in vivo conditions. Based on our results, we assert that SIN-3 negatively regulates the autophagic process in C. elegans under in vivo conditions as a sin-3 deletion mutant (sin-3[tm1276]I;him-5[e1490]V, lacking both the PAH and HID domains), shows enhanced autophagic flux. Interestingly, sin-3(tm1276);him-5(e1490) worms exhibit decreased lifespan and this process was independent of autophagy. We further elucidate the mechanisms by which SIN-3 regulates autophagy and lifespan in C. elegans. Evidence is provided to establish the imperative role of ROS in decreasing lifespan while increasing autophagy.
Results
sin-3 in C. elegans shares homology with all the PAH domains of human SIN3
sin-3 is an essential gene conserved throughout the eukaryotic phylogeny. To determine the homology between the C. elegans SIN-3 and the mammalian counterpart, we carried out sequence alignment analysis. C. elegans SIN-3 is the only yeast SIN3 ortholog present in the nematode and shares 44% homology to the isoform B of human SIN3 protein (). The sequence alignment with both the SIN3A and SIN3B isoforms revealed that SIN-3 shares greater homology in the PAH and HID domain. The PAH domain of SIN-3 is also interesting as it shares homology with all the PAH domains of SIN3 to some extent (Table S1).
sin-3(tm1279);him-5(e1490) worms exhibit significant increase in autophagy but reduced lifespan
To investigate the SIN-3-dependent modulation of autophagy and lifespan we compared the levels of LGG-1/MAP1LC3B autophagic puncta in C. elegans DA2123 (adIs2122[Plgg-1::GFP::LGG-1;rol-6(su1006)]) strain, hereafter referred to as the GFP::LGG-1 strain, and the GFP::LGG-1 strain fed with bacteria expressing dsRNA against sin-3, using previously characterized GFP-tagged LGG-1 protein [Citation25,Citation39]. The observation of GFP::LGG-1 puncta was restricted to the seam cells and pharynx of L3 larvae to avoid increased level of endogenous autofluorescence in adult worms. Diffuse GFP::LGG-1 expression with a few puncta were observed in DA2123 GFP::LGG-1 worms fed with bacteria expressing L4440 vector (). However, enhanced GFP::LGG-1 autophagic puncta were observed in GFP::LGG-1 worms fed with bacteria expressing dsRNA against sin-3 (). This observation suggested a regulatory role of sin-3 in the autophagic process under in vivo conditions and is in agreement with recently reported negative regulation of autophagic process by the Ume6-Sin3-Rpd3 complex [Citation23,Citation24]. To further examine the effect of the SIN-3-mediated enhanced autophagic process on lifespan if any, we compared the lifespan of wild-type N2 worms with that of N2 worms fed with bacteria expressing dsRNA of the sin-3 gene. The lifespan of N2 worms fed with bacteria expressing dsRNA of the sin-3 gene was significantly reduced with mean and maximum lifespan of 10 and 14 days, respectively, as compared to 19 and 28 days in N2 worms (, P < 0.0001). The IGFR/daf-2(e1370) and FOXO/daf-16(mu86) mutant worms were used as positive and negative control for lifespan (data not shown). Intriguingly, these results indicate that transient knockdown of sin-3 leads to decreased nematode lifespan along with an observed increase in autophagy. Previous studies in Drosophila also suggest a critical role of SIN3 in aging [Citation15].
Figure 1. Homology between C. elegans SIN-3 and human SIN3A and SIN3B. Multiple sequence alignment showing homology between the different conserved domains of C. elegans SIN-3 and the human orthologs SIN3A and SIN3B isoforms. T-coffee multiple sequence alignment tool of EMBL-EBI was used (Red boxes depicts conserved sequences and yellow boxes depict similar sequences). a.a., amino acids.
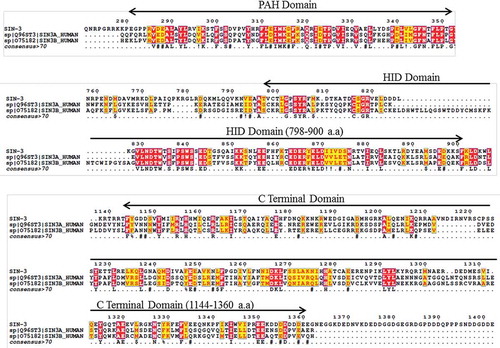
Figure 2. Transient knockdown of sin-3 leads to increased autophagy and reduced lifespan. Representative images of GFP::LGG-1 expression in the seam cells of L3 larvae (A) GFP::LGG-1 transgenic worms, (B) accumulation of GFP-positive puncta in GFP::LGG-1 transgenic worms fed on sin-3 RNAi at 1000X. (C) Quantification of GFP::LGG-1-positive puncta in seam cells of GFP::LGG-1 transgenic and sin-3 RNAi fed GFP::LGG-1 transgenic worms (D) Kaplan-Meier survival curve showing reduction in the lifespan of N2 worms fed on bacteria expressing dsRNAi against sin-3 (solid line depicts control vector L4440 fed and dotted line represents sin-3 RNAi fed N2 worms). The arrows show representative GFP-positive puncta that label phagophores and autophagosomal structures. *** P ≤ 0.0001, between vector alone and sin-3 RNAi fed GFP::LGG-1 transgenic worms. Scale: 500 µm. GFP::LGG-1 transgenic worms have genotype adIs2122[Plgg-1::GFP::LGG-1;rol-6(su1006)]. Twenty worms were analyzed per treatment and the experiment was repeated 3 times.
![Figure 2. Transient knockdown of sin-3 leads to increased autophagy and reduced lifespan. Representative images of GFP::LGG-1 expression in the seam cells of L3 larvae (A) GFP::LGG-1 transgenic worms, (B) accumulation of GFP-positive puncta in GFP::LGG-1 transgenic worms fed on sin-3 RNAi at 1000X. (C) Quantification of GFP::LGG-1-positive puncta in seam cells of GFP::LGG-1 transgenic and sin-3 RNAi fed GFP::LGG-1 transgenic worms (D) Kaplan-Meier survival curve showing reduction in the lifespan of N2 worms fed on bacteria expressing dsRNAi against sin-3 (solid line depicts control vector L4440 fed and dotted line represents sin-3 RNAi fed N2 worms). The arrows show representative GFP-positive puncta that label phagophores and autophagosomal structures. *** P ≤ 0.0001, between vector alone and sin-3 RNAi fed GFP::LGG-1 transgenic worms. Scale: 500 µm. GFP::LGG-1 transgenic worms have genotype adIs2122[Plgg-1::GFP::LGG-1;rol-6(su1006)]. Twenty worms were analyzed per treatment and the experiment was repeated 3 times.](/cms/asset/8f5b5fc0-3ff6-4b3f-b33c-23819a54fa88/kaup_a_1474312_f0002_oc.jpg)
Autophagy does not regulate lifespan in sin-3(tm1279);him-5(e1490) worms directly
Autophagy is the cell’s self-renewal machinery which by virtue of eliminating the damaged and unwanted organelles is considered to positively regulate longevity [Citation40]. To verify our observation and to further elucidate any correlation between reduction in lifespan of (sin-3(tm1276);him-5(e1490)) worms with a simultaneously enhanced autophagy, we investigated the effect of transiently knocking down 2 established autophagic genes, i.e. bec-1 (functioning in autophagic vesicle nucleation, ortholog of the yeast VPS30 gene) and ATG7/atg-7 (responsible for autophagosome expansion and completion, ortholog of the yeast ATG7 gene). The C. elegans strains sin-3(tm1276);him-5(e1490) and him-5(e1490), an isogenic strain were fed with bacteria expressing dsRNA against bec-1 and atg-7 and the lifespan of the 2 strains was determined. The mean lifespan of sin-3(tm1276);him-5(e1490) worms fed on empty vector L4440 was around 9 days, while that of worms treated with either bec-1 or atg-7 RNAi was 10 and 11 days respectively, implying no significant change in the lifespan (P = 0.829; ) before and after the treatment. The mean life span of the isogenic him-5(e1490) strain was 20 days when fed on bacteria expressing empty vector. RNAi treatments failed to induce any change in the lifespan of him-5(e1490) as the mean lifespan remained the same when the worms were treated with bec-1 RNAi (i.e. 20 days) or with atg-7 RNAi, (18 days; P = 0.13) (). The efficient reduction in the levels of autophagy was ensured by fluorescent microscopic analysis of the RNAi-treated worms (Figure S1). The effect of RNAi treatment was assayed in worms depleted only during adulthood i.e. after young adult stage.
Figure 3. Transient knockdown of sin-3 causes increased autophagic flux but no autophagy-dependent change in lifespan. Kaplan-Meier survival curve showing the lifespan of (A) him-5(e1490) worms and (B) sin-3(tm1279);him-5(e1490) worms fed either control bacteria or bacteria expressing bec-1 or atg-7 dsRNA. No significant difference is observed upon treatment. Representative images of SQST-1::GFP expression in the lateral intestine of (C) sqst-1::GFP;him-5(e1490)worms fed on bacteria expressing empty vector control (left panel) or bacteria expressing dsRNA against sin-3 (right panel) at young adult stage. (D) Quantification of SQST-1::GFP-positive puncta in the lateral intestine of worms fed either control or sin-3 RNAi expressing bacteria. ***P ≤ 0.001 for sin-3 RNAi treatments compared to control vector L4440. 20 worms were analyzed per condition and the experiment was repeated 3 times. Scale bar: 500 µm.
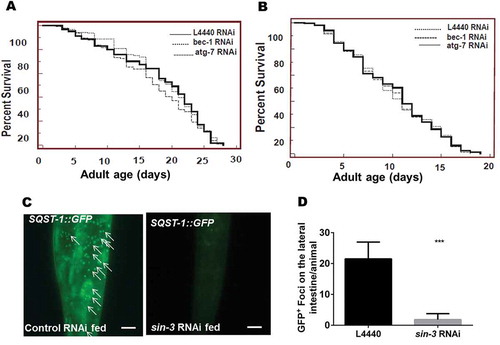
These observations prompted us to check, if sin-3(tm1276);him-5(e1490) worms had defect in autophagic process. Autophagic process is not just the formation of an autophagosome, but the fusion of the autophagosome so formed with the lysosome and the subsequent degradation of the autolysosome completes the process which is also known as autophagic flux [Citation41]. Changes in autophagic flux lead to obvious manifestation on the fitness and survival of an organism [Citation34]. SQST-1/SQSTM1/p62 is a well-known selective autophagic substrate and reduction in the levels of SQST-1 indicates productive autophagic flux. To that end, C. elegans transgenic strain expressing GFP tagged SQST-1, sqst-1::GFP;him-5(e1490) worms when fed on bacteria expressing dsRNA against sin-3 showed marked decline in the punctate appearance (1.8 ± 0.792 foci/animal) in the lateral intestine as compared to the worms fed on bacteria expressing empty vector L4440 as control (21.5 ± 2.23 foci/animal; ). Twenty animals per condition were analyzed, and the difference in the appearance of the GFP puncta was statistically significant with P = 0.0006. In agreement with the fluoroscence microscopy data when worm lysates were subjected to western blotting, a marked reduction in the expressed SQST-1::GFP protein was observed in sin-3 RNAi-treated sqst-1::GFP;him-5(e1490) worms as compared to that of controls thereby validating the change in autophagic flux (Figure S2A and B). To further ascertain if this increase in autophagy was TFEB/hlh-30-mediated, quantitative RT- PCR of hlh-30 in sin-3 RNAi-treated and untreated SQST-1::GFP worms was performed. The relative expression of hlh-30 was significantly higher in the sin-3 RNAi-treated worms (27.84 ± 1.08) as compared to control worms (7.51 ± 0.51; P = 0.0005) (Figure S2C). Elevated hlh-30 levels are reported to promote cell survival. Translocation of HLH-30 into the nucleus effects lysosomal lipolysis and hence longevity in C. elegans [Citation42]. However, in the sin-3 deletion mutant, although the mRNA expression level of hlh-30 was found to be elevated, we observed a reduction in lifespan.
In order to understand the dynamics better, and to elucidate the defect, if any, in the translocation of HLH-30 to the nucleus we performed an mRNA expression analysis. The HLH-30 transcription network is comprised of the Mondo/Max-like (MLX/MML-1 and MLXIP/MXL-2) complex for its assertion as a prolongevity factor [Citation43]. Nuclear localization of MML-1 regulates translocation and activation of the longevity-autophagy axis through HLH-30. Therefore, we evaluated mRNA expression levels of mml-1, mxl-2 and LIPA/lipl-4 lysosomal lipase whose transcription is HLH-30-mediated (Figure S2D). To our surprise, mRNA expression levels of mml-1 and lipl-4 were significantly downregulated in sin-3 RNAi-fed GFP::LGG-1 and GFP::SQST-1 worms as compared to those fed on vector control RNAi. However levels of mxl-2 did not show any significant difference between the 2 treatments (Figure S2D). On the basis of these experiments, it is plausible that although hlh-30 expression is upregulated due to severe ROS in the background of sin-3 deletion, the nuclear transport of HLH-30 is affected and lipolysis, which is the major pathway through which HLH-30 exerts its prolongevity phenotype, is compromised (as evident from levels of lipl-4 in sin-3[tm1276];him-5[e1490] worms). This could have in part, contributed to the fat accumulation in these sin-3;him-5 mutants as compared to wild-type and him-5 isogenic controls as depicted by Nile Red staining (Figure S3). These observations strongly support our contention that increased autophagy and lifespan are regulated in parallel by ROS in sin-3 mutants of C. elegans.
sin-3(tm1279);him-5(e1490) worms have high intracellular oxidative stress
In our attempt to search for mechanisms which could explain the above findings, we compared the differential expression of genes influenced by the redox state of the cells in sin-3(tm1279);him-5(e1490) double-mutant, him-5(e1490) and wild-type, N2 worms. The relative mRNA expression of HIF1A/hif-1 and BNIP3/dct-1 in sin-3(tm1279);him-5(e1490) worms was significantly higher while, the mRNA expression levels of hcf-1 were found to be significantly lower than that of wild-type and isogenic control (). Both hif-1 and dct-1 are positive regulators of reactive oxygen species (ROS) and are augmented when cells experiences oxidative stress [Citation44–Citation46]. HCF-1 in C. elegans is a structural-functional ortholog of mammalian HCFC1 (host cell factor C1) and negatively regulates FOXO/DAF-16 by binding to it [Citation47]. Because recent reports show that hcf-1 mutants have higher ROS resistance [Citation47,Citation48], we studied the extent of perturbation in the steady-state level of ROS in N2, him-5(e1490) and sin-3(tm1279);him-5(e1490) worms. Using the fluorescent dye 2ʹ,7ʹ-dichlorfluorescein-diacetate (DCFDA), we observed a 2-fold increase in fluorescence in sin-3(tm1279);him-5(e1490) worms with relative fluorescence units (RFU) of 1261.33 ± 102.34 as compared to that of him-5(e1490) worms having RFU of 606.31 ± 88.22 (). daf-16 and daf-2 mutant worms were also analyzed as positive and negative controls, respectively, for intracellular oxidative stress. sin-3(tm1279);him-5(e1490) worms displayed enhanced intracellular ROS as compared to daf-16 mutants, exhibiting a 17% increase in total fluorescence. daf-2, however, exhibited relative fluorescence of 678.6 ± 115 RFU which was comparable to that of N2 worms.
Figure 4. Expression of ROS-mediated genes and intracellular ROS is upregulated in sin-3;him-5 worms. (A) Quantitative RT-PCR was performed using cDNA prepared from N2, him-5(e1490) and sin-3(tm1279);him-5(e1490) worms as a template and primer pairs for the genes indicated along the X-axis. Fold change in the gene expression relative to him-5(e1490) isogenic control is indicated (ns, non-significant; **P < 0.05; ****P < 0.001 and denotes the comparison with respect to him-5(e1490); two-way ANOVA performed). (B) Relative fluorescence units as a measure of ROS were measured in N2 and various mutant worms as described in Materials and Methods, were measured with a microplate fluorescence reader Tecan M1000. (C) Relative fluorescence as compared to the control him-5(e1490). Where, N2: wild-type, sin-3;him-5: sin-3(tm1279);him-5(e1490) mutant, him-5(e1490): isogenic control, daf-16(mu86) and daf-2(e1370) are short lived and long lived mutants (ns, non-significant; **P < 0.05; ****P < 0.001 and denotes the comparison with respect to him-5 [e1490]; one way ANOVA performed).
![Figure 4. Expression of ROS-mediated genes and intracellular ROS is upregulated in sin-3;him-5 worms. (A) Quantitative RT-PCR was performed using cDNA prepared from N2, him-5(e1490) and sin-3(tm1279);him-5(e1490) worms as a template and primer pairs for the genes indicated along the X-axis. Fold change in the gene expression relative to him-5(e1490) isogenic control is indicated (ns, non-significant; **P < 0.05; ****P < 0.001 and denotes the comparison with respect to him-5(e1490); two-way ANOVA performed). (B) Relative fluorescence units as a measure of ROS were measured in N2 and various mutant worms as described in Materials and Methods, were measured with a microplate fluorescence reader Tecan M1000. (C) Relative fluorescence as compared to the control him-5(e1490). Where, N2: wild-type, sin-3;him-5: sin-3(tm1279);him-5(e1490) mutant, him-5(e1490): isogenic control, daf-16(mu86) and daf-2(e1370) are short lived and long lived mutants (ns, non-significant; **P < 0.05; ****P < 0.001 and denotes the comparison with respect to him-5 [e1490]; one way ANOVA performed).](/cms/asset/f57da6b4-b093-4f71-b547-e007214b2f86/kaup_a_1474312_f0004_b.gif)
Because these results strongly indicated an increased oxidative stress in sin3 mutant worms, we checked the ROS levels in these worms after growing them on NGM supplemented with vitamin C, an antioxidant. The RFU in sin-3(tm1279);him-5(e1490) worms, maintained on NGM plates supplemented with 10 mM vitamin C decreased to 160.81 ± 28.24 which was significantly lower than that of sin-3(tm1279);him-5(e1490) worms maintained on NGM plates without any supplementation () and Figure S4). The in vitro results were further confirmed by comparing DCFDA-stained worms under confocal microscopy wherein we observed substantial downregulation of ROS levels in the presence of 10 mM vitamin C (). Thus, together these results demonstrated the presence of high intracellular oxidative stress in sin-3(tm1279);him-5(e1490) worms which was restricted significantly by supplementation of vitamin C in the medium.
Increased oxidative stress in sin-3(tm1279);him-5(e1490) worms is due to altered activity of key stress managing factors
Once oxidative stress in the cell increases, various cellular factors and enzymes get differentially activated to bring back the steady state oxidative levels so as to inhibit further damage to the cell and to maintain cellular homeostasis. Superoxide dismutases (SODs) are the key players of cellular defense against superoxide ions (O2−.) converting them to H2O2 for further action by catalases, converting the released H2O2 to H2O and O2. For oxidative stress management, it is imperative for these defense mechanisms to work effectively and in tandem. C. elegans presents an interesting case here by expressing 5 sod genes as opposed to just 3 SOD genes (SOD1 [superoxide dismutase 1, soluble]), SOD2 [superoxide dismutase 2, mitochondrial] and SOD3 [superoxide dismutase 3, extracellular]) and 3 ctl/catalase genes as opposed to 2 (cytoplasmic and peroxisomal catalase) expressed in more complex eukaryotes [Citation49]. The elevated levels of sod have been reported to extend lifespan in Drosophila [Citation50,Citation51].
To ascertain the expression of various sod genes in sin-3(tm1279);him-5(e1490) worms we performed a real time qPCR assay. The expression levels of sod-1 were enhanced slightly whereas, the levels of sod-4 and sod-5 were significantly upregulated in sin-3(tm1279);him-5(e1490) worms (). Surprisingly, the levels of SOD-2/mitochondrial Mn-SOD did not show any apparent difference between the controls and sin-3 mutant worms. However, sod-3 showed an approximately 14-fold upregulation in the sin-3(tm1279);him-5(e1490) mutant (). Levels of all except sod-1 and sod-4 did not change significantly in daf-16 mutants. The level of sod-1 was significantly reduced while the expression levels of sod-4 were significantly upregulated in the daf-16 mutants. The relative expression levels of all sod genes invariably showed significant upregulation in the long-lived daf-2 mutant (), while no apparent difference in the relative expression of sod genes was observed between him-5(e1490) isogenic control and the wild-type, N2 worms.
Figure 5. Confocal images of in vivo DCFDA-stained worms. The fluorescence in the pharynx and overall body of the sin-3;him-5 mutant worm (B) is considerably higher than the wild-type N2 (A), him-5(e1490) isogenic control (D) and short lived mutant daf-16(mu86) (F) worms. The high intracellular fluorescence is restored to basal levels after the sin-3;him-5 worms (C) were grown on NGM plates supplemented with 10 mM vitamin C. No significant difference is observed between him-5(e1490) worms grown on NGM plates with (E) and without vitamin C supplementation (D). 20 worms per strain were photographed and the experiment was repeated 3 times. Images were taken at 200X; scale: 20 µm.
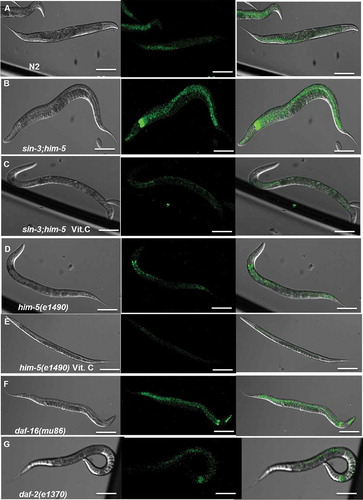
Figure 6. Expression of SOD genes and catalase activity is differentially altered in sin-3;him-5 worms. (A) Quantitative RT-PCR was performed using cDNA prepared from various worm strains indicated along X-axis as template and primer pairs for the genes indicated on top. Fold change in the gene expression w.r.t him-5(e1490) is indicated. (B) Enzymatic activity of catalase depicted as catalase activity in mKmg−1 and (C) catalase activity as percentage of control. N2, wild-type; sin-3;him-5, sin-3(tm1279);him-5(e1490) mutant; sin-3;him-5 Vit. C, sin-3(tm1279);him-5(e1490); him-5(e1490) Vit. C, him-5(e1490) worms maintained on NGM plates supplemented with 10 mM vitamin C. Other mutants are duly indicated on the graph (ns, non-significant; **P < 0.05; ****P < 0.001 and denotes the comparison with respect to him-5[e1490]; one way ANOVA performed, #P < 0.05 and denotes the comparison between sin-3;him-5 and vitamin C-supplemented sin-3;him-5 worms; Student’s paired t test performed).
![Figure 6. Expression of SOD genes and catalase activity is differentially altered in sin-3;him-5 worms. (A) Quantitative RT-PCR was performed using cDNA prepared from various worm strains indicated along X-axis as template and primer pairs for the genes indicated on top. Fold change in the gene expression w.r.t him-5(e1490) is indicated. (B) Enzymatic activity of catalase depicted as catalase activity in mKmg−1 and (C) catalase activity as percentage of control. N2, wild-type; sin-3;him-5, sin-3(tm1279);him-5(e1490) mutant; sin-3;him-5 Vit. C, sin-3(tm1279);him-5(e1490); him-5(e1490) Vit. C, him-5(e1490) worms maintained on NGM plates supplemented with 10 mM vitamin C. Other mutants are duly indicated on the graph (ns, non-significant; **P < 0.05; ****P < 0.001 and denotes the comparison with respect to him-5[e1490]; one way ANOVA performed, #P < 0.05 and denotes the comparison between sin-3;him-5 and vitamin C-supplemented sin-3;him-5 worms; Student’s paired t test performed).](/cms/asset/c9b5384a-9f8b-408a-83b6-50908b7aa677/kaup_a_1474312_f0006_b.gif)
Interestingly, when the sin-3(tm1279);him-5(e1490) worms were cultured on vitamin C-supplemented plates, the levels of sod-1 and sod-4 were downregulated and were now comparable to that of the isogenic control him-5(e1490). Though the relative levels of sod-3 and sod-5 were brought down after vitamin C supplementation, they still remained significantly higher than that of him-5(e1490) worms. When compared, there was significant difference observed in the expression levels of all sod genes except sod-1 between both sin-3(tm1279);him-5(e1490) and sin-3(tm1279);him-5(e1490) worms supplemented with 10 mM vitamin C (; P < 0.001).
The enzymatic activity of CTL/catalase in sin-3(tm1279);him-5(e1490) worms was 44.6 ± 2.63 mK mg−1 which was significantly lower (about 62% less) than the him-5(e1490) worms, and the activity was partially restored when mutant worms were grown on medium supplemented with vitamin C (). The catalase activity in daf-2(e1370) was significantly elevated, while that of daf-16(mu86) was observed to be significantly downregulated as compared to him-5(e1490) worms, being in concordance to the earlier reports [Citation52,Citation53]. To ascertain which type of catalase is differentially regulated, quantitative RT-PCR analysis of the cytoplasmic (ctl-1) and peroxisomal (ctl-2) catalase genes was performed in the various mutant and control worms. The relative expression levels of both ctl-1 and ctl-2 were significantly downregulated in the sin-3 mutant and were significantly restored after supplementation of vitamin C (Figure S3A and B). These results evinced that the expression and activity of superoxide dismutases and catalase is dysregulated in the sin-3(tm1279);him-5(e1490) worms and this contributes towards increased intracellular oxidative stress due to defect in the clearance of the oxidative free radicals.
SIN-3 regulates lipid peroxidation
Lipid peroxidation is the major manifestation of the damaging consequence of excessive intracellular ROS as it leads to the peroxidation of both mitochondrial as well as cellular membrane lipids. Malondialdehyde (MDA) and 4-hydroxyl-2-noneal (HNE) are the 2 prominent lipid peroxidation products [Citation54,Citation55]. The colored adduct formed as a result of a reaction of MDA with 1-methyl-2-phenylindole can be assayed spectrophotometrically [Citation56]. To study whether the increased ROS in sin-3(tm1279);him-5(e1490) resulted in increased lipid peroxidation, we examined the intracellular MDA levels in the age synchronized young adult worm extracts following a modified protocol by Siddique et al. [Citation56]. The MDA content in sin-3(tm1279);him-5(e1490) worms was 57.64 ± 1.39 µM as compared to him-5(e1490) which had an average MDA content of 25.40 ± 1.90 µM (). The amount of lipid peroxidation decreased to significant levels in sin-3(tm1279);him-5(e1490) worms (25.91 ± 2.51 µM) maintained on vitamin C-supplemented plates. The MDA content in short lived daf-16 mutants was 36.12 ± 2.06 µM while in long lived daf-2 mutants it was 24.95 ± 0.87 µM. The vitamin C supplementation did not affect the lipid peroxidation levels in him-5(e1490) and N2 where it was found to be 29.56 ± 0.74 µM and 23.01 ± 2.12 µM respectively. These results indicated pronounced increase in lipid peroxidation due to high accumulated ROS in sin-3(tm1279);him-5(e1490) worms.
Vitamin C supplementation improves the measure of glutathione and NADPH redox status in sin-3(tm1279);him-5(e1490) worms
Imbalance in the ratio of antioxidant to pro-oxidants in favor of latter leads to a mounting oxidative stress in the cell and alters the fluorescent and non-fluorescent decay of biological cofactors like NAD(P)H and GSH respectively. The pyridine nucleotide pools of nicotinamide adenine dinucleotide phosphate (NADP), are critical to the intracellular redox balance between the generation of reactive oxygen species (ROS) and their subsequent neutralization [Citation57]. NADP acts as an ‘electron carrier’, and ferries reducing equivalents between redox reactions taking place inside the cell. In its oxidised form, NADP+ molecules receive electrons by the addition of a hydride ion, producing the reduced form NADPH primarily in anabolic pathways [Citation58]. To counter the mounting oxidative stress, cellular machinery employs various enzymatic and non-enzymatic approaches. NADPH dependent maintenance of glutathione (GSH, γ-glu-cys-gly) is one of the major non-enzymatic actors in the cell which not only plays a vital role in scavenging reactive oxygen intermediates, but also is a potent metal chelator [Citation59] and signal transducer [Citation60]. A previous study by Barnes et al. [Citation15], shows that glutathione supplementation increased the paraquat tolerance in Sin3A mutant flies but no study has until now delved into the actual glutathione levels in SIN3-deficient conditions. We therefore, hypothesized that to have a distinct effect on aging the ratio of reduced to oxidized adenine dinucleotide phosphate (NADP:NADPH) and glutathione (GSH:GSSG ratio) must be compromised in C. elegans.
To that end, the age synchronized young adult worms were sonicated and the worm extract was processed for estimation of total NADP as well as NADP:NADPH ratio using a colorimetric estimation kit (Abcam, ab65349) and the GSH:GSSG ratio was determined as discussed by Rahman et al. [Citation61]. Total NADP pools was found to be significantly elevated only in the sin-3(tm1279);him-5(e1490) worms and the short lived daf-16(mu86) samples suggestive of a higher oxidative stress in both the strains (). Even the NADP:NADPH ratio was significantly altered in the 2 strains, depicting faster exhaution of reduced NADP pools as compared to other strains (). The total NADP pool in sin-3(tm1279);him-5(e1490) worms was 28.61 ± 0.61 pmole/mL of the extract, NADP:NADPH ratio was 2.42 ± 0.2, which was significantly higher (P < 0.0001) than that of the isogenic him-5(e1490) control. Since the NADP:NADPH pool was altered, we next proceeded to evaluate the disturbance in the GSH redox status if any. Indeed, the total glutathione levels in sin-3(tm1279);him-5(e1490) worms were 6.33 ± 0.95 nmole/mg showing a significant reduction of GSH (50%) as compared to that of him-5(e1490) worms where total GSH levels were 14.11 ± 0.95 nmole/mg (). To get a more accurate picture of glutathione redox status in the cell, the GSH:GSSG ratio was also measured. sin-3(tm1279);him-5(e1490)worms had a very low GSH:GSSG ratio signifying increased oxidation of the – SH group in glutathione. This reduction in GSH was ameliorated by 10 mM vitamin C supplementation in sin-3(tm1279);him-5(e1490) worms, which had a GSH:GSSG ratio of 19.6 ± 2.3 which was close to the ratio of 25.3 ± 2.6, 22.1 ± 1.9 and 19.41 ± 0.59 in long lived mutant worms daf-2, wild-type worms N2 and him-5(e1490) respectively (). These data suggest that SIN-3 has an important role in maintenance of NADPH and GSH redox pools by restricting the reactive oxygen intermediate imbalance. The perturbed glutathione equanimity is a hallmark of excessive stress in the absence of sin-3 in normal environment (sin-3(tm1279);him-5(e1490)) without the presence of any external oxidative challenge.
Figure 7. sin-3;him-5 worms have elevated lipid peroxidation levels. (A) Lipid peroxidation levels as measured through 2-phenyl, 2-vinylindole detection of malondialdehyde in various C. elegans strains. (B) Malondialdehyde concentration as percentage of control. N2, wild-type; sin-3;him-5: sin-3(tm1279);him-5(e1490) mutant; sin-3;him-5 Vit. C, sin-3(tm1279);him-5(e1490); him-5(e1490) Vit. C, him-5(e1490) worms maintained on NGM plates supplemented with 10 mM vitamin C. Other mutants are duly indicated on the graph (ns, non-significant; **P < 0.05; ****P < 0.001 and denotes the comparison with respect to him-5 [e1490]; one way ANOVA performed, #P < 0.001 and denotes the comparison between sin-3;him-5 and vitamin C-supplemented sin-3;him-5 worms; paired Student’s t test performed). All experiments were repeated 3 times.
![Figure 7. sin-3;him-5 worms have elevated lipid peroxidation levels. (A) Lipid peroxidation levels as measured through 2-phenyl, 2-vinylindole detection of malondialdehyde in various C. elegans strains. (B) Malondialdehyde concentration as percentage of control. N2, wild-type; sin-3;him-5: sin-3(tm1279);him-5(e1490) mutant; sin-3;him-5 Vit. C, sin-3(tm1279);him-5(e1490); him-5(e1490) Vit. C, him-5(e1490) worms maintained on NGM plates supplemented with 10 mM vitamin C. Other mutants are duly indicated on the graph (ns, non-significant; **P < 0.05; ****P < 0.001 and denotes the comparison with respect to him-5 [e1490]; one way ANOVA performed, #P < 0.001 and denotes the comparison between sin-3;him-5 and vitamin C-supplemented sin-3;him-5 worms; paired Student’s t test performed). All experiments were repeated 3 times.](/cms/asset/36137034-e2eb-414e-92d6-aaeefc728be4/kaup_a_1474312_f0007_b.gif)
Figure 8. Altered redox NADP and glutathione status in sin-3;him-5 worms. (A) Total NADP content in various C. elegans strains in pmole/ml of lysate. (B) Ratio of NADP:NADPH in various strains (C) Total glutathione content in various C. elegans strains in nmole/mg protein. (D) Ratio of GSH:GSSG in different strains. Where N2, wild-type; sin-3;him-5, sin-3(tm1279);him-5(e1490) mutant; sin-3;him-5 Vit. C, sin-3(tm1279);him-5(e1490); him-5(e1490) Vit. C, him-5(e1490) worms maintained on NGM plate supplemented with 10 mM vitamin C. Other mutants are duly indicated on the graph (ns, non-significant; **P < 0.05; ****P < 0.001 and denotes the comparison with respect to him-5[e1490]; one way ANOVA performed, #P < 0.001 and denotes the comparison between sin-3;him-5 and vitamin C-supplemented sin-3;him-5 worms; paired Student’s t test performed). Each experiment was repeated 3 times.
![Figure 8. Altered redox NADP and glutathione status in sin-3;him-5 worms. (A) Total NADP content in various C. elegans strains in pmole/ml of lysate. (B) Ratio of NADP:NADPH in various strains (C) Total glutathione content in various C. elegans strains in nmole/mg protein. (D) Ratio of GSH:GSSG in different strains. Where N2, wild-type; sin-3;him-5, sin-3(tm1279);him-5(e1490) mutant; sin-3;him-5 Vit. C, sin-3(tm1279);him-5(e1490); him-5(e1490) Vit. C, him-5(e1490) worms maintained on NGM plate supplemented with 10 mM vitamin C. Other mutants are duly indicated on the graph (ns, non-significant; **P < 0.05; ****P < 0.001 and denotes the comparison with respect to him-5[e1490]; one way ANOVA performed, #P < 0.001 and denotes the comparison between sin-3;him-5 and vitamin C-supplemented sin-3;him-5 worms; paired Student’s t test performed). Each experiment was repeated 3 times.](/cms/asset/86e6037d-483f-45b2-a0a8-85dd41304146/kaup_a_1474312_f0008_b.gif)
Altered autophagy and lifespan are dependent on ROS in sin-3(tm1279);him-5(e1490) worms
For oxidative stress to have a far-reaching effect on longevity of an organism, it needs to simultaneously effect multiple pathways which all together might have a synergistic or cooperative effect manifesting itself in an organism’s fitness and longevity. Oxidative insults cannot augur the lifespan of an organism by virtue of being inclined towards pro-oxidants in the oxidative flux. Apart from ROS, autophagy is the second most studied pathway that affects the lifespan of an organism, and is induced by ROS. Altered autophagy has also been long associated with various health pathologies [Citation62,Citation63]. We further asked if the antioxidative capacity of vitamin C can modulate autophagy and/or lifespan in sin-3(tm1279);him-5(e1490) worms. To study this, the age synchronized wild-type, him-5(e1490) and sin-3(tm1279);him-5(e1490) worms were maintained on vitamin C-supplemented NGM for 3 generations, and then their lifespan was compared (). sin-3(tm1279);him-5(e1490) worms maintained on vitamin C-supplemented NGM plates showed an increase in mean and maximum lifespan of 16 and 20 days, when compared to the mean and maximum life span of 10 and 14 days in sin-3(tm1279);him-5(e1490) worms maintained on regular NGM plates (, P < 0.0001). However, vitamin C supplementation had insignificant effect on the lifespan of him-5(e1490) isogenic worms ().
Figure 9. Altered lifespan and autophagy are rescued by supplementation of vitamin C in the background of sin-3 deletion. Kaplan-Meier survival curve showing the lifespan of (A) him-5(e1490) (solid line), him-5 (e1490) isogenic control worms maintained on NGM plates supplemented with vitamin C (dotted line); (B) sin-3(tm1279);him-5(e1490) (solid line), sin-3(tm1279);him-5(e1490) worms maintained on NGM plates supplemented with vitamin C (dotted line). (*P ≤ 0.0001, between sin-3(tm1279);him-5(e1490) worms maintained on normal NGM plates or NGM plates containing 10 mM vitamin C. (C) Representative images of GFP::LGG-1 expression in the intestine of L3 larvae in adIs2122(Plgg-1::GFP::LGG-1;rol-6[su1006]) (denoted as GFP::LGG-1) worms fed on bacteria expressing dsRNA against sin-3 grown either on normal NGM plates (left panel) or (D) NGM plates containing 10 mM vitamin C (right panel). (E) Relative mRNA expression levels of atf-5 in GFP::LGG-1 and (F) GFP::SQST-1 transgenic worms when grown on either NGM or NGM plates supplemented with 10 mM vitamin C and fed either bacteria expressing sin-3 RNAi or control vector. (G) Levels of GFP protein tagged with LGG-1 and the lipidated GFP::LGG-1-PE in worms fed on bacteria expressing control RNAi and sin-3 RNAi and grown either on NGM or NGM supplemented with 10 mM vitamin C were examined by western blot. Actin was used as loading control. (H) Densitometric quantification of the band intensity using ImageJ software. (****P < 0.0001, one-way ANOVA performed). Images were acquired at 1000X, 20 animals per treatment were visualized and the experiment was repeated 3 times. Scale: 500 µm.
![Figure 9. Altered lifespan and autophagy are rescued by supplementation of vitamin C in the background of sin-3 deletion. Kaplan-Meier survival curve showing the lifespan of (A) him-5(e1490) (solid line), him-5 (e1490) isogenic control worms maintained on NGM plates supplemented with vitamin C (dotted line); (B) sin-3(tm1279);him-5(e1490) (solid line), sin-3(tm1279);him-5(e1490) worms maintained on NGM plates supplemented with vitamin C (dotted line). (*P ≤ 0.0001, between sin-3(tm1279);him-5(e1490) worms maintained on normal NGM plates or NGM plates containing 10 mM vitamin C. (C) Representative images of GFP::LGG-1 expression in the intestine of L3 larvae in adIs2122(Plgg-1::GFP::LGG-1;rol-6[su1006]) (denoted as GFP::LGG-1) worms fed on bacteria expressing dsRNA against sin-3 grown either on normal NGM plates (left panel) or (D) NGM plates containing 10 mM vitamin C (right panel). (E) Relative mRNA expression levels of atf-5 in GFP::LGG-1 and (F) GFP::SQST-1 transgenic worms when grown on either NGM or NGM plates supplemented with 10 mM vitamin C and fed either bacteria expressing sin-3 RNAi or control vector. (G) Levels of GFP protein tagged with LGG-1 and the lipidated GFP::LGG-1-PE in worms fed on bacteria expressing control RNAi and sin-3 RNAi and grown either on NGM or NGM supplemented with 10 mM vitamin C were examined by western blot. Actin was used as loading control. (H) Densitometric quantification of the band intensity using ImageJ software. (****P < 0.0001, one-way ANOVA performed). Images were acquired at 1000X, 20 animals per treatment were visualized and the experiment was repeated 3 times. Scale: 500 µm.](/cms/asset/b505f2b3-001c-4709-ac08-d0a744cccaca/kaup_a_1474312_f0009_oc.jpg)
The GFP::LGG-1 autophagic puncta in GFP::LGG-1 transgenic worms fed on bacteria expressing dsRNA against sin-3 grown either on normal NGM plates or 10 mM vitamin C-supplemented plates were also visualized under a fluorescence microscope. Corroborating our hypothesis, the increased autophagic puncta observed in GFP::LGG-1 transgenic worms ( and ) were abolished in worms grown on vitamin C-supplemented media and fed on bacteria expressing dsRNAi against sin-3 (). This induction in autophagy was further evaluated for autophagic flux by quantifying the level of GFP::LGG-1 and the lipidated GFP::LGG-1-PE. Corroborating the microscopy data, the lipidated GFP::LGG-1-PE levels were significantly reduced in sin-3 RNAi-treated worms when grown on plates supplemented with 10 mM vitamin C (). hlh-30 mRNA expression was also quantified using quantitative RT-PCR and the levels of hlh-30 were significantly altered in GFP::LGG-1 transgenic worms fed on bacteria expressing dsRNA against sin-3 on plates supplemented with and without vitamin C (Figure S5). Because upregulation of hlh-30 did not show any effect on longevity or any direct association of autophagy to lifespan (), we asked if any other pathway is at play. In order to establish the relationship between autophagy, lifespan and effect of ROS on both, we performed qRT-PCR analysis. The mRNA gene expression levels of atf-5/ATF4 was significantly upregulated in both GFP::LGG-1 and GFP::SQST-1 worms when fed on bacteria expressing dsRNAi against sin-3(tm1279) as compared to the control RNAi. Supplementation with 10 mM vitamin C intriguingly brought down the elevated atf-5 levels to the basal levels (). This indicated that high intracellular ROS triggered upregulation of atf-5. ATF4 is the key transcriptional signal for autophagy induced by ROS and also acts as a switch between autophagy and apoptosis by subsequent upregulation of DDIT3/CHOP (DNA damage induceible transcript 3) [Citation64]. No ortholog of DDIT3 has been reported in C. elegans. Therefore the ATF-5-mediated pathway could be the plausible link between autophagy, ROS and reduction in lifespan, which is further aggravated by systemic collapse in the antioxidant machinery of the cell. Further work in this regard to completely delineate the pathway needs to be undertaken. These results strongly point in the direction of ROS as the common intermediate leading to decreased lifespan and enhanced autophagy in sin-3 mutant worms. We therefore conclude that increased autophagy due to ROS is insufficient to balance the effect of oxidative stress on lifespan in sin-3(tm1279);him-5(e1490) worms.
Discussion
In the present study, we demonstrate that SIN-3 regulates overall oxidative stress through differential regulation of various stress regulatory genes, enzymatic facilitators and cofactors in C. elegans. We also observed ROS facilitates augmentation in autophagic flux which is restored to basal levels with supplementation of antioxidant vitamin C. The novelty of the study lies in establishing SIN-3-dependent altered ROS as a source for reduced lifespan and enhanced autophagy.
One of the primary tests we performed was the determination of the homology between the C. elegans SIN-3 and the human isoforms of SIN3A and SIN3B. Since, it is innocuous to interpret the functional similarity between the orthologs rather than the paralogs [Citation65], it is essential to be able to identify and differentiate between orthologs and extra-paralogs residing in different species as orthologs retain their original functions [Citation66]. In concordance with this view, BLASTp as well as local sequence alignment analysis support that C. elegans SIN-3 is the orthologous predecessor to the human SIN3A and SIN3B paralogs. Earlier study on SIN-3 in C. elegans by Choy et al. [Citation67] indicated the homology between C. elegans SIN-3 and mouse SIN3B. Adding to this result we show that it shares homology to both human SIN3A and SIN3B and hypothesize that the proteins and transcription factors binding to PAH domains of mammalian system might as well bind to SIN-3 PAH. The homology shared between the PAH domain of the nematode SIN-3 and SIN3A and SIN3B provides an insight that the human SIN3A and SIN3B are probably a result of gene duplication during the course of evolution. Further studies are required to understand the neo-functionalization or sub-functionalization that might have ensued as a result of a speciation event causing divergent evolution [Citation68].
Additionally, sin-3(tm1279);him-5(e1490) worms had significantly reduced lifespan as compared to the wild-type control (). Studies in Drosophila also ascertain the role of ubiquitous depletion of SIN3A in longevity [Citation15]. Consistent with the reports establishing the role of Sin3-Ume6-Rpd3 complex in regulation of autophagosome size [Citation23] and mitophagy [Citation24], we observed augmented autophagic flux in sin-3 mutant worms due to inherent oxidative stress (Figure S2; 9G and H). The probable route of activation of autophagy in sin-3(tm1279);him-5(e1490) worms under oxidative stress could be through ATF-5 [Citation69] and/or HIF-1 and DCT-1 [Citation70]. The expression of the bZip family transcription factor ATF4 (activating transcription factor 4) is induced by glutathione depletion where it localizes to the promoter of a putative death gene in neurons [Citation69]. The EIF2A/eIF2α-ATF4 pathway has been established to direct an autophagy gene transcriptional program in response to oxidative stress [Citation64,Citation71]. Consistent with these findings we observed elevated mRNA expression levels of atf-5 in the sin-3 RNAi-treated worms (). ATF4 upregulation has been further reported to stabilize the HIF1A protein under oxidative stress [Citation72]. Under oxidative stress HIF1A is overexpressed and stabilized which in turn promotes the expression of its target genes such as BNIP3 which in turn competes with BCL2 to release BECN1 and induce autophagy [Citation44,Citation45]. The ATF4-DDIT3 pathway also acts as a switch between autophagy and apoptosis; however, because C. elegans lacks a well-defined DDIT3 ortholog, we were unable to establish this axis [Citation64]. Further studies are required to understand this pathway in the background of sin-3 deletion. Knockdown by bec-1 and atg-7 RNAi failed to rescue the short lifespan phenotype. Supplementation with vitamin C brought autophagy down to the basal levels and rescued the worms to the normal lifespan indicating a ROS-mediated induction of autophagy and reduction in lifespan. This implied that autophagy in sin-3 mutants is due to increased oxidative stress and does not regulate the lifespan in sin-3(tm1279);him-5(e1490) nematodes directly.
Previous studies have shown that loss of SIN3 leads to accumulation of oxidative stress in the cells due to compromised expression of osmo-stress [Citation73] and oxidative stress-responsive genes [Citation74]. Sin3A knockdown flies and yeast cells show heightened oxidative stress due to repression of nuclear genes coding for mitochondrial proteins. Derepression of the mitochondrial encoded genes, in turn leads to an increase in mitochondrial mass and hence aberrant regulation of metabolism [Citation14]. Consistent with these studies, our results show an increased level of intracellular ROS in the sin-3 deletion mutant, sin-3(tm1279);him-5(e1490) young adult worms as measured by DCFDA staining. Drosophila Sin3A knockdown flies also show aberrant expression of superoxide dismutases, catalases, and genes involved in glutathione synthesis pathway [Citation15]. Our results are in agreement with these studies that the sod genes are differently expressed, while sod-1 (intracellular sod), sod-3, sod-4 and sod-5 increased, the levels of mitochondrial sod-2 levels did not change significantly in the sin-3 deletion mutant worms. While some studies show that overexpression of sod-2 leads to decrease in lifespan [Citation75], other studies suggest that sod genes are dispensable for the overall lifespan of C. elegans [Citation76]. To the best of our knowledge this is the first report where mRNA expression levels of sod genes has been evaluated in the background of sin-3 deletion. In contrast to Barnes et al. [Citation15], we observed low enzymatic activity of catalase in sin-3(tm1279);him(e1490) worms. This could be explained by the fact that the slight increase in the catalase activity, observed earlier was restricted to 20 day old flies, whereas we have used young adult worms, where the catalase activity along with the expression levels of peroxisomal catalase were significantly lower. Lack of peroxisomal catalase has been reported to induce progeric phenotype in C. elegans [Citation77]. Persistent oxidative stress leads to further damage through lipid peroxidation. Our data also depicts enhanced lipid peroxidation in terms of increased MDA content in sin-3(tm1279);him-5(e1490) mutant nematodes.
Accumulated evidence has suggested NADPH to be a key regulator of cellular antioxidation systems, maintenance of GSH reserves [Citation57], mitochondrial ROS generation and aging [Citation78]. Not only were total NADP levels higher, but the ratio of NADP(+)/NADPH was also skewed towards higher NADP(+) in sin-3(tm1279);him-5(e1490) worms. Total glutathione level as well as the amount of reduced glutathione in a cell determines its health. sin-3(tm1279);him-5(e1490) worms are deficient in both, showing an increased GSSG levels and significantly reduced total GSH content. The results are in line with the other studies, which show repression of de-novo glutathione synthesis genes in Drosophila [Citation15]. Studies have shown that level and location of ROS is the major determinant of its effects on lifespan. Cytoplasmic ROS is detrimental to the lifespan, whereas mitochondrial ROS is longevity-promoting [Citation75]. sin-3(tm1279);him-5(e1490) nematodes express higher levels of cytoplasmic ROS (both sod-1 and sod-5) along with defects in other stress coping mechanisms. As enzyme activity and antioxidant levels are a better marker for studying oxidative stress rather than the increased mRNA expression as mere transcriptional upregulation may not translate into a functional protein. Our data not only convincingly indicate cellular antioxidant dysregulation in the sin-3 mutant worms but also explains the mechanism for the same.
In conclusion, our results demonstrate that the reduction of lifespan and surge in autophagy in sin-3(tm1279);him-5(e1490) worms is due to excessive oxidative stress followed by the differential regulation of the antioxidant factors of the cell. This is the first report wherein the role of SIN-3 in regulation of oxidative stress and lifespan has been shown in vivo under normal growth conditions without any environmental or oxidative stress insults. Most of the other studies carried out on the same lines have invariably been conducted under stress situation where the response of the pleiotropic effect of deletion of any gene might not give a clear understanding of its function and regulation. Additionally, in this study we report the presence of high intracellular ROS in mutant worms, supplementing other studies which show increases in the mitochondrial ROS in Sin3A and Sin3B knockdown model systems [Citation14]. This study can help understand the regulatory dynamics of SIN-3 in the higher eukaryotes including humans where use of HDAC inhibitors is being touted as a major onco-preventive and therapeutic strategy. In light of our results, we propose further in-depth studies in this regard as high doses of HDAC inhibitors can have detrimental effect on longevity due to high intracellular ROS generation.
Material and methods
C. elegans strains and culture conditions
The strains N2 Bristol (wild-type), sin-3 deletion mutant strain KC565 (sin-3[tm1276]I;him-5[e1490]V), CB1370 daf-2(e1370)III, DR27 daf-16(mu86)I, CB4088 him-5(e1490)V, HZ589 (bpIs151[sqst-1p::sqst-1::GFP+ unc-76{+}];him-5[e1490]V), DA2123 (adIs2122[Plgg-1::GFP::LGG-1;rol-6{su1006}]) and E. coli OP50 were procured from the Caenorhabditis Genetics Center (CGC, University of Minnesota). All strains were maintained as described by Brenner [Citation79]. Briefly, nematode growth medium (NGM) was prepared (3.0 g NaCl [Sigma Aldrich, 746398], 17.0 g agar [Fisher Scientific, DF0140], 2.5 g peptone [BD Biosciences, 211820]) was autoclaved in 975 ml of distilled water, followed by addition of 1 ml each of 1 M CaCl2 (Sigma Aldrich, C4901), 1 M MgSO4 (Sigma Aldrich, 203726) and 5 mg/ml of cholesterol (Sigma Aldrich, C8667) prepared in absolute ethanol (Sigma Aldrich, 1009831011). Twenty-five ml of 1.0 M potassium phosphate buffer (108.3 g KH2PO4 [Sigma Aldrich, P9791] and 35.6 g K2HPO4 per liter [Sigma Aldrich, RES20765-A7], pH 6) was added and media was poured into desired plates for solidification. Worms were fed with E. coli strain OP50 at 20°C unless otherwise stated. For all experiments young adult synchronous populations obtained by bleaching were used unless otherwise stated. Only for lifespan analysis worms were picked and allowed to lay eggs to avoid stress conditions. Vitamin C-supplementation experiments were conducted by adding 10 mM of vitamin C (Sigma Aldrich, A92902) into the nematode growth media after it cooled down to around 60°C.
Age synchronization
Age synchronization was performed as described by Stiernagle [Citation80]. Briefly, egg-bearing worms were collected from NGM plates with OP50. Eggs were extracted in the bleaching solution (0.7 M NaOH with 2% Na-hypochlorite), vortexed intermittently for few seconds till approximately 50% worms were lysed, followed by a quick centrifugation at 3900 g for 1 min. The pellet consisting of worm debris was then washed with M9 buffer (3.0 g KH2PO4 [Sigma Aldrich, P9791], 6.0 g Na2HPO4 [Sigma Aldrich, S3264], 0.5 g NaCl [Sigma Aldrich, S3014], 1.0 g NH4Cl [Sigma Aldrich, 09718] for 1 L] at least 3 times. The eggs so obtained were then resuspended in 4X volume of M9 buffer and the tubes were incubated overnight at 20°C with fairly vigorous shaking to obtain synchronous L1 worms.
Analysis of autophagic events using an GFP::LGG-1 reporter strain
The level of autophagy in various mutants was assessed using a GFP::LGG-1 translational reporter characterized previously [Citation25]. GFP-positive puncta were counted in the seam (lateral epidermal) cells of L3 transgenic worms using 1,000-fold magnification on a Nikon Eclipse E600 microscope (Melville, NY, USA) equipped with fluorescence optics as standardized previously [Citation22]. When performing RNAi experiments to count GFP::LGG-1-positive foci, young adults (P0) were fed with bacteria expressing the desired RNAi and the L3 progeny of the F2 generation were examined. All RNAi clones bec-1, atg-7 and L4440 used were a generous gift from Prof. J. Ahnn, Hanyang University, South Korea. At least 5 to 6 seam cells were examined in each of 20 to 25 worms from at least 2 independent trials and averaged. For GFP puncta analysis in HZ589, SQST-1::GFP strain, GFP puncta were counted in the lateral intestine of 30 worms per experiment at 1000X magnification. Statistical data analysis was done using unpaired, two-tailed Student’s t test.
Western blot analysis
Age-synchronized worms were harvested and protein was extracted by homogenization using a sonicator. The proteins were separated by SDS-PAGE and transferred onto PVDF membranes (Merck Millipore, IPVH00010; Immobilon-P, 0.45 µm). Membranes were incubated with primary antibodies followed by Horse radish peroxidase-conjugate secondary antibody and visualized with ECL (Bio-Rad Laboratories, 1705060; Clarity™ ECL Western Blotting Substrate) using chemiluminescence documentation system. Primary antibodies used were: goat polyclonal anti-GFP (Abcam, ab6673), goat monoclonal anti-actin (Santa Cruz Biotechnology, sc-1615) and secondary antibody used was rabbit anti-goat IgG (Abcam, ab6741). Primary antibodies were used at a dilution of 1:1000 and secondary antibody was used at a dilution of 1:10,000.
Analysis of lifespan
For RNAi treatments, young adults (P0) were transferred to plates seeded with the bacteria expressing RNAi of the desired gene and the feeding was continued in progenies and throughout the experiment. The lifespan analysis at 20°C was done in the F2 generation for all strains, feeding them either with OP50 or bacteria expressing the RNAi of interest. In all the lifespan analysis experiments, the pre-fertile period of adulthood (L4 stage) was used as t = 0. The animals that ruptured, bagged (exhibited internal progeny hatching), or crawled off the plates were censored from lifespan analysis data. Each lifespan experiment was repeated at least 3 times with n = 75 to 100 worms per experimental group. Kaplan-Meier survival analysis was used to compare the mean lifespan of different treatments and P values were calculated using the log rank (Mantel-Cox method) to determine the relative effects of RNAi treatment on CB4088 (him-5(e1490)) and KC565 (sin-3(tm1279)I;him-5(e1490)V) worms.
RNA isolation and quantitative RT-PCR analysis
Mixed stage worms of wild-type and each mutant strain were harvested, washed with M9 buffer to remove bacteria, quick frozen in liquid N2 and stored at −80°C. Total RNA was extracted from frozen worms using the Trizol method [Citation81]. The quality of the isolated RNA was ensured by checking it on 1% H2O2 (Fisher Scientific, H325-100) in 1X TAE (Thermo Fisher Scientific, B49) agarose gel electrophoresis as previously described [Citation82]. A NanoDrop ND 1000 spectrophotometer (Thermo fisher, Waltham, MA, USA) was used to analyze RNA concentration and purity. RNA sample (1 µg) was used to synthesize cDNA using a RevertAid First strand cDNA synthesis kit (Thermo Fisher Scientific, K1622) and oligo dT primers. Quantitative RT-PCR (in triplicates) was carried out using gene-specific primers (Table S2) using FastStart Universal SYBR Green Master mix (Roche, 04913850001) on a BIO-RAD CFX96 Real-Time System (Hercules, CA, USA) and analyzed using the Bio-Rad CFX Manager application. All reactions were performed in triplicate and CT values were averaged. Reactions with primers for cdc-42 and act-1 were performed on all samples in parallel as a normalization control. To examine the changes in gene expression, representative genes involved in stress regulation (hcf-1, dct-1, hif-1, sod-1, sod-2, sod-3, sod-4, sod-5, ctl-1, ctl-2 and hlh-30) were chosen. The altered gene expression is represented as the mean (± SEM) of the fold changes witnessed in the various worm strains. Fold difference was calculated by relative gene expression for each worm strain in comparison with that of the isogenic control CB4088 (him-5(e1490)) using the 2−ΔΔCT (Livak) method [Citation83]. All experiments were repeated at least 3 times.
Intracellular oxidative stress measurements
Oxidative stress in C. elegans was measured according to a previously published protocol [Citation84,Citation85]. Briefly, the first day young adult C. elegans were stained with 2ʹ,7ʹ-dichlorodihydrofluoroscein diacetate, DCFDA (Sigma-Aldrich, D6883). Non-fluorescent DCFDA dye freely permeates the cell, and on interaction with intracellular H2O2 gets converted to fluorescent 2ʹ,7ʹ-dichlorofluorescein which can be detected under a fluorescence reader. C. elegans samples from different strains were incubated in a 96-well black bottom plate in triplicates, which included 50 mM DCFDA in M9 buffer at room temperature in a fluorescence microplate reader (Tecan infinite M200, Männedorf, Switzerland). The C. elegans samples were quantified every 2 min for 5 h by measuring the fluorescence at 485 nm (excitation) and 530 nm (emission). The fluorescence was normalized to the protein concentration of harvested C. elegans from each well. Fold-change in ROS production was determined using the following equation: (Ftest–Fblank)/(Fcontrol–Fblank), where Ftest, Fblank, Fcontrol represent the fluorescence readings from the C. elegans mutant strains, the unstained worms and the stained isogenic control CB4088 (him-5(e1490)) worms, respectively.
Confocal microscopy to visualize ROS levels
Approximately 100 1-day old young adult worms, grown as described above were transferred to 1.5-ml conical tubes containing 500 µl of M9 buffer and washed 3 times and then resuspended in 500 µl of M9 buffer containing 25 µM DCFDA and rotated in the dark for 1 h. Worms were then washed with M9 buffer twice, transferred to 2% agarose pads on glass slides, covered, and visualized within 1 h of washing out of DCFDA. Imaging was performed on a Nikon C2 confocal microscope (Melville, NY, USA) using 488 nm laser and a GFP filter. Atleast 20 images were taken per genotype per replicate.
Oxidative stress enzymatic assays
Total GSH and GSH:GSSG estimation was carried out as previously described based on 5,5ʹ-dithiobis-2-nitrobenzoic acid-glutathione disulfide reductase recycling method [Citation61,Citation86]. Briefly, approximately 30,000 synchronized 1-day-old young adults were harvested and sonicated in ice-cold KPE sonication buffer containing 0.1 M potassium phosphate buffer (16 ml of solution A: 13.6 g KH2PO4 per liter [Sigma Aldrich, P9791] and 84 ml of solution B: 22.8 g K2HPO4 · 3H2O per liter [Sigma Aldrich, P9666], pH 7.5) and 5 mM EDTA (Sigma Aldrich, E6758) containing 1% Triton X-100 (MP Biomedicals, 02194854), 1% sulfosalisylic acid (Fisher Scientific, SA168-1) and protease inhibitor cocktail (Sigma-Aldrich, P2714). The quantification was performed by measuring the change in absorbance due to the reduction of 5,5ʹ-dithiobis-2-nitrobenzoic acid, DTNB (Sigma-Aldhrich, D8130) per min at 412 nm using a Tecan infinite M200 microplate reader (Männedorf, Switzerland). GSH quantification was normalized to the protein concentration per strain.
Total catalase activity based on spectrophotometric removal of peroxide ions generated by H2O2 was measured as described by Weydert and Cullen [Citation86]. Briefly, synchronized young adults were harvested and homogenized in KPE Buffer containing protease inhibitors. Protein concentration was measured using BCA estimation kit (Merck Millipore, 71285) and 400 µg of protein per sample per strain was used to determine catalase activity spectrophotometrically at 240 nm for 2 min. Each experiment was repeated 3 times and the values are average of all repeats.
Lipid peroxidation estimation
Lipid peroxidation levels were measured through spectrophotometric estimation of MDA using a chromogenic agent 1-methyl-2-phenylindole at 586 nm as previously described with slight modification [Citation56,Citation87]. Briefly, synchronized young adult worms were harvested and 1mg of total worm weight was homogenized by sonication in 50 mM Tris-HCl buffer, pH 7.5 (Sigma-Aldrich, T1503) to yield a 20% homogenate (w:v). The homogenate was centrifuged at 13,000 g for 10 min at 4°C. To 100 µl of the supernatant of each sample 650 µl of reagent R1 (0.064 g of 1-methyl-2-phenylindole [Sigma-Aldrich, 404888] suspended in 30 ml of acetonitrile [Fisher Scientific, AC25856] and 10 ml of methanol [Merck, 1060091011]), 150 µl of reagent R2 (37% HCl solution [Fisher Scientific, A144S-500]) along with 100 µl distilled water was added and the mixture was incubated at 45°C for 45 min. The samples were cooled and absorbance was measured at 586 nm. The concentration of MDA was estimated by using a standard curve generated from standards prepared using various concentrations of 1,1,3,3-tetramethoxypropane (Sigma Aldrich, 108383). The experiment was repeated 3 times.
NADP/NADPH assay
Age-synchronized young adult worms were grown on NGM plates seeded with OP50 and collected for assay. In all, 2000 age-synchronized young adult worms of various strains were washed with M9 buffer, treated with 4 freeze-thaw cycles by dipping in liquid N2. Following which the worms were homogenized in kit-supplied NADP/NADPH extraction buffer followed by filtration of the sample using a 5-kDa dialysis membrane (Thermo Fisher Scientific, 68100) as described in the kit. Samples were then spun at 4°C, 11,000 g for 10 min. A colorimetric NADP/NADPH assay kit was used to perform the assay as per the kit instructions (Abcam, ab65349). The results were analyzed spectrophotometrically at 450 nm using a microplate reader (Tecan infinite M200, Männedorf, Switzerland). The experiment was repeated 3 times.
Nile red staining
The feeding Nile red assay was conducted by seeding wild-type or mutant C. elegans on NGM plates containing E. coli OP50 supplemented with 50 ng/mL Nile red (Sigma Aldrich, 72485) diluted fresh into 100 µl M9 media per plate from 500 mg/ml stock in acetone (Sigma Aldrich, 650501) and added to the top of E. coli plates and allowed to dry, as L1 following overnight hatching and synchronization at 20°C in minimal media. Imaging and quantification was conducted after growth at 20°C as day 1 adults using a Nikon Eclipse E600 microscope fluorescence microscope (Melville, New York) at 200X. All Nile red analyses were carried out on animals grown at 20°C.
Bioinformatics analysis
The FASTA sequences of C. elegans SIN-3, and human SIN3A and SIN3B were retrieved from the NCBI database. Pairwise and multiple sequence alignment was performed using EMBOSS Needle and T-Coffee software from EMBL-EBI platform using default settings.
Quantitative analysis using ImageJ
The western blots were quantitatively analyzed densitometrically using ImageJ software and mean intensity was calculated after subtracting the backgrounds and normalizing the test bands w.r.t to the actin controls.
Statistical analysis
All data are expressed as mean ± SEM. mRNA expression analysis for hif-1, hcf-1 and dct-1 was compared using Two-way ANOVA. Unless otherwise stated all data were analyzed using one-way ANOVA for multiple comparisons. Paired Student’s t test was employed to calculate the significance between the sin-3(tm1279);him-5(e1490) strain maintained on normal NGM and vitamin C-supplemented NGM. Kaplan-Meier survival analysis was used to compare the mean lifespan of different treatments. All histograms and intracellular ROS curve were generated and all statistical analysis was performed using GraphPad Prism (GraphPad Software Inc. version 6.01). The Bonferroni multiple comparisons test was employed and P < 0.05 was accepted as statistically significant difference. The results are expressed as mean ± SEM unless otherwise stated.
1474312_SUPPLEMENTARY.zip
Download Zip (27.9 MB)Acknowledgments
The authors want to thank the DBT-BIF bioinformatics facility of ACBR for the logistic support for carrying out bioinformatics analysis. Prof. K. Natrajan and Dr. Mandira Verma-Basil are duly acknowledged for access to confocal and fluorescence microscope respectively. Strains were provided by the CGC, which is funded by NIH Office of Research Infrastructure Programs (P40 OD010440).
Disclosure statement
No potential conflict of interest was reported by the authors.
Supplementary material
Supplemental data for this article can be accessed here.
Additional information
Funding
Related Research Data
References
- Kuo MH, Allis CD. Roles of histone acetyltransferases and deacetylases in gene regulation. Bioessays. 1998 Aug;20(8):615–626. PubMed PMID: 9780836; eng.
- Silverstein RA, Ekwall K. Sin3: a flexible regulator of global gene expression and genome stability. Curr Genet. 2005 Jan;47(1):1–17. PubMed PMID: 15565322; eng.
- Bernstein BE, Tong JK, Schreiber SL. Genomewide studies of histone deacetylase function in yeast. Proc Natl Acad Sci U S A. 2000 Dec 5;97(25):13708–13713. PubMed PMID: 11095743; PubMed Central PMCID: PMCPmc17640. eng.
- Fazzio TG, Kooperberg C, Goldmark JP, et al. Widespread collaboration of Isw2 and Sin3-Rpd3 chromatin remodeling complexes in transcriptional repression. Mol Cell Biol. 2001 Oct;21(19):6450–6460. PubMed PMID: 11533234; PubMed Central PMCID: PMCPmc99792. eng.
- Pile LA, Spellman PT, Katzenberger RJ, et al. The SIN3 deacetylase complex represses genes encoding mitochondrial proteins: implications for the regulation of energy metabolism. J Biol Chem. 2003 Sep 26;278(39):37840–37848. PubMed PMID: 12865422; eng.
- Das TK, Sangodkar J, Negre N, et al. Sin3a acts through a multi-gene module to regulate invasion in Drosophila and human tumors. Oncogene. 2013 Jun 27;32(26):3184–3197. PubMed PMID: 22890320; PubMed Central PMCID: PMCPmc3696049. eng.
- Wysocka J, Myers MP, Laherty CD, et al. Human Sin3 deacetylase and trithorax-related Set1/Ash2 histone H3-K4 methyltransferase are tethered together selectively by the cell-proliferation factor HCF-1. Genes Dev. 2003 Apr 1;17(7):896–911. PubMed PMID: 12670868; PubMed Central PMCID: PMCPmc196026. eng.
- Kadosh D, Struhl K. Repression by Ume6 involves recruitment of a complex containing Sin3 corepressor and Rpd3 histone deacetylase to target promoters. Cell. 1997 May 2;89(3):365–371. PubMed PMID: 9150136; eng.
- Washburn BK, Esposito RE. Identification of the Sin3-binding site in Ume6 defines a two-step process for conversion of Ume6 from a transcriptional repressor to an activator in yeast. Mol Cell Biol. 2001 Mar;21(6):2057–2069. PubMed PMID: 11238941; PubMed Central PMCID: PMCPmc86811. eng.
- Ayer DE, Lawrence QA, Eisenman RN. Mad-Max transcriptional repression is mediated by ternary complex formation with mammalian homologs of yeast repressor Sin3. Cell. 1995 Mar 10;80(5):767–776. PubMed PMID: 7889570; eng.
- Grzenda A, Lomberk G, Zhang JS, et al. Sin3: master scaffold and transcriptional corepressor. Biochim Biophys Acta. 2009 Jun-Aug;1789(6–8):443–450. PubMed PMID: 19505602; PubMed Central PMCID: PMCPmc3686104. eng.
- Kadamb R, Mittal S, Bansal N, et al. Sin3: insight into its transcription regulatory functions. Eur J Cell Biol. 2013 Aug-Sep;92(8–9):237–246. PubMed PMID: 24189169; eng.
- Liu M, Pile LA. The transcriptional corepressor SIN3 directly regulates genes involved in methionine catabolism and affects histone methylation, linking epigenetics and metabolism. J Biol Chem. 2017 Feb 3;292(5):1970–1976.
- Barnes VL, Strunk BS, Lee I, et al. Loss of the SIN3 transcriptional corepressor results in aberrant mitochondrial function. BMC Biochem. 2010;11:26. PubMed PMID: 20618965; PubMed Central PMCID: PMCPmc2909972. eng.
- Barnes VL, Bhat A, Unnikrishnan A, et al. SIN3 is critical for stress resistance and modulates adult lifespan. Aging. 2014 Aug;6(8):645–660. PubMed PMID: 25133314; PubMed Central PMCID: PMCPmc4169859. eng.
- Potukuchi A, Addepally U, Sindhu K, et al. Increased total DNA damage and oxidative stress in brain are associated with decreased longevity in high sucrose diet fed WNIN/Gr-Ob obese rats. Nutr Neurosci. 2017;1–9. DOI:10.1080/1028415X.2017.1332509
- Pyo J-O, Yoo S-M, Ahn -H-H, et al. Overexpression of Atg5 in mice activates autophagy and extends lifespan. Nat Commun. 2013;4:2300. doi:10.1038/ncomms3300.
- Thondamal M, Witting M, Schmitt-Kopplin P, et al. Steroid hormone signalling links reproduction to lifespan in dietary-restricted Caenorhabditis elegans [Article]. Nat Commun. 2014 Sep 11;5:4879. online.
- Finkel T, Holbrook NJ. Oxidants, oxidative stress and the biology of ageing. Nature. 2000 Nov 9;408(6809):239–247. print.
- D’Autreaux B, Toledano MB. ROS as signalling molecules: mechanisms that generate specificity in ROS homeostasis. Nat Rev Mol Cell Biol. 2007;8(10): 813–824. 10//print.
- Mizushima N. Autophagy: process and function. Genes Dev. 2007 Nov 15;21(22):2861–2873. PubMed PMID: 18006683; eng.
- Blagosklonny MV. Aging: ROS or TOR. Cell Cycle (Georgetown, Tex). 2008 Nov 1;7(21):3344–3354. .
- Bartholomew CR, Suzuki T, Du Z, et al. Ume6 transcription factor is part of a signaling cascade that regulates autophagy. Proc Natl Acad Sci U S A. 2012 Jul 10;109(28):11206–11210. PubMed PMID: 22733735; PubMed Central PMCID: PMCPmc3396506. eng.
- Aihara M, Jin X, Kurihara Y, et al. Tor and the Sin3–rpd3 complex regulate expression of the mitophagy receptor protein Atg32 in yeast. J Cell Sci. 2014;127(14):3184–3196.
- Melendez A, Talloczy Z, Seaman M, et al. Autophagy genes are essential for dauer development and life-span extension in C. elegans. Science (New York, NY). 2003 Sep 5;301(5638):1387–1391. PubMed PMID: 12958363; eng.
- Jia K, Levine B. Autophagy is required for dietary restriction-mediated life span extension in C. elegans. Autophagy. 2007 Nov-Dec;3(6):597–599. PubMed PMID: 17912023; eng.
- Tavernarakis N, Pasparaki A, Tasdemir E, et al. The effects of p53 on whole organism longevity are mediated by autophagy. Autophagy. 2008 Oct;4(7):870–873. PubMed PMID: 18728385; eng.
- Toth ML, Sigmond T, Borsos E, et al. Longevity pathways converge on autophagy genes to regulate life span in Caenorhabditis elegans. Autophagy. 2008 Apr;4(3):330–338. PubMed PMID: 18219227; eng.
- Dwivedi M, Song HO, Ahnn J. Autophagy genes mediate the effect of calcineurin on life span in C. elegans. Autophagy. 2009 Jul;5(5):604–607. PubMed PMID: 19279398; eng.
- Tissenbaum HA, Guarente L. Increased dosage of a sir-2 gene extends lifespan in Caenorhabditis elegans. Nature. 2001 Mar 8;410(6825):227–230. PubMed PMID: 11242085; eng.
- Morselli E, Maiuri MC, Markaki M, et al. The life span-prolonging effect of sirtuin-1 is mediated by autophagy. Autophagy. 2010 Jan;6(1):186–188. PubMed PMID: 20023410; eng.
- Morselli E, Maiuri MC, Markaki M, et al. Caloric restriction and resveratrol promote longevity through the Sirtuin-1-dependent induction of autophagy. Cell Death Dis. 2010;1:e10. PubMed PMID: 21364612; PubMed Central PMCID: PMCPmc3032517. eng.
- Eisenberg T, Knauer H, Schauer A, et al. Induction of autophagy by spermidine promotes longevity. Nat Cell Biol. 2009 Nov;11(11):1305–1314. PubMed PMID: 19801973; eng.
- Sui X, Chen R, Wang Z, et al. Autophagy and chemotherapy resistance: a promising therapeutic target for cancer treatment. Cell Death Dis. 2013;4:e838. PubMed PMID: 24113172; PubMed Central PMCID: PMCPmc3824660. eng.
- Madeo F, Zimmermann A, Maiuri MC, et al. Essential role for autophagy in life span extension. J Clin Invest. 2015 Jan;125(1):85–93. PubMed PMID: 25654554; PubMed Central PMCID: PMCPmc4382258. eng.
- Bergmann A. Autophagy and cell death: no longer at odds. Cell. 2007;131(6):1032–1034.
- Li C, Liu H, Sun Y, et al. PAMAM nanoparticles promote acute lung injury by inducing autophagic cell death through the Akt-TSC2-mTOR signaling pathway. J Mol Cell Biol. 2009;1(1):37–45.
- Yang Z, Zhao T-Z, Zou Y-J, et al. Hypoxia induces autophagic cell death through hypoxia-inducible factor 1α in microglia. PloS One. 2014;9(5):e96509.
- Kang C, You Y-J, Avery L. Dual roles of autophagy in the survival of Caenorhabditis elegans during starvation. Genes Dev. 2007 Sep 1;21(17):2161–2171. .
- Wang CW, Klionsky DJ. The molecular mechanism of autophagy. Mol Med. 2003 Mar-Apr;9(3–4):65–76. PubMed PMID: 12865942; PubMed Central PMCID: PMCPmc1430730. eng.
- Glick D, Barth S, Macleod KF. Autophagy: cellular and molecular mechanisms. J Pathol. 2010 May;221(1):3–12. PubMed PMID: 20225336; PubMed Central PMCID: PMCPmc2990190. eng.
- Lapierre LR, De Magalhaes Filho CD, McQuary PR, et al. The TFEB orthologue HLH-30 regulates autophagy and modulates longevity in Caenorhabditis elegans. Nat Commun. 2013;4. PubMed PMID: 23925298; PubMed Central PMCID: PMCPmc3866206. eng. DOI:10.1038/ncomms3267.
- Nakamura S, Karalay Ö, Jäger PS, et al. Mondo complexes regulate TFEB via TOR inhibition to promote longevity in response to gonadal signals. Nat Commun. 2016;7. PubMed PMID: 27001890; PubMed Central PMCID: PMCPmc4804169. eng. DOI:10.1038/ncomms10944.
- Hwang AB, Lee SJ. Regulation of life span by mitochondrial respiration: the HIF-1 and ROS connection. Aging. 2011 Mar;3(3):304–310. PubMed PMID: 21389351; PubMed Central PMCID: PMCPmc3091523. eng.
- Zhang H, Bosch-Marce M, Shimoda LA, et al. Mitochondrial autophagy is an HIF-1-dependent adaptive metabolic response to hypoxia. J Biol Chem. 2008 Apr 18;283(16):10892–10903. PubMed PMID: 18281291; PubMed Central PMCID: PMCPmc2447655. eng.
- Palikaras K, Lionaki E, Tavernarakis N. Coordination of mitophagy and mitochondrial biogenesis during ageing in C. elegans. Nature. 2015 May 28;521(7553):525–528. PubMed PMID: 25896323; eng.
- Li J, Ebata A, Dong Y, et al. Caenorhabditis elegans HCF-1 functions in longevity maintenance as a DAF-16 regulator. PLoS Biol. 2008 Sep 30;6(9):e233. PubMed PMID: 18828672; PubMed Central PMCID: PMCPmc2553839. eng.
- Wang X, Cook LF, Grasso LM, et al. Royal jelly-mediated prolongevity and stress resistance in caenorhabditis elegans is possibly modulated by the interplays of DAF-16, SIR-2.1, HCF-1, and 14-3-3 proteins. J Gerontol A Biol Sci Med Sci. 2015 Jul;70(7):827–838. PubMed PMID: 25073462; eng.
- Zalba G, Fortuño A, Díez J. Oxidative stress and atherosclerosis in early chronic kidney disease. Nephrol Dial Transplant. 2006;21(10):2686–2690.
- Sun X, Komatsu T, Lim J, et al. Nutrient-dependent requirement for SOD1 in lifespan extension by protein restriction in Drosophila melanogaster. Aging Cell. 2012 Oct;11(5):783–793. PubMed PMID: 22672579; PubMed Central PMCID: PMCPmc3444681. eng.
- Sun J, Molitor J, Tower J. Effects of simultaneous over-expression of Cu/ZnSOD and MnSOD on Drosophila melanogaster life span. Mech Ageing Dev. 2004 May;125(5):341–349. PubMed PMID: 15130751; eng.
- Yanase S, Yasuda K, Ishii N. Adaptive responses to oxidative damage in three mutants of Caenorhabditis elegans (age-1, mev-1 and daf-16) that affect life span. Mech Ageing Dev. 2002 Nov;123(12):1579–1587. PubMed PMID: 12470895; eng.
- Honda Y, Honda S. The daf-2 gene network for longevity regulates oxidative stress resistance and Mn-superoxide dismutase gene expression in Caenorhabditis elegans. FASEB J. 1999 Aug;13(11):1385–1393. PubMed PMID: 10428762; eng.
- Esterbauer H, Cheeseman KH. Determination of aldehydic lipid peroxidation products: malonaldehyde and 4-hydroxynonenal. Methods Enzymol. 1990;186:407–421. PubMed PMID: 2233308; eng.
- Marnett LJ. Lipid peroxidation-DNA damage by malondialdehyde. Mutat Res. 1999 Mar 8;424(1–2):83–95. PubMed PMID: 10064852; eng.
- Siddique YH, Jyoti S, Naz F, et al. Validation of 1-methyl-2-phenylindole method for estimating lipid peroxidation in the third instar larvae of transgenic Drosophila melanogaster (hsp70-lacZ)Bg (9.). Pharm Methods. 2012 Jul;3(2):94–97. PubMed PMID: 23781486; PubMed Central PMCID: PMCPmc3658091. eng.
- Ying W. NAD+/NADH and NADP+/NADPH in cellular functions and cell death: regulation and biological consequences. Antioxid Redox Signal. 2008 Feb;10(2):179–206. PubMed PMID: 18020963; eng.
- Blacker TS, Marsh RJ, Duchen MR, et al. Activated barrier crossing dynamics in the non-radiative decay of NADH and NADPH. Chem Phys. 2013;422:184–194. .
- Rahman I, MacNee W. Oxidative stress and regulation of glutathione in lung inflammation. Eur Respir J. 2000 Sep;16(3):534–554. PubMed PMID: 11028671; eng.
- Reczek CR, Chandel NS. ROS-dependent signal transduction. Curr Opin Cell Biol. 2015 Apr;33:8–13. PubMed PMID: 25305438; PubMed Central PMCID: PMCPmc4380867. eng.
- Rahman I, Kode A, Biswas SK. Assay for quantitative determination of glutathione and glutathione disulfide levels using enzymatic recycling method. Nat Protoc. 2006;1(6):3159–3165. PubMed PMID: 17406579; eng.
- Mijaljica D, Prescott M, Devenish RJ. Autophagy in disease. Methods Mol Biol. 2010;648:79–92. PubMed PMID: 20700706; eng.
- Sridhar S, Botbol Y, Macian F, et al. Autophagy and disease: always two sides to a problem. J Pathol. 2012 Jan;226(2):255–273. PubMed PMID: 21990109; PubMed Central PMCID: PMCPmc3996449. eng.
- Matsumoto H, Miyazaki S, Matsuyama S, et al. Selection of autophagy or apoptosis in cells exposed to ER-stress depends on ATF4 expression pattern with or without CHOP expression. Biol Open. 2013;2(10):1084–1090. PubMed PMID: 24167719; PubMed Central PMCID: PMCPmc3798192. eng.
- Janga SC, Moreno-Hagelsieb G. Conservation of adjacency as evidence of paralogous operons. Nucleic Acids Res. 2004;32(18):5392–5397. PubMed PMID: 15477389; PubMed Central PMCID: PMCPmc524292. eng.
- Fitch WM. Homology a personal view on some of the problems. Trends Genet. 2000 May;16(5):227–231. PubMed PMID: 10782117; eng.
- Choy SW, Wong YM, Ho SH, et al. C. elegans SIN-3 and its associated HDAC corepressor complex act as mediators of male sensory ray development. Biochem Biophys Res Commun. 2007 Jul 6;358(3):802–807. PubMed PMID: 17506990; eng.
- Gabaldon T, Koonin EV. Functional and evolutionary implications of gene orthology. Nat Reviews Genet. 2013 May;14(5):360–366. PubMed PMID: 23552219; eng.
- Lange PS, Chavez JC, Pinto JT, et al. ATF4 is an oxidative stress-inducible, prodeath transcription factor in neurons in vitro and in vivo. J Exp Med. 2008 May 12;205(5):1227–1242. PubMed PMID: 18458112; PubMed Central PMCID: PMCPmc2373852. eng.
- Bellot G, Garcia-Medina R, Gounon P, et al. Hypoxia-induced autophagy is mediated through hypoxia-inducible factor induction of BNIP3 and BNIP3L via their BH3 domains. Mol Cell Biol. 2009 May;29(10):2570–2581. PubMed PMID: 19273585; PubMed Central PMCID: PMCPmc2682037. eng.
- B’Chir W, Maurin AC, Carraro V, et al. The eIF2alpha/ATF4 pathway is essential for stress-induced autophagy gene expression. Nucleic Acids Res. 2013 Sep;41(16):7683–7699. PubMed PMID: 23804767; PubMed Central PMCID: PMCPmc3763548. eng.
- Zhu K, Jiao H, Li S, et al. ATF4 promotes bone angiogenesis by increasing VEGF expression and release in the bone environment. J Bone Miner Res. 2013 Sep;28(9):1870–1884. PubMed PMID: 23649506; PubMed Central PMCID: PMCPmc4394202. eng.
- De Nadal E, Zapater M, Alepuz PM, et al. The MAPK Hog1 recruits Rpd3 histone deacetylase to activate osmoresponsive genes. Nature. 2004 Jan 22;427(6972):370–374. PubMed PMID: 14737171; eng.
- Kato T, Shimono Y, Hasegawa M, et al. Characterization of the HDAC1 complex that regulates the sensitivity of cancer cells to oxidative stress. Cancer Res. 2009 Apr 15;69(8):3597–3604. PubMed PMID: 19351825; eng.
- Van Raamsdonk JM, Hekimi S. Deletion of the mitochondrial superoxide dismutase sod-2 extends lifespan in Caenorhabditis elegans. PLoS Genet. 2009 Feb;5(2):e1000361. PubMed PMID: 19197346; PubMed Central PMCID: PMCPmc2628729. eng.
- Van Raamsdonk JM, Hekimi S. Superoxide dismutase is dispensable for normal animal lifespan. Proc Natl Acad Sci U S A. 2012 Apr 10;109(15):5785–5790. PubMed PMID: 22451939; PubMed Central PMCID: PMCPmc3326508. eng.
- Petriv OI, Rachubinski RA. Lack of peroxisomal catalase causes a progeric phenotype in caenorhabditis elegans. J Biol Chem. 2004 May 7;279(19):19996–20001. .
- Xia W, Wang Z, Wang Q, et al. Roles of NAD(+)/NADH and NADP(+)/NADPH in cell death. Curr Pharm Des. 2009;15(1):12–19. PubMed PMID: 19149598; eng.
- Brenner S. The genetics of Caenorhabditis elegans. Genetics. 1974 May;77(1):71–94. PubMed PMID: 4366476; PubMed Central PMCID: PMCPmc1213120. eng.
- Stiernagle T. Maintenance of C. elegans (February 11, 2006), wormbook, ed. The C. elegans research community, wormbook. DOI:10.1895/wormbook.1.101.1.2006.
- Chomczynski P, Sacchi N. The single-step method of RNA isolation by acid guanidinium thiocyanate-phenol-chloroform extraction: twenty-something years on. Nat Protoc. 2006;1(2):581–585. PubMed PMID: 17406285; eng.
- Pandey R, Saluja D. Hydrogen peroxide agarose gels for electrophoretic analysis of RNA. Anal Biochem. 2017 Oct 1;534(Supplement C):24–27. .
- Livak KJ, Schmittgen TD. Analysis of relative gene expression data using real-time quantitative PCR and the 2(-Delta Delta C(T)) method. Methods (San Diego, Calif). 2001 Dec;25(4):402–408. PubMed PMID: 11846609; eng.
- Yang HC, Chen TL, Wu YH, et al. Glucose 6-phosphate dehydrogenase deficiency enhances germ cell apoptosis and causes defective embryogenesis in Caenorhabditis elegans. Cell Death Dis. 2013;4:e616. PubMed PMID: 23640458; PubMed Central PMCID: PMCPmc3674345. eng.
- Liao VH, Yu CW, Chu YJ, et al. Curcumin-mediated lifespan extension in Caenorhabditis elegans. Mech Ageing Dev. 2011 Oct;132(10):480–487. PubMed PMID: 21855561; eng.
- Weydert CJ, Cullen JJ. Measurement of superoxide dismutase, catalase and glutathione peroxidase in cultured cells and tissue. Nat Protoc. 2010 Jan;5(1):51–66. PubMed PMID: 20057381; PubMed Central PMCID: PMCPmc2830880. eng.
- Gerard-Monnier D, Erdelmeier I, Regnard K, et al. Reactions of 1-methyl-2-phenylindole with malondialdehyde and 4-hydroxyalkenals. Analytical applications to a colorimetric assay of lipid peroxidation. Chem Res Toxicol. 1998 Oct;11(10):1176–1183. PubMed PMID: 9778314; eng.