
ABSTRACT
HSPB1 (heat shock protein family B [small] member 1) is a ubiquitously expressed molecular chaperone. Most mutations in HSPB1 cause axonal Charcot-Marie-Tooth neuropathy and/or distal hereditary motor neuropathy. In this study we show that mutations in HSPB1 lead to impairment of macroautophagic/autophagic flux. In HSPB1 knockout cells, we demonstrate that HSPB1 is necessary for autophagosome formation, which was rescued upon re-expression of HSPB1. Employing a label-free LC-MS/MS analysis on the various HSPB1 variants (wild type and mutants), we identified autophagy-specific interactors. We reveal that the wild-type HSPB1 protein binds to the autophagy receptor SQSTM1/p62 and that the PB1 domain of SQSTM1 is essential for this interaction. Mutations in HSPB1 lead to a decrease in the formation of SQSTM1/p62 bodies, and subsequent impairment of phagophore formation, suggesting a regulatory role for HSPB1 in autophagy via interaction with SQSTM1. Remarkably, autophagy deficits could also be confirmed in patient-derived motor neurons thereby indicating that the impairment of autophagy might be one of the pathomechanisms by which mutations in HSPB1 lead to peripheral neuropathy.
Abbreviations: ACD: alpha-crystallin domain; ALS: amyotrophic lateral sclerosis; ATG14: autophagy related 14; BAG1/3: BCL2 associated athanogene 1/3; CMT: Charcot-Marie-Tooth; dHMN: distal hereditary motor neuropathy; GFP: green fluorescent protein; HSPA8: heat shock protein family A (Hsp70) member 8; HSPB1/6/8: heat shock protein family B (small) member 1/6/8; LIR: LC3-interacting region; LC3B: microtubule associated protein 1 light chain 3 beta; PB1: Phox and Bem1; SQSTM1: sequestosome 1; STUB1/CHIP: STIP1 homology and U-box containing protein 1; UBA: ubiquitin-associated; WIPI1: WD repeat domain, phosphoinositide interacting 1; WT: wild-type
Introduction
HSPB1 (heat shock protein family B [small] member 1) is a ubiquitously expressed molecular chaperone belonging to the small heat shock protein family. Under acute stress conditions, such as heat shock or oxidative stress, HSPB1 is upregulated and will protect cells from protein aggregation and stress-unfolded proteins [Citation1]. HSPB1 performs its chaperone function by binding to non-native proteins, aggregates or misfolded proteins and mediating their refolding by ATP-dependent chaperones or degradation by the proteasome molecular machinery [Citation2]. In addition to its chaperone activity, HSPB1 is involved in several essential cellular functions, such as apoptosis and redox balance, as well as in the regulation of cytoskeletal dynamics [Citation3].
Mutations in HSPB1 lead to axonal Charcot-Marie-Tooth neuropathies (CMT2), distal hereditary motor neuropathy (dHMN) [Citation4,Citation5], and sporadic amyotrophic lateral sclerosis (ALS) [Citation6]. The majority of disease-causing mutations in HSPB1 occur in the evolutionarily conserved α-crystallin domain (ACD) which is important for its oligomerization and interaction with other small heat shock proteins [Citation7], but some mutations do exist in the N- or C-termini [Citation8]. Functional analysis of the different reported mutations show that the location of the mutation can affect different functions of the protein [Citation9]. Recent studies suggest that HSPB1 might play a role in macroautophagy and that overexpression of HSPB1 upregulates macroautophagy in renal tubular cells [Citation10,Citation11].
Macroautophagy, hereafter referred to as autophagy, is a homeostatic cellular process by which protein aggregates and cellular organelles are targeted, degraded and recycled. Autophagy proceeds through a series of steps including: induction, membrane nucleation and elongation, to finally form a double-membraned autophagosome. The autophagosome then fuses with a lysosome to ensue degradation of the autophagic contents [Citation12]. Impairment of autophagy has been linked to neuropathic and neurodegenerative diseases strengthening the current assumption that a healthy autophagy machinery is crucial for the health and maintenance of neurons, and for the removal of dysfunctional organelles and cellular waste that accumulate with ageing [Citation13,Citation14]. Interestingly, mouse models in which key autophagy genes have been knocked out, display features of peripheral neuropathy as evident from poor motor behavior [Citation15]. These observations suggest that impairment of the autophagy pathway could contribute to the pathomechanisms of CMT neuropathies and other neurodegenerative diseases. Indeed, recently several genes associated with inherited neuropathy have been linked to disturbances in autophagy [Citation16].
The various autophagy steps are commanded by a wide array of proteins and protein complexes [Citation17]. Disruption of these regulatory complexes may lead to defects in autophagy [Citation15]. Two other small heat shock proteins, HSPB6 and HSPB8 have been shown to play a role in autophagy in that they bind to other autophagy-related proteins: HSPB6 can bind to the autophagy regulator BECN1/Beclin 1 to stimulate autophagy [Citation18] and HSPB8 forms a complex with the co-chaperone BAG3 (BCL2 associated athanogene 3), HSPA8 (heat shock protein family A [Hsp70] member 8) and STUB1/CHIP (STIP1 homology and U-box containing protein 1) to activate the autophagic degradation of protein aggregates [Citation19]. Mutations in HSPB6 and HSPB8 leading to disease conditions block the autophagy pathway by disturbing the interactions of these HSPB protein family members with their autophagy-related partners [Citation18,Citation20]. Conversely, HSPB1 interacts with a wide variety of other molecular partners mediating different cellular processes including cytoskeletal dynamics and apoptosis through such interactions [Citation21,Citation22].
In this study we investigated the function of HSPB1 in autophagy. We show that HSPB1 plays a role in autophagy via interaction with the autophagy receptor SQSTM1/p62 (sequestosome 1), a function which is impaired by CMT-causing mutations.
Results
HSPB1 mutations decrease the autophagic flux
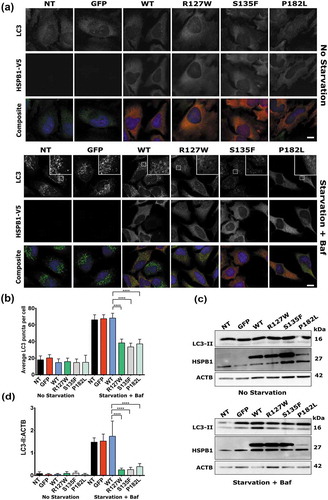
In order to assess the effect of HSPB1 mutations on the autophagic flux, immunofluorescence labelling of autophagosomes and western blotting analysis were performed in HeLa cells stably expressing HSPB1 wild type (WT), or one of the mutants: R127W, S135F and P182L. Characteristically, the expression of the C-terminal P182L mutant in these cell lines led to the aggregation of the HSPB1 protein and decreased its solubility without hindering the proliferation rate of the cells [Citation4,Citation5] (Figure S1). Upon induction of autophagy, MAP1LC3/LC3 (microtubule associated protein 1 light chain 3) is usually converted from the LC3-I form to the lipidated LC3-II form, which correlates with the number of autophagosomes [Citation23]. Cells were treated for 3 h with serum starvation (an inducer of autophagy) and the lysosomal blocker bafilomycin A1 (Baf) or were left untreated [Citation24], allowing us to compare the ‘autophagic flux’ between the different cell lines [Citation25]. The mutant cell lines showed a lower number of LC3-positive puncta upon starvation and bafilomycin A1 treatment, compared to the WT and control lines (,). In line with this, mutant cells displayed a significantly lower amount of LC3-II on western blot compared to the WT after treatment, indicating lower levels of autophagic flux in these cells (,).
Figure 1. HSPB1 mutations impair the autophagic flux. (a) Immunofluorescence staining of HeLa cells transduced with a plasmid encoding V5-tagged WT HSPB1, the mutant forms (R127W, S135F, P182L), or GFP. Cells were treated or not with serum starvation and bafilomycin A1 (Baf) for 3 h. NT cells are not transduced. LC3 (green), HSPB1 (red), and the DAPI nucleus stain (blue). Scale bar: 10 µm. (b) Quantification of LC3-positive puncta detected by immunofluorescence. Data originates from 4 independent experiments (50+ cells per experiment). (c) Western blotting analysis of LC3-II in the same cell lines under no starvation conditions or treated with 3 h starvation and bafilomycin A1. (d) The level of LC3-II calculated from 3 independent western blotting experiments and normalized to ACTB (loading control). One-way ANOVA, with Tukey’s correction range test. Error bars = mean with 95% CI (B) and S.D (D), **** = p < 0.0001.
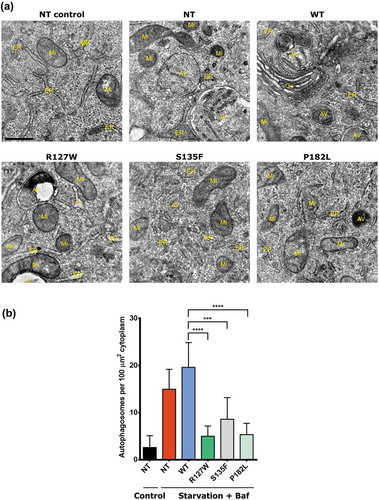
These results were also confirmed in the neuroblastoma SH-SY5Y cell lines stably expressing the different HSPB1 variants (Figure S2). Whereas the autophagic flux was impaired in the mutant SH-SY5Y cell lines upon induction by serum starvation, basal autophagy was not affected as observed upon treatment with bafilomycin A1 alone (Figure S3). The autophagy levels in the different HeLa cell lines were also monitored using transmission electron microscopy (TEM) ()). The number of autophagosomes per 100 µm2 cytoplasm area was lower in the mutant cell lines compared to controls after treatment with serum starvation and bafilomycin A1 ()). Because HSPB1 has been shown to interact with the proteasome and is able to direct some protein substrates to the proteasome for degradation [Citation26], we examined whether mutations in HSPB1 also affect the proteasome activity. A compensatory mechanism exists between autophagy and proteasomal degradation, which is mediated by a shift in the expression ratio of the BAG (BCL2 associated athanogene) family proteins BAG3 and BAG1 [Citation27]. Western blotting analysis showed no difference in the BAG3:BAG1 ratio between mutant and WT HeLa cell lines even under conditions of serum starvation (Figure S4A and B). Similarly, no difference in the chymotrypsin-like activity of the 20S proteasome was seen in the mutant cell lines compared to the WT or non-starved control cells (Figure S4(c)). These results indicate that CMT-causing mutations in HSPB1 specifically impair autophagy.
Figure 2. HSPB1 mutations decrease the number of autophagic vesicles upon autophagy stimulation. Transmission electron microscopy of HeLa cells transduced or not (NT) with a plasmid encoding V5-tagged WT HSPB1, the mutant forms (R127W, S135F, P182L) and treated or not (NT control) with serum starvation and 10 nm bafilomycin A1 (Baf). (a) Representative images of the different genotypes. Scale bar: 500 nm. AV, autophagic vesicle; Go, Golgi; ER, endoplasmic reticulum; Mi, mitochondrion; Ly, primary lysosome. (b) Quantification of the number of autophagosomes. Autophagosomes were identified based on ultrastructural morphological characteristics. Per cell, the total number of autophagosomes present on the section was counted and expressed per cytoplasmic area covered. One-way ANOVA, with Tukey’s correction range test. Error bars = mean with S.D. *** = p < 0.001 **** = p < 0.0001.
Knockout of HSPB1 leads to a lower autophagic flux and expression of WT HSPB1 rescues the autophagy deficits
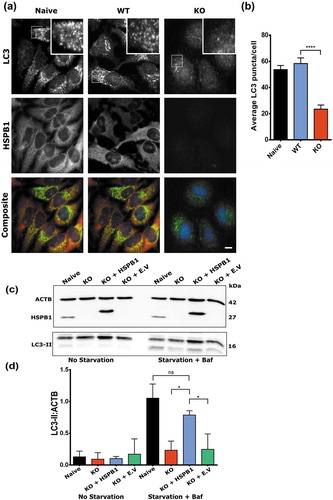
Considering the prominent effect of HSPB1 mutations on the autophagic flux, we investigated whether HSPB1 is required for autophagy. Using CRISPR technology, we knocked out HSPB1 in HeLa cells and then performed automated immunofluorescence microscopy to quantify the number of LC3-positive puncta (autophagosomes) upon autophagy induction. After starvation and bafilomycin A1 treatment, cells lacking HSPB1 exhibited lower levels of autophagosomes compared to the control cell lines (,). We also confirmed our results using western blotting analysis of LC3-II levels (,). Importantly, the LC3-II levels returned to normal upon reintroduction of WT HSPB1 in the CRISPR knockout cell lines via transfection (,), illustrating that HSPB1 is needed for starvation-induced autophagy and that the expression of HSPB1 rescues the reduced autophagy levels in the knockout cell lines.
Figure 3. Knockout of HSPB1 impairs autophagy and expression of WT HSPB1 rescues the phenotype. (a) Immunofluorescence microscopy analysis of naïve, WT HSPB1-expressing (WT), and HSPB1 knockout (KO) HeLa cell lines treated with serum starvation and 10 nM bafilomycin A1. LC3 (green), HSPB1 (red) and the nuclear stain DAPI (blue). Scale bar: 20 µm. (b) Average number of LC3 puncta per cell from more than 500 cells from 3 independent experiments. One-way ANOVA, with Tukey’s correction range test. Error bars = mean with 95% CI, **** = p < 0.001. (c) Western blotting analysis of naïve HeLa cells, HSPB1 KO cells, and KO cells transfected with a plasmid encoding V5-Tagged HSPB1 or an empty vector (E.V). The levels of LC3-II were detected, together with the expression levels of HSPB1. ACTB was used as a loading control. (d) Levels of LC3-II calculated from 3 independent western blotting experiments and normalized to ACTB (loading control). One-way ANOVA, with Tukey’s correction range test. Error bars = mean S.D, * = p < 0.05.
HSPB1 binds to SQSTM1 and the mutant HSPB1 forms show increased binding to SQSTM1
To elucidate how HSPB1 regulates the autophagic flux, HeLa cells stably expressing V5-tagged WT or mutant HSPB1 were used. Cells were grown with or without serum and V5 affinity isolation was performed, followed by LC-MS/MS analysis ()). Following statistical analysis and non-supervised hierarchical clustering, proteins significantly enriched in the HSPB1-expressing samples were identified as interaction partners of: R127W and S135F mutants (cluster 1), WT and all mutants (cluster 2), or the P182L mutant (cluster 3) (Figure S5; Tables S2 and S3). Whereas the pattern of interactors did not differ between starved and fed conditions, the R127W and S135F mutants clustered separately from the P182L mutant (Figure S5(b)). The different interaction partners were then screened using Gene cards (www.genecards.org) and via literature search for their role in autophagy (Table S1). The most relevant autophagy-related interactor detected was SQSTM1, a well-established autophagy component [Citation28,Citation29].
Figure 4. HSPB1 interacts with SQSTM1. (a) Design of the proteomics analysis. (b) Co-immunoprecipitation analysis of HSPB1 followed by western blotting of SQSTM1 in HeLa cells expressing GFP or V5-Tagged WT HSPB1 or mutant (R127W, S135F, P182L). (c) Quantification of the mean gray values of SQSTM1 affinity isolation normalized to HSPB1 levels from 3 different western blotting experiments of V5-HSPB1 immunoprecipitation. One-way ANOVA, with Tukey’s correction range test. Error bars = mean S.D, * = p < 0.05, *** = p < 0.001. (d) Co-immunoprecipitation analysis of HSPB1 followed by western blotting of SQSTM1 in lymphoblasts derived from patients carrying the HSPB1 mutations R127W or P182L and from a healthy control. (e) HeLa cells transduced with wild-type (WT) HSPB1 were immunostained for SQSTM1 and HSPB1. Representative images of the different channels are shown. The box shows the position of the zoomed region. The fluorescence intensity along the indicated line is plotted. Scale bar: 5 µm. AU, arbitrary units. (f) HeLa cells transduced with a lentivirus encoding wild-type HSPB1 and transfected with a plasmid encoding mCherry-SQSTM1 (magenta) were immunostained HSPB1 (green) and processed for expansion microscopy. The overview image is the summed projection of a z-stack of the expanded sample and for each indicated boxed region the XY, YZ and XZ planes are shown. Boxed regions with a SQSTM1/p62 body in the center were selected and the arrowheads indicate the position of cut through the different planes. Scale bar: 2 µm in the expanded sample, which corresponds to a size of approximately 500 nm.
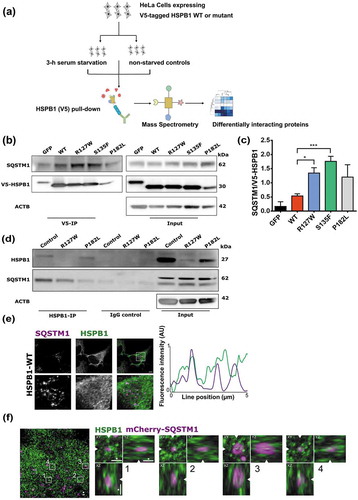
To validate SQSTM1 as an interactor of HSPB1, immunoprecipitation of V5-tagged HSPB1 was performed in HeLa cells expressing V5-tagged WT HSPB1 or the mutant forms (R127W, S135F and P182L). We found that SQSTM1 precipitated with WT and mutant HSPB1 ()). Interestingly, the alpha-crystallin mutant forms of HSPB1 showed increased binding to SQSTM1 compared to the WT in HeLa cells (,). This increased binding feature of HSPB1 mutants to interacting proteins has been reported to be at the center of their functional pathogenicity [Citation9,Citation24]. Additionally, immunoprecipitation of endogenous HSPB1 was performed in lymphoblasts from patients carrying the R127W or P182L mutation, and from a healthy control ()). All the different lymphoblast lines showed co-immunoprecipitation of SQSTM1 with the affinity isolation of endogenous HSPB1 confirming that the HSPB1-SQSTM1 interaction is not an artefact of the V5-tagging.
Next, immunofluorescence microscopy was used to assess the colocalization of SQSTM1-mediated structures, called SQSTM1/p62 bodies, and HSPB1 after autophagy stimulation. Despite the overall abundance of HSPB1 in the cytoplasm, HSPB1 intensity peaks were clearly detected at the site of some SQSTM1/p62 bodies ()). This partial colocalization on a subset of SQSTM1/p62 bodies was similarly observed for cells expressing WT and mutant forms of HSPB1 (Figure S6). Furthermore, when we examined the localization of HSPB1 near SQSTM1/p62 bodies (mCherry-SQSTM1) using expansion microscopy to achieve a resolution below 100 nm, we found that HSPB1 was typically not present inside the core of SQSTM1/p62 bodies, but was mostly accumulating at their periphery ()).
HSPB1 binding to SQSTM1 requires an intact oligomerization domain (PB1)
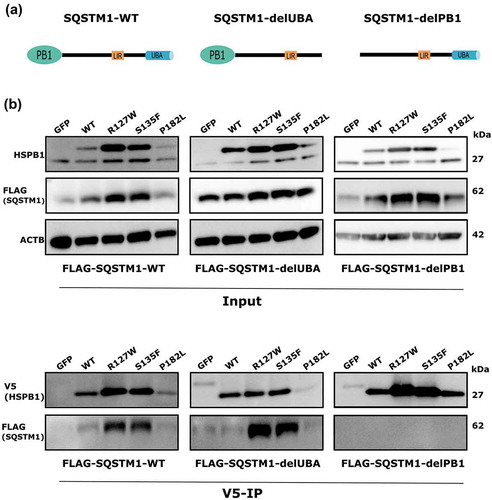
The autophagy receptor SQSTM1 contains 3 domains that are crucial for its function in autophagy: an N-terminal Phox and Bem1 (PB1) domain that mediates its homo- and hetero-oligomerization, an LC3-interacting region (LIR) motif that mediates its interaction with the autophagy protein LC3, and a C-terminal ubiquitin-associated (UBA) domain that binds ubiquitin [Citation30,Citation31]. To test whether HSPB1 binding depends on one of these domains of SQSTM1, HeLa cells stably expressing V5-tagged WT HSPB1 or the mutants (R127W, S135F, P182L) were subjected to SQSTM1 knockdown using shRNA followed by transient transfection of shRNA-resistant FLAG-tagged wild-type SQSTM1 or one of the deletion constructs comprising the PB1 or UBA domains (delPB1, delUBA) ()). Afterwards, HSPB1 was pulled down by immunoprecipitation and SQSTM1 was detected by immunoblotting. While WT SQSTM1 and SQSTM1-delUBA co-immunoprecipitated with HSPB1, we did not detect SQSTM1-delPB1 ()). This shows that deletion of the PB1 domain prevented binding of HSPB1 to SQSTM1, and that HSPB1 requires an intact PB1 domain to bind to SQSTM1. A similar approach was used to study the binding of HSPB1 to SQSTM1 with a mutation in its LIR domain (LIR-MUT); in this case we used mCherry-tagged SQSTM1 constructs (WT SQSTM1 and SQSTM1-LIR-MUT). In both cases SQSTM1 co-immunoprecipitated with HSPB1, ruling out the LIR domain as an interaction domain between SQSTM1 and HSPB1 (Figure S7).
Figure 5. HSPB1 binds to SQSTM1 at the oligomerization domain PB1. (a) Overview of SQSTM1 deletion constructs used. (b) Co-immunoprecipitation analysis of HeLa cells expressing V5-tagged WT HSPB1 or mutant (R127W, S135F, P182L) and FLAG-tagged WT SQSTM1, or delPB1 or delUBA constructs.
HSPB1 mutants display decreased formation of SQSTM1/p62 bodies
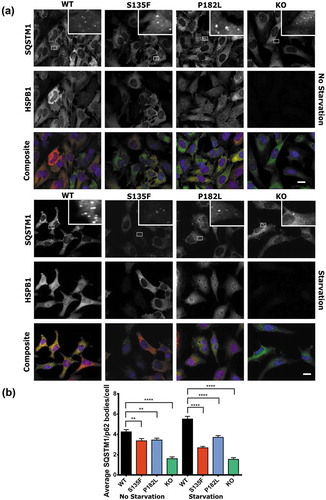
The deletion of the PB1 domain was shown to abolish the formation of SQSTM1-mediated punctate structures (SQSTM1/p62 bodies) and prevent the function of SQSTM1 in autophagy (Figure S8) [Citation32,Citation33]. To investigate whether HSPB1 is required for SQSTM1 puncta formation, we quantified the number of SQSTM1/p62 bodies in HeLa cells expressing WT HSPB1 or the mutant forms (S135F, P182L). Cells expressing mutant forms of HSPB1 showed a significantly lower number of SQSTM1/p62 bodies compared to the WT. This trend was more pronounced after serum starvation treatment (,). Similarly, HeLa cells with CRISPR knockout of HSPB1 showed a lower number of SQSTM1/p62 bodies compared to the WT cells (,). These results show that interaction of HSPB1 with SQSTM1 is necessary for SQSTM1/p62 body formation, which is disrupted by mutations in HSPB1.
Figure 6. HSPB1 mutations and KO lead to decreased formation of SQSTM1/p62 bodies. Immunofluorescence microscopy analysis of HeLa cells expressing WT HSPB1 (WT) or the mutants (S135F and P182L) and of KO cell lines, treated with serum starvation for 3 h or left untreated. (a) Cells were stained for HSPB1 (red), SQSTM1 (green) and DAPI (blue). Scale bar: 20 µm. (b) Quantification of average SQSTM1/p62 bodies per cell. N > 2000 cells from 2 independent experiments. One-way ANOVA analysis with Tukey’s correction test. ** = P < 0.01, **** = p < 0.0001, Error bars are mean with 95% C.I.
HSPB1 mutants display a lower number of phagophores
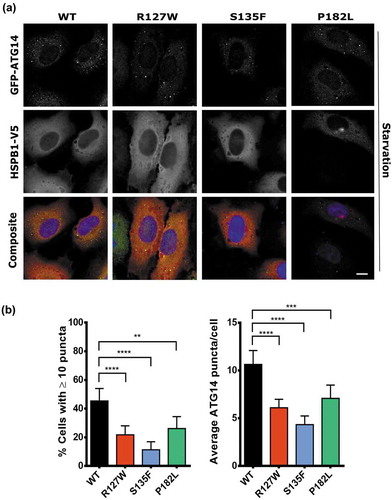
SQSTM1 forms scaffolds of oligomers using its PB1 domain [Citation26]. These scaffolds have been suggested to be important hubs for the nucleation of phagophores, which are then elongated to become mature autophagosomes. To test if HSPB1 mutants then also lead to a decrease in the formation of phagophores, the stable HeLa cell lines were transfected with a plasmid encoding the phagophore marker ATG14 [Citation24,Citation34] tagged to GFP. Using fluorescence microscopy to count the number of GFP-ATG14 puncta formed, we found that mutant cell lines displayed a significantly lower number of phagophores compared to the WT [Citation34] (,). These results were confirmed using another phagophore marker, i.e. WIPI1 (WD repeat domain, phosphoinositide interacting protein 1) tagged to GFP (Figure S9) [Citation35]. These results suggest that the interaction between HSPB1 and SQSTM1 might be important for the function of SQSTM1 in the nucleation of phagophores destined to become autophagic vesicles.
Figure 7. HSPB1 mutants display a lower number of phagophores. HeLa cells expressing WT HSPB1 (WT) or the mutant forms (R127W, S135F, P182L) were transfected with GFP-ATG14 and then subjected to immunofluorescence microscopy. (a) The staining shows ATG14 (green), HSPB1 (red), and the DAPI nucleus stain (blue). Scale bar: 10 µm. (b) Comparison of the percentage of cells with 10 or more ATG14-positive puncta (left graph) and the average number of puncta per cell (right graph). One-way ANOVA, with Tukey’s correction range test. N > 200, error bars = mean with 95% CI, ** = p < 0.01, *** = p < 0.001, **** = p < 0.0001.
Autophagy is impaired in motor neurons differentiated from patient-derived iPSCs
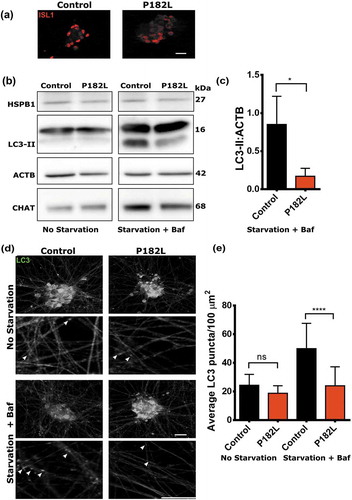
After having established that expression of neuropathy-causing mutations in HSPB1 lead to decreased levels of autophagy, we validated these results in a patient-derived motor neuron model. Induced pluripotent stem cell (iPSC) lines derived from fibroblasts of a patient carrying the P182L mutation were used along with those of a healthy control individual and then differentiated to motor neurons [Citation36]. Successful differentiation was validated by the expression of 2 motor neuron markers, CHAT (choline O-acetyltransferase) and ISL1/ISLET1 (ISL LIM homeobox 1) (,). The motor neuron cultures were treated with nutrient-free medium and the lysosomal inhibitor bafilomycin A1 to induce autophagy or left untreated. The P182L mutant motor neurons displayed lower levels of LC3-II upon treatment compared to those derived from a healthy control, reflecting an impairment in the autophagic flux (,). The formation of autophagic puncta was also examined by immunofluorescence ()). Quantification of LC3 puncta from different neurite-dense areas confirmed the lower autophagic flux in the P182L mutant iPSC lines upon starvation and bafilomycin A1 treatment ()).
Figure 8. Motor neurons differentiated from patient-derived iPSCs show decreased autophagic flux. (a) Immunofluorescence analysis of motor neurons differentiated from iPSCs derived from patient fibroblasts carrying the P182L mutation and from a healthy control. The motor neurons were stained with the neuronal marker ISL1/Islet-1 (red). Scale bar: 20 µm. (b) Western blotting analysis of motor neurons treated and untreated with 3 h starvation and bafilomycin A1. (c) Quantification of the ratio of LC3-II (autophagy marker) over ACTB (loading control) from 3 independent western blotting experiments. Two-tailed t-test, with Tukey’s correction range test. Error bars = S.D, * = p < 0.05. (d) Immunofluorescence staining of the autophagy marker LC3 (green) in motor neurons at 20X and 63X. Scale bar: 20 µm. White arrows indicate LC3-positive puncta. (e) Quantification of LC3 puncta per 100 µm2 neurite area. One-way ANOVA, with Tukey’s correction range test. Error bars = S.D, ns = non-significant, **** = p < 0.0001.
Discussion
In this study, we present evidence that HSPB1 is required for autophagy and that neuropathy-causing mutations in HSPB1 decrease the autophagic flux. We show that the deficit in autophagic flux in HSPB1 knockout cell lines is rescued by the expression of wild-type HSPB1. Furthermore, we identified the autophagy receptor SQSTM1 as an interactor of HSPB1. We show that deletion of the PB1 domain of SQSTM1, necessary for its oligomerization, abolishes the binding of HSPB1. The oligomerization of SQSTM1 is essential to form SQSTM1/p62 bodies and scaffolds that allow the formation of phagophores destined to become autophagosomes [Citation28,Citation37]. We reveal that the ability of SQSTM1 to form SQSTM1/p62 bodies is impaired by neuropathy-causing mutations in HSPB1, which display a decreased formation of phagophores upon starvation.
Autophagy has been recently proposed as a common pathomechanism in inherited neuropathies [Citation16]. Defects in autophagy found in neuropathy-causing mutations may provide an answer to the puzzling question of how mutations in ubiquitously expressed genes can lead to neuron-specific symptoms. The fact that neurons are more vulnerable to defects in autophagy [Citation29,Citation30] suggests that they are more likely to suffer from the defects in this protein degradation pathway. Another important aspect of neuropathic and neurodegenerative disorders is the fact that they aggravate with aging, which directly correlates with the accumulation of dead organelles and aggregating proteins due to failure of pro-degradation processes such as autophagy [Citation31]. While a role for HSPB1 in stimulating the proteasomal degradation of some client proteins has been reported [Citation26,Citation38], we found that only autophagy is impaired by mutations in HSPB1 and by knocking out HSPB1. This might indicate that HSPB1 is more important for autophagic degradation or that its function in proteasomal degradation is limited to certain client proteins.
Our findings are in line with studies showing that other small heat shock proteins might be required for autophagy. As such, HSPB8 and HSPB6 have both been shown to play a role in stimulating the autophagic degradation of protein substrates and organelles [Citation39,Citation40]. In line with our findings, mutations in HSPB6 and HSPB8 causing cardiomyopathy and neuropathy respectively, were found to disturb their ability to stimulate autophagy [18,Citation20]. A key difference in the function of the various HSPB proteins in autophagy might be related to the different autophagy induction routes. While HSPB8 together with the chaperone-assisted selective autophagy complex is activated by the presence of protein aggregates [Citation41], HSPB6 regulates the balance between autophagy and apoptosis [Citation18]. Conversely, in this study, we show that HSPB1 is required for starvation-induced autophagy. Other studies have shown that HSPB1 plays a role in autophagy in infection conditions and in kidney injury [Citation10,Citation11]. HSPB1 also has the ability to interact with other proteins and mediate several functions and pathways in the cell [Citation21], and as such might be necessary for mediating the formation of autophagosomes through interaction with other protein(s) involved in autophagy.
In this study, we have shown that HSPB1 interacts with proteins with known functions in autophagy. Previous studies of the interactome of HSPB1 have ascribed other potential functions to HSPB1, which was presented as a regulatory protein with actions beyond its molecular chaperoning role [Citation3,Citation42,Citation43]. Our results show that the autophagy-regulating protein SQSTM1 is an interactor of HSPB1. Our findings corroborate the results of previous studies showing that mutations in HSPB1 can affect its binding to other proteins and lead to detrimental effects on the functions of these interactors [Citation9,Citation24]. We show that the binding of HSPB1 to SQSTM1 is relevant to the function of the latter in autophagy, and that this interaction is affected by mutations or by knocking out HSPB1 leading to detrimental effects on autophagy. HSPB1 and SQSTM1 modulate similar cellular processes [Citation34,Citation44] and both are involved in the HSF1 (heat shock transcription factor 1) stress response pathway. Whereas HSPB1 is under the transcriptional control of HSF1 [Citation35], the proteostatic activity of SQSTM1 and its phosphorylation status have been recently shown to be regulated by the HSF1 stress response pathway [Citation45]. Intriguingly, mutations in both HSPB1 and SQSTM1 have been associated with ALS [Citation6,Citation46].
Our results show that the binding of HSPB1 to SQSTM1 requires an intact PB1 domain via which SQSTM1 is able to bind to other proteins containing this domain, and to form hetero- and homo-oligomers [Citation47]. The PB1 domain may also be responsible for signalling that does not necessarily involve PB1-PB1 interactions, as is the case with MAPK7/ERK5 kinase, which lacks a PB1 domain yet requires an intact PB1 region of the kinase MAP2K5/MEK5 for their interaction [Citation48]. SQSTM1-positive cytosolic speckles or SQSTM1/p62 bodies are formed of PB1-driven SQSTM1 oligomers and SQSTM1-aPKC complexes [Citation33,Citation49,Citation50]. Deletion of the PB1 domain abolishes the formation of SQSTM1 oligomers and the formation of intracellular SQSTM1/p62 bodies [Citation32,Citation51]. Similarly, depletion of SQSTM1 or introduction of mutations affecting the oligomerization of SQSTM1 have been reported to abolish the formation of LC3-positive autophagosomes [Citation51].
Our results equally point to a decrease in SQSTM1/p62 bodies and in LC3 speckles in cells expressing mutant HSPB1, an interactor of SQSTM1. Several studies have shown that interruption of autophagy, independently of SQSTM1, may lead to accumulation of SQSTM1 puncta in the cells [Citation52], lending support to the notion that in our study SQSTM1 is integral to the impairment of autophagy by mutant HSPB1. The exact way in which the oligomerization of SQSTM1 contributes to the formation of autophagosomes remains unclear. Recently, it has been reported that SQSTM1, through its PB1 domain, forms flexible helical filaments that might be key to the scaffolding of the phagophore membrane and establishing the template for the forming membranes [Citation28]. Our results suggest that HSPB1 might be essential in shaping the phagophore that later develops to form the autophagosome. Because HSPB1 is classically described as a molecular chaperone and a transient stabilizer of other proteins [Citation53], it could be hypothesized that HSPB1 plays a role in the oligomerization, stability or flexible assembly and disassembly of the SQSTM1 scaffolds necessary for phagophore formation, and that this function is prevented by mutations in HSPB1. By confirming the deleterious effect of HSPB1 mutants in patient-derived motor neurons, our study presents strong evidence of autophagy impairment as a pathomechanism of HSPB1-linked neuropathies. Taking into consideration that autophagy has been the target of therapeutic treatment in several neurodegenerative disease conditions [Citation54], this study also identifies autophagy as a possible target for treatment of neuropathic conditions.
Materials and methods
Creation of constructs and stable cell lines
Constructs used to generate stable HeLa and SH-SY5Y cell lines were designed using the Gateway recombination system (Life Technologies). The open reading frames (ORFs) of HSPB1 and EGFP were amplified by PCR using specific primers flanked by attB recombination sites to allow insertion of the PCR product into a pDONR221 vector. The HSPB1 mutations used in this study (HSPB1-R127W, HSPB1-S135F, and HSPB1-P182L) were generated by site-directed mutagenesis. Sequence-validated pDONRs were transferred by recombination to a pLenti6/V5 destination vector (Life Technologies, V49610) to generate constructs in which the ORF is fused to a V5 tag. All plasmids obtained were validated by Sanger sequencing. Stable cell lines were generated by lentiviral transduction of HeLa cell lines or the neuroblastoma cell line SH-SY5Y according to a previously described method [Citation55]. The expression levels and growth rates of the generated cell lines were monitored and shown to be similar (data not shown).
Cell culture material and conditions
The HeLa cell line was purchased from ATCC (CCL-2) and grown at 37ºC and 5% CO2 in MEM (Life Technologies, 11095080) supplemented with 10% fetal calf serum (FCS; Life Technologies, 10270106), 1% glutamine (Life Technologies, 25030149) and penicillin-streptomycin (Life Technologies, 15140122). The human neuroblastoma cell line SH-SY5Y was purchased from ATCC (CRL-2266) and cultured at 37ºC and 5% CO2 in DMEM (Life Technologies, 11966025) supplemented with 10% FCS, non-essential amino acids (Life Technologies, 11140035), glutamine and penicillin-streptomycin (Life Technologies, 15140122). Lymphocytes were obtained from patients through venipuncture and lymphoblastoid cell lines were EBV-transformed and cultivated at 37°C and 6% CO2 in Gibco® RPMI 1640 (Life Technologies, 11875085) supplemented with 15% FCS, sodium pyruvate (Life Technologies, 11360070) and penicillin-streptomycin (Life Technologies, 15140122). Lymphocytes were obtained from an HSPB1-P182L (CMT391.21) patient, an HSPB1-R127W patient (CMT751.01) and a healthy control individual (CEPH1454.14), as described in Evgrafov et al. (2004) [Citation4]. Medical ethical approval to perform our experiments with patient-derived material was obtained from our local medical ethical committees.
alamarBlue® assay
Cells were seeded in a 96-well plate at 20,000 cells per well density and allowed to adhere and grow for 24 h. Eight replicates per cell line were used, together with 8 replicates of no-cell control samples. Ten microliters of alamarBlue® reagent (ThermoFisher Scientific, Y00-100) was added directly to cells in culture medium. The cell culture and reagent mixture were incubated for 2 h at 37°C in a cell culture incubator, protected from direct light. Then the absorbance of alamarBlue® was monitored at 570 nm with 600 nm reference wavelength using a Synergy HT spectrophotometer (BioTek, Bad Friedrichshall, Germany) and the values obtained were normalized to non-cell controls.
Antibodies and plasmids used
The following antibodies were used in this study: anti-HSPB1 (Enzo Life Sciences, ADI-SPA-800), anti-V5 (Life Technologies, R960-25), anti-LC3B (Sigma-Aldrich, L7543), anti-GFP (Abcam, ab6556), anti-SQSTM1 (Cell Signalling Technology, 5114), anti-FLAG (Sigma-Aldrich, F7425), anti-ACTB/beta-Actin (Sigma-Aldrich, A5316), anti-BAG1 (Santa Cruz Biotechnology, sc-376848), anti-BAG3 (ImTec Diagnostics, ab47124), anti-CHAT (Bio-Connect Life Sciences, HPA048547), anti-ISL1/Islet-1 (Abcam, ab109517). The pEGFPC2-DFCP1 plasmid was a kind gift from the group of Prof. Nicholas Ktistakis (Babraham Institute, Cambridge, UK). The pEGFP-ATG14L (deposited by the lab of Prof. Tamotsu Yoshimori, Osaka University, Japan) and the pMXs-IP GFP-WIPI1 (deposited by the lab of Noburo Mizushima, Tokyo Medical and Dental University, Japan) were purchased from Addgene (21,635 and 38,272). The pCS2-FLAG-WT-p62, pCS2-FLAG-deltaUBA-p62, and pCS2-FLAG-deltaPB1-p62 constructs were a kind gift from the group of Prof. Aaron Ciechanover (Technion-Israel Institute of Technology, Haifa, Israel). The mCherry-p62 WT, mCherry-p62 LIR mutant (335 DDDW 338 -> AAAA), and mCherry-p62 ∆BP1 (∆2-102) plasmids were a kind gift from the lab of Prof. Sascha Martens (Max F. Perutz Laboratories, University of Vienna, Vienna Biocenter, Vienna, Austria). shRNAs against SQSTM1/p62 were purchased from Sigma Aldrich and contained the following clone IDs and sequences:(TRCN0000007234,CCGGCGAGGAATTGACAATGGCCATCTCGAGATGGCATTGTCAATTCCTCGTTTTT);(TRCN0000007236,CCGGCCGAATCTACATTAAAGAGAACTCGAGTTCTCTTTAATGTAGATTCGGTTTTT);(TRCN0000007237,CCGGCCTCTGGGCATTGAAGTTGATCTCGAGATCAACTTCAATGCCCAGAGGTTTTT)
The shRNAs against HSPB1 were purchased from GE Healthcare Dharmacon, Inc. and the following clones were used: shRNA752: TRCN0000008752 and shRNA466: Clone ID: TRCN0000011466
Transient transfection and shRNA treatment
HeLa cell lines were transfected using polyethylenimine (PEI; Sigma-Aldrich, 9002-98-6) according to an in-house optimized protocol. Briefly, cells were seeded out in a 24-well plate at 7 × 10⁴ cells per well 24 h before transfection. On the day of transfection, 500 ng plasmid DNA (or shRNA plasmid) was diluted in 36 µl Opti-MEM (Life Technologies, 31985062) and in parallel, 2.5 µl PEI (1 µg/µl) was diluted in 36 µl Opti-MEM. The diluted PEI was then added to the DNA and mixed by vortexing for 10 s. afterwards, the PEI-DNA mix was incubated for 10 min at room temperature, and then added drop-wise onto the cells. Cells were used 24 h post-transfection for plasmid DNA and 48 h post-transfection for shRNA treatment.
Autophagy induction and treatment
Autophagy was induced by serum starvation by culturing cells in culture medium deprived of FCS for the indicated amount of time. Whenever necessary, the lysosomal inhibitor bafilomycin A1 (Enzo Life Sciences, BML-CM110-0100) was used at 10 nM concentration to block lysosomal degradation. For the motor neurons, the culture medium was replaced with medium lacking any supplements or growth factors for 3 h.
Western blotting analysis
Cells were lysed in lysis buffer [0.5% Nonidet P-40 (IGEPAL® CA-630 Sigma-Aldrich I3021), 137 mM NaCl, 2.7 mM KCl, 10 mM Na2HPO4, 1.8 mM KH2PO4, 4 mM sodium orthovanadate, 20 mM glycerol-2-phosphate, 10 mM sodium fluoride, 1 mM sodium pyrophosphate], together with complete protease and Phospho-STOP inhibitor mixtures (Roche Applied Science, 05 892 970 001) for 30 min on ice and cleared by centrifugation for 10 min at 20,817 g force. After the protein concentration had been determined with the Pierce BCA protein assay kit (ThermoFisher Scientific, 23225), cell lysates were boiled for 5 min at 95°C in reducing Laemmli buffer (Life Technologies, NP0007) supplemented with 100 mM 1,4-dithiothreitol (ThermoFisher Scientific, 20290). Proteins were separated on NuPAGE gels (Life Technologies, NP0322BOX) or on 18% gels made in-house (for detection of LC3 isoforms) and transferred to a nitrocellulose membrane HybondTM-P (GE Healthcare Life Sciences, RPN132D). Blocking of the membrane was performed using 5% milk powder diluted in PBS (ThermoFisher Scientific, 14190250), supplemented with 0.1% Tween 20 (ThermoFisher Scientific, 28352). Afterwards, membranes were incubated with a primary antibody overnight at 4°C and with a secondary horseradish peroxidase conjugated antibody (Jackson ImmunoResearch Europe Ltd, goat anti-mouse: 115-035-003, goat anti-rabbit: 111-035-144) for 1 h. Blots were developed by using the enhanced chemiluminescence ECL PlusTM detection system (ThermoFisher Scientific, 32134) and imaged with an Amersham 600 Imager operated with ImageQuant software (GE Healthcare Life Sciences) and using the automated exposure program. As stated in the operating instructions, the automated exposure includes a short pre-exposure to determine the signal intensity. The system then uses this information to calculate which exposure time will give the highest possible signal below saturation to enable accurate quantification of the sample, resulting in unsaturated signals within the linear range. The images were then saved in 16-bit image files. Band intensities were determined by quantifying the mean pixel gray values using ImageJ software [Citation56]. Mean pixel gray values were measured in a rectangular region of interest.
Generation of HSPB1 CRISPR knockout cell lines
Knockout cell lines for HSPB1 were generated according to the protocol of Ran et al. (2013) [Citation57]. In brief, 2 guide RNAs (gRNAs) targeting the first nucleotides after the start codon, were selected based on its specificity score and number of off-targets (online tool MIT, http://crispr.mit.edu). The gRNAs were ordered as phosphorylated primers from IDT (www.idtdna.com) and cloned into the pSpCas9(BB)-2A-Puro (PX459) plasmid (Addgene, 62988; deposited by Feng Zhang). gRNA efficiency was verified by quantifying the reduction in HSPB1 protein expression in HEK293T cells after transfecting the gRNAs with PEI and performing a western blot after 72 h. Next, HeLa cells were transfected in 6-well dishes with the PX459 plasmids using Lipofectamine LTX Plus (Life Technologies, 15338100) and puromycin was added (1 µg/ml) for 72 h. Surviving cells were then serially diluted in a 96-well plate (Greiner Cell Star, 655161) in order to isolate single colonies. After expansion of the single colonies, complete knockout of HSPB1 was assessed by western blotting and the presence of premature stop codons was verified by Sanger sequencing.
Differentiation of motor neurons from iPSC lines
Induced pluripotential stem cells (iPSCs) derived from fibroblasts of a patient with the HSPB1P182L mutation (provided by M. A-G) and a healthy control individual were obtained from the VIB Stem Cell Center, Leuven, Belgium. iPSCs were cultured on Matrigel matrix (VWR biotechnologies, 354234) and in Essential 8 flex medium and supplement (Life Technologies, A2858501) and penicillin-streptomycin. Differentiation of the iPSCs into motor neurons was performed as published by Guo et al. (Citation2017) [Citation36]. In brief, on day 0, the Essential 8 flex medium was removed and iPSCs were detached using collagenase (Stem Cell Technologies, 07902). The cells were then collected by centrifugation (50 g for 3 min) and incubated in a new neuronal medium consisting of neurobasal medium (Life Technologies, 21103049), DMEM/F12 medium (Life Technologies, 11320033) (both media in a 1:1 ratio) in addition to penicillin-streptomycin, N2 supplement (Life Technologies, 17502001), B27 supplement (Life Technologies, 17504044), beta-mercaptoethanol (Life Technologies, 31350010), ascorbic acid (Sigma-Aldrich, 50-81-7), ROCK inhibitor (for embryoid body formation; ThermoFisher Scientific, A2858501), SB (dual SMAD, inhibitor; Bio-Techne, 1614), LDN (dual SMAD inhibitor; Selleck Chemicals, S2618), and CHIR (WNT antagonist, Bio-Techne, 4423/10). The following days the medium was sequentially refreshed or replaced with media containing compounds necessary for motor neuron differentiation as described by Guo et al (2017) [Citation36]. Compounds used include: retinoic acid (Sigma Aldrich, 302-79-4), SAG (Bio-Techne, 4366/1), the growth factors BDNF (Immunosource, CSB-EL016134MO) and GDNF (Immunosource, 21-8506-U002), DAPT (Bio-Techne, 2634/10), LAMA/laminin (Sigma Aldrich, 114956-81-9), ROCK inhibitor, Culture One (CO) supplement (ThermoFisher Scientific, A3320201), and CNTF (Sigma Aldrich, C3710). The differentiated motor neurons were treated and collected at day 22. Medical ethical approval to perform experiments with patient-derived material was obtained from our local medical ethical committees and the corresponding material transfer agreements to obtain the iPSC lines were secured.
Proteasome activity assay
Proteasome activity was measured using a fluorometric proteasome 20S assay kit and according to the supplied protocol (Sigma Aldrich, MAK172). In brief, cells were seeded in 96-well plates at equal density (80,000 cells/well/90 µl medium) and cultured overnight in growth medium. Subsequently, 100 µl of Proteasome Assay Loading Solution was added, and the light-protected 96-well plates were incubated overnight at room temperature. Next, fluorescence intensity was measured using a Synergy HT spectrophotometer at excitation = 490 nm and emission = 525 nm. Blank wells with medium but without cells were used and background fluorescence was corrected by subtracting the blank fluorescence from the fluorescence in the test wells. Comparison between the corrected fluorescence intensities revealed relative proteasome 20S activity.
Co-immunoprecipitation
Cells were lysed in a buffer containing 20 mM Tris-HCl, pH 7.4, 2.5 mM MgCl2, 100 mM KCl, 0.5% Nonidet P-40, together with complete protease inhibitor and were left on ice for 20 min. Sepharose 6B (Sigma Aldrich, 9012-36-6) and V5-coupled protein G beads (Sigma Aldrich, A7345) were used at a 3:1 ratio and incubated overnight at 4ºC together with the protein lysate. Afterwards, beads were pulled down by centrifugation (100 g, 5 min) and repeatedly washed with lysis buffer. Co-immunoprecipitated proteins were sent for LC-MS/MS analysis or, together with total lysates, resolved by SDS-PAGE.
LC-MS/MS analysis
After HSPB1 affinity isolation, washed beads were resuspended in 150 µl trypsin digestion buffer (SigmaAldrich, T6567) and incubated with 1 µg trypsin (Promega, V511A) for 4 h at 37°C. Beads were removed by centrifugation and another 1 µg of trypsin was added to the supernatants to complete digestion overnight at 37°C. Peptides were purified on Omix C18 tips (Agilent, A57003100), dried and redissolved in 20 µl loading buffer (0.1% trifluoroacetic acid in water:acetonitrile [98:2, v:v]) of which 2 µl was injected for LC-MS/MS analysis on an Ultimate 3000 RSLC nano LC (ThermoFisher Scientific, Bremen, Germany) in-line connected to a Q Exactive mass spectrometer (ThermoFisher Scientific). The peptides were first loaded on a trapping column (in-house, 100 μm internal diameter [I.D.] × 20 mm, 5 μm beads C18 Reprosil-HD, Dr. Maisch, Ammerbuch-Entringen, Germany). After flushing the trapping column, peptides were loaded in solvent A (0.1% formic acid in water) on a reverse-phase column (in-house, 75 µm I.D. x 250 mm, 3 µm beads C18 Reprosil-Pur, Dr. Maisch), packed in the needle and eluted by an increase in solvent B (0.1% formic acid in acetonitrile) in a linear gradient from 2% solvent B to 55% solvent B in 120 min, followed by a washing step with 99% solvent B, all at a constant flow rate of 300 nl/min. The mass spectrometer was operated in data-dependent, positive ionization mode, automatically switching between MS and MS/MS acquisition for the 10 most abundant peaks in a given MS spectrum. The source voltage was set at 3.4 kV, and the capillary temperature at 275°C. One MS1 scan (m/z 400−2,000, AGC target 3 × 10⁶ ions, maximum ion injection time 80 ms), acquired at a resolution of 70,000 (at 200 m/z), was followed by up to 10 tandem MS scans (resolution 17,500 at 200 m/z) of the most intense ions fulfilling predefined selection criteria (AGC target 5 × 10⁴ ions, maximum ion injection time 60 ms, isolation window 2 Da, fixed first mass 140 m/z, spectrum data type: centroid, underfill ratio 2%, intensity threshold 1.7xE4, exclusion of unassigned, 1, 5–8, >8 positively charged precursors, peptide match preferred, exclude isotopes on, dynamic exclusion time 20 s). The HCD collision energy was set to 25% normalized collision energy and the poly-dimethyl-cyclosiloxane background ion at 445.120025 Da was used for internal calibration (lock mass).
Protein identification and statistical analysis
Data analysis was performed with MaxQuant (version 1.5.3.30) [Citation58] using the Andromeda search engine with default search settings including a false discovery rate set at 1% at both the peptide and protein level. Spectra were searched against the human proteins in the Uniprot/Swiss-Prot database (database release version of April 2015 containing 20,193 human protein sequences (www.uniprot.org) expanded with the eGFP sequence). Mass tolerances for precursor and fragment ions were set to 4.5 and 20 ppm, respectively, during the main search. Enzyme specificity was set as C-terminal to arginine and lysine, also allowing cleavage at proline bonds with a maximum of 2 missed cleavages. Variable modifications were set to oxidation of methionine residues and acetylation of protein N-termini, phosphorylation of serine, threonine and tyrosine residues and biotinylation of lysine residues. Proteins were quantified by the MaxLFQ algorithm integrated in the MaxQuant software [Citation59]. A minimum ratio count of 2 unique or razor peptides was required for quantification. Further data analysis was performed with the Perseus software (version 1.5.2.6) after loading the protein groups file from MaxQuant. Proteins only identified by site, contaminants and reverse database hits were removed and replicate samples were grouped. Proteins with less than 3 valid values in at least 1 group were removed and missing values were imputed from a normal distribution around the detection limit. For each identified protein, a two-way ANOVA test calculated a -log p-value. Proteins with a -log p-values > 2 were then considered significantly up- or downregulated. The intensities of these significantly regulated proteins were then visualized on a heat map after non-supervised hierarchical clustering.
Immunocytochemistry and immunofluorescence microscopy
Immunostainings were performed according to standard protocols. Briefly, cells were seeded on glass coverslips the day before fixation. Fixation was performed by incubating cells in 4% paraformaldehyde (ThermoFisher Scientific, 28906) or ice cold methanol (Sigma-Aldrich, 67-56-1) for 20 min. Afterwards, cells were permeabilized with 0.1% Triton X-100 (Sigma-Aldrich, 9002-93-1) in phosphate-buffered saline (PBS; ThermoFisher Scientific, 14190250). Blocking was performed with 5% BSA (Sigma-Aldrich, 9048-46-8) diluted in PBS for 1 h, primary and secondary antibodies were incubated for 1 h diluted in 1% BSA in PBS supplemented with 0.1% Tween 20. Nuclear staining was done by using Hoechst33342 (Life Technologies, H3570). Cells were mounted with fluorescent mounting medium (Dako, S3023). Confocal microscopy (, , , , S1, S6, S8 and S9), images were taken on a Zeiss LSM700 laser scanning confocal microscope using a 40 x /1.3 Plan-Neofluar objective. All images used for quantification were acquired using identical fluorescence excitation and detection settings that avoid channel crosstalk. For assays using automated image acquisition ( and ), cells were seeded (15,000 cells per well) in Ibidi µ-Plate IbiTreat 96-well plates (Life Technologies, 89626) and fixed 24 h later in 4% paraformaldehyde. Three replicate wells were used per genotype and immunocytochemical staining was performed as described above. Images were acquired with an automated Nikon Eclipse TiE microscope, equipped with DS-Qi2 camera, PFS3, 40x Plan Fluor 0.75 NA objective (DIC M N2), Spectra X epifluorescence excitation source, motorized stage (Prior) and using the JOBS module of Nikon Elements software (Nikon Instruments Europe B.V.). Per well, 30 randomly positioned multichannel image sets (1608 x 1608 pixels, 4 channels, 0.183 µm pixels) were acquired using the PS3 hardware autofocus. Image analysis and quantification was performed using CellProfiler software [Citation60]. An image analysis pipeline was designed in CellProfiler to automatically quantify the number of punctate structures (LC3-II puncta, SQSTM1/p62 bodies, autophagosomes) per individual cell. To this end, nuclei were segmented using the Hoechst channel (Adaptive thresholding Otsu method), which were used as seeds to segment the cells (Propagation method with global Otsu thresholding). Punctate structures were segmented in the appropriate channel using the global MoG thresholding channel. Standard CellProfiler modules were used for relating the different masks, for measurements of shape and intensity parameters and to create output tables. Statistical analysis was then performed in R and GraphPad Prism.
Expansion microscopy
HeLa cells transduced with HSPB1 (WT) and transfected with mCherry-SQSTM1 were processed for expansion microscopy following a protocol by Chozinski et al, 2016 [Citation61]. Cells were grown on standard cover glasses (12 mm #1.5), fixed for 20 min in 3.2% paraformaldehyde and 0.1% glutaraldehyde (Sigma-Aldrich, 111-30-8) in PBS with 5 min reduction in sodium borohydride (Sigma-Aldrich, 16940-66-2). Standard immunocytochemical staining for HSPB1 was followed by crosslinking for 10 min in 0.25% glutaraldehyde in PBS. Gelation was done in a mixture of 2 M NaCl (Sigma-Aldrich, 7647-14-5), 2.5% (w:w) acrylamide (Sigma-Aldrich, 79-06-1), 0.15% (w:w) N,N’-methylenebisacrylamide (Sigma-Aldrich, 110-26-9), 8.625% (w:w) sodium acrylate (Sigma-Aldrich, 7446-81-3) in PBS with polymerization initiated with TEMED (Sigma-Aldrich, 110-18-9) and APS (ThermoFisher Scientific, 17874). Polymerized gels were incubated for 30 min at 37°C in a digestion buffer containing 8 U/ml proteinase K (ThermoFisher Scientific, 25530049). Cover glasses were removed from the digested gels, which were placed in high volumes (>30 ml) of distilled water that were exchanged at least 5 times until full expansion of the gels. Finally, the gels that had expanded over 4 times in all dimensions were trimmed, positioned in 50-mm diameter glass bottom dishes (WillCo Wells GWSt-5040) and immobilized using 2% UltraPure LMP agarose (Invitrogen 16520-050). Image stacks of the expanded sample were acquired on a Zeiss LSM700 with Plan-Apochromat 63 x /1.40 objective, using 85 nm x 85 nm x 604 nm voxel dimensions (corresponding to approximately 21 nm x 21 nm x 150 nm in a non-expanded sample). Image stacks were registered with the Stackreg plugin [Citation62] in the Fiji distribution of ImageJ [Citation63,Citation64] and XZ and YZ cuts were created after Gaussian Blur (σ = 0.7) noise removal.
Transmission electron microscopy
HeLa cells were grown in 8-well chambered Permanox slides (Nunc, Lab-Tek, C7182-1PAK) and treated to induce accumulation of autophagosomes as described above. Cells were fixed in 0.1 M sodium cacodylate-buffered, pH 7.4, 2.5% glutaraldehyde solution for 2 h at 4°C. After rinsing (3 × 10 min) in 0.1 M sodium cacodylate, pH 7.4 (Sigma-Aldrich, 6131-99-3) containing 7.5% saccharose (Sigma-Aldrich, 57-50-1), they were post-fixed in 1% OsO4 solution (Sigma-Aldrich, 20816-12-0) for 1 h. After dehydration in an ethanol gradient (70% ethanol for 20 min, 96% ethanol for 20 min, 100% ethanol for 2 × 20 min), cells were embedded in EM-bed812 (Electron Microscopy Sciences, EMS14120). Ultrathin sections were stained with uranyl acetate and lead citrate, and examined in a Tecnai G2 Spirit Bio Twin Microscope (FEI, Eindhoven, The Netherlands) at 100 kV.
Autophagosome quantification was performed on blinded samples. Autophagosomes were identified based on ultrastructural characteristics described in [Citation65] and the total number of autophagosomes was counted by visual inspection at 43,000 magnification of the complete cytoplasmic area in the section of the cell. Overview images of each quantified cell were captured at 4300x magnification to measure the covered cytoplasmic area with the imageJ polygon selection tool [Citation56]. In total, 424 autophagosomes were identified in 59 cells with an average cytoplasmic area of 80 µm2 covered per cell.
Statistical analyses
Statistical analyses were performed using Student’s two-tailed t-test or ANOVA. Data were analyzed using the GraphPad Prism statistical program and presented as the mean ± Standard deviation (SD). Values of p < 0.05 were considered significant.
Supplemental Material
Download Zip (6.4 MB)Acknowledgments
The proteomics analysis and the LC-MS/MS runs were outsourced to the VIB Proteomics Core, Ghent, Belgium. The iPSC lines were generated at the Stem Cell Institute, KU Leuven. We also thank Prof. Dr. W. De Vos, Dr. I. Pintelon, and Ms. E. Theuns from the Antwerp Centre for Advanced Microscopy (ACAM) of the University of Antwerp for help with the Nikon high-throughput microscope and the used in this study and the Tecnai G2 Spirit Bio Twin Electron Microscope supported by a HERCULES grant for microscopy infrastructure and for their help in sample preparation for the TEM experiments. This research was supported in part by the University of Antwerp, the Fund for Scientific Research (FWO-Flanders), the Medical Foundation Queen Elisabeth (GSKE), the “Association Belge contre les Maladies Neuromusculaires” (ABMM), the EC 7th Framework Programme under grant agreement number 2012-305121, the ‘Integrated European–omics research project for diagnosis and therapy in rare neuromuscular and neurodegenerative diseases (NEUROMICS)’, the Austrian Science Fund (FWF, P27634 to M.A.G.) and the H2020 grant Solve-RD programme ‘Solving the unsolved rare diseases’ under grant agreement 2017-779257.
Disclosure statement
No potential conflict of interest was reported by the authors.
Supplementary material
Supplemental data for this article can be accessed here.
Related Research Data
References
- Kakkar V, Meister-Broekema M, Minoia M, et al. Barcoding heat shock proteins to human diseases: looking beyond the heat shock response. Dis Model Mech. 2014;7:421–434.
- Haslbeck M, Vierling E. A first line of stress defense: small heat shock proteins and their function in protein homeostasis. J Mol Biol. 2015;427:1537–1548.
- Mymrikov EV, Seit-Nebi AS, Gusev NB. Large potentials of small heat shock proteins. Physiol Rev. 2011;91:1123–1159.
- Evgrafov OV, Mersiyanova I, Irobi J, et al. Mutant small heat-shock protein 27 causes axonal Charcot-Marie-Tooth disease and distal hereditary motor neuropathy. Nat Genet. 2004;36:602–606.
- Echaniz-Laguna A, Geuens T, Petiot P, et al. Axonal neuropathies due to mutations in small heat shock proteins: clinical, genetic, and functional insights into novel mutations. Hum Mutat. 2017;38:556–568.
- Capponi S, Geuens T, Geroldi A, et al. Molecular chaperones in the pathogenesis of amyotrophic lateral sclerosis: the role of HSPB1. Hum Mutat. 2016;37:1202–1208.
- Holmgren A, Bouhy D, Timmerman V. Molecular biology of small heat shock proteins associated with peripheral neuropathies. Chichester: eLS, John Wiley Sons Ltd; 2012. p. 1–10.
- Adriaenssens E, Geuens T, Baets J, et al. Novel insights in the disease biology of mutant small heat shock proteins in neuromuscular diseases. Brain. 2017;140:2541–2549.
- Almeida-Souza L, Asselbergh B, d’Ydewalle C, et al. Small heat-shock protein HSPB1 mutants stabilize microtubules in Charcot-Marie-Tooth neuropathy. J Neurosci. 2011;31:15320–15328.
- Sun P, Zhang S, Qin X, et al. Foot-and-mouth disease virus capsid protein VP2 activates the cellular EIF2S1-ATF4 pathway and induces autophagy via HSPB1. Autophagy. 2018;14:336–346.
- Matsumoto T, Urushido M, Ide H, et al. Small heat shock protein beta-1 (HSPB1) is upregulated and regulates autophagy and apoptosis of renal tubular cells in acute kidney injury. PLoS One. 2015;10(5):e0126229..
- Yang Z, Klionsky DJ. Mammalian autophagy: core molecular machinery and signaling regulation. Curr Opin Cell Biol. 2010;22:124–131.
- Boland B, Nixon RA. Neuronal macroautophagy: from development to degeneration. Mol Aspects Med. 2006;27:503–519.
- Frake RA, Ricketts T, Menzies FM, et al. Autophagy and neurodegeneration. J Clin Invest. 2015;125:65–74.
- Komatsu M, Waguri S, Ueno T, et al. Impairment of starvation-induced and constitutive autophagy in Atg7-deficient mice. J Cell Biol. 2005;169:425–434.
- Haidar M, Timmerman V. Autophagy as an emerging common pathomechanism in inherited peripheral neuropathies. Front Mol Neurosci. 2017;10:1–17.
- Behrends C, Sowa ME, Gygi SP, et al. Network organization of the human autophagy system. Nature. 2010;466:68–76.
- Liu G-S, Zhu H, Cai W-F, et al. Regulation of BECN1-mediated autophagy by HSPB6: insights from a human HSPB6 S10F mutant. Autophagy. 2017;8627:01–56.
- Carra S, Seguin SJ, Landry J. HspB8 and Bag3: A new chaperone complex targeting misfolded proteins to macroautophagy. Autophagy. 2008;4:237–239.
- Carra S, Boncoraglio A, Kanon B, et al. Identification of the Drosophila ortholog of HSPB8: implication of HSPB8 loss of function in protein folding diseases. J Biol Chem. 2010;285:37811–37822.
- Katsogiannou M, Andrieu C, Baylot V, et al. The functional landscape of Hsp27 reveals new cellular processes such as DNA repair and alternative splicing and proposes novel anticancer targets. Mol Cell Proteomics. 2014;13:3585–3601.
- Arrigo AP, Gibert B. HspB1, HspB5 and HspB4 in human cancers: potent oncogenic role of some of their client proteins. Cancers (Basel). 2014;6:333–365.
- Mizushima N, Yoshimori T. How to interpret LC3 immunoblotting. Autophagy. 2007;3:542–545.
- Geuens T, De Winter V, Rajan N, et al. Mutant HSPB1 causes loss of translational repression by binding to PCBP1, an RNA binding protein with a possible role in neurodegenerative disease. Acta Neuropathol Commun. 2017;5:5.
- Zhang X, Chen S, Huang K, et al. Why should autophagic flux be assessed? Acta Pharmacol Sin. 2013;34:595–599.
- Zhang H, Rajasekaran NS, Orosz A, et al. Selective degradation of aggregate-prone CryAB mutants by HSPB1 is mediated by ubiquitin-proteasome pathways. J Mol Cell Cardiol. 2010;49:918–930.
- Gamerdinger M, Hajieva P, Kaya M, et al. Protein quality control during aging involves recruitment of the macroautophagy pathway by BAG3. Embo J. 2009;28:889–901.
- Ciuffa R, Lamark T, Tarafder AK, et al. The selective autophagy receptor p62 forms a flexible filamentous helical scaffold. Cell Rep. 2015;11:748–758.
- Martinez-Vicente M, Cuervo AM. Autophagy and neurodegeneration: when the cleaning crew goes on strike. Lancet Neurol. 2007;6:352–361.
- Gal J, Ström AL, Kwinter DM, et al. Sequestosome 1/p62 links familial ALS mutant SOD1 to LC3 via an ubiquitin-independent mechanism. J Neurochem. 2009;111:1062–1073.
- Menzies FM, Fleming A, Caricasole A, et al. Autophagy and neurodegeneration: pathogenic mechanisms and therapeutic opportunities. Neuron. 2017;93:1015–1034.
- Wurzer B, Zaffagnini G, Fracchiolla D, et al. Oligomerization of p62 allows for selection of ubiquitinated cargo and isolation membrane during selective autophagy. Elife. 2015;4:1–28.
- Itakura E, Mizushima N. Characterization of autophagosome formation site by a hierarchical analysis of mammalian Atg proteins. Autophagy. 2010;6:764–776.
- Garrido C, Brunet M, Didelot C, et al. Heat shock proteins 27 and 70: anti-apoptotic proteins with tumorigenic properties. Cell Cycle. 2006;5:2592–2601.
- De Thonel A, Le Mouël A, Mezger V. Transcriptional regulation of small HSP - HSF1 and beyond. Int J Biochem Cell Biol. 2012;44:1593–1612.
- Guo W, Naujock M, Fumagalli L, et al. HDAC6 inhibition reverses axonal transport defects in motor neurons derived from FUS-ALS patients. Nat Commun. 2017;8:1–14.
- Cha-Molstad H, Yu JE, Feng Z, et al. P62/SQSTM1/Sequestosome-1 is an N-recognin of the N-end rule pathway which modulates autophagosome biogenesis. Nat Commun. 2017;8.
- Parcellier A, Schmitt E, Gurbuxani S, et al. HSP27 is a ubiquitin-binding protein involved in I-kappaBalpha proteasomal degradation. Mol Cell Biol. 2003;23:5790–5802.
- Carra S, Brunsting JF, Lambert H, et al. HspB8 participates in protein quality control by a non-chaperone-like mechanism that requires eIF2α phosphorylation. J Biol Chem. 2009;284:5523–5532.
- Fan GC, Chu G, Kranias EG. Hsp20 and its cardioprotection. Trends Cardiovasc Med. 2005;15:138–141.
- Crippa V, Cicardi ME, Ramesh N, et al. The chaperone HSPB8 reduces the accumulation of truncated TDP-43 species in cells and protects against TDP-43-mediated toxicity. Hum Mol Genet. 2016;25:3908–3924.
- Sun X, Zhou Z, Fink DJ, et al. HspB1 silences translation of PDZ-RhoGEF by enhancing miR-20a and miR-128 expression to promote neurite extension. Mol Cell Neurosci. 2013;57:111–119.
- Doshi BM, Hightower LE, Lee J. The role of Hsp27 and actin in the regulation of movement in human cancer cells responding to heat shock. Cell Stress Chaperones. 2009;14:445–457.
- Moscat J, Diaz-Meco MT. p62 at the crossroads of autophagy, apoptosis, and cancer. Cell. 2009;137:1001–1004.
- Watanabe Y, Tsujimura A, Taguchi K, et al. HSF1 stress response pathway regulates autophagy receptor SQSTM1/p62-associated proteostasis. Autophagy. 2017;13:133–148.
- Teyssou E, Takeda T, Lebon V, et al. Mutations in SQSTM1 encoding p62 in amyotrophic lateral sclerosis: genetics and neuropathology. Acta Neuropathol. 2013;125:511–522.
- Saio T, Yokochi M, Inagaki F. The NMR structure of the p62 PB1 domain, a key protein in autophagy and NF-κB signaling pathway. J Biomol NMR. 2009;45:335–341.
- Nakamura K, Uhlik M, Johnson N. PB1 domain-dependent signaling complex is required for extracellular signal-regulated kinase 5 activation. Mol Cell Biol. 2006;26:2065–2079.
- Jin Z, Li Y, Pitti R, et al. Cullin3-based polyubiquitination and p62-dependent aggregation of caspase-8 mediate extrinsic apoptosis signaling. Cell. 2009;137:721–735.
- Sanz L. The atypical PKC-interacting protein p62 channels NF-kappa B activation by the IL-1-TRAF6 pathway. Embo J. 2000;19:1576–1586.
- Bjørkøy G, Lamark T, Brech A, et al. p62/SQSTM1 forms protein aggregates degraded by autophagy and has a protective effect on huntingtin-induced cell death. J Cell Biol. 2005;171:603–614.
- Korolchuk VI, Mansilla A, Menzies FM, et al. Autophagy inhibition compromises degradation of ubiquitin-proteasome pathway substrates. Mol Cell. 2009;33:517–527.
- Almeida-Souza L, Asselbergh B, De Winter V, et al. HSPB1 facilitates the formation of non-centrosomal microtubules. PLoS One. 2013;8:e66541.
- Rubinsztein DC, Codogno P, Levine B. Autophagy modulation as a potential therapeutic target for diverse diseases. Nat Rev Drug Discov. 2012;11:709–730.
- Salmon P, Trono D. Production and titration of lentivial vectors. Curr Protoc Neurosci. 2006;4:1–24.
- Eliceiri K, Schneider CA, Rasband WS, et al. NIH Image to ImageJ : 25 years of image analysis HISTORICAL commentary NIH Image to ImageJ : 25 years of image analysis. Nat Methods. 2012;9:671–675.
- Ran FA, Hsu PD, Wright J, et al. Genome engineering using the CRISPR-Cas9 system. Nat Protoc. 2013;8:2281–2308.
- Cox J, Mann M. MaxQuant enables high peptide identification rates, individualized p.p.b.-range mass accuracies and proteome-wide protein quantification. Nat Biotechnol. 2008;26:1367–1372.
- Cox J, Hein MY, Luber CA, et al. Accurate proteome-wide label-free quantification by delayed normalization and maximal peptide ratio zxtraction, Termed MaxLFQ. Mol Cell Proteomics. 2014;13:2513–2526.
- Kamentsky L, Jones TR, Fraser A, et al. Improved structure, function and compatibility for cellprofiler: modular high-throughput image analysis software. Bioinformatics. 2011;27:1179–1180.
- Chozinski TJ, Halpern AR, Okawa H, et al. Expansion microscopy with conventional antibodies and fluorescent proteins. Nat Methods. 2016;13:485.
- Thévenaz P, Ruttimann UE, Unser M. A pyramid approach to subpixel registration based on intensity. IEEE Trans Image Process. 1998;7:27–41.
- Rueden CT, Schindelin J, Hiner MC, et al. ImageJ2: imageJ for the next generation of scientific image data. BMC Bioinf. 2017;18:1–26.
- Schindelin J, Arganda-Carreras I, Frise E, et al. Fiji: an open-source platform for biological-image analysis. Nat Methods. 2012;9:676–682.
- Ylä-Anttila P, Vihinen H, Jokitalo E, et al. Chapter 10 Monitoring autophagy by electron microscopy in mammalian cells. Methods Enzymol. 2009;451:143–164.