
ABSTRACT
Patients with triple-negative breast cancer (TNBC) often have a poor prognosis largely due to lack of effective targeted therapy. Using a library of seleno-purines coupled to a high-throughput biochemical enzymatic assays we identified a potent pharmacological enhancer of autophagy (referred herein as SLLN-15) that selectively activated cytostatic macroautophagy/autophagy in TNBC preclinical models. SLLN-15 induced a dose-dependent anti-proliferative activity in the TNBC cell lines MDA-MB-231 and BT-20 via induction of autophagy and autophagic flux. This induction was associated with a selective inhibition of AKT-MTOR signaling. Conversely, rapamycin, a known autophagy inducer and MTOR inhibitor, was unable to duplicate SLLN-15’s effect on TNBC cells. Inhibition of autophagy by siRNA-mediated targeting of the autophagy regulators, BECN1, ATG5 and ATG7 or using 3-methyladenine (3-MA), significantly protected against SLLN-15-induced inhibition of cell viability, further supporting that SLLN-15-induced inhibition of cancer cell proliferation was autophagy-dependent. SLLN-15-induced autophagy in TNBC cells was also associated with decreased AURKA expression, decreased AKT phosphorylation and subsequent blockage of the AKT-MTOR pathway. In vivo, oral SLLN-15 revealed a potent anticancer and anti-metastatic activity in mice bearing TNBC. Altogether, this study describes a novel regulator of mammalian autophagy, with potential utility as an experimental therapeutic for TNBCs.
Abbreviations
3-MA: 3-methyladenine; ATG5: autophagy related 5; ATG7: autophagy related 7; AURKA: aurora kinase A; AURKB: aurora kinase B; BECN1: beclin 1; CQ: chloroquine; DMSO: dimethyl sulfoxide; GAPDH: glyceraldehyde-3-phosphate dehydrogenase; GFP: green fluorescent protein; ERBB2: erb-b2 receptor tyrosine kinase 2; MAP1LC3B/LC3B: microtubule-associated protein 1 light chain 3 beta; MTOR: mechanistic target of rapamycin kinase; PARP1: poly(ADP-ribose) polymerase 1; PI: propidium iodide; SQSTM1/p62: sequestosome 1; TNBC: triple-negative breast cancer
Introduction
Breast cancer is a heterogeneous disease with diverse histologic and molecular subtypes, each having distinct clinical implications. Among the various subtypes, triple-negative breast cancer (TNBC) which represents approximately 15% of breast carcinomas often manifests with an aggressive behaviour and high rates of recurrence [Citation1]. TNBC is biologically distinct from the other breast cancer subtypes due to lack of expression of estrogen receptor, progesterone receptor, as well as overexpression/amplification of human ERBB2/epidermal growth factor receptor type 2. Currently, non-selective chemotherapy remains the cornerstone therapeutic for TNBC but with limited benefits to patients [Citation2,Citation3]. Therefore, development of novel alternative therapeutic approaches is needed for improving TNBC management and outcome.
Macroautophagy (hereafter referred to as autophagy) is an evolutionarily conserved catabolic pathway involved in the degradation of damaged or dysfunctional intracellular components delivered by double-membrane autophagosomes to lysosomes [Citation4]. Autophagy is regulated by various signaling pathways, including PRKA (protein kinase AMP-activated) and MTOR (mechanistic target of rapamycin kinase) signalling [Citation5]. The role of autophagy in the regulation of tumorigenesis remains debated. Depending on tumor types and treatment strategies, autophagy fulfills a dual role, having pro-survival or pro-death properties [Citation6]. On one hand, autophagy can be activated as a cytoprotective mechanism in response to anticancer agents to mediate drug resistance; in this case inhibition of autophagy can achieve therapeutic advantage by sensitizing cells to anticancer agents [Citation7]. On the other hand, autophagy may also function as a pro-death signal to induce autophagic-mediated cell killing (type II programmed cell death), which is a distinct form of caspase-independent cell death in contrast to apoptosis (type I programmed cell death) [Citation8].
Both autophagy inducers and inhibitors have been exploited for therapeutic applications. For instance, autophagy inhibitors such as chloroquine (CQ) or hydrochloroquine (HCQ) have shown promising results in TNBC preclinical models, especially in combination with conventional chemotherapy [Citation9,Citation10], and are undergoing clinical trials (clinicaltrials.gov). In contrast to autophagy inhibitors, therapeutic utility was also reported for autophagy inducers; e.g. Ivermectin, salvianolic acid B or rapamycin. Autophagy inducers have been reported to inhibit cancer cell growth in part by enhancing anti-tumor immunity [Citation11,Citation12]. Therefore, these findings support the potential of utilizing autophagy enhancers as a novel therapeutic strategy in cancer.
In this study, we unveiled the anti-proliferative function of a novel small molecule, SLLN-15, on a panel of TNBC cells in vitro and in vivo. We demonstrateed that SLLN-15 functions by inducing autophagy via the AKT (AKT serine/threonine kinase)-MTOR pathway. SLLN-15 promoted AURKA degradation, resulting in blockade of AKT-MTOR signaling, thereby activating cytostatic autophagy in breast cancer cells. These results support the potential therapeutic utility of autophagy activation by SLLN-15 for TNBC management.
Results
SLLN-15 inhibited TNBC cell growth in vitro and in vivo
Within our quest to develop an effective novel anti-cancer drug for TNBCs, we designed and synthesized a library of novel compounds derived from seleno-purine scaffolds. The initial focus of our screen was aimed to determine the anti-proliferative activity of our synthesized molecules against BT20 and MDA-MB-231 cells. Utilizing our MTT-based high-throughput screen we identified a 4-selenomorpholinophenyl- and tetrahydroselenophene- substituted diamino-purines, namely SLLN15 (Figure 1(a)), as a potent small molecule capable of inhibiting TNBC cells. SLLN-15 was able to equally inhibit the colony formation abilities of several breast cancer cell lines, namely TNBC cells MDA-MB-231, BT20, MDA-MD468 and 4T1, MCF-7 (ERBB2− and SKBR3 (ERBB2+) ()). Subsequent cell-based assays confirmed this small molecule to inhibit the proliferation of two TNBC cell lines, BT-20 and MDA-MB-231. As shown in ), SLLN-15 treatment for 24 h markedly decreased overall cell viability of breast cancer cells in a dose-dependent manner. Under this condition, light microscopy revealed that SLLN-15 induced obvious morphological changes compared to control cells, with the appearance of more detached and shrunken cells (Fig. S1).
Figure 1. SLLN-15 inhibited the growth of breast cancer cells in vitro and in vivo. (a) Structure of SLLN-15. (b) MDA-MB-231 and BT-20 cells were seeded and treated with the indicated concentration of SLLN-15 or DMSO for 7 days. Long-term cell viability of a panel of breast cancer cell lines was measured via clonogenic formation assay. The number of the colonies in each group are quantified as mean± SEM (*, p < 0.05, n = 3). ER: estrogen receptor; PR: progesterone receptor. (c) MDA-MB-231 and BT-20 cells were seeded and treated with the indicated concentration of SLLN-15 or DMSO for 24 h. Short-term cell viability was measured by the MTT assay. Data are presented as mean ± SEM, n = 3. (d and e) Graphs show the primary tumor volume from the BALB/c mice implanted with mouse mammary carcinoma 4T1 cells (left) and SCID mice implanted with MDA-MB-231 cells (right) treated with either vehicle or SLLN-15 (30 mg/kg), 3 times a week for 40 days. Quantification of primary tumor volumes measured at the indicated time points (d) and the weight of primary tumor at time of sacrifice (e) (mean ± SEM, n = 8 BALB/c mice or SCID mice, *p < 0.05). (f) Representative images of H&E staining of lung tissues (left; scale bar: 500 nm) and quantification of the mean number of surface lung metastases from mice implanted with 4T1 or MDA-MB-231 cells treated with either vehicle or SLLN-15 (30 mg/kg) (mean ± SEM, n = 8, *p < 0.05).
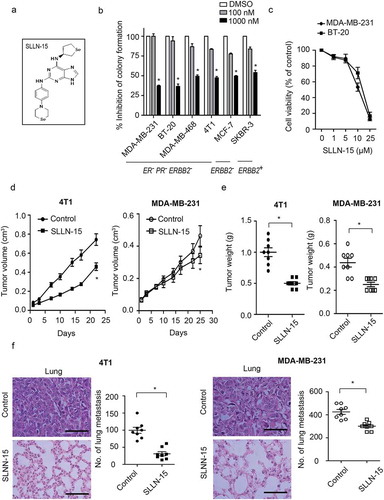
To further evaluate the in vivo efficacy of SLLN-15 in breast cancer, we employed two orthotopic breast cancer models by implanting mouse 4T1 cells and human MDA-MB-231 cells (triple-negative breast carcinoma) into the mammary fat pad of BALB/c or SCID mice respectively. As shown in , tumor allografts from mice treated with 30 mg/kg of SLLN-15 given PO, grew at a slower rate compared to mice treated with vehicle, as revealed by the reduced tumor volumes and weights. Furthermore, significant inhibition of the number of lung metastases, as visualized by a reduction in the number of infiltrating cells (H&E section) and surface lung nodules, was observed in mice treated with SLLN-15, compared with vehicle-treated animals ()). Taken together, these data indicate that SLLN-15 not only inhibited the growth of TNBC in vitro and in vivo, but also TNBC cell progression to metastases.
Treatment of SLLN-15 stimulated autophagy in TNBC
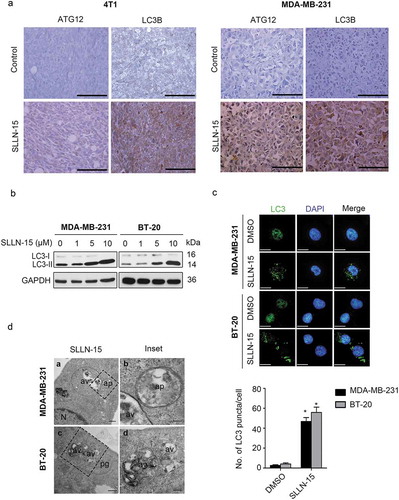
In order to determine whether SLLN-15 affects autophagy in triple-negative breast cancer, we immunohistochemically stained primary tumor tissues from 4T1 and MDA-MB-231 xenografts models with autophagy markers MAP1LC3B/LC3B (microtubule associated protein 1 light chain 3 beta) and ATG12 (autophagy related 12) antibodies (Figure 2(a)). Representative images revealed weak staining in vehicle treated primary breast cancer tissues, while a moderate to strong intracytoplasmic labeling was observed for LC3B and ATG12 in SLLN-15 treated groups (). Next, we investigated the effect of SLLN-15 on the formation of autophagosomes in vitro by detecting the conversion of LC3-I to lipidated LC3-II and the distribution of endogenous LC3 puncta, both classical markers of autophagy regulation [Citation13]. As such, SLLN-15 treatment caused the induction of autophagy as evidenced by increased LC3-II conversion and LC3 puncta, in a dose-dependent manner (). Next, we investigated the expression level of other autophagy markers upon SLLN-15 treatment, including SQSTM1 (sequestosome 1), BECN1/Beclin 1, ATG5 (autophagy related 5) and ATG7 (autophagy related 7), however no changes in their expression levels were observed (Fig. S2). In order to visualize the induction of autophagy by SLLN-15, we then used transmission electron microscopy. As shown in , many of the MDA-MB-231 and BT-20 cells treated with SLLN-15 displayed an accumulation of double or multi-membrane structures, indicative of autophagic vacuoles.
Figure 2. SLLN-15 induced autophagy in breast cancer cells. (a) Representative images of primary tumor tissues from MDA-MB-231 and 4T1 xenografts models treated with vehicle or SLLN-15 (30 mg/kg), immunohistochemically stained with LC3B and ATG12 antibodies (scale bar: 500 nm). (b) MDA-MB-231 and BT-20 cells were treated with either DMSO or the indicated concentration of SLLN-15 for 24 h, lysed, immunoblotted with antibodies against LC3B and GAPDH (internal control). (c) MDA-MB-231 and BT-20 cells were treated with either DMSO or 10 μM SLLN-15 for 24 h, fixed and stained with anti-LC3 antibody (green) and with DAPI (blue) on top (scale bar: 20 μm) and quantification of the number of LC3 puncta per cells (mean ± SEM, n = 30 cells from three independent experiments, *p < 0.05) at the bottom. (d) Autophagy measured by transmission electron microscopy in MDA-MB-231 cells and BT-20 cells treated with 10 μM of SLLN-15 for 24 h. N, nucleus; av, autophagic vacuoles; ap, autophagosome; pg, phagophore (scale bar: 100 nm).
Effect of SLLN-15 on autophagic flux in TNBC cells
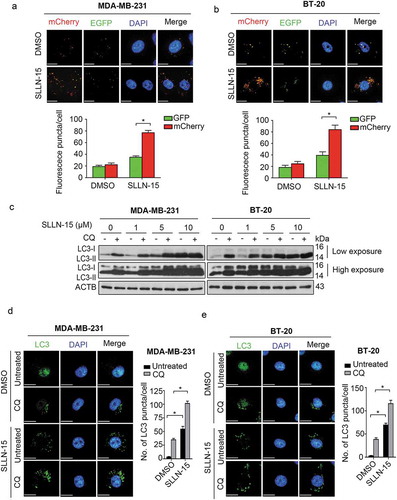
Distinguishing between autophagy inducers and inhibitors is a delicate task, because both cause a build-up of LC3-II and LC3-postive puncta [Citation14]. Therefore, to further determine the role of SLLN-15 on autophagy, we next investigated its impact on autophagic flux using a tandem monomeric mCherry-GFP-tagged LC3. We found increased formation of yellow fluorescence (autophagosomes) and red fluorescence (autolysosomes) in both MDA-MB-231 and BT-20 cells (Figure 3(a,b)). SLLN-15-induced autophagic flux was further examined in the presence or absence of the autophagosome-lysosome fusion inhibitor, chloroquine (CQ) [Citation14]. As shown in , enhanced LC3-II:LC3-I ratio was observed in both MDA-MB-231 and BT-20 cells treated with SLLN-15 combined with CQ, as compared to SLLN-15 alone. This observation was further confirmed by detecting the number of LC3 puncta in SLLN-15-treated cells, as compared to SLLN-15 combined with CQ (). Taken together, these results suggest that SLLN-15 functioned as an autophagy inducer in TNBC cells.
Figure 3. SLLN-15 promoted autophagy flux in breast cancer cells. (a) MDA-MB-231 and (b) BT-20 cells were transiently transfected with mCherry-GFP tandem fluorescent-tagged LC3 (mCherry-GFP-LC3) for 24 h and treated with either DMSO or 10 μM SLLN-15 for another 24 h. Then, cells were fixed and stained with DAPI (blue); scale bar: 20 μm (top). Quantification of the number of fluorescent puncta exhibiting green (GFP) or red (mCherry) fluorescence per cells (bottom) (mean ± SEM, n = 5 cells, *p < 0.05). (c) Lysate from MDA-MB-231 and BT-20 cells treated with DMSO or 10 μM SLLN-15 alone or in combination with 10 μM chloroquine (CQ) for 24 h were immunoblotted with antibodies against LC3B and ACTB/β-actin (internal control). (d) MDA-MB-231 and (e) BT-20 cells were treated with either DMSO or 10 μM SLLN-15 in the presence or absence of CQ for 24 h, fixed and stained with anti-LC3 antibody (green) and with DAPI (blue); scale bar: 20 μm (left). Quantification (right) shows the average number of LC3 puncta per cells (mean ± SEM, n = 30 cells from 3 independent experiments, *p < 0.05).
SLLN-15 downregulated the MTOR pathway
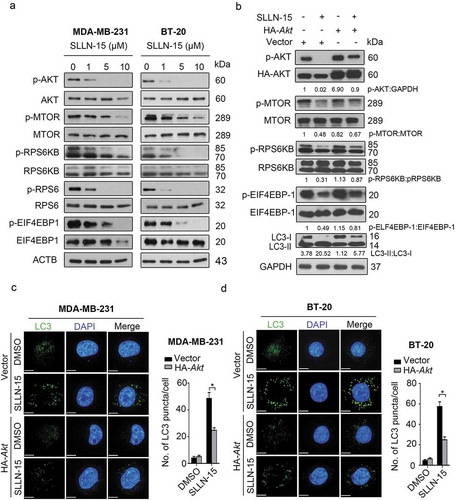
The phosphoinositide 3-kinase-AKT-MTOR pathway is a well-established pathway that is frequently activated in cancer cells and acts as a key negative regulator of autophagy [Citation15,Citation16]. Hence, we examine the role of the AKT-MTOR pathway in SLLN-15-treated MDA-MB-231 and BT-20 cells. As shown in Figure 4(a), SLLN-15 treatment strongly inhibited a panel of regulators in the AKT-MTOR pathway, as evidenced by decreased phosphorylation levels of AKT, MTOR, RPS6KB (ribosomal protein S6 kinase B), RPS6 (ribosomal protein S6) and EIF4EBP1 (eukaryotic translation initiation factor 4E binding protein 1), in both MDA-MB-231 and BT-20 cells. Conversely, SLLN15 had no effect on PRKA or phospho-PRKA expression (data not shown). To further identify the role of AKT in SLLN-15-induced autophagy, we transiently transfect BT-20 cells with pcDNA-HA-AKT plasmids to restore SLLN-15-induced AKT-MTOR inhibition. We found that overexpression of AKT significantly restored the inhibition of downstream regulators, including p-MTOR, p-RPS6KB and p-EIF4EBP1 (). Moreover, AKT activation reduced LC3-II conversion () and LC3 puncta accumulation in MDA-MB-231 and BT-20 cells (), indicating that the induction of autophagy caused by SLLN-15 was in fact via the AKT-MTOR pathway.
Figure 4. SLLN-15 induced autophagy by inhibiting AKT-MTOR signaling proteins. (a) MDA-MB-231 and BT-20 cells were treated with either DMSO or the indicated concentrations of SLLN-15 for 24 h, lysed, immunoblotted with anti-p-S473-AKT, anti-AKT, anti-p-S2448-MTOR, anti-MTOR, anti-p-T421/S424-RPS6KB, anti-RPS6KB, anti-p-S240/244-RPS6, anti-RPS6, anti-p-T37/46-EIF4EBP1 and anti-EIF4EBP1 and ACTB/β-actin (internal control) antibodies. (b) BT-20 cells were transfected with an empty vector (pcDNA3-HA) or pcDNA3-HA-AKT plasmid for 48 h, and then cells were treated with 10 μM of SLLN-15 for another 24 h and immunoblotted with antibodies against p-S473AKT, anti-AKT, p-S2448-MTOR, MTOR, p-T421/S424-RPS6KB, RPS6KB, p-T37/46-EIF4EBP1, EIF4EBP1, LC3B and anti-GAPDH as an internal control. Indicated ratios were calculated using ImageJ software. (c) MDA-MB-231 and (d) BT-20 cells were transfected with an empty pcDNA3-HA (vector) or pcDNA3-HA-AKT plasmid for 48 h, and then cells were treated with 10 μM of SLLN-15 for another 24 h, fixed and stained with anti-LC3 antibody (green) and with DAPI (blue); scale bar: 20 μm (left); quantification on the right showed average number of LC3 puncta per cells (mean ± SEM, n = 30 cells from 3 independent experiments, *p < 0.05.
The anticancer activity of SLLN-15 is achieved via the autophagic pathway
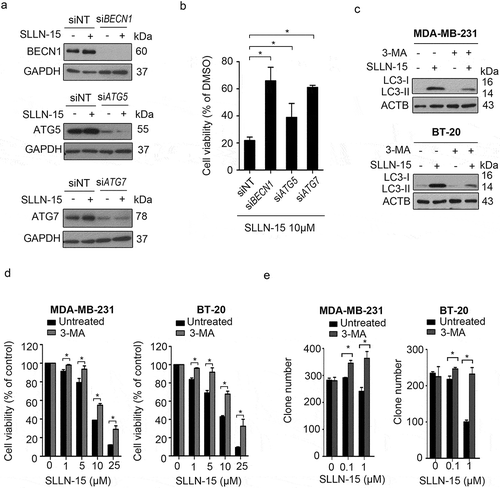
To determine whether the anticancer effect of SLLN-15 in breast cancer cells was through the induction of autophagy, we first used siRNA to silence the expression of key autophagy regulators BECN1, ATG5 and ATG7, followed by treatment with SLLN-15 (Figure 5(a)). As shown in , knockdown of BECN1, ATG5 or ATG7 restored cell viability in SLLN-15 treated BT-20 cells, as compared with scrambled siRNA. Moreover, to explore the link between the inhibition of autophagy and SLLN-15-induced inhibition of cell proliferation, cells were treated in the presence or absence of the autophagy inhibitor 3-MA, a class III phosphatidylinositol 3-kinase inhibitor, that prevents formation of autophagosomes [Citation17], followed by treatment with SLLN-15. The combination of SLLN-15 with 3-MA significantly decreased the LC3-II:I ratio (). Remarkably, autophagy inhibition by 3-MA rescued both short-term and long-term cell viability from SLLN-15-induced anti-proliferative activity as demonstrated in the MTT and clonogenic assay (). These results suggest that induction of autophagy promoted autophagy-mediated inhibition of MDA-MB-231 cells and BT-20 cell proliferation in response to SLLN-15, and inhibition of autophagy counteracted the inhibitory effect of SLLN-15 in these cells.
Figure 5. Inhibition of autophagy repressed the antiproliferative effect of SLLN-15 in breast cancer cells. (a and b) BT-20 cells were transfected with siRNA against control, BECN1, ATG5 or ATG7 (50 nM) for 48 h, and then cells were treated with either DMSO or 10 μM of SLLN-15 for another 24 h. (a) Cells were lysed and immunoblotted with antibodies against BECN1, ATG5, ATG7 and anti-GAPDH as an internal control; (b) the numbers of cells were counted by hemocytometer. The cell viability are presented as % of DMSO treated cells (mean± SEM, * p < 0.05, n = 3) (Cc MDA-MB-231 and BT-20 cells were treated with either DMSO or the indicated concentrations of SLLN-15 alone or in combination with 2 mM 3-methyladenine (3-MA) for 24 h, lysed and immunoblotted with antibodies against LC3B and ACTB/β-actin (internal control). (d) The short-term cell viability of MDA-MB-231 and BT-20 cells treated with the indicated concentration of SLLN-15 or DMSO alone or in combination with 2 mM 3-MA for 24 h was evaluated by the MTT assay. Data are presented as mean ± SEM, n = 3. (e) The long-term cell viability of MDA-MB-231 and BT-20 cells treated with the indicated concentration of SLLN-15 or DMSO alone or in combination with 3-MA for 7 days was measured via clonogenic forming assay. The number of the colony formation in each group is quantified as mean± SEM (*, p < 0.05, n = 3).
SLLN-15 regulated TNBC cell growth but not apoptosis
Considering that apoptosis is the major form of cell death induced by chemotherapeutic agents [Citation18], we seek to identify whether the anticancer effect of SLLN-15 was mediated via apoptosis in breast cancer cells. Therefore, we conducted the MTT assay comparing SLLN-15 and vorinostat, a histone deacetylase (HDAC) inhibitor that can induce apoptosis in cancer cells [Citation19]. As shown in Figure 6(a), both SLLN-15 and vorinostat treatment markedly decreased cell viability in MDA-MB-231 and BT-20 cells in a time-dependent manner. Western blot analysis showed that indicators of apoptosis, including upregulation of cleaved-PARP1 (poly[ADP-ribose] polymerase 1 and cleaved-CASP3 (caspase 3) were only detected in vorinostat-treated cells but not in SLLN-15 treated cells ().
Figure 6. SLLN-15 induced cytostatic autophagy to inhibit the proliferation of breast cancer cells. (a) MDA-MB-231 and BT-20 cells were seeded and treated with 10 μM of vorinostat, SLLN-15 or DMSO for 24 or 48 h. Short-term cell viability was measured by the MTT assay. Data are presented as mean ± SEM, n = 3. (*p < 0.05). (b) MDA-MB-231 and BT-20 cells were treated with 10 μM of vorinostat, SLLN-15 or DMSO for 24 or 48 h, lysed, immunoblotted with antibodies against cleaved-PARP1, cleaved-CASP3 and GAPDH (internal control). (c) MDA-MB-231 cells and BT-20 cells were treated with indicated concentrations of SLLN-15 or DMSO for 24 h. The DNA contents was stained by PI and analyzed by flow cytometry. The graph indicates the percentage of cells at G1 phase (2N), S phase (2N-4N), G2/M phase (4N). (d) MDA-MB-231 and BT-20 cells were treated with either DMSO or the indicated concentration of rapamycin or SLLN-15 for 24 h. Short-term cell proliferation was measured by the BrdU incorporation assay. Data are presented as mean± SEM, n = 3. (*p < 0.05). (e) MDA-MB-231 and BT-20 cells were treated with either DMSO or the indicated concentration of SLLN-15 or rapamycin for 24 h, lysed and immunoblotted with antibodies against p-T421/S424-RPS6KB, p-S473-AKT, p-S240/244-RPS6, LC3B and GAPDH (internal control.
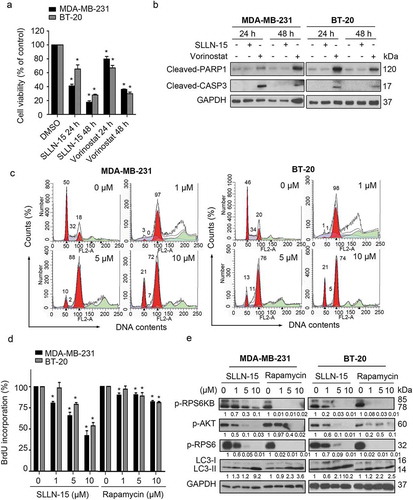
To further determine whether SLLN-15 decreased cell viability by inducing apoptosis or inhibiting cell growth, we used propidium iodide (PI) staining and flow cytometry assays to analyze the DNA contents. As shown in , SLLN-15 treatment for 24 h showed no obvious apoptosis (sub-G1 phase), while a significantly higher percentage of cells arrested in G2/M phase was observed in SLLN-15 treated MDA-MB-231 and BT-20 cells. In addition, a lower percentage of BrdU-positive cells was observed in SLLN-15-treated cells in a dose-dependent manner (). Interestingly, SLLN-15 mediated accumulation of cells in G2/M also occurred in cells expressing siATG5 or siBECN1 (Fig. S3), possibly suggesting the involvement of an autophagy independent mechanism. Compared to the well-known autophagy inducer rapamycin, an MTOR inhibitor that has been tested in various cancer therapies [Citation20,Citation21], SLLN-15 was found to be a more potent anti-proliferation agent () and autophagy inducer, while displaying less MTOR pathway downregulation (). These results indicate that SLLN-15 displayed a profound antitumor effect via inhibition of cell growth in breast cancer cells rather than apoptosis.
SLLN-15 induced autophagy by interfering with the AURKA-AKT-MTOR axis
High-throughput screening of SLLN-15 against a panel of select kinases revealed selective inhibition against 2 kinases, namely AURKA (91% inhibition) and JAK2 (Janus kinase 2) (85% inhibition), at 100 nM screening concentration (Fig. S4A). To further evaluate cellular AURKA kinase inhibitory activity of SLLN-15, western blot analysis was carried out in both MDA-MB-231 and BT-20 cell lines. As shown in Figure 7(a), SLLN-15 strongly inhibited phosphorylation of both AURKA at Thr288 and AURKB at Thr232 but not AURKC at Thr198 at 1 μM. In addition, our data also showed that SLLN-15 treatment decreased both AURKA and AURKB expression in a dose-dependent manner (). To gain further insight into the mechanism underlying the regulation of AURKA and AURKB by SLLN-15, we next examined whether AURKA and AURKB were degraded via the proteasome pathway. As shown in , treatment of MG-132, a proteasome inhibitor, stabilized the protein level of both AURKA and AURKB in MDA-MB-231 and BT-20 cells, suggesting that the decrease of AURKA and AURKB observed post SLLN-15 treatment involved the modulation of the proteasome pathway.
Figure 7. SLLN-15 induced autophagy through downregulation of AURKA-AKT-MTOR axis. (a) MDA-MB-231 and BT-20 cells were treated with either DMSO or indicated concentration of SLLN-15 for 24 h, lysed, immunoblotted with antibodies against AURKA/B/C, AURKA, AURKB and GAPDH (internal control). (b) Lysates from cells treated with either DMSO or 10 μM of SLLN-15 alone or pretreated with MG-132 (2 μM, 24 h) for 24 h were immunoblotted with antibodies against p-AURKA/B, AURKA, AURKB and GAPDH (internal control). (c) BT-20 cells were treated with either DMSO or 10 μM of SLLN-15 for the indicated time, lysed and immunoblotted with anti-p-AURKA/B, anti-AURKA, anti-AURKB, LC3B and GAPDH (internal control) antibodies. (d) 293T cells were transfected with an empty vector (pCMV), pCMV-AURKA or pCMV-AURKB plasmids for 48 h, and then cells were treated with 10 μM of SLLN-15 for another 24 h and immunoblotted with antibodies against FLAG-tag, LC3B, p-S240/244-RPS6, p-S473-AKT, p-T421/S424-RPS6KB and anti-GAPDH as an internal control. (e) 293T cells transfected with an empty vector (pCMV), pCMV- AURKA or pCMV-AURKB plasmids for 48 h were then treated with either DMSO or SLLN-15 (10 μM) for 24 h, fixed and stained with anti-LC3 antibody (green) and with DAPI (blue); scale bar: 20 μm (left); quantification on the right shows the average number of LC3 puncta per cell (mean ± SEM, n = 30 cells from 3 independent experiments, *p < 0.05). (f) 293T cells were transfected with an empty vector (pCMV), pCMV-AURKA or pCMV-AURKB plasmids for 48 h, and then cells were treated with either DMSO or 10 μM of SLLN-15 for another 24 h. Cell viability was measured by the MTT assay. Data are presented as mean ± SEM, n = 6, *p < 0.05).
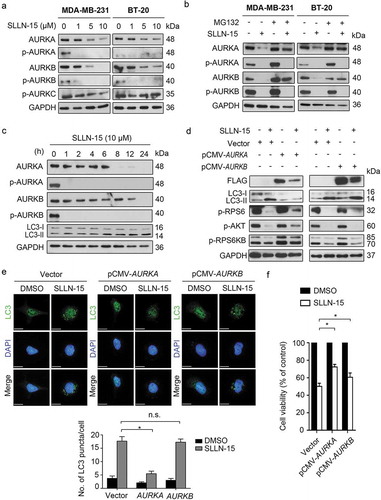
Because AURKA inhibition has been reported to activate autophagy via the AKT pathway in cancer cells [Citation22–Citation24] and that AURKB has also been shown to modulate cancer cell invasion via the AKT pathway [Citation25,Citation26], we then wanted to determine whether SLLN-15-induced regulation of autophagy was mediated via AURKA and/or AURKB. First, our data showed that SLLN-15 downregulated the expression of AURKA at earlier time points (6 h post-treatment), which corresponded to the time point of autophagy activation in BT-20 cells (). Next, to further evaluated the role of AURKA and AURKB in SLLN-15-induced autophagy, LC3 lipidation and LC3 puncta were assessed in pCMV-AURKA or -AURKB overexpressing BT-20 cells, followed by treatment with SLLN-15 or DMSO. As shown in , overexpression of AURKA suppressed the activation of LC3 lipidation and downregulation of AKT-MTOR pathway regulators caused by SLLN-15, but not AURKB. Similarly, only AURKA overexpression impaired SLLN-15-induced accumulation of endogenous LC3 puncta in BT-20 cells (). In contrast, overexpression of AURKA or AURKB partially relieved cells from SLLN-15-induced inhibition () and G2/M arrest (Fig. S5), revealing the possible involvement of distinct regulatory mechanisms. Nonetheless, our results suggest that the SLLN-15-induced autophagy in breast cancer cells is in fact modulated via the AURKA-AKT-MTOR pathway.
Discussion
The autophagy pathway has a broad implication in many physiological and pathological processes, including carcinogenesis. Several studies suggest targeting mediators of autophagy signalling as a promising strategy for cancer drug discovery [Citation27,Citation28]. Although both autophagy upregulation and downregulation have been shown to play roles in carcinogenesis, most studies on therapeutic implications of autophagy have focused on autophagy inhibitors. In general, autophagy is identified as a pro-survival mechanism in cancer cells by removing damaged organelles and recycling the nutrients in response to chemotherapy stress [Citation29]. However, a recent finding revealed that autophagy induced by chemotherapeutic agents may have a suppressive role in cancer, revealing two additional functions of autophagy, namely a ‘cytotoxic function’ that results in autophagic cell death; and ‘cytostatic function’ that results in inhibition of cell growth [Citation30,Citation31]. Furthermore, as highlighted by Dikic and Elazar, autophagy is emerging as a highly selective and powerful pathway with broad implications including impacts on immune function, focal adhesion dynamics, as well as tumor tissue microenvironment. The authors of this review nicely discussed the alternative that autophagy activation rather than inhibition could lead to a therapeutic benefit [Citation32].
In the present study we described SLLN-15, a novel small molecule that targets AURKA, which subsequently leads to trigger autophagy via blockade of the AKT-MTOR pathway. This work demonstrated that the autophagy induced by SLLN-15 plays a cytostatic role and contributes to inhibit breast cancer cell growth and exerts antitumor activity in preclinical TNBC cell models. SLLN-15 inhibited the growth of breast cancer cells, while no significant apoptosis was observed up to 48 h post-exposure and this inhibition was rescued while blocking the autophagy pathway, suggesting that short-term exposure to SLLN-15 induced cytostatic autophagy. Interestingly, although both AURKA and AURKB were downregulated upon SLLN15 treatment, re-expression of AURKB did not rescue SLLN15-induced puncta formation, despite being able to partially rescue against SLLN15-induced inhibition of cell viability and G2/M arrest. Moreover, considering that impairment of autophagy (via expression of siATG5 or siBECN1) does not completely facilitate escape from SLLN-15 mediated G2/M arrest (Fig. S3), allows us to conclude that distinct pathways regulating these biological processes may be involved (as depicted in Fig. S6). Evidence suggesting that nuclear AURKA promotes cancer development independent of its kinase activity further expands SLLN-15’s influence in targeting cancer progression [Citation33,Citation34].
Conventional anticancer therapies primarily trigger cancer cell death via apoptotic inducing pathways. However, certain cancer types, such as TNBC, can bypass the desired cellular apoptosis, leading to chemoresistance and tumor recurrence [Citation35]. Therefore, apoptosis resistance becomes a tremendous challenge in the development of novel anticancer drugs. As an alternative strategy to inhibit cancer cell growth, cytostatic autophagy has been reported to overcome these limitations by decreasing cancer proliferation independent of the apoptotic pathway [Citation36]. Our results show that SLLN-15 has the capacity to decrease TNBC cell viability while inducing cytostatic autophagy, thereby highlighting SLLN-15 as a promising strategy to overcome these barriers by inhibiting the growth of cancer cells regardless of their sensitivity to apoptosis. Nonetheless, unraveling the complex relationship between autophagy and apoptosis in cell fate determination certainly merits additional consideration to fully understand the crosstalk between these tightly regulated biological processes [Citation37].
One of the best characterized autophagy-inducing drugs currently being tested as a therapeutic agent in oncology is rapamycin and its analogues [Citation38]. Rapamycin induces autophagy by inhibiting the MTOR-AKT signalling pathway, which is involved in regulating cell proliferation and autophagy activation [Citation39]. Similar to our findings, Hashimoto I et al. demonstrated that inhibition of CXCR4 (C-X-C motif chemokine receptor 4)-MTOR signalling by rapamycin can lead to autophagic cell death and anti-metastatic activity in gastric cancer models [Citation40]. However, rapamycin’s immunosuppressive abilities, independent of autophagy, hinder its use in certain diseases [Citation41]. Side by side comparison of rapamycin and SLLN-15 revealed the superior ability of SLLN-15 to inhibit TNBC proliferation and this with slightly reduced proficiency at inhibiting the MTOR-AKT pathway. Moreover, SLLN-15’s ability to co-target JAK2 and downregulate the phosphorylation of its downstream regulator STAT3 (signal transducer and activator of transcription 3), a pathway previously demonstrated to be required for the induction of autophagy and cause chemoresistance in brain cancer cells [Citation42], may support SLLN-15’s superiority at activating cytostatic autophagy and inhibiting TNBC proliferation. Recent studies have reported on the efficacy of combining MTOR inhibitors and JAK2 inhibitors, which demonstrated synergistic activity in certain cancer types, including TNBC [Citation43–Citation45]. As such, combination studies investigating the efficacy of SLLN-15 with conventional chemo-agents, similar to current rapamycin/chemo combination trials, where improved drug efficacy and delayed drug resistance is observed [Citation46], merits further examination.
In summary, the current study provides biochemical evidence of a novel small molecule autophagy-enhancer capable of inhibiting the growth of breast cancer cells, at least in part, via induction of cytostatic autophagy. Considering the vast functional nature of autophagy, the potential utility of this molecule extends beyond cancer, as autophagy upregulation has been documented in numerous chronic conditions, such as preventing the accumulation of aggregate-prone cytosolic proteins in neurodegenerative diseases and promoting engulfment/degradation of certain bacterial (Mycobacterium and Streptococcus) and viral infections (herpes simplex) [Citation47].
Materials and methods
Antibodies and reagents
Antibodies used were as follows: primary antibodies: anti-ACTB/β-actin (Santa Cruz Biotechnology, sc-47,778), anti-SQSTM1 (Santa Cruz Biotechnology, sc-48,402), anti-LC3B (Santa Cruz Biotechnology, sc-271,625); anti-phospho-AURKA (Thr288)/B(Thr232)/C(Thr198) (Cell Signaling Technology, 2914), anti-AURKA (Cell Signaling Technology, 14,475), anti- AURKB (Cell Signaling Technology, 3875), anti-cleaved PARP1 (Cell Signaling Technology, 9541), anti-cleaved CASP3/caspase3 (Cell Signaling Technology, 9661), anti-p-S473-AKT (Cell Signaling Technology, 4060), anti-AKT (Cell Signaling Technology, 9272), anti-p-S2448-MTOR (Cell Signaling Technology, 2971), anti-MTOR (Cell Signaling Technology, 2972), anti-p-T421/S424-RPS6KB (Cell Signaling Technology, 9204), anti-RPS6KB (Cell Signaling Technology, 9205), anti-p-S240/244-RPS6 (Cell Signaling Technology, 5364), anti-RPS6 (Cell Signaling Technology, 2217), anti-p-T37/46-EIF4EBP1 (Cell Signaling Technology, 2855), anti-EIF4EBP1 (Cell Signaling Technology, 9644), ATG5 (Cell Signaling Technology, 12,994) and ATG7 (Cell Signaling Technology, 2631), anti-BECN1 (Santa Cruz Biotechnology, sc-48,341) anti-LC3B (Novus Biologicals, NBP1-96,569); anti-GAPDH (Sigma Aldrich Corporation, G9545) and anti-FLAG (Sigma Aldrich Corporation, F1804). Secondary antibodies for western blot assays: anti-mouse IgG-peroxidase-conjugated (Bio-Rad Laboratories, 172–1011), anti-rabbit IgG-peroxiase-conjugated (Bio-Rad Laboratories, 170–6515). Conjugated secondary antibodies: anti-mouse Alexa Fluor 594 (Life Technologies Corporation, A11005) and anti-rabbit Alexa Fluor 488 (Life Technologies Corporation, A11034). Chemicals: MG-132 (Calbiochem Research Biomedicals, 133,407–82-6), chloroquine (CQ) (Sigma Aldrich Corporation, C6628), vorinostat (Sigma Aldrich Corporation, SML0061), DAPI (Sigma Aldrich Corporation, D9542) and 3-methyladenine (3-MA; Sigma Aldrich Corporation, M9281). SLLN-15 (2-(4-selenomorpholinoanilino-6-[(tetrahydroselenophen-3-yl) amino]-purine) was synthesized in 2 steps according to the previously published protocol [Citation48].
Cell culture
The breast cancer cell lines MDA-MB-231 (ATCC®HTB-26), BT-20 (ATCC®HTB-19), 4T1 (ATCC®CRL-2539), MCF-7 (ATCC®HTB-22), MDA-MB-468 (ATCC®HTB-132), SKBR-3 (ATCC®HTB-30) and HEK293T (ATCC®ACS-4500 cells were all obtained from the American Type Culture Collection. MDA-MB-468 was cultured in L-12 medium (Fisher Scientific, 21,127–022) and all other cell lines were maintained in RPMI 1640 (Fisher Scientific, 11–875-093) supplemented with 10% FBS (Wisent Bioproducts, 080–150) and with 1% penicillin and streptomycin antibiotics (Corning Inc., 30–002-CI).
Plasmids construction
pCDNA3-HA-AKT (Addgene, 73,408; deposited by Jie Chen Lab). Plasmids used for transient transfection include pCMV-AURKA and pCMV-AURKB generated by PCR and cloned into the BamHI/XhoI sites of the pCMV-Tag-4A vector (GeneScript). The primer sequences for AURKA are: sense: 5ʹ-CGGGATCCATGGACCGATCT AAAGAAAAC-3ʹ; antisense: 5ʹ-CCGCTCGAGAG ACTGT TTGCTAGCTGATTC-3ʹ; and for AURKB are: sense: 5ʹ-.CGGGATCCATGAGCCGCTCCAATGTCC-3ʹ; antisense: 5ʹ-CCGCTCGAGGGCGACAG ATTGAAGGGC-3ʹ. All plasmids were transfected into BT-20 cells using Lipofectamine LTX and PLUS reagents (Thermo Fisher Scientific, 15,338,100) according to the manufacturer’s instructions.
siRNA gene knockdown
Non-targeted siRNA sequence: sense, 5′-UUCUCCGAACGUGUCACGUdTdT-3′; antisense, 5′-ACGGUGACACGUUCGGAGAAdTdT-3′, BECN1 siRNA sequences: sense, 5′-CUCAAGUUCAUGCUGACGAAUUdTdT-3′; antisense, 5′-UUCGUCAGCAUGAACUUGAG UUdTdT-3′, ATG5 siRNA sequence: sense, 5′-AGAUUGAAGGAUCAACUAUUUUdTdT-3′; antisense, 5′-AAUAGUUGAUCCUUCAAUCUUUdTdT-3′, ATG7 siRNA sequence: sense, 5′-GCCUGCUGAGGAGCUCUCCAUUdTdT-3′; antisense, 5′-UGGAGAGCUCCUCAGCAGGC UU-3′ were synthesized from Dharmacon. Control siRNA or target siRNA oligonucleotides were expressed in cells by incubated with INTERFERin (Polyplus-transfection SA, 409–10) in serum-free RPMI medium according to the manufacturer’s instruction.
Measurement of cell viability
The short-term effects of SLLN-15 on cell metabolic activity were assessed using the 3-(4,5-dimethylthiazol-2-yl)-2,5-diphenylte-trazolium bromide (MTT; Sigma Aldrich Corporation, 298–93-1) assay. Cells were seeded at a density of 5000 cells/well in a 96-well plate and treated with SLLN-15 as indicated concentration or DMSO for 24 h. MTT solution (5 mg/ml in RPMI 1640 medium) was added (20 μl/well), and plates were incubated for 4 h in the dark at 37°C, and the purple formazan crystals were then dissolved in 100 μl MTT solvent (4 mM HCl, 0.1% NP-40 (Sigma Aldrich Corporation, 74,385) in isopropanol). The plates were read on a FLUOstar OPTIMA microplate reader (BMG Labtech, Ortenberg, Germany) at 570 nm. Assays were performed in triplicate in 3 independent experiments.
Colony-formation assay
The long-term effects of SLLN-15 on tumor cell growth were assessed using the colony formation assay. Cells were trypsinized and plated in triplicate wells in a 12-well plate (500 cells/well). After 6 h of incubation, cells were treated with the indicated concentrations of SLLN-15 or DMSO. Seven days after the cells were plated and treated, they were washed and stained with a mixture of 0.05% w:v crystal violet (Sigma Aldrich Corporation, C3886) and 6% v:v glutaraldehyde (Sigma Aldrich Corporation, 340,855), and the colonies > 100 μm in diameter were counted using a colony counter (Oxford Optronix Gelcount, Inc., Milton Park, Abingdon, UK).
BrdU-labeling assay
The proliferation effects of SLLN-15 were assessed using the bromodeoxyuridine (BrdU) Cell proliferation Assay Kit (Biovision Incorporated, K307). Cells were seeded at a density of 5000 cells/well in a 96-well plate and treated with SLLN-15 or rapamycin (Cayman Chemical Company, CAS-53,123–88-9) at the indicated concentration or DMSO for 24 h. The plates were read on a FLUOstar OPTIMA microplate reader (BMG Labtech, Ortenberg, Germany) at 450 nm. Assays were performed in triplicate in 3 independent experiments.
Flow cytometry
Cells were seeded into 6-well plates and treated with the indicated concentration of SLLN-15 for 24 h. After harvesting, cells were fixed in 80% methanol at −20°C overnight. The fixed cells were washed twice with cold phosphate-buffered saline (PBS; Thermo Fisher Scientific, BP243820), incubated for 1 h with 0.1% Triton X-100 (Fisher Scientific, BP151-500) [and 0.5 μg/ml RNase A (Sigma Aldrich Corporation, R6513), and then stained with propidium iodide [PI] (Sigma Aldrich Corporation, P4170) at a final concentration of 10 μg/ml in the dark at 4°C until analysis. The fluorescent signal was detected through the FL-2 channel using FACSCalibur flow cytometry (Becton Dickson, Franklin Lakes, NJ, USA), and the proportion of DNA in various phases was analyzed using ModFit LT 4.1 (Verity Software House).
Electron microscopy
BT-20 and MDA-MB-231 cells were fixed in situ for 1 h at 4°C with 4% glutaraldehyde in 0.1 M sodium cacodylate (Caco) buffer, pH 7.2. Cells were washed and scrapped off the plates, in Caco buffer, and pelleted by low speed centrifugation. The pellets were post-fixed with 1% OsO4 in Caco buffer for 1 h at 4°C and then dehydrated in graded series of ethanol and embedded in Epon (Sigma Aldrich Corporation, 45,345) [Citation49]. Ultrathin sections were obtained using a Reichert Ultracut ultramicrotome and mounted on naked nickel grids. Sections were stain with 2% aqueous uranyl acetate and lead citrate. Examination was performed with a CM100 transmission electron microscope (Philips, Amsterdam, Netherlands). Electron microscopy studies were carried out at the University of Montreal Imaging Facility.
Immunoblotting assay
Subconfluent cells were washed with PBS, lysed in RIPA buffer (50 mM Tris-HCl, pH7.5, 150 mM NaCl, 1% Triton X-100, 0.1% SDS, 2 mM EDTA, 25 mM sodium fluoride) supplemented with 1 mM PMSF and protease inhibitor cocktail (Roche, 4,693,159,001) for 10 min on ice and centrifuged (14,000x g at 4°C for 20 min) to separate the cell lysate. Cell lysate (50 μg protein, as measured by the Bradford protein assay) was then added with SDS sample buffer (175 mM Tris, pH 6.8, 30% glycerol, 10% SDS, 0.02% bromophenol blue, 6% β-mercaptoethanol) and boiled for 5 min. Samples were then resolved through 13% SDS-PAGE gels, transferred to nitrocellulose membrane (MilliporeSigma, IPVH00010), blotted with specific first antibodies at different dilution in cold room overnight, and then amplified with horseradish peroxidase-conjugated secondary antibodies for 1 h in room temperature and enhanced by chemiluminescence detection systems (Thermo Fisher Scientific, 32,106 and 34,095).
Immunofluorescence microscopy
Cells were grown on 18-mm cover glass, placed in 6-well culture plate for 24 h, rinsed in PBS, fixed with 4% paraformaldehyde in PBS for 10 min, washed twice in PBS with 0.2% Triton X-100, blocked in PBS with 0.2% Triton X-100 containing 1% BSA (Bioshop Canada Inc, ALB001) and incubated with primary antibodies overnight at 4°C (all in 1:100 diluted in blocking solution). The cells were washed with PBS containing 0.2% TritonX-100 and subsequently incubated with Alexa Fluor 488-labelled, Alexa Fluor 594-labelled, or Alexa Fluor 647-labelled secondary antibodies (all were used at 1:500 dilution in blocking solution) for 1 h at room temperature. The nuclei were stained with DAPI (0.1 μg/ml) for 5 min before being mounted with aqueous mounting medium. Cells were imaged using WaveFX spinning disk confocal microscope system (Quorum Technologies INC., Guelph, Canada). Images shown are representative of 3 independent experiments.
In vivo allograft model of breast cancer
All experiments were carried out according to protocol number 4101 of the McGill University Animal Care Committee. Mouse mammary carcinoma 4T1 cells and human breast adenocarcinoma MDA-MB-231 cells (1 X 10⁶ cells/each mouse) were transplanted into the mammary fat pad of BALB/c mice or SCID mice. Once a palpable tumor was present mice were treated intraperitoneal with either vehicle or SLLN-15 (30mg/kg), 3 times a week. Tumor size was measured using a caliper, and tumor volume was calculated as π/6 (length X width2). Mice were sacrificed 40 days after transplanting. Tumor tissues were isolated and fixed in 10% formalin. The lungs were fixed in Bouin’s fixative (Fisher Scientific, 11,201) and lung metastatic nodules on the surface were counted using a stereomicroscope (Optimax Imaging Inspection & Measurement Ltd, Leicestershire, United Kingdom).
Immunohistochemistry and haematoxylin and eosin (H&E) staining
IHC and H&E were carried out as described previously [Citation50]. Incubations with the primary antibodies were conducted overnight at 4°C for: anti-LC3B (1:250; Novus Biologicals, NB100-2220) and anti-ATG12 (1:250; Novus Biologicals, NBP2-15,501). The sections were washed and incubated with secondary antibodies (Advanced™ HRP Link, DakoCytomation, K0690, Denmark) followed by the polymer detection system (Advanced™ HRP Link, DakoCytomation). Reactions were developed with a solution containing 0.6 mg/mL of 3,3ʹ-diaminobenzidine tetrahydrochloride (Sigma Aldrich Corporation, 868,272–85-9) and 0.01% H2O2 and then counter-stained with Mayer’s hematoxylin (Sigma Aldrich Corporation, MFCD00078111). Positive controls (a tissue known to contain the antigen under study) were included in all reactions in accordance with manufacturer’s protocols. The negative control consisted in omitting the primary antibody and incubating slides with PBS and replacing the primary antibody with normal serum.
Statistical analysis
All data present as mean ± SEM using Prism 6.0 (GraphPad Software). Statistical significant was analyzed using unpaired two-tailed Student’s t-test or one-way ANOVA. Data were deemed to be statistically significant if P < 0.05.
Supplemental Material
Download Zip (13.2 MB)Acknowledgments
This work was supported by the Quebec Breast Cancer Foundation [grant number 19526]. We would also like to thank the LDI cell imaging and flow cytometry core facility for their assistance.
Disclosure statement
No potential conflict of interest was reported by the authors.
Supplementay Material
Supplemental data for this article can be accessed on the publisher’s website.
Related Research Data
References
- Jemal A, Bray F, Center MM, et al. Global cancer statistics. CA Cancer J Clin. 2011 Mar-Apr;61(2):69–90. PubMed PMID: 21296855.
- Tseng LM, Liu CY, Chang KC, et al. CIP2A is a target of bortezomib in human triple negative breast cancer cells. Breast Cancer Res. 2012 Apr 26;14(2):R68. PubMed PMID: 22537901; PubMed Central PMCID: PMCPMC3446403.
- Pal SK, Childs BH, Pegram M. Triple negative breast cancer: unmet medical needs. Breast Cancer Res Treat. 2011 Feb;125(3):627–636.. PubMed PMID: 21161370; PubMed Central PMCID: PMCPMC3244802.
- Kondo Y, Kanzawa T, Sawaya R, et al. The role of autophagy in cancer development and response to therapy. Nat Rev Cancer. 2005 Sep;5(9):726–734. PubMed PMID: 16148885.
- Galluzzi L, Pietrocola F, Bravo-San Pedro JM, et al. Autophagy in malignant transformation and cancer progression. Embo J. 2015 Apr 1;34(7):856–880. PubMed PMID: 25712477; PubMed Central PMCID: PMCPMC4388596.
- Janku F, McConkey DJ, Hong DS, et al. Autophagy as a target for anticancer therapy. Nat Rev Clin Oncol. 2011 May 17;8(9):528–539. PubMed PMID: 21587219.
- Buchser WJ, Laskow TC, Pavlik PJ, et al. Cell-mediated autophagy promotes cancer cell survival. Cancer Res. 2012 Jun 15;72(12):2970–2979. PubMed PMID: 22505650; PubMed Central PMCID: PMCPMC3505669.
- Tsujimoto Y, Shimizu S. Another way to die: autophagic programmed cell death. Cell Death Differ. 2005 Nov;12(Suppl 2):1528–1534. PubMed PMID: 16247500.
- Lee KH, Hsu EC, Guh JH, et al. Targeting energy metabolic and oncogenic signaling pathways in triple-negative breast cancer by a novel adenosine monophosphate-activated protein kinase (AMPK) activator. J Biol Chem. 2011 Nov 11;286(45):39247–39258. PubMed PMID: 21917926; PubMed Central PMCID: PMCPMC3234749.
- Rao R, Balusu R, Fiskus W, et al. Combination of pan-histone deacetylase inhibitor and autophagy inhibitor exerts superior efficacy against triple-negative human breast cancer cells. Mol Cancer Ther. 2012 Apr;11(4):973–983. PubMed PMID: 22367781.
- Wang K, Gao W, Dou Q, et al. Ivermectin induces PAK1-mediated cytostatic autophagy in breast cancer. Autophagy. 2016 Sep;22(1–2). PubMed PMID: 27657889. DOI:10.1080/15548627.2016.1231494.
- Jing Z, Fei W, Zhou J, et al. Salvianolic acid B, a novel autophagy inducer, exerts antitumor activity as a single agent in colorectal cancer cells. Oncotarget. 2016 Sep 20;7(38):61509–61519. PubMed PMID: 27557491; PubMed Central PMCID: PMCPMC5308668.
- Klionsky DJ, Abdelmohsen K, Abe A, et al. Guidelines for the use and interpretation of assays for monitoring autophagy (3rd edition). Autophagy. 2016;12(1):1–222. PubMed PMID: 26799652; PubMed Central PMCID: PMCPMC4835977.
- Mizushima N, Yoshimori T, Levine B. Methods in mammalian autophagy research. Cell. 2010 Feb 5;140(3):313–326. PubMed PMID: 20144757; PubMed Central PMCID: PMC2852113.
- Schmelzle T, Hall MN. TOR, a central controller of cell growth. Cell. 2000 Oct 13;103(2):253–262. PubMed PMID: 11057898.
- Shi J, Wang H, Guan H, et al. IL10 inhibits starvation-induced autophagy in hypertrophic scar fibroblasts via cross talk between the IL10-IL10R-STAT3 and IL10-AKT-mTOR pathways. Cell Death Dis. 2016 Mar;10(7):e2133. PubMed PMID: 26962683; PubMed Central PMCID: PMCPMC4823945.
- Klionsky DJ, Abeliovich H, Agostinis P, et al. Guidelines for the use and interpretation of assays for monitoring autophagy in higher eukaryotes. Autophagy. 2008 Feb;4(2):151–175. PubMed PMID: 18188003; PubMed Central PMCID: PMCPMC2654259.
- Bai L, Wang S. Targeting apoptosis pathways for new cancer therapeutics. Annu Rev Med. 2014;65:139–155. PubMed PMID: 24188661.
- Kumagai T, Wakimoto N, Yin D, et al. Histone deacetylase inhibitor, suberoylanilide hydroxamic acid (Vorinostat, SAHA) profoundly inhibits the growth of human pancreatic cancer cells. Int J Cancer. 2007 Aug 01;121(3):656–665. PubMed PMID: 17417771.
- Meric-Bernstam F, Gonzalez-Angulo AM. Targeting the mTOR signaling network for cancer therapy. J Clin Oncol. 2009 May 01;27(13):2278–2287. PubMed PMID: 19332717; PubMed Central PMCID: PMCPMC2738634.
- Bjornsti MA, Houghton PJ. The TOR pathway: a target for cancer therapy. Nat Rev Cancer. 2004 May;4(5):335–348. PubMed PMID: 15122205.
- Zou Z, Yuan Z, Zhang Q, et al. Aurora kinase A inhibition-induced autophagy triggers drug resistance in breast cancer cells. Autophagy. 2012 Dec 8;(12):1798–1810. PubMed PMID: 23026799; PubMed Central PMCID: PMCPMC3541289. DOI:10.4161/auto.22110.
- Yang H, He L, Kruk P, et al. Aurora-A induces cell survival and chemoresistance by activation of Akt through a p53-dependent manner in ovarian cancer cells. Int J Cancer. 2006 Nov 15;119(10):2304–2312. PubMed PMID: 16894566.
- Zhang S, Li J, Zhou G, et al. Aurora-A regulates autophagy through the Akt pathway in human prostate cancer. Cancer Biomark. 2017;19(1):27–34. PubMed PMID: 28269749.
- Zhou LD, Xiong X, Long XH, et al. RNA interference-mediated knockdown of Aurora-B alters the metastatic behavior of A549 cells via modulation of the phosphoinositide 3-kinase/Akt signaling pathway. Oncol Lett. 2014 Nov;8(5):2063–2068. PubMed PMID: 25295091; PubMed Central PMCID: PMCPMC4186632.
- Zhu LB, Jiang J, Zhu XP, et al. Knockdown of Aurora-B inhibits osteosarcoma cell invasion and migration via modulating PI3K/Akt/NF-kappaB signaling pathway. Int J Clin Exp Pathol. 2014;7(7):3984–3991. PubMed PMID: 25120775; PubMed Central PMCID: PMCPMC4129010.
- Lebovitz CB, DeVorkin L, Bosc D, et al. Precision autophagy: will the next wave of selective autophagy markers and specific autophagy inhibitors feed clinical pipelines? Autophagy. 2015;11(10):1949–1952. PubMed PMID: 26506897; PubMed Central PMCID: PMCPMC4824567.
- Kenific CM, Debnath J. Cellular and metabolic functions for autophagy in cancer cells. Trends Cell Biol. 2015 Jan;25(1):37–45. PubMed PMID: 25278333; PubMed Central PMCID: PMCPMC4275311.
- Fulda S, Kogel D. Cell death by autophagy: emerging molecular mechanisms and implications for cancer therapy. Oncogene. 2015 Oct 1;34(40):5105–5113. PubMed PMID: 25619832.
- Gewirtz DA. The four faces of autophagy: implications for cancer therapy. Cancer Res. 2014 Feb 1;74(3):647–651. PubMed PMID: 24459182.
- Liu R, Li J, Zhang T, et al. Itraconazole suppresses the growth of glioblastoma through induction of autophagy: involvement of abnormal cholesterol trafficking. Autophagy. 2014 Jul;10(7):1241–1255. PubMed PMID: 24905460; PubMed Central PMCID: PMCPMC4203550.
- Dikic I, Elazar Z. Mechanism and medical implications of mammalian autophagy. Nat Rev Mol Cell Biol. 2018 Jun;19(6):349–364. PubMed PMID: 29618831.
- Otto T, Horn S, Brockmann M, et al. Stabilization of N-Myc is a critical function of Aurora A in human neuroblastoma. Cancer Cell. 2009 Jan 6;15(1):67–78. PubMed PMID: 19111882.
- Zheng F, Yue C, Li G, et al. Nuclear AURKA acquires kinase-independent transactivating function to enhance breast cancer stem cell phenotype. Nat Commun. 2016 Jan;19(7):10180. PubMed PMID: 26782714; PubMed Central PMCID: PMCPMC4735655.
- O’Reilly EA, Gubbins L, Sharma S, et al. The fate of chemoresistance in triple negative breast cancer (TNBC). BBA Clin. 2015 Jun;3:257–275. PubMed PMID: 26676166; PubMed Central PMCID: PMCPMC4661576.
- Lefranc F, Facchini V, Kiss R. Proautophagic drugs: a novel means to combat apoptosis-resistant cancers, with a special emphasis on glioblastomas. Oncologist. 2007 Dec;12(12):1395–1403. PubMed PMID: 18165616.
- Marino G, Niso-Santano M, Baehrecke EH, et al. Self-consumption: the interplay of autophagy and apoptosis. Nat Rev Mol Cell Biol. 2014 Feb;15(2):81–94. PubMed PMID: 24401948; PubMed Central PMCID: PMCPMC3970201.
- Vignot S, Faivre S, Aguirre D, et al. mTOR-targeted therapy of cancer with rapamycin derivatives. Ann Oncol. 2005 Apr;16(4):525–537. PubMed PMID: 15728109.
- Shinojima N, Yokoyama T, Kondo Y, et al. Roles of the Akt/mTOR/p70S6K and ERK1/2 signaling pathways in curcumin-induced autophagy. Autophagy. 2007 Nov-Dec;3(6):635–637. PubMed PMID: 17786026.
- Hashimoto I, Koizumi K, Tatematsu M, et al. Blocking on the CXCR4/mTOR signalling pathway induces the anti-metastatic properties and autophagic cell death in peritoneal disseminated gastric cancer cells. Eur J Cancer. 2008 May;44(7):1022–1029. PubMed PMID: 18375114.
- Sarbassov DD, Guertin DA, Ali SM, et al. Phosphorylation and regulation of Akt/PKB by the rictor-mTOR complex. Science. 2005 Feb 18;307(5712):1098–1101. PubMed PMID: 15718470.
- Pratt J, Annabi B. Induction of autophagy biomarker BNIP3 requires a JAK2/STAT3 and MT1-MMP signaling interplay in Concanavalin-A-activated U87 glioblastoma cells. Cell Signal. 2014 May;26(5):917–924. PubMed PMID: 24462646.
- Bogani C, Bartalucci N, Martinelli S, et al. mTOR inhibitors alone and in combination with JAK2 inhibitors effectively inhibit cells of myeloproliferative neoplasms. PLoS One. 2013;8(1):e54826. PubMed PMID: 23382981; PubMed Central PMCID: PMCPMC3561413.
- Bartalucci N, Tozzi L, Bogani C, et al. Co-targeting the PI3K/mTOR and JAK2 signalling pathways produces synergistic activity against myeloproliferative neoplasms. J Cell Mol Med. 2013 Nov;17(11):1385–1396. PubMed PMID: 24237791; PubMed Central PMCID: PMCPMC4117551.
- Britschgi A, Andraos R, Brinkhaus H, et al. JAK2/STAT5 inhibition circumvents resistance to PI3K/mTOR blockade: a rationale for cotargeting these pathways in metastatic breast cancer. Cancer Cell. 2012 Dec 11;22(6):796–811. PubMed PMID: 23238015.
- Li J, Kim SG, Blenis J. Rapamycin: one drug, many effects. Cell Metab. 2014 Mar 04;19(3):373–379. PubMed PMID: 24508508; PubMed Central PMCID: PMCPMC3972801.
- Floto RA, Sarkar S, Perlstein EO, et al. Small molecule enhancers of rapamycin-induced TOR inhibition promote autophagy, reduce toxicity in Huntington’s disease models and enhance killing of mycobacteria by macrophages. Autophagy. 2007 Nov-Dec;3(6):620–622. PubMed PMID: 17786022.
- Perreira M, Jiang JK, Klutz AM, et al. “Reversine” and its 2-substituted adenine derivatives as potent and selective A3 adenosine receptor antagonists. J Med Chem. 2005 Jul 28;48(15):4910–4918. PubMed PMID: 16033270; PubMed Central PMCID: PMCPMC3474371.
- Luft JH. Improvements in epoxy resin embedding methods. J Biophys Biochem Cytol. 1961 Feb;9:409–414. PubMed PMID: 13764136; PubMed Central PMCID: PMCPMC2224998.
- Da Silva SD, Marchi FA, Xu B, et al. Predominant Rab-GTPase amplicons contributing to oral squamous cell carcinoma progression to metastasis. Oncotarget. 2015 Sep 8;6(26):21950–21963. PubMed PMID: 26110570; PubMed Central PMCID: PMCPMC4673138.