
ABSTRACT
Autophagosome-lysosome fusion is a common critical step in various forms of macroautophagy/autophagy including mitophagy, the selective degradation of mitochondria. Regulations of this fusion process remain poorly defined. Here we have determined the role of SIGMAR1, a unique endoplasmic reticulum membrane protein. Knockout of Sigmar1 impaired mitochondrial clearance without altering the PINK1-PRKN/Parkin signaling, in mouse retinal explants and cultured cells treated with carbonyl cyanide m-chlorophenyl hydrazone (CCCP) for induction of mitophagy. SIGMAR1 depletion also caused accumulation of autophagosome markers LC3-II and SQSTM1, but did not change the levels of BECN1 and ATG7, proteins associated with autophagosome biogenesis. Lysosomal pH and protease activities were not negatively affected. However, sigmar1 knockout partially compromised autophagosome-lysosome fusion in CCCP-treated NSC34 cells, as revealed by reduced GFP fluorescence quenching of GFP-RFP-LC3-II puncta and co-localization of lysosomes with mitochondria. Furthermore, SIGMAR1 co-immunoprecipitated with ATG14, STX17, and VAMP8 (but not SNAP29), proteins key to autophagosome-lysosome membrane fusion. Re-expressing SIGMAR1 in the null background rescued clearance of mitochondria and autophagosomes. In summary, we started out finding that sigmar1 knockout impaired the clearance of mitochondria and autophagosomes, and then narrowed down the SIGMAR1 modulation to the autophagosome-lysosome fusion step. This study may shed new light on understanding autophagy-associated cyto-protection and disease mechanisms.
Abbreviations: APEX2, a genetically engineered peroxidase; BiFC, bimolecule fluorescence complementation; CCCP, a mitophagy inducing compound; CRISPR, clustered regularly interspaced short palindromic repeats; EM, electron microscopy; ER, endoplasmic reticulum; MAP1LC3/LC3, microtubule-associated protein 1 light chain 3; SIGMAR1, sigma non-opioid intracellular receptor 1.
Introduction
Autophagy is a lysosome-mediated mechanism that degrades and recycles cellular wastes including proteins, lipids, and dysfunctional organelles [Citation1–Citation3]. Mitophagy is the selective autophagic degradation of mitochondria [Citation4–Citation6]. These highly regulated processes play important roles in aging and diseases [Citation7,Citation8]. Autophagy is characterized by the formation (biogenesis) of phagophores that engulf cellular wastes (cargo), mature into autophagosomes and fuse with lysosomes wherein cargo is degraded. Thus, autophagosome-lysosome fusion is a critical step for final clearance of autophagic cargo such as damaged mitochondria that are otherwise harmful to the cell. While the mechanisms of autophagosome biogenesis have been intensively studied, regulations of autophasome-lysosome fusion remain poorly understood [Citation9].
SIGMAR1 is a putative chaperone protein [Citation10] primarily residing in the membranes of endoplasmic reticulum (ER) and nuclear envelope [Citation11,Citation12]. This receptor is unique in that it does not share sequence homology with any other mammalian proteins [Citation13]. SIGMAR1 modulates a variety of signaling pathways including ion channels, GPCRs, lipid rafts, ER stress response [Citation14,Citation15], as well as chromatin remodeling [Citation16]. Studies including our own [Citation17,Citation18] support a protective role of SIGMAR1 in neurodegenerative diseases [Citation19–Citation24] and SIGMAR1 mutations are linked to familial amyotrophic lateral sclerosis (ALS) [Citation21,Citation25]. The crystal structure of human SIGMAR1 has been recently solved [Citation26]. In spite of these advances, the function of SIGMAR1 is not well understood at the molecular level [Citation15], especially in autophagy.
Knockdown of SIGMAR1 with siRNAs led to accumulation of autophagosomes and enhanced ER stress in NSC34 neuronal cells [Citation27,Citation28]; SIGMAR1 antagonists elevated autophagosome marker LC3-II in cancer cells [Citation29] and in astrocytes [Citation30,Citation31]. In addition, targeted siRNA screens in the RPE1 cell line also predicted SIGMAR1 as one of the autophagy regulators [Citation32]. However, important mechanistic questions remain regarding the role of SIGMAR1 in autophagy. Given the critical importance of mitophagy/autophagy in cellular functions and human health, it is imperative to investigate the molecular role of SIGMAR1 in these processes.
Since it has never been clearly addressed whether SIGMAR1 regulates mitophagy [Citation33], the mitochondria-specific autophagy, we first set out to determine the role of SIGMAR1 in mitochondrial clearance. To confirm the results, we performed experiments in parallel using sigmar1 knockout retinal tissues and CRISPR-mediated knockout and knockdown cell lines as well as primary cells isolated from sigmar1 knockout mice. We found that SIGMAR1 deficiency impaired the clearance of mitochondria under the treatment with carbonyl cyanide m-chlorophenyl hydrazone (CCCP), a mitophagy inducer, and accelerated apoptosis. We then narrowed down the underlying mechanism to partial blockage of the autophagosome-lysosome fusion step. Our results identify SIGMAR1 as a novel modulator of this autophagic organelle fusion event.
Results
Knockout and inducible knockdown of SIGMAR1 using the CRISPR-Cas9 technology
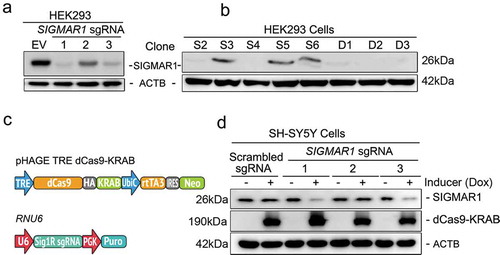
To unambiguously define the role of SIGMAR1 in mitophagy, we used several tissue and cell model systems. 1) Retinal explants or mouse embryonic fibroblasts (MEFs) were isolated from wild type (WT) and sigmar1 knockout (KO) mice. 2) SIGMAR1 KO HEK293 () and NSC34 [Citation34] cell lines were generated using a CRISPR-Cas9 genome-editing approach via lentiviral expression of nuclease-active Cas9 and SIGMAR1/Sigmar1 gRNAs. SIGMAR1/Sigmar1 KO single clones were selected. 3) To induce SIGMAR1 knockdown, we used a lenti-vector to express SIGMAR1 gRNA and nuclease-deficient Cas9 (dCas9) fused to a transcription repressor (KRAB), which suppresses SIGMAR1 expression in a targeted manner ()). We achieved ~90% SIGMAR1 knockdown in SH-SY5Y cells 3 d after doxycycline induction ()), which is highly efficient especially considering slow turnover of the SIGMAR1 protein [Citation35].
Figure 1. Generation of SIGMAR1 knockout and inducible knockdown cell lines with CRISPR-Cas9.
(a and b) Identification of effective SIGMAR1 sgRNAs and selection of SIGMAR1 KO HEK293 cell single clones. CAS9-positive cells were enriched with 1µg/ml puromycin for 7 d. Cells expressing sgRNA No.1 were used for serial dilution and single clone selection. (c and d) Lentiviral constructs and inducible SIGMAR1 knockdown in SH-SY5Y cells. Transduced cells were selected with 1µg/ml puromycin and 200µg/ml G418 for 7 d to eliminate dCas9-KRAB and sgRNA negative cells. Resistant cells were treated with 1µg/ml doxycycline (DOX) for 5 d to induce SIGMAR1 knockdown. HA-tagged dCas9-KRAB was detected using an anti-HA antibody. sgRNA No.3 was chosen for experimental use throughout.
Mitochondria clearance is impaired in sigmar1 KO mouse retinal explants and sigmar1 KO cells
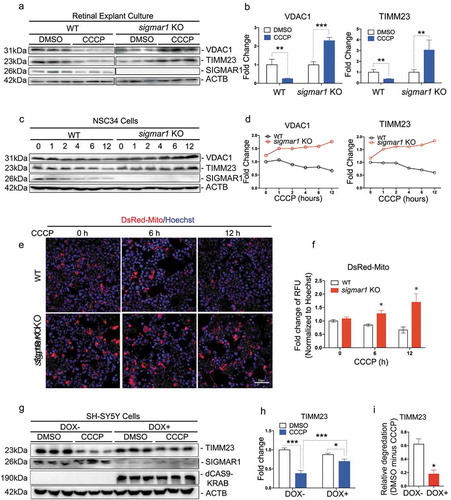
In recent studies [Citation36–Citation38], mitophagy has been generally induced by treating cells with low-dose carbonyl cyanide m-chlorophenyl hydrazone (CCCP), a mitochondrial uncoupler, followed by western blot assay to measure expression of mitochondrial marker proteins VDAC1 and TIMM23. These two markers decrease upon lysosomal degradation of mitochondria (i.e., mitophagy), thus their accumulation serves as readouts of impaired mitophagy. As shown in , A and B, in WT retinal explants, VDAC1 and TIMM23 were both substantially reduced in similar proportions 24h after CCCP induction of mitophagy. However, in KO retinal explants these two markers did not decrease, but rather increased 2–3 fold after CCCP treatment. We confirmed this finding in the NSC34 neuronal cell line (). Consistently, while VDAC1 and TIMM23 continuously decreased in WT cells during the time course of CCCP treatment, they accumulated in KO cells during the 1–12h treatment. This accumulation was also observed via fluorescent imaging of DsRed-Mito labeled mitochondria in KO (vs WT) NSC34 cells following CCCP treatment (). These opposite results (KO vs WT) suggest impaired mitophagy in KO cells. To further confirm a specific role of SIGMAR1 in mitophagy, we SIGMAR1 Sig1R knockdown in the SH-SY5Y neuronal cell line ()). We found that mitophagy was impaired also by SIGMAR1 knockdown (), as indicated by substantially reduced relative degradation of TIMM23 (difference between CCCP and DMSO conditions) in knockdown cells (vs WT) ()). While CCCP caused TIMM23 level changes in opposite directions in SIGMAR1 KO and WT cells (), the TIMM23 changes were not in opposite directions in SIGMAR1 knockdown and WT cells ()). This likely reflects a lesser impact of induced knockdown compared to permanent KO. The combined results from three experimental models demonstrate that SIGMAR1 modulates outcomes of mitophagy.
Figure 2. Mitophagy is inhibited in SIGMAR1-deficient retinal explants and neuronal cell lines.
(a and b) Western blot and quantification of VADC1 and TIMM23 in WT and sigmar1 KO retinal explants treated with vehicle (DMSO) or 40µM CCCP for 24 hours. (c and d) Western blot and quantification of VDAC1 and TIMM23 in WT and sigmar1 knockout NSC34 cells at various CCCP (20µM) treatment time points. (e and f) Fluorescent imaging and quantification of mitochondria in NSC34 cells. Mitochondria were labeled with DsRed-Mito via transfection. (G and H) Western blot and quantification of TIMM23 in SH-SY5Y cells of inducible Sig1R knockdown. Cells were pretreated with DOX (1µg/ml, 5 d) to induce knockdown, and then treated with CCCP (20µM, 12h) in the presence of 1µg/ml DOX. (I) Relative degradation was calculated as the difference of TIMM23 levels (between DMSO and CCCP in H). Student's t-test or two-way ANOVA were used; mean ± SD, n = 3; *p < 0.05, **p < 0.01, ***p < 0.001. In each graph, fold changes were calculated vs the basal condition of WT without CCCP. Throughout this study, each of the triplicate bands corresponds to retinas dissected from one of three mice or cells collected from one of three separate experiments using different dishes. Protein band intensity was normalized to ACTB.
The PINK1-PRKN/Parkin pathway in mitophagy is not affected by sigmar1 KO
Thus far, the PINK1-PRKN/Parkin pathway is the best characterized early event of mitophagy [Citation39]. Membrane depolarization in damaged or dysfunctional mitochondria leads to PINK1 stabilization on the outer membrane. PINK1 then activates the E3 ubiquitin ligase activity of PRKN and its recruitment from the cytosol to mitochondria. Activated PRKN ubiquitinates mitochondrial outer membrane proteins, which trigger phagophore engulfment and lysosomal degradation of mitochondria [Citation40].
To determine whether PINK1-PRKN signaling was affected by sigmar1 KO, we transfected NSC34 cells to express both EGFP-PRKN and DsRed-Mito. Fluorescence microscopy illustrated homogeneous distribution of EGFP-PRKN in the cytosol in the absence of the mitophagy inducer CCCP (DMSO condition; ))(Figure S1). In contrast, 4h after CCCP treatment, EGFP-PRKN staining patterns became punctate and mostly overlapping with mitochondrial marker DsRed-Mito, indicating PRKN recruitment to mitochondria. We counted the number of cells that showed EGFP-PRKN/DsRed-Mito overlapping (indicative of PRKN recruitment), and did not see a difference between WT and KO ()). Thus, the PINK1-PRKN pathway appeared unaffected by the absence of SIGMAR1. Reinforcing this conclusion, levels of stabilized PINK1 protein (the long variant) were similar in WT and KO cells during the 12-h CCCP treatment to induce mitophagy ()).
Figure 3. Early stage mitophagy PINK1-PRKN signaling is not affected by the knockout of Sigmar1.
(a and b) Live cell fluorescence imaging and quantification of PRKN recruitment. WT and Sig1R KO NSC34 cells were treated with vehicle or CCCP for 4h at the end of 48-h co-transfection with EGFP-PRKN and DsRed-Mito. For quantification, cells that showed EGFP-PRKN translocation to mitochondria (punctate fluorescence) were counted. (C) Western blot of PINK1 in WT and KO NSC34 cells at indicated time points of CCCP treatment. Long: full-length; short: cleaved. (d and e) Live cell fluorescence imaging and quantification of mitochondria-positive autophagosomes. WT and sigmar1 KO NSC34 cells were treated with CCCP for 6h at the end of 48-h co-transfection with EGFP-LC3 and DsRed-Mito. Co-localization was assessed with Pearson’s correlation coefficient. Twenty-seven cells were used for quantification in each group.
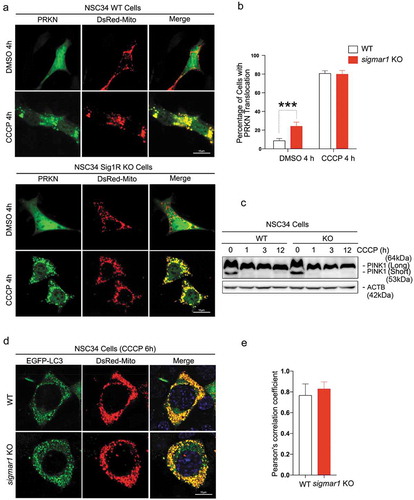
We then evaluated whether the next stage of mitophagy, the engulfment of mitochondria by autophagosomes, was disturbed by Sigmar1 KO. We co-transfected EGFP-LC3 and DsRed-Mito into NSC34 cells and induced mitophagy with a 6-h CCCP treatment. Upon autophagosome maturation, EGFP-LC3 becomes lipidated and associates with phagophore membranes. It appears punctate [Citation41], and yellow if co-localizing with DsRed-Mito (engulfed mitochondria) ()). Quantification of mitochondria-phagophore/autophagosome co-localization using Pearson’s correlation coefficient did not show a significant difference between WT and KO cells ()). Thus, shows that neither PINK1-PRKN signaling nor mitochondria engulfment by autophagosome was disrupted by Sigmar1 KO.
Autophagosome clearance is impaired in sigmar1 KO mouse retinal explants and KO cells
After mitochondria engulfment by phagophores, mitophagy merges into autophagic flux, which features constant generation (biogenesis) and lysosomal degradation of autophagosomes and cargos therein [Citation2]. As such, mitophagy is an integral process of autophagy and disturbed autophagy alters outcomes of mitophagy [Citation42]. To further dissect the causal mechanism of mitophagy impairment due to SIGMAR1 loss, we evaluated the impact of Sigmar1 KO on autophagy. We measured ()) protein levels of LC3-II, a commonly used autophagosome marker, and also SQSTM1 which ‘tags’ waste proteins for autophagic degradation [Citation41]. To determine whether SIGMAR1 plays a general role in autophagy, the experiments were first carried out in the basal condition without CCCP treatment. In KO retinal explants, these two proteins were at least 2-fold higher than WT controls. This result was replicated in non-neuronal (HEK293) as well as neuronal (NSC34) Sig1R KO cells vs WT cells ()). A similar result was obtained by calculating the LC3-II:LC3-I ratio. While the LC3-II:LC3-I ratio is often used to monitor the conversion of cytosolic LC3-I to the lipidated form (LC3-II, localized on autophagosomes), impaired autophagosome-lysosome fusion, and hence impaired degradation of LC3-II, also contributes to an increase in this ratio. We also observed significantly more accumulation of LC3-II in SIGMAR1 knockdown SH-SY5Y cells compared to control cells (DOX+ vs DOX-, ) (Figure S2). Together, these results consistently demonstrate accumulation of autophagosomes due to loss of the SIGMAR1 protein, reminiscent of the mitochondria accumulation observed in SIGMAR1/sigmar1 KO tissues and cells ().
Figure 4. Autophagosome markers are accumulated in SIGMAR1-deficient mouse retinal explants and neuronal cells.
(a and b) Western blots and quantification of LC3-II and SQSTM1 in WT and sigmar1 KO mouse retinas, and HEK293 and NSC34 cells. The experiments were performed in the basal condition without CCCP treatment. (c and d) Accumulation of LC3-II in SH-SY5Y cells after DOX-induced SIGMAR1 knockdown and 12-h treatment with vehicle or CCCP. Fold changes were calculated vs the basal condition of WT without CCCP. (e and f) Western blots and quantification of BECN1 and ATG7 in WT and sigmar1 KO NSC34 cells without or with 6-h CCCP treatment. (g-i) LC3-II turnover assay. Cells were treated with CCCP for 12h. Bafilomycin A1 (Baf. A1) was added to DMSO-treated cells 4h before collection. A representative blot of 3 experiments is presented in G. LC3-II turnover is the difference of its protein levels in the presence and absence of Baf. A1. Student's t-test or two-way ANOVA were used; mean ± SD; n = 3; *p < 0.05, **p < 0.01; N.S.: no significance. Triplicate bands correspond to 3 mice or three separate experiments using different dishes of cells. Protein band intensity was normalized to ACTB.
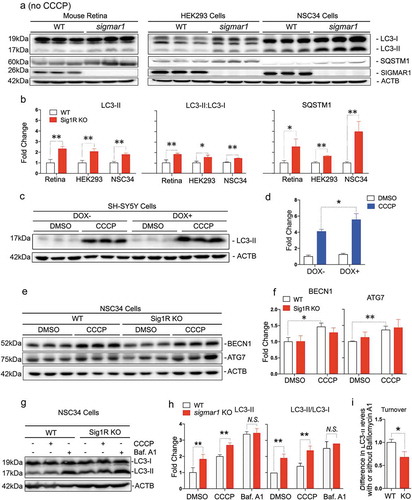
Accumulation of autophagosomes could result from increased biogenesis or reduced lysosomal degradation or both [Citation41,Citation43]. We assessed the effect of SIGMAR1 depletion in NSC34 cells on BECN1 and ATG7, proteins key to autophagosome biogenesis ()). The data show that levels of both proteins in KO and WT cells were essentially the same, although CCCP induced a slight increase in WT cells ()). To further confirm unaltered biogenesis in KO vs WT cells, we pharmacologically blocked autophagic flux using bafilomycin A1 ()). This inhibitor blocks the fusion of autophagosomes with lysosomes and hence the autophagosome degradation; thus increased LC3-II accumulation would reflect enhanced autophagosome biogenesis [Citation44]. However, we did not see a difference of LC3-II levels between KO and WT in the presence of bafilomycin, although LC3-II accumulated in KO (vs WT) cells in the absence of bafilomycin, either with or without CCCP treatment ())(Figures S3 and S4). This result is similar to that of BECN1 and ATG7, suggesting undisturbed autophagosome biogenesis in sigmar1 KO cells. Significantly, in the basal condition without CCCP, sigmar1 KO (vs. WT) caused 2-fold more LC3-II accumulation (), DMSO). Conversely, bafilomycin A1, which fully blocks autophagosome degradation, resulted in further accumulation of LC3-II and also mitochondrial markers (Figure S5) in sigmar1 KO cells. That the absence of the SIGMAR1 did not result in complete blockage of the clearance of autophagosomes and mitochondria suggests the existence of a yet unknown compensatory mechanism or factor.
Autophagosome closure is not disrupted in sigmar1 KO cells
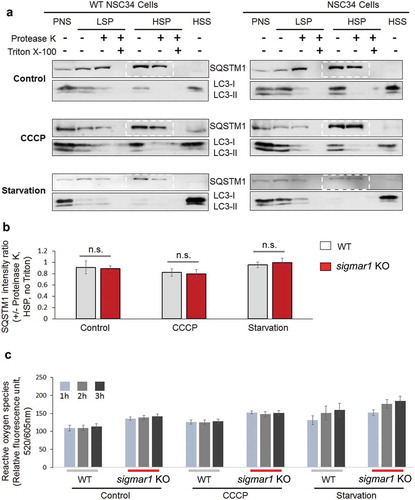
An important step in the formation of autophagosome is that a phagophore extends and encloses cytoplasmic contents (cargo). We therefore determined whether depletion of SIGMAR1 affects autophagosome membrane closure by using a highly cited method [Citation45]. The basic principle is that once sealed in the autophagosome, SQSTM1 which ‘labels’ cargo, should be protected from degradation by proteinase K; conversely, if the autophagosome is not completely closed, SQSTM1 will be exposed to proteinase K and disappear. We isolated autophagosomes and analyzed the ratio of SQSTM1 levels (with vs without proteinase K), which reflects protection of SQSTM1 from proteolysis and hence the level of autophagosome closure ()). Our data indicated that this ratio was not significantly sigmar1 in Sig1R KO cells compared to WT cells, either in the basal, CCCP, or starvation condition ()). SQSTM1 was completely degraded after Triton X-100 solubilization, verifying active proteinase K. Moreover, since autophagosomes are known to be sensitive to redox [Citation2], we also compared the levels of reactive oxygen species (ROS) in WT and KO cells. However, only a slight increase of ROS was detected in KO vs WT cells ()). This result is consistent with the lack of difference in autophagosome closure between WT and KO cells. In addition, we did not observe a difference in the autophagosome subcellular positioning pattern between WT and KO cells, as shown by mCherry-LC3 fluorescence (Figure S6).
Figure 5. Autophagosome membrane closure is not disrupted in sigmar1 KO NSC34 cells.
(a) Western blots (representative result of 4 independent experiments). NSC34 cells were treated with vehicle (control) or CCCP or cultured in the starvation medium. Post-nuclear supernatant (PNS) was centrifuged to produce low-speed pellet (LSP). The supernatant was then separated into high-speed supernatant (HSS) and high-speed pellet (HSP) which contained autophagosomes (membrane closed or not closed). All fractions were incubated with proteinase K and then subjected to western blotting. (b) Quantification of SQSTM1 protected from proteinase K. The ratio of SQSTM1 levels (presence vs absence of proteinase K) was calculated with the bands highlighted in dashed boxes in (a). Data are presented as mean ±SEM; n = 4 independent experiments; n.s., not significant. (c) Assay for reactive oxygen species. Prior to the assay, WT and KO NSC34 cells were treated with vehicle (control) or CCCP or cultured in the starvation medium for indicated hours. Quantification: Mean ± SD; n = 3.
Taken together, the multiple lines of experimental evidence presented above suggest that the cause of impaired mitochodria/autophagosome clearance in KO cells was likely at the lysosomal degradation step. Indeed, autophagosome ‘turnover’ or LC3-II degradation rate, calculated as a difference of LC3-II levels with vs without Baf.A1 blocking its lysosomal degradation ()), was substantially reduced in KO vs WT cells.
Lysosomal functional integrity is not compromised in sigmar1 KO mouse retinal explants and sigmar1 KO cells
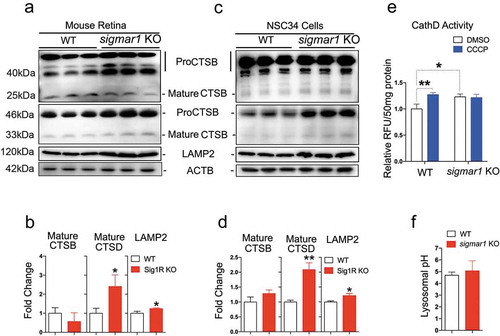
Retarded autophagosome degradation could result either from dysfunction of lysosomes or impairment of autophagosome-lysosome fusion [Citation46]. Since the lysosome is the final common destination of autophagic cargos including mitochondria [Citation37], we first assessed the influence of sigmar1 KO on lysosomal activities. CTSB and CTSD are the main proteases that execute autophagosme cargo protein degradation, therefore their activities serve as sensitive indicators of lysosomal health [Citation47]. In addition, an acidic pH is critical for normal proteolytic activities of lysosomal proteases. Our data from retinal explants () indicate that protein levels of mature CTSB were not significantly changed in KO vs WT tissues; mature CTSD was increased by ~2 fold in the KO; LAMP2, a marker protein residing in the lysosome membrane, was slightly increased. Confirming this result, very similar outcomes occurred in sigmar1 KO vs WT NSC34 cells (). Consistent with an increase of mature CTSD detected by western blot, its proteolytic activity was also increased in KO vs WT NSC34 cells ()). This difference did not occur in response to CCCP treatment, although CCCP elevated CTSD activity in WT cells. In agreement, lysosomal pH remained unaltered in KO compared to WT cells ()). These data show that the lysosomal capacity for digesting autophagic cargo was not compromised by sigmar1 KO.
Figure 6. Lysosomal proteases are not compromised in sigmar1 KO mouse retinal explants and NSC34 neuronal cells.
(a and b) Western blot and quantification of CTSB, CTSD and LAMP2 in WT and sigmar1 KO mouse retinas. (c and d) Western blot and quantification of CTSB, CTSD and LAMP2 in WT and KO NSC34 cells. (e) CTSD protease activity in WT and KO NSC34 cells treated with vehicle or CCCP for 6h. (F) Lysosomal pH in WT and KO NSC34 cells. *p < 0.05, **p < 0.01 by student's t-test; mean ± SD; n = 3. Triplicate bands correspond to 3 mice or three separate experiments using different dishes of cells. Protein band intensity was normalized to ACTB. Fold change was calculated vs WT. CCCP treatment was performed only in E.
Autophagosome-lysosome organelle fusion is partially compromised in sigmar1 KO cells
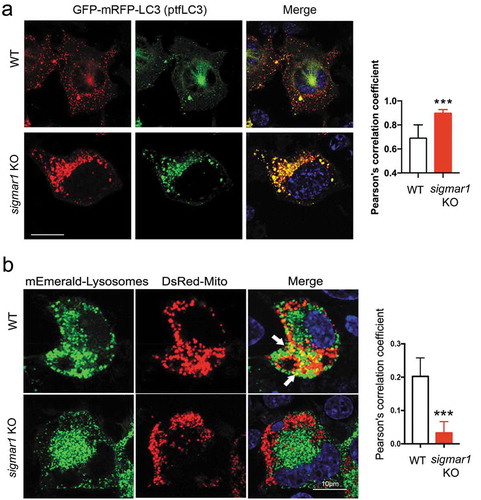
Since Sigmar1 KO did not negatively affect lysosomes, we inferred that inefficient autophagosome-lysosome fusion might be the underlying cause of mitophagy impairment. To monitor the organelle fusion, we transfected NSC34 cells to express LC3 fused with tandem GFP and mRFP. As observed in WT cells, autophagosomes (LC3-II puncta) appeared red as GFP fluorescence was quenched by the acidic environment of lysosomes, indicating normal fusion of these two organelles ()). Interestingly, more LC3-II puncta appeared yellow in KO cells. This contrast between WT and KO cells revealed that the fusion of autophagosomes to lysosomes was partially disrupted in the absence of SIGMAR1. We predicted that the mitochondria engulfed with in autophagosomes would not be able to enter lysosomes and this was confirmed by a pronounced decrease of co-localization of mEmerald-lysosome with DsRed-Mito in KO cells compared to WT cells ()).
Figure 7. Autophagosome-lysosome fusion is partially impaired in sigmar1 KO NSC34 cells.
(a) Subcellular distribution of autophagosomes in WT and sigmar1 KO NSC34 cells. After 24h transfection with GFP-mRFP-LC3 (ptfLC3), cells were treated with CCCP for another 12 hours prior to live cell fluorescence microscopy. Shown are representative pictures. Merged fluorescence from RFP and GFP was assessed with Pearson’s correlation coefficient. ***p < 0.001 by student's t-test; mean ± SD. Fifteen cells were used for quantification in each group. (b) Co-localization of lysosomes with mitochondria in WT and KO NSC34 cells. After 24-h co-transfection with mEmerald-lysosomes and DsRed-Mito, cells were treated with CCCP for another 12 hours prior to live cell fluorescence microscopy. Co-localization was quantified with Pearson’s correlation coefficient. ***p < 0.001 by student's t-test; mean ± SD. Seventeen cells were used for quantification in each group.
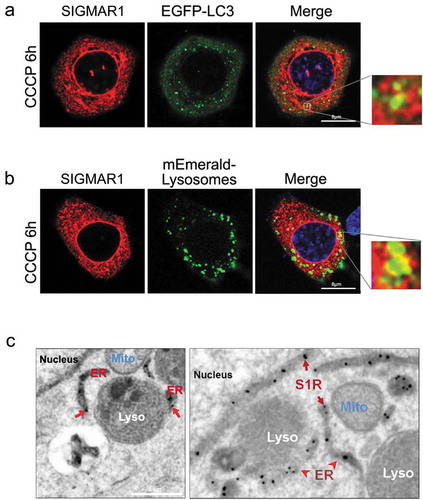
Consistent with the foregoing results, we observed mCherry-SIGMAR1 at the edge of EGFP-LC3-labled autophagosome puncta ()), and SIGMAR1-mCherry juxtaposed with mEmerald-labeled lysosomes ()), suggesting possible SIGMAR1 proximity to these two organelles. We re-examined this using EM with resolutions enhanced by a SIGMAR1-GFP-APEX2 construct expressed on a sigmar1-null background. As shown in ), SIGMAR1 mostly localized in the ER membrane, including the nuclear envelope, as we previously reported (11). SIGMAR1 was also found at the ER-lysosome contacts, consistent with the fluorescence microscopy data. Together, the different lines of evidence suggest a role of SIGMAR1 in autophagosome-lysosome fusion, possibly involving the membrane fusion machinery.
Figure 8. Juxtaposition of Sig1R with autophagosomes and lysosomes.
(a and b) Live cell fluorescence imaging. WT NSC34 cells were co-transfected for 24h with Sig1R-mCherry and EGFP-LC3 or mEmerald-Lysosomes, respectively, and then treated with CCCP for 6h. (c) APEX2-assisted EM of SIGMAR1 (S1R) in NSC34 cells. sigmar1 KO NSC34 cells were transfected with SIGMAR1-GFP-APEX2 for EM sample preparation.
A SIGMAR1 association with the SNARE complex in autophagosome-lysosome fusion
While multiple proteins are involved in autophagosome-lysosome fusion, the SNARE complex composed of STX17-SNAP29-VAMP8 is directly responsible for the final membrane fusion [Citation48]. Most recently, ATG14 was found to regulate the fusion process by directly interacting with STX17 and SNAP29 [Citation9]. Thus a protein complex facilitating final membrane fusion between autophagosomes and lysosomes is constituted at least by these four proteins. Moreover, STX17 and ATG14 both have been shown at ER-mitochondria contact sites [Citation43], where SIGMAR1 primarily resides in the ER [Citation10]. We therefore surveyed which of these proteins is in close proximity to SIGMAR1 in living cells, using a bimolecular fluorescence complementation (BiFC) method [Citation49]. Interaction or close proximity of two proteins brings together two halves (VN and VC) of a ‘split’ Venus (YFP variant) allowing fluorescent emmissions. Based on the prevailingly used model of SIGMAR1 topology [Citation15], fusing VN to the C-terminus of the full-length SIGMAR1 molecule should localize VN in the ER lumen, whereas its fusion to the C-terminus of the truncated version, SIGMAR1N80 (amino acids 1–80)(Figure S7), should position it to the cytosolic side. We found that three of the four fusion machinery proteins, i.e., ATG14, STX17, and VAMP8, induced Venus fluorescence after co-transfection with SIGMAR1N80-VN (amino acids 1–80) (). The pair of SNAP29-SIGMAR1N80 did not produce fluorescence, serving as a negative control. Further demonstrating the specificity of the BiFC method, pairing SIGMAR1N80 with CANX (calnexin), an irrelevant ER residing protein with its C-terminus localized in the cytosol, did not lead to positive signal (Figure S8). This result addresses a potential concern that aggregation of overexpressed ER proteins may cause false-positive BiFC. The full-length SIGMAR1 (SIGMAR1-VN) did not induce Venus fluorescence after co-expression with any of the four proteins (), possibly because of a ‘pointing-away’ spatial orientation of the VN moity at the C-terminus of the full-length SIGMAR1 molecule.
Figure 9. SIGMAR1N80 (and the full-length protein) co-precipitates with autophaosome-lysosome fusion machinery proteins ATG14, STX17 and VAMP8 but not SNAP29.
(a-d) Live cell fluorescence imaging of BiFC experiments. VN was fused to the C-terminus of the full-length SIGMAR1 protein (left panel) or that of the N-terminal half SIGMAR1 molecule (amino acids 1–80) (N80, right panel); VC was fused to the N-terminus of ATG14, STX17, SNAP29 or VAMP8. WT NSC34 cells were co-transfected with a pair of VN and VC fusion constructs for 24h, and then treated with CCCP for 6h before fluorescence microscopy. (e-h) Western blots of Co-IP. WT HEK293 cells were co-transfected with FLAG-tagged full-length SIGMAR1 (or N80) and V5-tagged ATG14, STX17, SNAP29 or VAMP8 for 36h and then treated with CCCP for 6h prior to Co-IP experiments.
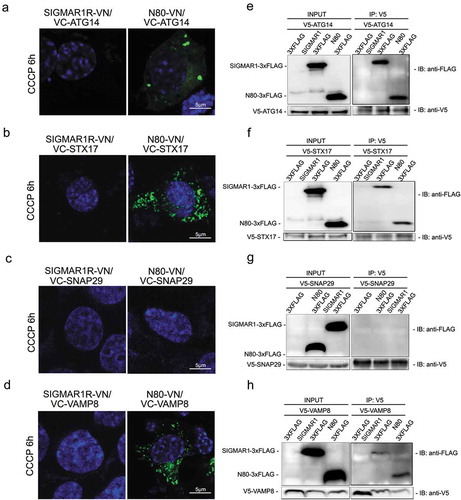
We then re-examined the BiFC results by co-IP assay using NSC34 cells co-expressing FLAG-tagged full-length (or N80) SIGMAR1 and one of the four fusion machinery proteins tagged with a V5 peptide (). Replicating the BiFC result, ATG14, STX17, and VAMP8, but not SNAP29, each co-precipitated with either SIGMAR1N80 or full-length SIGMAR1. Taken together, our results obtained using two different methods suggest that SIGMAR1 is in close proximity of the autophagosome-lysosome fusion machinery protein complex.
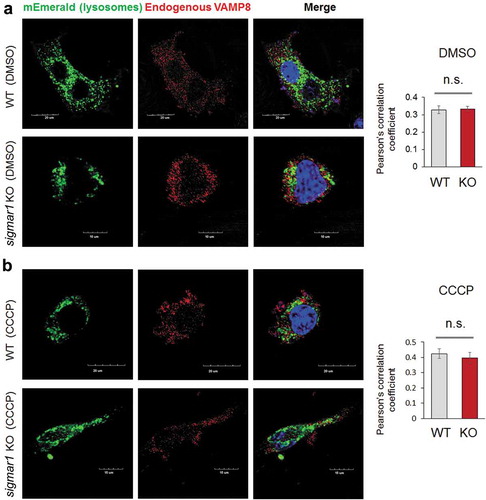
We further examined the observed Sig1R association with the autophagosome-lysosome fusion machinery. Western blot assay indicated that the protein levels of either VAMP8 or STX17 were not significantly different between WT and KO ())(Figure S9). We then determined the impact of SIGMAR1 KO on the interaction between VAMP8 and STX17, which reside on lysosomes and autophagosomes, respectively upon the organelle fusion. Compared to the basal condition (DMSO control), the co-IP of endogenous VAMP8 with V5-tagged STX17 drastically increased after CCCP treatment, indicating the formation of the VAMP8-STX17 protein complex. The comparison between KO and WT NSC34 cells under CCCP treatment showed a slight decrease (~33%) of VAMP8 co-IP (densitometry normalized to V5-STX17) in the KO ()). We next determined whether sigmar1 KO affects the lysosomal localization of VAMP8, which is known to be synthesized in the ER, processed in the Golgi, and then transported to lysosomes to assume its function in autophagosome-lysosome fusion [Citation9]. As indicated in , the colocalization of endogenous VAMP8 with the mEmerald label of lysosomes did not show a significant difference between WT and KO, either in the basal (DMSO control) or CCCP condition.
Figure 10. Co-immunoprecipitation of VAMP8 with STX17 and their protein levels are not affected by sigmar1 KO.
(a) Shown are western blots from one of two independent experiments that produced similar results, the other shown in Figure S9. Prior to western blotting, NSC34 cells were treated with vehicle (DMSO) or 20 µM CCCP for 12h. Triplicate samples of each condition were loaded on the same gel; mean ± SD; n = 3; n.s., not significant.(b) Co-IP was performed using a V5 antibody and immunoblotting (IB) was performed using an antibody specific for endogenous VAMP8. Prior to co-IP, HEK293 cells were treated with vehicle (DMSO) or 20 µM CCCP for 12h. Densitometry quantification (bar graph) was performed by normalizing VAMP8 co-IP to V5-STX17.
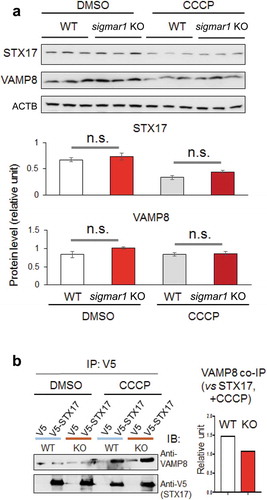
Figure 11. Localization of VAMP8 on lysosomes is not changed in Sig1R KO NSC34 cells.
After 24h transfection with mEmerald-lysosome, NSC34 cells were treated with vehicle (DMSO, a) or 20 µM CCCP (b) for 12 hours prior to immunocytochemistry (to detect endogenous VAMP8) and fluorescence microscopy. Merged fluorescence from mEmerald-lysosome and VAMP8 was assessed with Pearson’s correlation coefficient. Fifteen to twenty cells were used for quantification in each group; mean ± SD; n.s., not significant by student's t-test.
Combined, the results presented above suggest that SIGMAR1 engages in autophagosome-lysosome fusion, not by indirectly affecting protein levels of VAMP8 and STX17 and the distribution of VAMP8 to lysosomes.
Re-expressing SIGMAR1 in a null background rescues mitophagy and autophagy
To further examine a specific role of SIGMAR1 in the autophagic process, we performed rescue experiments by re-introducing SIGMAR1 to the KO background. As either the full-length or SIGMAR1N80 co-precipitated with fusion machinery proteins (), we expressed these two constructs and assessed CCCP-induced mitophagy. As shown in , whereas VDAC1 and TIMM23 accumulated in KO NSC34 cells (as opposed to WT) after 12-h CCCP treatment, expression of the full-length SIGMAR1 restored KO cells to a WT-like phenotype. In contrast, SIGMAR1N80 was not able to produce this effect. Interestingly, SIGMAR1N80 expressed in WT cells prevented mitophagy induction by CCCP treatment while it slightly promoted basal mitochondria clearance (without CCCP) compared to empty vector control ().
Figure 12. Expressing the full-length SIGMAR1 in a sigmar1-null background rescues mitophagy and autophagy.
WT or sigmar1 KO cells were transfected with indicated plasmids for 36h and then were (or not) exposed to CCCP for indicated number of hours. (a and b) Western blot and quantification of VDAC1 and TIMM23. WT and sigmar1 KO NSC34 cells were transfected with either an empty vector (EV), FLAG-tagged full-length SIGMAR1, or FLAG-tagged SIGMAR1N80 for 24h and then treated with CCCP for indicated hours. (c and d) Western blot and quantification of TIMM23 in WT NSC34 cells after transfection with either an empty vector (EV) or FLAG-tagged SIGMAR1N80 for 24h followed by treatment with CCCP for another 12h. (E and F) Western blot and quantification of VDAC1 and TIM23 in NSC34 cells transfected with EV or FLAG-tagged SIGMAR1C120. After 24-h transfection, cells were treated with 20 µM CCCP for indicated hours. Mean ± SEM, n = 3 independent experiments.(G and H) Western blot and quantification of TIMM23, VDAC1, LC3-II and the LC3-II:LC3-I ratio in MEFs isolated from WT and Sigmar1 KO mice. These cells were not treated with CCCP. KO cells were transfected with either an empty vector (EV) or FLAG-tagged full-length SIGMAR1 for 24h. Student's t-test or two-way ANOVA were used; mean ± SD; n = 3; *p < 0.05, **p < 0.01, ***p < 0.001. Triplicate bands correspond to three separate experiments using different dishes of cells. Protein band intensity was normalized to ACTB. Fold change was calculated vs WT+EV without CCCP.
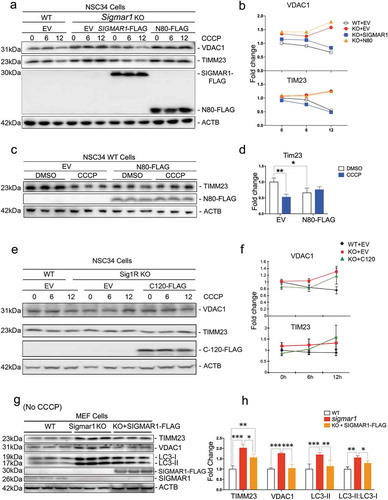
Given that the C-terminal half molecule has been reported to account for the SIGMAR1 chaperone function [Citation10], we tested its potential in the rescue of impaired mitochondrial clearance in sigmar1 KO NSC34 cells. However, the KO cells without (i.e., EV control) or with expression of the FLAG-tagged C-terminal half of Sig1R molecule (C120-FLAG) showed similar patterns of change in VDAC1 and TIMM23 protein levels during CCCP treatment (), indicative of a lack of rescue. This result together with that of SIGMAR1N80 ()) suggest that it would require the full-length SIGMAR1 to rescue impaired mitophagy in KO cells.
We therefore re-examined the rescue effect of the full-length SIGMAR1 using MEFs, which were isolated from WT and KO mice to confirm the mechanisms in primary cells without CRISPR genetic manipulations. While TIMM23, VDAC1, and LC3-II accumulated by 2 fold in KO vs WT cells, after re-introducing the full-length SIGMAR1 to the KO background these KO cells reverted to a WT-like phenotype (). It is also important to note that the experiments with MEF cells were conducted in the basal condition without CCCP treatment. Thus, the KO-exacerbated accumulation of autophagosomes in MEF cells is consonant with the result obtained with NSC34 cells in the basal condition (), DMSO). These experiments without CCCP demonstrate a sigmar1 KO-specific impairment of autophagy, minimizing a concern of possible non-specific effects arising from CCCP [Citation50].
Collectively, the results from the rescue experiments demonstrate that the full-length SIGMAR1 was capable of rescuing the clearance of mitochondria and autophagosomes that was partially blocked due to SIGMAR1 depletion.
Apoptosis is exacerbated in sigmar1 KO cells and sigmar1 KO mouse retinal explants under the mitophagy-inducing condition
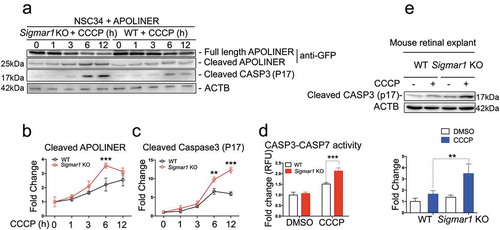
Finally, we evaluated the effect of Sig1R KO-induced impairment of mitophagy on apoptosis. We first transfected NSC34 cells with the Apoliner construct for apoptosis assay, in which GFP is cleaved off if caspases are activated. As indicated in , while cleaved GFP slowly increased in WT cells during mitophagy induction by 12-h CCCP treatment, this increase was significantly accelerated in KO cells. To re-examine this observation, we used a different method by immunoblotting cleaved CASP3, which showed a very similar result (). Furthermore, we verified exacerbated apoptosis in KO (vs WT) cells using a third method, CASP3-CASP7 activity assay ()). Importantly, CCCP-treated KO retinal explants also showed elevated CASP3 compared to WT control ()).
Figure 13. Sigmar1 knockout exacerbates CCCP-induced apoptosis in mouse retinal explants and NSC34 cells.
(a, b, and c) Western blot and quantification of APOLINER and CASP3 processing in NSC34 cells. sigmar1 KO and WT cells were transfected with APOLINER for 36h and then exposed to CCCP for indicated hours. (d) CASP3 and CASP7 activity in WT and KO NSC34 cells treated with vehicle or CCCP for 12h. (e) Western blot and quantification of cleaved CASP3 in WT and KO mouse retinal explants 24h after vehicle or CCCP treatment. **p < 0.01, ***p < 0.001 by student's t-test; mean ± SD; n = 3 independent experiments. Fold change was calculated vs WT without CCCP.
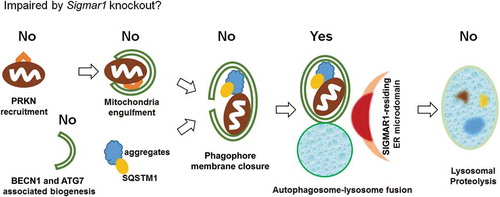
In summary, in the current study we first observed that SIGMAR1 deficiency caused accumulation of mitochondria under the treatment with CCCP for induction of mitophagy. The extended determination of various factors involved in mitophagy/autophagy then led us to an interpretation that the autophagosome-lysosome fusion process was partially compromised in the absence of SIGMAR1 (). Furthermore, the impairment of autophagosome clearance due to SIGMAR1/sigmar1 KO also occurred in the basal condition without mitophagy induction.
Figure 14. Schematic interpretation of the impact of Sigmar1 KO on mitophagy/autophagy in NSC34 cells.
Based on the data presented in this report, Sigmar1 KO in NSC34 cells did not impair the early events of mitophagy and autophagy, including PINK1 stabilization and PRKN recruitment, mitochondria engulfment into phagophores, BECN1 and ATG7 protein levels, and phagophore membrane closure; Sigmar1 KO did not reduce lysosomal functions either. Rather, the data pointed to partial impairment of the autophagosome-lysosome fusion event. The exact molecular function of SIGMAR1 in this process remains to be elucidated.
Discussion
In this study we report that SIGMAR1 plays a role in autophagosome-lysosome fusion. We first established that mitophagy was impaired by either permanent knockout or induced knockdown of SIGMAR1. We then narrowed down the underlying mechanism to partially disrupted autophagosome-lysosome fusion, and further obserevd a SIGMAR1 association with fusion machinery proteins ATG14, STX17, and VAMP8. Organelle fusion is a critical step for autophagic waste clearance yet its regulation is poorly defined [Citation51]; our finding of SIGMAR1 as a modulator of this process may have broad implications in disease mechanisms. Recent reports support a protective role of SIGMAR1 in neurodegenerative diseases [Citation18,Citation24,Citation52]. As SIGMAR1 is a unique ER resident protein with no homologs in mammalian genomes, investigation of SIGMAR1 as a new intervention target has been widely advocated [Citation52,Citation53]. However, advancing SIGMAR1-targeted interventions into clinical applications has been hampered by poor understanding of SIGMAR1 molecular actions [Citation54], and whether SIGMAR1 knockout affects mitophagy remained underexplored.
Several lines of evidence in the current study support an important role of SIGMAR1 in mitophagy. First, impaired mitophagy due to SIGMAR1/sigmar1 knockout or knockdown was reproducibly observed in retinal tissues and four different cell types. A lesser impairment by knockdown vs knockout suggests that residual SIGMAR1 in knockdown cells is able to facilitate mitophagy to some degree. Consistent with the mitophagy relevance of these observations, no significant changes (KO vs WT) in VDAC1 and TIMM23 levels occurred without the CCCP induction of mitophagy, as indicated in (0h), 2F(0h), 2H and ) (0h). Thus, this result confirms the specificity of VDAC1 and TIMM23 as mitochondrial markers [Citation37]. Interestingly, we observed accumulation of these two mitochondrial markers in sigmar1 KO (vs WT) MEFs without CCCP treatment. Different from the cell lines used in other experiments, MEFs are primary cells that were isolated from mice. We therefore gather that the manipulations during MEF isolation and purification might have caused cellular stress and triggered mitochondrial damage even without adding CCCP. Second, manifesting the SIGMAR1 specificity, re-introducing SIGMAR1 to a null background rescued mitophagy. Third, Sigmar1 knockout in retinas and cells exacerbated apoptosis confirming a protective effect of SIGMAR1-assisted mitophagy. A SIGMAR1 cyto-protective function was previously attributed to a variety of mechanisms, including antioxidation, ER stress response, and Ca2+ homeostasis, among others [Citation10]; here our data suggest that SIGMAR1 preserved cell survival also via mitophagy. Fourth, consistent with mitophagy impairment, autophagosome accumulation occurred in sigmar1 knockout retinas and cells that were induced for mitophagy. In support of this result, accumulation of LC3-II was previously observed using siRNA for SIGMAR1 knockdown [Citation27,Citation28] or antagonists to block the SIGMAR1 binding site [Citation55], although the underlying mechanism remained unclear.
Another important finding in this study is that SIGMAR1 modulates autophagosome-lysosome fusion, a converging point of different types of macroautophagy including mitophagy [Citation39]. Thus far, regulatory mechanisms of this fusion event remain poorly understood [Citation33] and our study suggests a novel mode of SIGMAR1 molecular function involved in this event. Impairment of the lysosomal organelle fusion due to Sigmar1 knockout was revealed by compromised lysosomal quenching of GFP fluorescence, and also by mitigated co-localization of lysosomes with autophagosomes or mitochondria. Hence, inefficient autophagosome-lysosome fusion and cargo degradation may explain the accumulation of autophagosome and mitochondrial markers caused by SIGMAR1 deficiency observed here or by SIGMAR1 inactivation in other studies [Citation56]. Alternatively, considering a possible role of SIGMAR1 in mitochondrial homeostasis [Citation10], the observed accumulation of mitochondria may be explained by mitochondrial damage caused by Sigmar1 KO per se without involving impairment of autophagosome-lysosome fusion. However, in our experimental setting, Sigmar1 KO did not affect the PINK1-PRKN signaling of early-phase mitophagy, which would otherwise have been potentiated if Sigmar1 KO had caused mitochondrial damage. Sigmar1 KO did not appear to affect autophagosome formation either, as no changes were observed in BECN1 and ATG7 protein levels and autophagosome closure. Moreover, we did not observe a negative effect of SIGMAR1 ablation on events later than the lysosomal fusion step, i.e., lysosome proteolytic activity. Of note, another study (reported during the submission of this manuscript) provides evidence of fusion impairment due to the aggregation of mutated SIGMAR1 [Citation28]. Though consistent with our data, aggregation of overexpressed SIGMAR1 per se causes cellular stress and may affect autophagic flux by different mechanisms. Nevertheless, these detailed analyses allowed us to pinpoint reduced autophagosome-lysosome fusion as the most likely mechanism underlying the observed mitophagy impairment. Consonantly, we did not observe an obvious Sigmar1 KO-caused alteration of VAMP8 and STX17 protein levels ( and S9), lysosomal localization of VAMP8 (), or subcellular distribution of autophagosomes (Figure S6) or lysosomes (Figure S10). A change in either of these would have otherwise secondarily affected autophagosome-lysosome fusion. Rather, we observed a SIGMAR1 proximity to the lysosomal membrane fusion protein complex using two experimental approaches, BiFC and co-IP.
Though intensively studied for pharmacology and psychoactive effects, SIGMAR1 remains under-investigated for its molecular functions [Citation54]. The C-terminal half of the molecule is thought to be responsible for the SIGMAR1 chaperone activity and the known SIGMAR1 molecular interactions [Citation10]. To date, known SIGMAR1 molecular actions, mainly modulations of ER stress response, redox, channel activity, GPCRs, and Ca2+ homeostasis, are almost all attributed to its role as a molecular chaperone that assists protein folding [Citation54], and the SIGMAR1 C-terminal half molecule alone is reported to be sufficient for its chaperone activity [Citation10,Citation57]. Interestingly, our data showed that expressing the SIGMAR1 C-terminal half in sigmar1 KO NSC34 cells could not rescue mitophagy that was impaired due to KO, thus differentiating SIGMAR1’s chaperone function from its role in mitophagy/autophagy observed here. Conversely, we observed that the SIGMAR1 N-terminal half (SIGMAR1N80) alone produced positive BiFC and co-IP results, suggesting its association with (or proximity to) the lysosomal fusion factor complex. It is noteworthy that the Co-IP approach is not subject to an alternative interpretation of ‘false-positive’ interactions made possible by a long arm formed with VN and VC proteins in the case of BiFC. Of note, in BiFC experiments the full-length SIGMAR1 did not restore Venus fluorescence. There are two possible scenarios. First, if the SIGMAR1 C-terminus localizes in the ER lumen – the prevailing view in the literature [Citation54,Citation58], VN fused to this end must be separated by the ER membrane from VC that was attached to a cytosol-exposed fusion factor protein, e.g., STX17. Second, based on the SIGMAR1 crystal structure indicating the C-terminal domain embedded in the ER membrane on the cytosolic side [Citation26], VN at the SIGMAR1 C-terminus should be ‘pinned’ onto the ER membrane and thus inaccessible to VC. Either scenario reasonably explains the lack of Venus fluorescence restoration by the full-length SIGMAR1. As conflicting reports exist on the subcellular localization of the SIGMAR1 C-terminus, distinguishing the two scenarios awaits more information. Nonetheless, a possible SIGMAR1N80 association with the fusion machinery complex departs from the known chaperone-based SIGMAR1 interactions, e.g., with GPCRs and ion channels [Citation10,Citation55].
However, when re-expressed in KO cells, it was the full-length SIGMAR1 rather than SIGMAR1N80 that rescued autophagic cargo degradation. On the other hand, SIGMAR1N80 prevented mitochondria clearance in WT cells. To reconcile those results, we propose that SIGMAR1N80 prevents mitophagy in WT cells probably by acting as a dominant-negative variant against the endogenous full-length SIGMAR1. Thus, a reasonable interpretation of our results is that while the N80 portion of the SIGMAR1 protein may associate with fusion machinery proteins, a full function of SIGMAR1 in autophagosome-lysosome fusion likely requires the full-length molecule. Along this line, an alternative interpretation of our data could be that the ablation of SIGMAR1 may lead to misfolding or mislocalization of the fusion machinery proteins, hence indirectly mitigating autophagosome-lysosome fusion. However, this interpretation appears not to be supported by our results that neither protein levels of VAMP8 and STX17 nor the lysosomal distribution of VAMP8 were altered in sigmar1 KO cells in comparison to WT cells. Aside from a possible SIGMAR1 engagement with the the autophagosome-lysosome fusion machinery, our data cannot rule out another scenario whereby SIGMAR1 may organize ER microdomains that serve as ‘docking’ sites for these two organelles to constellate and then fuse. Consistent evidence includes deformation of ER microdomains due to SIGMAR1 knockdown [Citation27] and binding of SIGMAR1 with various lipids such as cholesterol, sphingosine, and ceramide which are important components of the ER membrane [Citation59]. While intriguing, a role for SIGMAR1 in the autophagosome-lysosome fusion event requires further investigations to elucidate; e.g. co-IP experiments with multiple cell types to detect endogenous protein-protein interactions involving SIGMAR1 and the fusion factors, and assays to monitor organelle fusion using in vitro reconstituted vesicles [Citation9].
In summary, we started out finding that SIGMAR1 depletion impaired mitophagy, and finally narrowed down the SIGMAR1’s role to the autophagosome-lysosome fusion step. While mitophagy features specialized signaling in its initiation and progression, it merges with general macroautophagy upon lysosomal organelle fusion as damaged mitochondria ‘hitchhike’ on autophagosomes for disposal to lysosomes [Citation6]. In other words, mitophagy and general macroautophagy share the autophagosome-lysosome fusion mechanism (). Consistently, in addition to the accumulation of mitochondrial markers, autophagosome (LC3-II) accumulation was also exacerbated due to SIGMAR1 ablation when mitophagy was induced with CCCP (). It is worth noting that exacerbated autophagosome accumulation in sigmar1 KO (vs WT) also occurred upon serum starvation (Figure S3), a condition commonly used to induce general macroautophagy [Citation2,Citation60]. Moreover, KO-caused impairment of autophagy was robustly observed even in the basal condition without CCCP treatment (, and 12(e/f)). This is a significant observation that further confirms an important role of SIGMAR1 in autophy as it is well known that basal autophagy occurs ubiquitously in normal conditions without cellular stress [Citation2]. These results collectively suggest a general SIGMAR1-medated role in macroautophagy pathways that involve autophagosome-lysosome fusion. However, with regard to autophagosome accumulation, Sigmar1 KO only accounted for 55% of the effect of Baf.A1 ()) which fully blocks autophagosome-lysosome fusion [Citation44,Citation60]. This contrast implicates that a currently unknown mechanism(s) may compensate for the loss of the SIGMAR1 function. Indeed, sigmar1 KO mice do not exhibit overt phenotypes in normal conditions, suggesting the presence of compensatory modulators [Citation15]. Furthermore, it has been widely observed that SIGMAR1’s protective functions may not obviously manifest until challenged with various stressors [Citation53,Citation54]. These interesting contexts underscore the importance of better understanding the molecular underpinning of SIGMAR1 functions, in particular, its regulations, either direct or indirect, in autophagosome-lysosome fusion.
Conclusions
Neither regulations of autophagosome-lysosome fusion nor molecular functions of SIGMAR1 are well understood. Our results reported herein suggest a SIGMAR1 molecular function in modulating the fusion process. Autophagosome-lysosome fusion is a key step in autophagic processes including mitophagy, and their dysregulation is associated with a broad range of disease conditions. Therefore, further research to elucidate SIGMAR1-associated molecular mechanisms in autophagosome-lysosome fusion will contribute to the understanding of autophagy-related disease mechanisms.
Materials and methods
Cell lines, antibodies, and reagents
Mouse neuroblastoma NSC34 cells were purchased from Cellutions Biosystems (Fisher Scientific, CLU140), human neuroblastoma SH-SY5Y cells and human HEK293 cells were from American Type Culture Collection (ATCC, CRL-2266).
Antibodies used in this study: anti-CTSB (Santa Cruz Biotechnology, sc-13985), anti-CTSD (Santa Cruz Biotechnology, sc-6486), anti-V5 (EMD Millipore, AB3792), anti-VDAC1(Santa Cruz Biotechnology, sc-98708), anti-SIGMAR1/Sig1R (Santa Cruz Biotechnology, sc-13705), anti-PINK1 (Abcam, ab75487), anti-SQSTM1 (BD Biosciences, 610833), anti-TIMM23 (BD Biosciences, 611222), anti-LC3B (Sigma-Aldrich, L7543), anti-ACTB/β-actin (Sigma-Aldrich, A2228), anti-FLAG M2 (Sigma-Aldrich, F3165), anti-LAMP2 (Santa Cruz Biotechnology, sc-18822), anti-HA (clone 3F10; Roche, 11867423001), anti-BECN1/Beclin-1 (D40C5; Cell Signaling Technology, 3495), anti-ATG7 (D12B11; Cell Signaling Technology, 8558), anti-VAMP8 (Abcam, ab76021), anti-STX17 (Sigma-Aldrich, HPA001204), and anti-cleaved CASP3/Caspase-3 (Asp175, 5A1E; Cell Signaling Technology, 9664).
Reagents: Puromycin dihydrochloride (Tocris, 4089), TET system approved fetal bovine serum (Clontech, 631106, A15007), PRE084 hydrochloride (Tocris, 0589), BD1047 dihydrobromide (Tocris, 0956), Hoechst 33342 (Tocris, 5117), Protein A/G Magnetic Beads (Pierce Biotechnology 88802), dithiobis(succinimidyl propionate) (DSP; Pierce Biotechnology, 22586), carbonyl cyanide 3-chlorophenylhydrazone (CCCP; Tocris, 0452). For starvation experiments, Hanks balanced salt solution (HBSS; ThermoFisher, 24020117) or an amino acid and serum-free, glucose-containing buffer (EBSS; Gibco, 24010043) was used [Citation61]. All other reagents were purchased from Sigma-Aldrich or ThermoFisher unless specifically stated.
Animals
All animal procedures conform to the NIH Guide for the Care and Use of Laboratory Animals. Animal protocols were approved by the Institutional Animal Care and Use Committee at the UW–Madison and The Ohio State University. Oprs1 mutant (+/−) B6;129S5-Sigmar1Gt(OST422756) Lex/Mmucd mouse litters on a C57BL/6J × 129s/SvEv mixed background were purchased from the Mutant Mouse Regional Resource Center (MMRRC, University of California-Davis, 011750). Litter mates with homozygous alleles of Sigmar1 were used as wild-type (WT) control. Animals were maintained on a 4% fat diet (Harkland Teklad, 8604 M/R) and subjected to standard light cycles (12 h/12 h light/dark). Experiments used both male and female mice in the age range of postnatal days 30–60. All surgeries were performed under isoflurane anesthesia (through inhaling, flow rate 2 ml/min). Animals were euthanized in a chamber gradually filled with CO2.
Retinal explant preparation and culture
Mouse retinal explants were prepared as previously described [Citation62]. Briefly, neonatal (postnatal day 0) pups were euthanized by CO2 asphyxiation, and eyes were enucleated and transferred to HBSS. The neural retina was dissected free from the retinal pigment epithelium (RPE), cut into small pieces (each ~3 mm2), and transferred into a 12-well cell culture plate. The retinal explants were maintained in a 1:1 mixture of DMEM and F12 (Gibco, 11320-033) containing 5% FBS (Sigma-Aldrich, F2442) and penicillin-streptomycin (Gibco, 15140122) for 24h at 37°C in an 8% CO2 atmosphere.
Constructs
LentiCRISPR v2 (52961, Feng Zhang lab), pLKO.1-puro U6 sgRNA BfuAI stuffer (50920, Rene Maehr & Scot Wolfe lab), pHAGE TRE dCas9-KRAB (50917, Rene Maehr & Scot Wolfe lab), pmVenus-N1 (27793, Steven Vogel lab) and pmEmerald-Lysosomes (54149, Michael Davidson lab) are from Addgene. p3XFLAG-N1 was constructed by replacing EGFP with 3XFLAG (N-Met-Asp-Tyr-Lys-Asp-His-Asp-Gly-Asp-Tyr-Lys-Asp-His-Asp-Ile-Asp-Tyr-Lys-Asp-Asp-Asp-Asp-Lys-C) in pEGFP-N1 (Clontech, 6085-1). EGFP in pEGFP-C1 (Clontech) was substituted with V5 (N-Gly-Lys-Pro-Ile-Pro-Asn-Pro-Leu-Leu-Gly-Leu-Asp-Ser-Thr-C) to generate pV5-C1. To make pVN-N1, pVN-C1, pVC-N1 and pVC-C1, mVenus 1–172aa and mVenus 155–238aa were first amplified from pmVenus-N1 by PCR, then inserted into pEGFP-N1 or C1 which EGFP has been removed. Human SIGMAR1, ATG14, STX17, SNAP29 and VAMP8 were amplified from human brain cDNA library to make these constructs: p3XFLAG-N1-SIGMAR1, pmCherry-N1-SIGMAR1 (pmCherry-N1; Clontech, 632523), pVC-N1-SIGMAR1, pV5-C1-ATG14, pEGFP-C1-ATG14, pVN-C1-ATG14, pV5-C1-STX17, pEGFP-C1-STX17, pVN-C1-STX17, pV5-C1-SNAP29, pEGFP-C1-SNAP29, pVN-C1-SNAP29, pV5-C1-VAMP8, pEGFP-C1-VAMP8 and pVN-C1-VAMP8. p3XFLAG-N1-N80 and pVC-N1-N80 were created by amplifying 1–80aa from SIGMAR1, then ligated into corresponding empty vectors. pEGFP-LC3, pDsRed-Mito and pEGFP-PRKN/Parkin were kindly provided by Dr. Zu-Hang Sheng at the Synaptic Function Section, NINDS [Citation63].
Knockout and inducible knockdown of SIGMAR1 with CRISPR/Cas9
The sigmar1 knockout NSC34 single-clone cell line was generated in our previous study [Citation34] using a CRISPR/Cas9 genome-editing approach [Citation64]. The SIGMAR1 knockout HEK293 single-clone cell line was generated following the same method with minor modifications. The D2 clone was used for experiments. Briefly, 3 CRISPR guide RNAs (gRNAs) targeting Sigmar1/SIGMAR1 were chosen. Targeted sequences for the NSC34 mouse cell line: 5ʹ-TGATCCAGGCCGCCTGGTTG-3ʹ, 5ʹ-CGTGGGCCGCGGGACGGCGG-3ʹ and 5ʹ-GCAGCTTGCTCGACAGTATG-3ʹ. Targeted sequences for the HEK293 human cell line: 5ʹ-GGCCTTCTCTCGTCTGATCG-3ʹ, 5ʹ-TGACCCAGGTCGTCTGGCTC-3ʹ, and 5ʹ-GTGGGCCGTGGGCCGGCGGT-3ʹ. Cloning of gRNAs into lentiCRISPR v2 and lentivirus production were performed as reported [Citation65]. Cells were cultured in DMEM and supplemented with 10% FBS at 37°C under humidified conditions and 5% CO2. The cells were transduced with lentivirus for 3 d, then treated with 1µg/ml puromycin for 1 w. Single clones were picked after serial dilution. To create SIGMAR1 inducible knockdown in the SH-SY5Y human cell line, the CRISPR/dCAS9 transcriptional repression system was used [Citation66]. 5ʹ-GCGCCACTCTACATACGGAT-3ʹ, 5ʹ-TCGGGCGAGCCCGTCCATTC-3ʹ and 5ʹ-TGTTAAGGCCCGCCTTTACC-3ʹ were chosen as targeted sequences in the promoter of Sigmar1. Transfection was performed using Lipofectamine 3000 (Invitrogen) following the manufacturer’s instructions. Positive cells were selected for 1 w with 200µg/ml G418 and 1µg/ml puromycin. Fetal bovine serum (FBS; Clontech, 631101) free of doxycycline, the gene repression inducer, was used to maintain the cells for inducible knockdown.
Assay for reactive oxygen species (ROS)
A ROS detection Kit (Abcam, ab186027; red fluorescence) was used for the assay. Cells were grown for 24h in DMEM supplemented with 10% FBS in a 96-well plate, and treated with vehicle (equal amount of DMSO), or 20 µM CCCP, or cultured in the starvation medium for 12h. To detect cellular ROS levels, the cells were incubated with the working solution (in the kit) for 60 min at 37°C, and fluorescence was read at Ex/m of 520/605 nm.
Subcellular fractionation and proteinase K treatment to assess autophagosome closure
We followed the method in a highly cited report [Citation45]. Briefly, NSC34 cells were homogenized with a syringe with 27-gauge needle, and the post-nuclear supernatant (PNS) was obtained after a 5-min 300 xg spin. The PNS was separated into low-speed pellet (LSP) and low-speed supernatant (LSS) after centrifugation at 7700 xg for 5 min. The high-speed pellet (HSP) that contains autophagosomes and high-speed supernatant (HSS) were then separated by ultracentrifugation at 100,000 xg for 30 min. To examine proteinase K sensitivity which reflects the level of incomplete autophagosome membrane closure, each fraction was treated with 100 μg/ml proteinase K (Invitrogen, 25530015) on ice for 30 min with or without 0.5% Triton X-100 (Sigma-Aldrich, T8787) followed by ultracentrifugation at 100,000 xg for 30 min. For western blot analysis, the samples were precipitated with 10% trichloroacetic acid, washed once with ice-cold acetone, and then resuspended in SDS–PAGE sample buffer.
Immunoblotting and co-immunoprecipitation (co-IP)
Immunoblotting was performed as described in our previous report [Citation64]. Immunoprecipitation was described previously [Citation10]. Briefly, HEK293 cells were co-transfected with indicated constructs for 36h, then treated with 20µM CCCP for another 6h. Cross linker DSP (ThermoFisher, PG82081) was used following manufacturer’s instructions. After crosslinking, cells were lysed in NP-40 lysis buffer (150mM Tris/HCl at pH7.6, 50mM NaCl, 10mM sodium pyrophosphate, 0.5% Nonidet P-40 (Sigma-Aldrich, 9016-45-9), 2mM phenylmethylsulfonyl fluoride, 0.1mM N-ethylmaleimide, 2mM sodium orthovanadate and 100mM sodium fluoride) containing protease inhibitors (Roche, 05892970001) for 30min on ice. Cell debris was pelleted at 14000g and 4°C. Protein concentration was determined with the BCA-kit (Pierce Biotechnology, 23250) according to the company’s instructions. 500µg of total protein was incubated with an anti-FLAG (Sigma-Aldrich, F3165) or anti-V5 (Sigma-Aldrich, AB3792) antibody for 2h at 4°C. Immunoprecipitates were incubated with Protein A/G Magnetic Beads (Sigma-Aldrich, LSKMAGAG10) for 1h at 4°C, washed three times with lysis buffer and eluted in 2XLaemmli buffer at 95°C.
Confocal microscopy and image analysis
We followed the method described in our previous reports [Citation18,Citation34] with minor modifications. Briefly, cells were seeded onto glass-bottom dishes(NuncTM, 150680), stabilized for 24 hours, and then transfected with plasmids for certain hours as described in figure legends. Hoechst 33342 (ThermoFisher, H3570; 10 µM) was used to stain the nuclei of live cells before confocal microscopy. Images were acquired with a Nikon A1RS confocal microscope under a 60X oil objective lens.
Lysosomal pH measurement
Quantification of lysosomal pH was performed using a ratiometric lysosomal pH dye LysoSensor Yellow/Blue DND-160 (Molecular Probes, L7545). The pH calibration curve was generated as described previously [Citation67]. Briefly, cells were trypsinized and labeled with 2µM LysoSensor Yellow/Blue DND-160 for 30 min at 37°C in regular medium, and excessive dye was washed out using PBS. The labeled cells were treated for 10 min with 10µM monensin (Sigma-Aldrich, M5273) and 10µM nigericin (Sigma-Aldrich, 481990) in 25 mM MES (Sigma-Aldrich, M3671) calibration buffer, pH 3.5–6.0, containing 5 mM NaCl, 115 mM KCl, and 1.2 mM MgSO4. Quantitative comparisons were performed in a 96-well plate, and the fluorescence was measured with a microplate reader at 37°C. Light emitted at 440 and 535 nm in response to excitation at 340 and 380 nm was measured, respectively. The ratio of light emitted with 340- and 380-nm excitation was plotted against the pH values in MES buffer, and the pH calibration curve for the fluorescence probe was generated from the plot using Microsoft Excel.
APEX2-enhanced electron microscopy (EM)
NSC34 cells (Sigmar1 knockout) were seeded on poly-D-lysine-coated coverslips in DMEM supplemented with 10% FBS. When cells reached 70% adherence, they were transfected using Lipofectamine 2000 (ThermoFisher, 11668019) with the SIGMAR1-GFP-APEX2 construct in Opti-Mem (ThermoFisher, 31985088). Twenty four hours after transfection cells were fixed in 2% glutaraldehyde. APEX2-catalyzed diaminobenzidine polymerization, silver nitrate precipitation, and eletron microscopy were then performed following exactly the procedures described in detail in our previous report [Citation34].
APOLINER and CASP3-CASP7 activity assay
NSC34 cells were transfected for 36h with APOLINER, which was kindly shared by Dr. Jean-Paul Vincent [Citation68], then incubated with CCCP. CASP3 and CASP7 activity assay (Promega, G8090) was performed according to the manufacturer’s instructions.
Statistical analysis
For quantification of PRKN translocation as previously described [Citation37], only complete overlap of PRKN and sequestered mitochondria was considered positive. To quantify colocalization by correlation, Pearson correlation coefficient was calculated by ImageJ. Data represent the mean ± S.E. (or S.D. for repeats on the same blot) of at least three independent experiments. Statistical significance was assessed by two-tailed unpaired Student’s-t-test or two-way ANOVA followed by multiple comparisons, which were performed with Graphpad Prism. Significance was set at P < 0.05.
Consent for publication
The authors agree to grant consent for publication.
Availability of supporting data
Supplementary figures are included.
Competing interests
The authors declare no conflict of interests.
Ethical approval and consent to participate
All animal procedures conform to the NIH Guide for the Care and Use of Laboratory Animals. Animal protocols were approved by the Institutional Animal Care and Use Committee at the UW–Madison and The Ohio State University.
Supplemental Material
Download MS Word (2 MB)Acknowledgments
We thank Dr. Tim Mavlyutov for providing the EM image. We are also grateful to Dr. Zu-Hang Sheng at NINDS and Dr. Bill Chiu at University of Wisconsin-Madison for their helpful input in discussions.
Disclosure statement
No potential conflict of interest was reported by the authors.
Supplementary data
Supplemental data for this article can be accessed here.
Additional information
Funding
Related Research Data
References
- Farre JC, Subramani S. Mechanistic insights into selective autophagy pathways: lessons from yeast. Nat Rev Mol Cell Biol. 2016;17(9):537–552.
- Ryter SW, Cloonan SM, Choi AM. Autophagy: a critical regulator of cellular metabolism and homeostasis. Mol Cells. 2013;36(1):7–16.
- Sica V, Galluzzi L, Bravo-San Pedro JM, et al. Organelle-specific initiation of autophagy. Mol Cell. 2015;59(4):522–539.
- Ashrafi G, Schwarz TL. The pathways of mitophagy for quality control and clearance of mitochondria. Cell Death Differ. 2013;20(1):31–42.
- Chen Y, Dorn GW 2nd. PINK1-phosphorylated mitofusin 2 is a Parkin receptor for culling damaged mitochondria. Science. 2013;340(6131):471–475.
- Lazarou M, Sliter DA, Kane LA, et al. The ubiquitin kinase PINK1 recruits autophagy receptors to induce mitophagy. Nature. 2015;524(7565):309–314.
- Choi AM, Ryter SW, Levine B. Autophagy in human health and disease. N Engl J Med. 2013;368(19):1845–1846.
- Garcia-Prat L, Martínez-Vicente M, Perdiguero E, et al. Autophagy maintains stemness by preventing senescence. Nature. 2016;529(7584):37–42.
- Diao J, Liu R, Rong Y, et al. ATG14 promotes membrane tethering and fusion of autophagosomes to endolysosomes. Nature. 2015;520(7548):563–566.
- Hayashi T, Su TP. Sigma-1 receptor chaperones at the ER-mitochondrion interface regulate Ca(2+) signaling and cell survival. Cell. 2007;131(3):596–610.
- Mavlyutov TA, Yang H, Epstein ML, et al. APEX2-enhanced electron microscopy distinguishes sigma-1 receptor localization in the nucleoplasmic reticulum. Oncotarget. 2017;8(31):51317–51330.
- Mavlyutov TA, Epstein M, Guo LW. Subcellular localization of the sigma-1 receptor in retinal neurons - an electron microscopy study. Sci Rep. 2015;5:10689.
- Hanner M, Moebius FF, Flandorfer A, et al. Purification, molecular cloning, and expression of the mammalian sigma1-binding site. Proc Natl Acad Sci U S A. 1996;93(15):8072–8077.
- Kourrich S. Su TP, Fujimoto M, et al. The sigma-1 receptor: roles in neuronal plasticity and disease. Trends Neurosci. 2012;35(12):762–771.
- Su TP, Hayashi T, Maurice T, et al. The sigma-1 receptor chaperone as an inter-organelle signaling modulator. Trends Pharmacol Sci. 2010;31(12):557–566.
- Tsai SA, Chuang J-Y, Tsai M-S, et al. Sigma-1 receptor mediates cocaine-induced transcriptional regulation by recruiting chromatin-remodeling factors at the nuclear envelope. Proceedings of the National Academy of Sciences of the United States of America, 2015
- Mavlyutov TA, Nickells RW, Guo LW. Accelerated retinal ganglion cell death in mice deficient in the sigma-1 receptor. Mol Vis. 2011;17:1034–1043.
- Yang H, Fu Y, Liu X, et al. Role of the sigma-1 receptor chaperone in rod and cone photoreceptor degenerations in a mouse model of retinitis pigmentosa. Mol Neurodegener. 2017;12(1):68.
- Luty AA, Kwok JBJ, Dobson-Stone C, et al. Sigma nonopioid intracellular receptor 1 mutations cause frontotemporal lobar degeneration-motor neuron disease. Ann Neurol. 2010;68(5):639–649.
- Geva M, Kusko R, Soares H, et al. Pridopidine activates neuroprotective pathways impaired in huntington disease. Hum Mol Genet. 2016;25(18):3975–3987.
- Al-Saif A, Al-Mohanna F, Bohlega S. A mutation in sigma-1 receptor causes juvenile amyotrophic lateral sclerosis. Ann Neurol. 2011;70(6):913–919.
- Feher A, Juhász A, László A, et al. Association between a variant of the sigma-1 receptor gene and Alzheimer’s disease. Neurosci Lett. 2012;517(2):136–139.
- Li X, Hu Z, Liu L, et al. A SIGMAR1 splice-site mutation causes distal hereditary motor neuropathy. Neurology. 2015;84(24):2430–2437.
- Wang J, Saul A, Roon P, et al. Activation of the molecular chaperone, sigma 1 receptor, preserves cone function in a murine model of inherited retinal degeneration. Proc Natl Acad Sci U S A. 2016;113(26):E3764–72.
- Watanabe S, Ilieva H, Tamada H, et al. Mitochondria-associated membrane collapse is a common pathomechanism in SIGMAR1- and SOD1-linked ALS. EMBO Mol Med. 2016;8(12):1421–1437.
- Schmidt HR, Zheng S, Gurpinar E, et al. Crystal structure of the human sigma1 receptor. Nature. 2016;532(7600):527–530.
- Vollrath JT, Sechi A, Dreser A, et al. Loss of function of the ALS protein SigR1 leads to ER pathology associated with defective autophagy and lipid raft disturbances. Cell Death Dis. 2014;5:e1290.
- Dreser A, Vollrath JT, Sechi A, et al. The ALS-linked E102Q mutation in sigma receptor-1 leads to ER stress-mediated defects in protein homeostasis and dysregulation of RNA-binding proteins. Cell Death Differ. 2017;24(10):1655–1671.
- Schrock JM, Spino CM, Longen CG, et al. Sequential cytoprotective responses to Sigma1 ligand-induced endoplasmic reticulum stress. Mol Pharmacol. 2013;84(5):751–762.
- Kasahara R, Yamamoto N, Suzuki K, et al. The sigma1 receptor regulates accumulation of GM1 ganglioside-enriched autophagosomes in astrocytes. Neuroscience. 2017;340:176–187.
- Cao L, Walker MP, Vaidya NK, et al. Cocaine-mediated autophagy in astrocytes involves sigma 1 receptor, PI3K, mTOR, Atg5/7, Beclin-1 and induces Type II programed cell death. Mol Neurobiol. 2016;53(7):4417–4430.
- MacVicar TDB, Mannack LVJC, Lees RM, et al. Targeted siRNA screens identify ER-to-mitochondrial calcium exchange in autophagy and mitophagy responses in RPE1 cells. Int J Mol Sci. 2015;16(6):13356–13380.
- Yang H, Mavlyutov TA, Guo L-W. An essential role of the sigma-1 receptor in mitophagy and autophagosome-lysosome fusion. Invest Ophthalmol Vis Sci. 2017;58: 1603. abstract (oral presentation).
- Mavlyutov TA, Yang H, Epstein ML, et al. APEX2-enhanced electron microscopy distinguishes sigma-1 receptor localization in the nucleoplasmic reticulum. Oncotarget. 2017;8(31):51317–51330.
- Mavlyutov TA, Ruoho AE. Ligand-dependent localization and intracellular stability of sigma-1 receptors in CHO-K1 cells. J Mol Signal. 2007;2:8.
- Kagan VE, Jiang J, Huang Z, et al. NDPK-D (NM23-H4)-mediated externalization of cardiolipin enables elimination of depolarized mitochondria by mitophagy. Cell Death Differ. 2016;23(7):1140–1151.
- Geisler S, Holmström KM, Skujat D, et al. PINK1/Parkin-mediated mitophagy is dependent on VDAC1 and p62/SQSTM1. Nat Cell Biol. 2010;12(2):119–131.
- Callegari S, Oeljeklaus S, Warscheid B, et al. Phospho-ubiquitin-PARK2 complex as a marker for mitophagy defects. Autophagy. 2017;13(1):201–211.
- Nguyen TN, Padman BS, Lazarou M. Deciphering the molecular signals of PINK1/Parkin mitophagy. Trends Cell Biol. 2016;26(10):733–744.
- Vives-Bauza C, Zhou C, Huang Y, et al. PINK1-dependent recruitment of Parkin to mitochondria in mitophagy. Proc Natl Acad Sci U S A. 2010;107(1):378–383.
- Mizushima N, Yoshimori T, Levine B. Methods in mammalian autophagy research. Cell. 2010;140(3):313–326.
- Yamano K, Matsuda N, Tanaka K. The ubiquitin signal and autophagy: an orchestrated dance leading to mitochondrial degradation. EMBO Rep. 2016;17(3):300–316.
- Hamasaki M, Furuta N, Matsuda A, et al. Autophagosomes form at ER-mitochondria contact sites. Nature. 2013;495(7441):389–393.
- Yamamoto A, Tagawa Y, Yoshimori T, et al. Bafilomycin A1 prevents maturation of autophagic vacuoles by inhibiting fusion between autophagosomes and lysosomes in rat hepatoma cell line, H-4-II-E cells. Cell Struct Funct. 1998;23(1):33–42.
- Velikkakath AKG, Nishimura T, Oita E, et al. Mammalian Atg2 proteins are essential for autophagosome formation and important for regulation of size and distribution of lipid droplets. Mol Biol Cell. 2012;23(5):896–909.
- Wang Y, Li L, Hou C, et al. SNARE-mediated membrane fusion in autophagy. Semin Cell Dev Biol. 2016;60:97–104.
- Stoka V, Turk V, Turk B. Lysosomal cathepsins and their regulation in aging and neurodegeneration. Ageing Res Rev. 2016;32:22–37.
- Liu R, Zhi X, Zhong Q. ATG14 controls SNARE-mediated autophagosome fusion with a lysosome. Autophagy. 2015;11(5):847–849.
- Shyu YJ, Hiatt SM, Duren HM, et al. Visualization of protein interactions in living Caenorhabditis elegans using bimolecular fluorescence complementation analysis. Nat Protoc. 2008;3(4):588–596.
- Padman BS, Bach M, Lucarelli G, et al. The protonophore CCCP interferes with lysosomal degradation of autophagic cargo in yeast and mammalian cells. Autophagy. 2013;9(11):1862–1875.
- Li L, Zhong Q. Autophagosome-lysosome fusion: pIs to the rescue. Embo J. 2016;35(17):1845–1847.
- Nguyen L, Lucke-Wold BP, Mookerjee SA, et al. Role of sigma-1 receptors in neurodegenerative diseases. J Pharmacol Sci. 2015;127(1):17–29.
- Mavlyutov TA, Guo LW. Peeking into sigma-1 receptor functions through the retina. Adv Exp Med Biol. 2017;964:285–297.
- Su TP, Su T-C, Nakamura Y, et al. The Sigma-1 receptor as a pluripotent modulator in living systems. Trends Pharmacol Sci. 2016;37(4):262–278.
- Kim FJ, Kovalyshyn I, Burgman M, et al. Sigma 1 receptor modulation of G-protein-coupled receptor signaling: potentiation of opioid transduction independent from receptor binding. Mol Pharmacol. 2010;77(4):695–703.
- Miyagawa K, Oe S, Honma Y, et al. Lipid-induced endoplasmic reticulum stress impairs selective autophagy at the step of autophagosome-lysosome fusion in hepatocytes. Am J Pathol. 2016;186(7):1861–1873.
- Wu Z, Bowen WD. Role of sigma-1 receptor C-terminal segment in inositol 1,4,5-trisphosphate receptor activation: constitutive enhancement of calcium signaling in MCF-7 tumor cells. J Biol Chem. 2008;283(42):28198–28215.
- Mavylutov T, Chen X, Guo L, et al. APEX2- tagging of Sigma 1-receptor indicates subcellular protein topology with cytosolic N-terminus and ER luminal C-terminus. Protein Cell. 2018;9(8):733–737.
- Chu UB, Ruoho AE. Biochemical pharmacology of the sigma-1 receptor. Mol Pharmacol. 2016;89(1):142–153.
- Ramirez-Peinado S, León-Annicchiarico CL, Galindo-Moreno J, et al. Glucose-starved cells do not engage in prosurvival autophagy. J Biol Chem. 2013;288(42):30387–30398.
- Ni HM, Bockus A, Wozniak AL, et al. Dissecting the dynamic turnover of GFP-LC3 in the autolysosome. Autophagy. 2011;7(2):188–204.
- Cayouette M, Whitmore AV, Jeffery G, et al. Asymmetric segregation of Numb in retinal development and the influence of the pigmented epithelium. J Neurosci. 2001;21(15):5643–5651.
- Cai Q, Zakaria HM, Simone A, et al. Spatial parkin translocation and degradation of damaged mitochondria via mitophagy in live cortical neurons. Curr Biol. 2012;22(6):545–552.
- Chu UB, Mavlyutov TA, Chu M-L, et al. The Sigma-2 receptor and progesterone receptor membrane component 1 are different binding sites derived from independent genes. EBioMedicine. 2015;2(11):1806–1813.
- Sanjana NE, Shalem O, Zhang F. Improved vectors and genome-wide libraries for CRISPR screening. Nat Methods. 2014;11(8):783–784.
- Kearns NA, Genga RM, Enuameh MS, et al. Cas9 effector-mediated regulation of transcription and differentiation in human pluripotent stem cells. Development. 2014;141(1):219–223.
- Lu Y, Hao B-X, Graeff R, et al. Two pore channel 2 (TPC2) inhibits autophagosomal-lysosomal fusion by alkalinizing lysosomal pH. J Biol Chem. 2013;288(33):24247–24263.
- Bardet PL, Kolahgar G, Mynett A, et al. A fluorescent reporter of caspase activity for live imaging. Proc Natl Acad Sci U S A. 2008;105(37):13901–13905.