
ABSTRACT
Oxidative stress underlies a number of pathological conditions, including cancer, neurodegeneration, and aging. Antioxidant-rich foods help maintain cellular redox homeostasis and mitigate oxidative stress, but the underlying mechanisms are not clear. For example, sulforaphane (SFN), an electrophilic compound that is enriched in cruciferous vegetables such as broccoli, is a potent inducer of cellular antioxidant responses. NFE2L2/NRF2 (nuclear factor, erythroid 2 like 2), a transcriptional factor that controls the expression of multiple detoxifying enzymes through antioxidant response elements (AREs), is a proposed target of SFN. NFE2L2/NRF2 is a target gene of TFEB (transcription factor EB), a master regulator of autophagic and lysosomal functions, which we show here to be potently activated by SFN. SFN induces TFEB nuclear translocation via a Ca2+-dependent but MTOR (mechanistic target of rapamycin kinase)-independent mechanism through a moderate increase in reactive oxygen species (ROS). Activated TFEB then boosts the expression of genes required for autophagosome and lysosome biogenesis, which are known to facilitate the clearance of damaged mitochondria. Notably, TFEB activity is required for SFN-induced protection against both acute oxidant bursts and chronic oxidative stress. Hence, by simultaneously activating macroautophagy/autophagy and detoxifying pathways, natural compound SFN may trigger a self-defense cellular mechanism that can effectively mitigate oxidative stress commonly associated with many metabolic and age-related diseases.
Abbreviations: ANOVA: analyzes of variance; AREs: antioxidant response elements; Baf-A1: bafilomycin A1; BHA: butylhydroxyanisole; CAT: catechin hydrate; CCCP: carbonyl cyanide m- chlorophenylhydrazone; CLEAR: coordinated lysosomal expression and regulation; DCFH-DA: 2ʹ,7ʹ-dichlorofluorescin diacetate; FBS: fetal bovine serum; GFP: green fluorescent protein; HMOX1/HO-1: heme oxygenase 1; KD: knockdown; KEAP1: kelch like ECH associated protein 1; KO: knockout; LAMP1: lysosomal associated membrane protein 1; MCOLN1/TRPML1: mucolipin 1; ML-SA1: mucolipin-specific synthetic agonist 1; ML-SI3: mucolipin-specific synthetic inhibitor 3; MTOR: mechanistic target of rapamycin kinase; MTORC1: mechanistic target of rapamycin kinase complex 1; NAC: N-acetylcysteine; NFE2L2/NRF2: nuclear factor: erythroid 2 like 2; NPC: Niemann–Pick type C; PBS: phosphate-buffered saline; PPP2/PP2A: protein phosphatase 2; Q-PCR: real time polymerase chain reaction; ROS: reactive oxygen species; RPS6KB1/S6K1/p70S6K: ribosomal protein S6 kinase B1; SFN: sulforaphane; TFEB: transcription factor EB; WT, wild-type
Introduction
Reactive oxygen species (ROS), formed by the partial reduction of oxygen, are toxic to mammalian cells [Citation1,Citation2]. Under physiological conditions, ROS are generated in the mitochondria during aerobic metabolism [Citation3,Citation4]; under pathological conditions when mitochondria are damaged by environmental and genetic factors, cellular ROS levels may be dramatically elevated [Citation3,Citation4]. To protect against oxidative damage to biomolecules such as proteins and lipids, cells have developed various antioxidant and detoxifying mechanisms [Citation2,Citation4]. An imbalance between cellular pro-oxidant and antioxidant processes leads to oxidative burden and stress (distress), which occurs in a variety of metabolic, degenerative, and inflammatory diseases, as well as aging [Citation1,Citation5,Citation6]. Although non-enzymatic oxidant scavengers and antioxidant agents, e.g., vitamin C and N-acetylcysteine (NAC), have been tested in many disease models, their efficacy is generally low, which may be explained by the double-edged nature of ROS in redox homeostasis [Citation4,Citation7]. While high levels of ROS cause severe oxidative damage to cellular machinery, a moderate increase in the ROS level could serve as a useful “stress” or “eustress” signal to trigger cell-survival mechanisms [Citation2,Citation4]. Hence, better antioxidant strategies should be developed in order to prevent excessive ROS production while maintaining a physiological level of ROS in the cytoplasm [Citation4,Citation7].
NFE2L2/NRF2 (nuclear factor, erythroid 2 like 2) is a transcriptional regulator of many antioxidant proteins and phase II detoxifying enzymes, acting through binding to antioxidant response elements (AREs) [Citation8]. Upon acute increases in ROS, KEAP1 (kelch like ECH associated protein 1), a negative regulator of NFE2L2, is inactivated, which enables NFE2L2 translocation from cytosol to the nucleus [Citation8,Citation9]. The subsequent nuclear accumulation of NFE2L2 induces expression of antioxidant proteins and detoxifying enzymes [Citation8,Citation9] (see ). Prolonged elevation of ROS also reportedly boosts levels of Nfe2l2 mRNA via unknown mechanisms [Citation10]. An increase in the cellular ROS level is also known to trigger mitophagy, a specialized variant of macroautophagy/autophagy [Citation11]. Autophagy is a multi-step catabolic process that includes autophagosome biogenesis, lysosome biogenesis, autophagosome-lysosome fusion, and lysosomal degradation [Citation12,Citation13]. When mitochondria are damaged, the resulting ROS production may induce mitophagy as a negative feedback quality-control mechanism to maintain mitochondrial homeostasis [Citation11,Citation14]. Defective mitophagy impairs clearance of damaged mitochondria, leading to ROS overproduction and oxidative distress [Citation4,Citation6]. Hence, mitophagy plays an essential role in the regulation of cellular redox homeostasis [Citation11]. TFEB (transcription factor EB), a basic helix-loop-helix leucine zipper, acts as a master regulator of autophagic and lysosomal functions, regulating cellular homeostasis under various cellular stress conditions such as nutrient starvation and oxidative stress [Citation15–17]. TFEB binds to “coordinated lysosomal expression and regulation (CLEAR)” motifs located in the promoter regions of tens to hundreds of autophagic and lysosomal genes [Citation15–17]. TFEB activity is regulated by phosphorylation [Citation18–20], keeping cytoplasmic TFEB inactive; dephosphorylated TFEB travels to the nucleus, inducing expression of autophagic and lysosomal genes [Citation21] (see ). For example, under conditions of starvation, inhibition of the lysosomal kinase mechanistic target of rapamycin kinase complex 1 (MTORC1) suppresses the phosphorylation of TFEB [Citation18,Citation22,Citation23]. Likewise, following mitochondrial damage, elevated ROS levels may activate calcineurin, e.g., through lysosomal Ca2+ release, to dephosphorylate TFEB [Citation21,Citation24–26].
Many natural compounds in food are known to exert antioxidant properties, but the underlying mechanisms are not clear [Citation27]. One such compound, sulforaphane (SFN) (), is an electrophilic compound that is enriched in broccoli [Citation28]. SFN induces robust antioxidant responses and nuclear accumulation of NFE2L2 [Citation28]. In the current study, we found that SFN also robustly activated TFEB to promote autophagic flux and lysosome biogenesis. More importantly, as the promoter region of the NFE2L2 gene harbors a CLEAR site, TFEB activation upregulated the expression of NFE2L2 and its downstream antioxidant genes. Genetic inactivation or pharmacological inhibition of TFEB prevented the autophagy induction and ROS removal effects of SFN, highlighting an essential role of TFEB in SFN-induced antioxidant responses.
Figure 1. SFN promotes autophagic flux. (A) Chemical structure of SFN. (B) SFN treatment increased the number of autophagosomes. HeLa cells stably expressing mRFP-GFP-LC3 were treated with SFN (5–15 μM) for 9 h. Scale bar: 10 μm or 2 μm (for zoom-in images). (C) Quantification of autophagosome formation shown in B. N = 30–40 randomly selected cells from at least 4 independent experiments. Experimenters were blind to the treatment conditions. (D) Western blot analysis of LC3-II protein expression in HeLa cells that were treated with SFN (15 μM, 3–9 h). Torin1 (1 μM) was used as a positive control to induce autophagosome formation. (E) Quantitative analysis of LC3-II levels shown in D. from n = 4 independent experiments. (F) Western blot analysis of LC3-II protein expression with or without SFN (15 μM, 9 h) treatment, and in the presence and absence of Baf-A1 (0.5 μM; used as an inhibitor of autophagosome-lysosome fusion [Citation30]) in HeLa cells. (G) Quantification of results shown in F. (n = 3 independent experiments). For all panels, data are presented as mean ± s.e.m.; *P < 0.05, ANOVA
![Figure 1. SFN promotes autophagic flux. (A) Chemical structure of SFN. (B) SFN treatment increased the number of autophagosomes. HeLa cells stably expressing mRFP-GFP-LC3 were treated with SFN (5–15 μM) for 9 h. Scale bar: 10 μm or 2 μm (for zoom-in images). (C) Quantification of autophagosome formation shown in B. N = 30–40 randomly selected cells from at least 4 independent experiments. Experimenters were blind to the treatment conditions. (D) Western blot analysis of LC3-II protein expression in HeLa cells that were treated with SFN (15 μM, 3–9 h). Torin1 (1 μM) was used as a positive control to induce autophagosome formation. (E) Quantitative analysis of LC3-II levels shown in D. from n = 4 independent experiments. (F) Western blot analysis of LC3-II protein expression with or without SFN (15 μM, 9 h) treatment, and in the presence and absence of Baf-A1 (0.5 μM; used as an inhibitor of autophagosome-lysosome fusion [Citation30]) in HeLa cells. (G) Quantification of results shown in F. (n = 3 independent experiments). For all panels, data are presented as mean ± s.e.m.; *P < 0.05, ANOVA](/cms/asset/e5139bc0-f6d0-4f9c-9297-b22c1b3246c5/kaup_a_1739442_f0001_oc.jpg)
Results
SFN promotes autophagic flux and lysosome biogenesis
We studied the effects of SFN on autophagy in HeLa cells stably expressing the mRFP-GFP-LC3 reporter, in which mRFP+ GFP+ and mRFP+ GFP− puncta indicate non-acidified autophagosomes and acidified autolysosomes, respectively [Citation13]. Tissue concentrations of SFN can reach 3–30 μM upon broccoli consumption [Citation29], so we used low micromolar concentrations of SFN (5–15 μM) in our study. At the concentrations of 10–15 μM, but not at lower concentrations (e.g., 5 μM), SFN treatment for 9 h caused a 6-fold increase in the percentage of mRFP+ GFP+ yellow puncta (). Consistently, western blot analysis revealed that SFN (15 μM, 3–9 h) treatment markedly increased endogenous LC3-II levels in HeLa cells (). We also observed similar results in several other human cell lines, including 1321N1 (human astrocytoma), HepG2 (human hepatocellular carcinoma), and human fibroblast cells (Fig. S1A-C). SFN-induced increases of LC3-II expression were furthered boosted when we treated HeLa cells with bafilomycin A1 (Baf-A1), a V-ATPase inhibitor that can effectively block autophagosome-lysosome fusion [Citation30] (, S2A, and B). Hence, in agreement with previous studies [Citation31], SFN promotes autophagic flux.
We next investigated the effects of SFN on lysosome function. In HeLa cells, SFN (10–15 μM, 3–9 h) treatment significantly increased the immunofluorescence intensity of LAMP1 (lysosomal associated membrane protein 1), a resident marker protein of late endosomes and lysosomes (referred to as “lysosomes” for simplicity hereafter), in a time and dose-dependent manner (, S3A, and B). Western blot analyzes also revealed gradual (within hours) increases in the expression of LAMP1 proteins upon SFN (15 μM, 3–9 h) treatment in HeLa cells (). Lysosomal enzymes operate better under acidic conditions, and the degradation-active lysosomes can be tracked using LysoTracker, a fluorescent acidotropic probe [Citation32]. We observed significant increases of LysoTracker staining in HeLa cells following 9 h treatment with SFN (10–15 μM) (. Collectively, these results suggest that SFN also promotes lysosome function and biogenesis.
Figure 2. SFN promotes lysosomal biogenesis. (A) LAMP1 staining in SFN-treated (15 μM, 3–9 h) HeLa cells. Nuclei were counterstained with DAPI (blue). Scale bar: 10 μm or 2 μm (for zoom-in images). (B) Quantification of LAMP1 immunofluorescence shown in A. N = 30–40 randomly selected cells from at least 3 independent experiments. (C) Western blot analysis of LAMP1 protein expression in HeLa cells that were treated with SFN (15 μM, 3–9 h). GAPDH served as a loading control. (D) Quantitative analysis of LAMP1 levels, as shown in C. n = 3 independent experiments. (E) Effects of SFN on lysosome activation. HeLa cells were treated with SFN (10 or 15 μM) for 9 h, and then stained with LysoTracker Red DND-99 (50 nM; labeling acidified lysosomes [Citation24]) for 15 min. Scale bar: 10 μm or 2 μm (for zoom-in images). (F) Quantification of LysoTracker intensity, as shown in E. N = 30–40 randomly selected cells from at least 3 independent experiments. For all panels, data are presented as mean ± s.e.m.; *P < 0.05, ANOVA
![Figure 2. SFN promotes lysosomal biogenesis. (A) LAMP1 staining in SFN-treated (15 μM, 3–9 h) HeLa cells. Nuclei were counterstained with DAPI (blue). Scale bar: 10 μm or 2 μm (for zoom-in images). (B) Quantification of LAMP1 immunofluorescence shown in A. N = 30–40 randomly selected cells from at least 3 independent experiments. (C) Western blot analysis of LAMP1 protein expression in HeLa cells that were treated with SFN (15 μM, 3–9 h). GAPDH served as a loading control. (D) Quantitative analysis of LAMP1 levels, as shown in C. n = 3 independent experiments. (E) Effects of SFN on lysosome activation. HeLa cells were treated with SFN (10 or 15 μM) for 9 h, and then stained with LysoTracker Red DND-99 (50 nM; labeling acidified lysosomes [Citation24]) for 15 min. Scale bar: 10 μm or 2 μm (for zoom-in images). (F) Quantification of LysoTracker intensity, as shown in E. N = 30–40 randomly selected cells from at least 3 independent experiments. For all panels, data are presented as mean ± s.e.m.; *P < 0.05, ANOVA](/cms/asset/e39e59a4-42e8-4a21-9128-a9db18392c74/kaup_a_1739442_f0002_oc.jpg)
SFN induces TFEB nuclear translocation and expression of TFEB target genes
We studied the mechanisms by which SFN led to enhanced lysosomal and autophagic function. TFEB is a known master regulator of autophagic and lysosomal function [Citation16]. We hypothesized that SFN might promote lysosome function and autophagy via TFEB activation. In HeLa cells stably expressing GFP-TFEB (HeLa TFEB stable cells), SFN (10–15 μM, 2–9 h) induced robust TFEB translocation from the cytosol to the nucleus in a dose- and time-dependent manner (Fig. S4A-D). Likewise, SFN (10–15 μM) treatment for 4 h induced nuclear translocation of endogenous TFEB in HeLa cells (), as well as in other human cell lines (Fig. S5A-C).
We next analyzed the mRNA expression of TFEB target genes, including a selected list of genes required for autophagosome and lysosome biogenesis, using quantitative real-time PCR (Q-PCR). Upon SFN treatment (15 μM, 9 h), transcript levels of multiple lysosomal genes (ATP6V1 H, CTSB, TPP1, and MCOLN1) and autophagic genes (SQSTM1, ULK1 and LC3) [Citation16] were significantly increased in both HeLa and 1321N1 cells ( and 6C). Together, these results suggest that SFN can increase autophagosome and lysosome biogenesis within hours through a TFEB-mediated lysosome-dependent transcriptional program.
SFN induces a moderate increase in ROS to activate TFEB
We next explored the mechanisms underlying SFN-induced TFEB activation. Both MTOR inhibition and ROS increases reportedly induce TFEB nuclear translocation [Citation18,Citation22–24,Citation26]. TFEB nuclear shuffling is negatively regulated by the activity of MTORC1, which is regulated by its phosphorylation status [Citation22]. As MTOR phosphorylation can, in turn, lead to downstream phosphorylation and activation of RPS6 KB1/S6 K1/p70S6K (ribosomal protein S6 kinase B1), the levels of either phosphorylated MTOR (p-MTOR) or RPS6KB1 (p-RPS6KB1) can serve as readouts of MTORC1 activity [Citation22]. We saw no significant inhibition of MTORC1 activity by SFN (15 μM, 6–12 h) treatment in HeLa cells (). Therefore, TFEB activation is unlikely to be mediated by MTOR inhibition.
Consistent with previous reports showing that ROS mediate some effects of SFN [Citation33,Citation34], in 1321N1 cells that have been widely used to study redox regulation due to the sensitivity to oxidative stress [Citation35,Citation36], SFN treatment for 2 h resulted in a mild increase of intracellular ROS (), as monitored by the ROS-sensitive dye 2ʹ,7ʹ-dichlorofluorescein diacetate (DCFH-DA) [Citation37]. SFN-induced ROS increases persisted up to 12 h (Fig. S6A and B). NAC (5 mM), a commonly used membrane-permeable antioxidant compound [Citation7], prevented SFN-induced increases in ROS (). Much more dramatic ROS increases were observed when mitochondria were damaged [Citation37] (e.g., see ), suggesting that SFN only induces a moderate increase in the ROS. Remarkably, SFN-induced TFEB nuclear accumulation was completely blocked by pretreatment of the cells by NAC (), or by other commonly used antioxidants, such as butylhydroxyanisole (BHA) and catechin hydrate (CAT) [Citation38] (Fig. S7A and B). In contrast, NAC did not affect torin1-induced TFEB nuclear translocation [Citation18,Citation22,Citation23] (). NAC also blocked SFN (15 μM, 9 h) -induced mRNA expression of TFEB target genes (), as well as SFN-induced autophagosome formation () and LAMP1 expression (Fig. S8). Collectively, these results suggest that SFN promotes TFEB-dependent autophagy and lysosome biogenesis via mild ROS generation.
Figure 3. SFN induces TFEB nuclear translocation and expression of TFEB target genes. (A) SFN (10 or 15 μM, 4 h) induced TFEB nuclear translocation in HeLa cells. Nuclei were counterstained with DAPI (blue). Scale bar: 10 μm. (B) Average ratios of nuclear vs. cytosolic TFEB immunoreactivity shown in A. N = 40–50 randomly selected cells from at least 5 independent experiments. (C) SFN (15 μM for 9 h) treatment increased mRNA expression of TFEB target genes in 1321N1 cells analyzed by Q-PCR (n = 3 independent experiments). (D) Western blot analysis of MTOR and RPS6KB1 activity, assayed by ratios of p-MTOR vs. total MTOR and p-RPS6KB1 vs. total RPS6KB1 in SFN (15 μM) -treated HeLa cells for 6–12 h. (E) Quantification of the results shown in D. from n = 3 independent experiments. For all panels, data are presented as mean ± s.e.m.; *P < 0.05, ANOVA
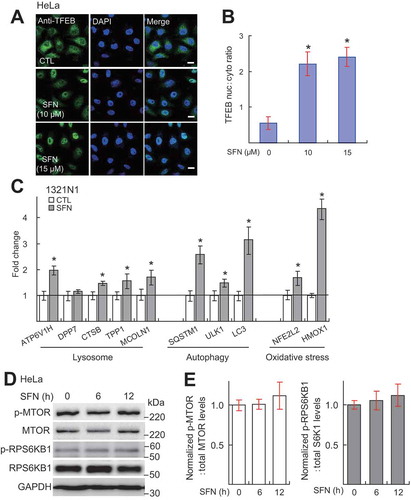
Figure 4. SFN regulates TFEB activation and autophagic induction via ROS elevation. (A) SFN (15 μM for 2 h) treatment increased cellular ROS levels, as measured by the fluorescence intensity of DCFH-DA (green; a ROS-sensitive dye [Citation24]) in 1321N1 cells. The increase was prevented by co-treatment of NAC (5 mM), a commonly used antioxidant compound [Citation24]. Scale bar: 40 μm. (B) Quantification of results shown in A. N = 30–40 randomly selected cells from 3 independent experiments. (C) NAC (5 mM) pretreatment blocked SFN (15 μM, 4 h)-induced, but not torin1 (1 μM)-induced TFEB translocation in HeLa GFP-TFEB stable cells. Nuclei were labeled with DAPI (blue). Scale bar: 10 μm or 2 μm (for zoom-in images). (D) Ratios of nuclear vs. cytosolic TFEB shown in C. N = 30–40 randomly selected cells from at least 4 independent experiments. (E) Effects of NAC (5 mM) co-treatment on SFN (15 μM, 9 h) -induced expression of TFEB target autophagic genes in 1321N1 cells (n = 3 independent experiments). (F) Effects of NAC (5 mM) co-treatment on SFN-induced autophagosome accumulation in HeLa cells stably expressing mRFP-GFP-LC3. Scale bar: 10 μm. (G) Quantitative analysis of results shown in F. (N = 30–40 randomly selected cells from 3 independent experiments). For all panels, data are presented as mean ± s.e.m.; *P < 0.05, ANOVA
![Figure 4. SFN regulates TFEB activation and autophagic induction via ROS elevation. (A) SFN (15 μM for 2 h) treatment increased cellular ROS levels, as measured by the fluorescence intensity of DCFH-DA (green; a ROS-sensitive dye [Citation24]) in 1321N1 cells. The increase was prevented by co-treatment of NAC (5 mM), a commonly used antioxidant compound [Citation24]. Scale bar: 40 μm. (B) Quantification of results shown in A. N = 30–40 randomly selected cells from 3 independent experiments. (C) NAC (5 mM) pretreatment blocked SFN (15 μM, 4 h)-induced, but not torin1 (1 μM)-induced TFEB translocation in HeLa GFP-TFEB stable cells. Nuclei were labeled with DAPI (blue). Scale bar: 10 μm or 2 μm (for zoom-in images). (D) Ratios of nuclear vs. cytosolic TFEB shown in C. N = 30–40 randomly selected cells from at least 4 independent experiments. (E) Effects of NAC (5 mM) co-treatment on SFN (15 μM, 9 h) -induced expression of TFEB target autophagic genes in 1321N1 cells (n = 3 independent experiments). (F) Effects of NAC (5 mM) co-treatment on SFN-induced autophagosome accumulation in HeLa cells stably expressing mRFP-GFP-LC3. Scale bar: 10 μm. (G) Quantitative analysis of results shown in F. (N = 30–40 randomly selected cells from 3 independent experiments). For all panels, data are presented as mean ± s.e.m.; *P < 0.05, ANOVA](/cms/asset/df6c03f9-068e-43cb-b390-70ff810d8f3e/kaup_a_1739442_f0004_oc.jpg)
Ca2+-dependence of SFN-induced TFEB activation
ROS reportedly activate TFEB by increasing lysosomal MCOLN1/TRPML1 (mucolipin 1)-dependent Ca2+ release, which leads to dephosphorylation of TFEB through the Ca2+-dependent protein phosphatase calcineurin or protein phosphatase 2A (PPP2/PP2A) [Citation24,Citation26]. MCOLN1 is the principle Ca2+-permeant channel on the lysosomal membrane that releases Ca2+ from the lumen into the cytosol upon cellular stimulation [Citation39]. Consistent with a role of Ca2+ in TFEB activation, SFN-induced (15 μM, 4 h) TFEB nuclear translocation was blocked by pretreatment with BAPTA-AM, a membrane-permeable Ca2+ chelator, in both HeLa ( and B) and GFP-TFEB stable cells (Fig. S9A and B). In MCOLN1-transfected HEK293 cells, lysosomal Ca2+ release evoked by mucolipin-specific synthetic agonist 1 (ML-SA1), a synthetic agonist of MCOLN1 [Citation40], was increased after 4 h pretreatment with SFN (15 μM; ), and the increase was blocked by NAC pretreatment (). Nevertheless, the acute application of SFN (15 μM) failed to evoke lysosomal Ca2+ release (), suggesting that SFN-induced ROS elevation may sensitize MCOLN1 channels to promote lysosomal Ca2+ release, as shown previously with other ROS-induction manipulations [Citation24,Citation25]. However, inhibition of MCOLN1 by mucolipin-specific synthetic inhibitor 3 (ML-SI3, 10 μM), a synthetic inhibitor of MCOLN1 [Citation24], only partially blocked SFN-induced (15 μM, 4 h) TFEB nuclear translocation (Fig. S10A and B). Moreover, SFN-induced TFEB activation was seen in both wild-type (WT) and ML-IV human fibroblasts (i.e., MCOLN1-null fibroblasts from mucolipidosis type IV patients [Citation24]) (Fig. S11A and B). Together, these results suggest that besides MCOLN1 [Citation24], additional ROS- and Ca2+-dependent mechanisms may also contribute to SFN-induced TFEB activation.
Figure 5. SFN induces TFEB translocation through Ca2+-calcineurin-mediated de-phosphorylation of TFEB. (A) BAPTA-AM (10 μM, 1 h; a membrane-permeable Ca2+ chelator [Citation24]) pretreatment blocked SFN (15 μM, 4 h)-induced TFEB nuclear translocation in HeLa cells. Scale bar: 10 μm (B) Quantification of results shown in A. N = 30–40 randomly selected cells from at least 4 independent experiments. (C) The effects of SFN (15 μM) and NAC (5 mM) co-treatment for 4 h on ML-SA1 (20 μM; synthetic agonist of MCOLN1 [Citation40])-induced Ca2+ release, measured with Fura-2 (F340/F380) imaging, in MCOLN1-expressing HEK293 cells. Mean ± s.e.m. is shown from at least 30 cells per coverslip. Ionomycin was used to achieve the maximal Ca2+ response. (D) Quantification of results shown in C. from n = 3 independent experiments. (E) Acute application of SFN did not evoke lysosomal Ca2+ release. SFN (15 μM) did not evoke Ca2+ release, measured with the GCaMP3 signal (F470), in GCaMP3-MCOLN1-expressing HEK293 cells. ML-SA1 (20 μM) readily elicited rapid and robust Ca2+ release in the same cells. (F) FK506 (5 μM; a calcineurin inhibitor [Citation21]), but not okadaic acid (50 nM; a PP2A inhibitor [Citation21]) inhibited SFN (15 μM)-mediated TFEB nuclear localization in HeLa GFP-TFEB stable cells. Scale bar: 10 μm. (G) Quantification of results shown in F. N = 30–40 randomly selected cells from 3 independent experiments. (H) SFN (15 μM for 4 h) induced downshift of endogenous TFEB electrophoretic mobility. TFEB was detected using a specific antibody against TFEB, and TFEB KO HeLa cells were used as a negative control. Experiments were repeated multiple times and a representative blot was shown. For all panels, data are presented as mean ± s.e.m.; *P < 0.05, ANOVA
![Figure 5. SFN induces TFEB translocation through Ca2+-calcineurin-mediated de-phosphorylation of TFEB. (A) BAPTA-AM (10 μM, 1 h; a membrane-permeable Ca2+ chelator [Citation24]) pretreatment blocked SFN (15 μM, 4 h)-induced TFEB nuclear translocation in HeLa cells. Scale bar: 10 μm (B) Quantification of results shown in A. N = 30–40 randomly selected cells from at least 4 independent experiments. (C) The effects of SFN (15 μM) and NAC (5 mM) co-treatment for 4 h on ML-SA1 (20 μM; synthetic agonist of MCOLN1 [Citation40])-induced Ca2+ release, measured with Fura-2 (F340/F380) imaging, in MCOLN1-expressing HEK293 cells. Mean ± s.e.m. is shown from at least 30 cells per coverslip. Ionomycin was used to achieve the maximal Ca2+ response. (D) Quantification of results shown in C. from n = 3 independent experiments. (E) Acute application of SFN did not evoke lysosomal Ca2+ release. SFN (15 μM) did not evoke Ca2+ release, measured with the GCaMP3 signal (F470), in GCaMP3-MCOLN1-expressing HEK293 cells. ML-SA1 (20 μM) readily elicited rapid and robust Ca2+ release in the same cells. (F) FK506 (5 μM; a calcineurin inhibitor [Citation21]), but not okadaic acid (50 nM; a PP2A inhibitor [Citation21]) inhibited SFN (15 μM)-mediated TFEB nuclear localization in HeLa GFP-TFEB stable cells. Scale bar: 10 μm. (G) Quantification of results shown in F. N = 30–40 randomly selected cells from 3 independent experiments. (H) SFN (15 μM for 4 h) induced downshift of endogenous TFEB electrophoretic mobility. TFEB was detected using a specific antibody against TFEB, and TFEB KO HeLa cells were used as a negative control. Experiments were repeated multiple times and a representative blot was shown. For all panels, data are presented as mean ± s.e.m.; *P < 0.05, ANOVA](/cms/asset/a5cbf45f-d9a4-4eaa-8908-693d8e6f5410/kaup_a_1739442_f0005_oc.jpg)
Inhibition of calcineurin with FK506 [Citation21] significantly reduced SFN-induced TFEB nuclear translocation in HeLa GFP-TFEB stable cells (). In contrast, treatment with okadaic acid, a PP2A inhibitor [Citation26], did not affect SFN-induced TFEB nuclear translocation (). Furthermore, SFN treatment led to the TFEB band mobility shift (), suggesting the dephosphorylation of TFEB by SFN [Citation21]. In TFEB knockout (KO) HeLa cells that were generated using the CRISPR-Cas9 system [Citation24,Citation41], transfection of constitutively active TFEBS211A-mCherry (S211 non-phosphorylatable mutant) [Citation42], but not WT TFEB-mCherry, resulted in predominant nuclear localization of TFEB in the presence or absence of SFN or FK506 (Fig. S12A and B). Collectively, these results suggested that calcineurin-mediated TFEB dephosphorylation underlies SFN-induced TFEB activation.
TFEB is required for SFN-induced autophagy
We next investigated the role of TFEB in SFN-enhanced autophagy induction by using TFEB KO HeLa cells [Citation24]. In these cells, SFN-induced (15 μM, 9 h) increases in LC3-II expression were nearly abolished (). In contrast, torin1 treatment increased LC3-II expression in both WT and TFEB KO cells (). Q-PCR revealed that SFN-induced expression of TFEB-regulated autophagic genes, including SQSTM1, ATG7, ULK1, and LC3 [Citation16], was also dramatically reduced, although not abolished, in HeLa TFEB KO cells compared with HeLa WT cells (). Therefore, TFEB plays a major role, but additional mechanisms may contribute to SFN-induced expression of autophagic genes. One candidate is TFE3, which shares many lysosome-specific functions with TFEB [Citation17]. Indeed, SFN (15 μM, 4 h) treatment further increased TFE3 nuclear translocation in both WT and ML-IV human fibroblasts (Fig. S13). Together, these results suggest that TFEB-TFE3 activation contributes to SFN-induced autophagy.
TFEB is required for SFN-induced NFE2L2 transcription
SFN is known to regulate the NFE2L2-KEAP1-ARE detoxification pathway [Citation28]. In 1321N1 cells, consistent with previous studies showing that SFN upregulates the expression of NFE2L2 [Citation43], we found that mRNA levels of NFE2L2-regulated genes involved in antioxidant and detoxifying responses, such as HMOX1/HO-1 (heme oxygenase 1) [Citation9], as well as NFE2L2 itself, were increased by SFN treatment (). The promoter region of the NFE2L2 gene contains a CLEAR site, and its mRNA expression is increased upon TFEB overexpression [Citation44]. In TFEB KO cells, but not in WT cells, SFN (15 μM, 9 h) failed to increase NFE2L2 gene expression (). TFEB may also directly regulate HMOX1 gene expression via a potential CLEAR site on its promoter region [Citation45]. In NFE2L2 knockdown (KD) cells, SFN-induced increases of HMOX1 expression was dramatically reduced (Fig. S14A and B), suggesting that HMOX1 gene expression is dually regulated by TFEB/CLEAR and NFE2L2/ARE mechanisms.
Figure 6. TFEB is required for SFN-induced autophagic flux. (A) Western blot analysis of LC3-II protein expression in SFN (15 μM, 9 h)-treated WT and TFEB KO HeLa cells in the presence and absence of Baf-A1 (0.5 μM). Torin1 (1 μM) was used as a control to induce autophagy. (B) Quantitative analysis of LC3-II levels under various experimental conditions shown in A. from n = 5 independent experiments. (C) The effects of TFEB KO on SFN (15 μM, 9 h)-induced expression of autophagic genes in HeLa cells (n = 3 independent experiments). For all panels, data are presented as mean ± s.e.m.; *P < 0.05, ANOVA
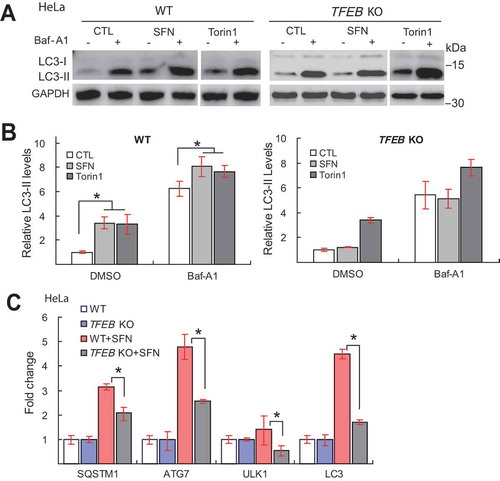
Figure 7. TFEB is required for SFN-induced expression of NFE2L2. (A) Effects of SFN (15 μM for 9 h) treatment on mRNA expression of NFE2L2 gene in WT and TFEB KO HeLa cells (n = 3 independent experiments). (B) Effects of SFN (15 μM, 4 h) treatment on NFE2L2 subcellular localization, detected by an anti-human NFE2L2 antibody in HepG2 cells. Nuclei were counterstained with DAPI (blue). Scale bar: 10 μm. (C) Ratios of nuclear vs. cytosolic NFE2L2 shown in B. N = 40–50 randomly selected cells from at least 4 independent experiments. (D) Western blot analysis of the KD efficiency of a specific TFEB-targeting siRNA in HepG2 cells (n = 3 independent repeats). (E) Effects of TFEB KD on SFN (15 μM, 4 h)-induced NFE2L2 nuclear translocation in HepG2 cells. Scale bar: 10 μm. (F) Average ratios of nuclear vs. cytosolic NFE2L2 immunoreactivity shown in E. N = 30–40 randomly selected cells from 3 independent experiments. For all panels, data are presented as mean ± s.e.m.; *P < 0.05, ANOVA
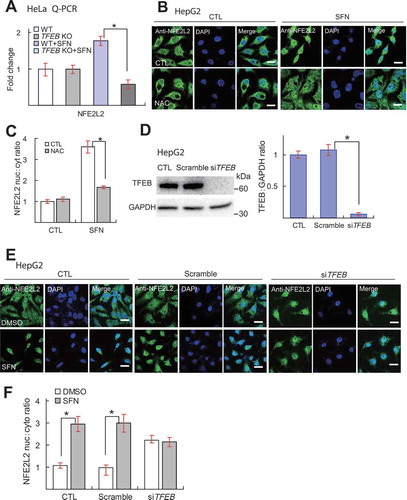
We next investigated the role of TFEB on SFN-induced NFE2L2 nuclear translocation. NFE2L2 proteins reportedly undergo nuclear translocation upon ROS elevation [Citation46]. Because of a high basal level of NFE2L2 nuclear localization in our HeLa cells (Fig. S15A and B), we used HepG2 cells, in which the majority of NFE2L2 proteins are in the cytoplasm, and NFE2L2-ARE activation is well documented [Citation47,Citation48]. Using a siRNA targeting TFEB with more than 90% KD efficiency (), we found that in HepG2 cells, SFN-induced (15 μM, 4 h) NFE2L2 nuclear translocation, although sensitive to NAC (), was not affected by siRNA-mediated KD of TFEB (). It could still be possible that the residual TFEB proteins in TFEB KD cells may mediate NFE2L2 translocation. However, remarkably, in TFEB KD HepG2 cells, NFE2L2 proteins accumulated mostly in the nucleus even in the absence of SFN (), suggestive of compensatory changes caused by TFEB downregulation. On the other hand, in GFP-TFEB stable cells, SFN-induced (15 μM, 4 h) TFEB nuclear translocation was not affected by NFE2L2 KD (Fig. S16A-C). Collectively, our data suggest that TFEB plays a crucial role in SFN-induced NFE2L2 transcription but not NFE2L2 activation and that there is a genetic interaction between these two transcriptional regulators of redox homeostasis.
TFEB is required for the efficient removal of excessive ROS by SFN
Because SFN is reported to exhibit antioxidant function by induction of cytoprotective enzymes [Citation49], we next investigated the role of TFEB in SFN-mediated antioxidant function. ROS levels increased dramatically when we treated 1321N1 cells with carbonyl cyanide m- chlorophenylhydrazone (CCCP) (10 μM), a mitochondrial respiration inhibitor [Citation50] ( and C). Consistent with previous studies showing the antioxidant function of SFN [Citation28], SFN treatment prevented CCCP-induced ROS increases in WT 1321N1 cells (), even though SFN alone induced a mild increase in ROS levels (Fig. S6). However, in TFEB KD cells (), SFN treatment failed to block CCCP-induced ROS increases. Hence, TFEB is required for SFN-mediated attenuation of excessive ROS reduction upon mitochondrial damage.
Figure 8. TFEB is required for SFN-induced removal of excessive ROS. (A) Western blot analysis of the KD efficiency of TFEB-targeting siRNA in 1321N1 cells (n = 3 independent experiments). (B) The effects of SFN (15 μM, 9 h) treatment and TFEB KD on CCCP (10 μM) -induced ROS increases, measured by DCFH-DA (green) imaging, in 1321N1 cells. Scale bar, 40 μm. (C) Quantification of results shown in B. from 40–50 randomly selected cells (n = 4). (D) Western blot analysis of the TFEB KD efficiency in NPC fibroblast cells (n = 3 independent experiments). (E) The effects of SFN (15 μM, 9 h) treatment and TFEB KD on ROS levels in NPC cells. Scale bar: 20 μm. (F) Quantitative analysis of ROS levels shown in E. N = 40–50 randomly selected cells from at least 4 independent experiments. For all panels, data are presented as mean ± s.e.m.; *P < 0.05, ANOVA
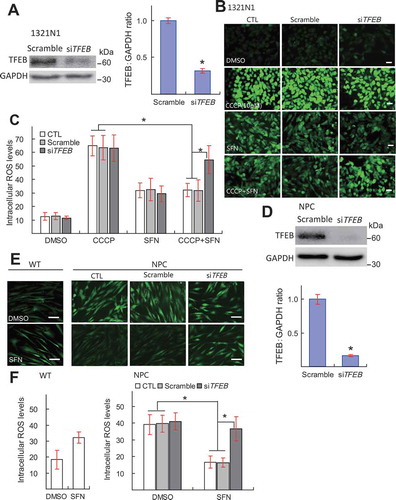
Oxidative stress is also known to occur when mitochondrial or lysosomal functions are genetically impaired [Citation1,Citation6]. For example, in fibroblast cells derived from Niemann–Pick Type C (NPC) disease patients, ROS levels are chronically elevated [Citation51] (). Upon SFN (15 μM, 9 h) treatment, however, intracellular ROS levels in NPC cells were reduced, and TFEB KD prevented this reduction (). In NPC cells, despite elevated ROS levels, endogenous TFEB remained largely in the cytosol, and SFN treatment robustly induced TFEB nuclear translocation (Fig. S17). Collectively, these results suggest that TFEB activation is required for SFN-induced ROS removal in cells with oxidative stress.
Discussion
In this study, we identified SFN, a natural compound isolated from broccoli, as a small-molecule activator of TFEB/TFE3. SFN induces TFEB activation by stimulating a moderate increase in ROS, which in turn increases the activity of Ca2+-calcineurin to dephosphorylate TFEB (). Activated TFEB then induces the expression of genes that are required for lysosomal biogenesis, autophagosome formation, and detoxification (). Subsequently, cells are pre-conditioned to activate a self-defense mechanism that protects against oxidative damage. Hence, SFN may be potentially developed into a therapeutic drug to mitigate oxidative stress occurring in a number of pathological conditions by boosting both autophagy and lysosome function.
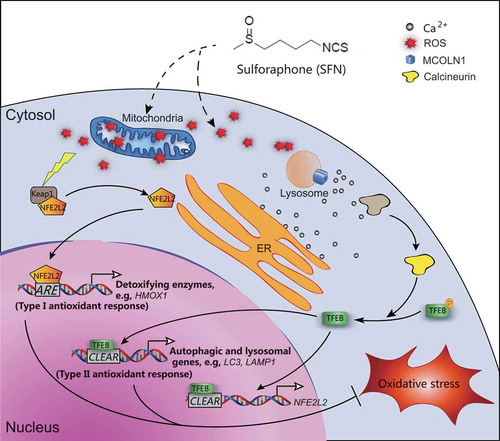
Figure 9. SFN induces a mild increase of ROS to activate TFEB-dependent lysosome biogenesis and autophagy, facilitating removal of excessive ROS. A working model to illustrate the role of TFEB in SFN-mediated enhancement of autophagic and lysosomal functions. A mild elevation in intracellular ROS levels by SFN, e.g., through mitochondrial and other sources, increases release of Ca2+, e.g., through lysosomal MCOLN1 channels and other unidentified Ca2+ release channels. Ca2+-bound calcineurin dephosphorylates TFEB to cause nuclear translocation of TFEB. Nuclear TFEB then promotes the transcription of a unique set of genes related to autophagy induction, autophagosome biogenesis, lysosome biogenesis, and detoxification (e.g., NFE2L2 and HMOX1). Subsequently, cells are pre-conditioned to promote the clearance of damaged mitochondria, removal of excessive ROS, and activation of detoxifying pathways
ROS are known to be a “double-edged sword” in the regulation of cellular health [Citation4,Citation7]. While high levels of ROS can cause severe oxidative damage to cellular components, a moderate increase in ROS can trigger cytoprotective mechanisms [Citation2,Citation4]. Hence, the moderate increase in ROS induced by SFN may be sufficient to pre-condition the cells against further oxidative damage.
Two types of cytoprotective and antioxidant responses are known to occur. First, activation and expression of detoxifying enzymes and antioxidant proteins may effectively remove the toxic (e.g., free-radical) species of oxidants, reducing oxidative damage. Multiple phases of such antioxidant/detoxifying responses may be induced [Citation8,Citation28]. An initial phase might be mediated by acute, post-translational modification (i.e., activation) of detoxifying enzymes and antioxidant proteins [Citation8,Citation52]. In the late phases, transcriptional and translational mechanisms may persistently increase the expression of detoxifying enzymes for a sustained antioxidant function [Citation8]. For example, the NFE2L2-ARE axis, which is regulated by ROS levels through KEAP1, may operate under chronic oxidative stress conditions [Citation8,Citation52]. Upon oxidation of KEAP1, NFE2L2 proteins translocate to the nucleus, where they promote the expression of detoxifying and antioxidant genes through AREs [Citation8]. The antioxidant response mediated by the NFE2L2-ARE pathway is referred to as type I antioxidant response ().
The second type of antioxidant response acts on the source of ROS generation. Damaged mitochondria may cause uncontrolled ROS production by triggering a vicious ROS-damage-ROS cycle [Citation3,Citation4,Citation37], and autophagy is the only known mechanism that can effectively remove damaged mitochondria to break the cycle [Citation1,Citation11]. In the initial phase, ROS are known to promote autophagosome formation through oxidation of ATG4, an integral component of autophagosome formation [Citation53]. Prolonged ROS elevation, however, promotes autophagy through lysosome-dependent transcriptional mechanisms [Citation24,Citation26]. To provide sustained supplies of lysosomes for autophagosome-lysosome fusion, ROS are known to promote lysosome biogenesis through TFEB activation [Citation17,Citation24]. The TFEB-CLEAR pathway is an example of a type II antioxidant response ().
It is not clear whether type I and II antioxidant responses regulate each other. To achieve maximal cytoprotection against oxidative damage, it is necessary to trigger both responses. SFN is known to activate type I responses [Citation28], and in the current study, we demonstrated that SFN also activates type II responses. As NFE2L2 is a target gene of TFEB, the type II TFEB-CLEAR response may directly regulate the type I response (). Indeed, the antioxidant effects of SFN were largely abolished when TFEB expression was depleted. Hence, TFEB, together with NFE2L2, may function as a key regulator of cellular redox homeostasis. Interestingly, in TFEB KD but not WT HepG2 cells, NFE2L2 is activated constitutively, suggesting that a genetic interaction may exist between the two transcription factors that regulate redox homeostasis.
Although we have thoroughly demonstrated that ROS increase is required for the effects of SFN, the site of action is not known. SFN, as a highly reactive electrophile, may also directly affect other protein mediators of type I and type II antioxidant responses [Citation54]. It is possible that the mild, non-harmful increase of ROS only serves as a permissive factor for SFN-induced TFEB and NFE2L2 activation. Because SFN pretreatment triggers antioxidant responses even in cells with high ROS levels, e.g., CCCP-challenged cells and NPC cells, it is very likely that SFN contributes to type I and II antioxidant responses through both ROS-dependent and -independent mechanisms [Citation29]. It is also possible that SFN-induced ROS generation may have unique properties, such as close proximity or fast kinetics, which allows robust TFEB activation. Lysosomal Ca2+ release mediated by MCOLN1 is thought to be important for TFEB activation through Ca2+-calcineurin signaling [Citation24] (). Additional sources of Ca2+ may also contribute to SFN-mediated TFEB activation but remain to be identified. Likewise, although TFEB appears to play an essential role in both type I and type II responses, TFE3 may also be activated by SFN to mediate the residual effects observed in TFEB KO cells. Other potent TFEB activators, including synthetic agonists of MCOLN1 [Citation24,Citation32], exhibit less antioxidant efficacy than SFN (data not shown). Hence, SFN may be uniquely positioned to achieve a maximal antioxidant effect via activation of multiple transcriptional factors. Thus, SFN offers an exceptional therapeutic opportunity for many metabolic and age-related diseases, in which oxidative stress and impaired autophagy both contribute to pathologies.
Materials and methods
Mammalian cell culture
HeLa (American Type Culture Collection, CCL-2), HepG2 (American Type Culture Collection, HB-8065) and 1321N1 cells (Sigma-Aldrich, 86030402) were cultured in Dulbecco’s modified Eagle’s medium (DMEM; Thermo Fisher Scientific, 11195–065) supplemented with 10% fetal bovine serum (FBS; Thermo Fisher Scientific, 10091148). HEK293 (American Type Culture Collection, CRL-1573) cells were cultured in the DMEM-F12 medium with 10% FBS. Human skin fibroblast cells from a mucolipidosis IV (MCOLN1-null) patient (clone GM02048), NPC patient-derived fibroblast cells (clone GM18453) [Citation55], and healthy control (clone GM03440) were obtained from the Coriell Institute for Medical Research (NJ, USA). Human fibroblast cells were maintained in modified Eagle’s medium (Thermo Fisher Scientific, 1964643) supplemented with 15% FBS and 2 mM glutamine (ThermoFisher Scientific, 25030081). Unless otherwise indicated, all cell cultures were maintained at 37°C in a humidified 5% CO2 incubator. HeLa cells were transfected with Lipofectamine 2000 (Thermo Fisher Scientific, 11668019). Culture media were refreshed 18–24 h post-transfection, and cells were split for the following experiments.
Stable and CRISPR-Cas9 KO cell lines
HEK293-GCaMP7-MCOLN1/TRPML1 and HeLa TFEB CRISPR-Cas9 KO cells were generated and characterized as reported previously [Citation24]. mRFP-GFP-LC3 and GFP-TFEB stable HeLa cell lines were kindly provided by Drs. David Rubinsztein (University of Cambridge) and Shawn Ferguson (Yale School of Medicine), respectively (see ref [Citation24].).
Immunofluorescence and confocal imaging
For immunofluorescence detection of TFEB, TFE3, and NFE2L2, cells were grown on coverslips, fixed with 4% paraformaldehyde (Solarbio, P1110), permeabilized with 0.1% Triton X-100 (Solarbio, T8200) and then blocked with 1% bovine serum albumin (Sigma-Aldrich, WXBC2612 V) in phosphate-buffered saline (PBS; Thermo Fisher Scientific, 21600069) for 1 h. For LAMP1 immunostaining, cells were fixed with 100% methanol for 8 min. Cells were incubated with various primary antibodies at 4°C overnight. The primary antibodies used in this study included anti-TFEB (Cell Signaling Technology, 4240), anti-TFE3 (Sigma-Aldrich, HPA023881), anti-LAMP1 (Abcam, ab24170), and anti-NFE2L2/NRF2 (Abcam, ab623521). Cells were then washed four times with PBS and incubated with secondary antibodies conjugated to Alexa Fluor 588 (GeneCopoeia, AF2K1517A) or 488 (Thermo Fisher Scientific, 1705869) for 1 h. After three washes with PBS, coverslips were mounted on slides with Fluoromount-G (Southern Biotech, 0100–01), and images were acquired with an Olympus or Zeiss confocal microscope.
Western blotting
Cells were lysed with ice-cold RIPA buffer (Solarbio, R0010) in the presence of 1× protease inhibitor cocktail (Sigma-Aldrich, P8340) and 1× phosphatase inhibitor cocktail (Abcam, GR304037-28). Protein samples (10–100 μg) were then loaded and separated on sodium dodecyl sulfate-polyacrylamide gel electrophoresis gels followed by the transfer to polyvinylidene difluoride membranes (Merck, R7DA8778E). Western blot analysis were performed using primary antibodies against TFEB (Cell Signaling Technology, 37785), NFE2L2/NRF2 (Abcam, ab31163), LC3 (Sigma-Aldrich, L8918), LAMP1 (Abcam, ab24170), MTOR (Cell Signaling Technology, 2972), p-MTOR (Sigma-Aldrich, SAB4504476), p-RPS6KB1/S6K1 (Cell Signaling Technology, 9234), RPS6KB1/S6K1 (Cell Signaling Technology, 2708), and GAPDH (Sigma-Aldrich, G9545). Bound antibodies were detected with horseradish peroxidase-conjugated anti-rabbit (Abcam, ab6721) or anti-mouse (Abcam, ab6789) secondary antibodies and enhanced chemiluminescence reagents (Thermo Fisher Scientific, 203–17071). As the abundance of most target proteins in the current study is relatively low, serial dilutions to determine the linear ranges of the target proteins and loading controls were only occasionally conducted. By varying exposure time, we empirically excluded the blots/images with signal saturation for analysis. Additionally, we also relied on an auto-exposure feature in a Li-COR Biosciences Odyssey Fc system to avoid overexposure and signal saturation. Band intensities were quantified using the NIH Image J software.
Ca2+ imaging
Fura-2 Ca2+ imaging was carried out in cells loaded with 5 μM Fura-2 AM (Abcam, ab120873) in the presence of Pluronic-F127 (Sigma-Aldrich, P2443) in the culture medium at 37°C for 1 h, as described previously [Citation55]. Fluorescence at two excitation wavelengths, F340 and F380, was recorded using an EasyRatioPro system. Fura-2 ratios (F340/F380) were used to monitor changes in intracellular [Ca2+] upon stimulation. Lysosomal Ca2+ release was measured under a zero-Ca2+ external solution, which contained 145 mM NaCl, 5 mM KCl, 3 mM MgCl2, 10 mM glucose (Sigma-Aldrich, G8270), 1 mM EGTA (Sigma-Aldrich, E3889), and 20 mM HEPES (pH 7.4) (Sigma-Aldrich, H3375); free [Ca 2+]o < 10 nM, estimated with Maxchelator software http://maxchelator.stanford.edu/.
GCaMP7 Ca2+ imaging was performed in HEK293 cells stably expressing GCaMP7-MCOLN1, a lysosome-targeted genetically-encoded Ca2+ sensor [Citation40]. The fluorescence intensity at 488 nm (F488) was recorded at 37°C with a spinning-disk confocal live-imaging system, which included an Olympus IX81 inverted microscope, 60x or 100x objective (Olympus), a CSU-X1 scanner (Yokogawa), an iXon EM-CCD camera (Andor) and MetaMorph Advanced Imaging acquisition software v.7.7.8.0 (Molecular Devices).
ROS and lysosomal pH imaging
ROS levels were detected using DCFH-DA dye (Sigma-Aldrich, 35848). Briefly, cells were incubated with 5 μM DCFH-DA in serum-free culture media at 37°C for 1 h, and washed with PBS before imaging. For measurement of lysosomal luminal pH, cells were incubated with 50 nM LysoTracker Red DND-99 (Thermo Fisher Scientific, L7528) in a complete culture medium for 15 min before imaging. The fluorescence was visualized with a CMLN-13S2 M-CS camera (Point Grey) mounted on an Olympus IX-73 inverted microscope. Images were captured at 20x magnification using Metamorph software. Fluorescence intensity was quantified using the NIH Image J software.
RNA extraction and Q-PCR
Total RNA was isolated from cells using TRIzol (ThermoFisher Scientific, 191002), and cDNA was generated using the GoScript Reverse Transcription System (Promega, 0000316057) according to the manufacturer’s protocol. Q-PCR was performed using the SYBR Green Mix (TOYOBO, 563700) in ABI 7500 FAST (Applied Biosystems). The changes in the mRNA expression of target genes were normalized to that of the housekeeping gene GAPDH. Primer sequences used in this study are listed below:
GAPDH; For 5ʹ- GGAGTCAACGGATTTGGT −3ʹ, Rev 5ʹ- TGATGGGATTTCCATTG-3ʹ,
MCOLN1; For 5ʹ- GAGTGGGTGCGACAAGTTTC-3ʹ, Rev 5ʹ-TGTTCTCTTCCCGGAATGTC-3ʹ
ATP6V1 H; For 5ʹ- GGAAGTGTCAGATGATCCCCA-3ʹ, Rev 5ʹ- CCGTTTGCCTCGTGGATAAT-3ʹ
DPP7; For 5ʹ- GATTCGGAGGAACCTGAGTG-3ʹ, Rev 5ʹ-CGGAAGCAGGATCTTCTGG-3ʹ
CTSB; For 5ʹ- AGTGGAGAATGGCACACCCTA-3ʹ, Rev 5ʹ-AAGAGCCATTGTCACCCCA-3ʹ
TPP1; For 5ʹ- GATCCCAGCTCTCCTCAATAC-3ʹ, Rev 5ʹ-GCCATTTTTGCACCGTGTG-3ʹ
NFE2L2; For 5ʹ- AACCAGTGGATCTGCCAACTACTC-3ʹ, Rev 5ʹ-CTGCGCCAAAAGCTGCAT-3ʹ
SQSTM1; For 5ʹ- CTGGGACTGAGAAGGCTCAC-3ʹ, Rev 5ʹ- GCAGCTGATGGTTTGGAAAT-3ʹ
ULK1; For 5ʹ-TCATCTTCAGCCACGCTGT-3ʹ, Rev 5ʹ-CACGGTGCTGGAACATCTC-3ʹ
LC3; For 5ʹ- CAGCATGGTGAGTGTGTCCA-3ʹ, Rev 5ʹ-GCAGCTCAGTTCAGGAACCA-3ʹ
HMOX1; For 5ʹ-GCTGCTGACCCATGACACCAAGG-3ʹ, Rev 5ʹ-AAGGACCCATCGGAGAAGCGGAG-3ʹ
ATG7; For 5ʹ- AGGAGATTCAACCAGAGACC-3ʹ, Rev 5ʹ-GCACAAGCCCAAGAGAGG-3ʹ
RNA interference
The siRNA sequences targeting human TFEB (5ʹ-GAA AGG AGA CGA AGG UUC AAC AUC A-3ʹ) were purchased from Invitrogen. The siRNA sequences targeting human NFE2L2 (5ʹ-CAU UGA UGU UUC UGA UCU ATT-3ʹ) were chemically synthesized by GenePharma. HeLa, 1321N1, and HepG2 cells were seeded into 6-well plates and transfected with siRNA using Lipofectamine RNAi-Max reagent (Thermo Fisher Scientific, 13778150). The efficiency of the siRNA knockdown was assayed by western blotting or Q-PCR.
Reagents
Chemicals used in this study including CCCP (Sigma-Aldrich, C2759), NAC (Sigma-Aldrich, A7250), okadaic acid (Sigma-Aldrich, O7760), SFN (Sigma-Aldrich, S4441), torin1 (Cell signaling technology, 14379), FK506 (Sigma-Aldrich, F4679), Baf-A1 (ALADDIN, 88899-55-2), BAPTA-AM (Thermo Fisher Scientific, 1824047), BHA (MedChemExpress, HY-B1066), and CAT (MedChemExpress, HY-N0355). ML-SA1 was obtained from Princeton BioMolecular Research Inc. ML-SI3 was custom synthesized (available upon MTA request).
Statistical analysis
Data are presented as mean ± s.e.m. of at least 3 independent experiments. Statistical comparisons were performed with analyzes of variance (ANOVA) or two-tailed Student’s t-test with paired or unpaired wherever appropriate. A P value < 0.05 was considered statistically significant.
Supplemental Material
Download Zip (27.5 MB)Acknowledgments
We are grateful to Dr. Shawn M. Ferguson for the GFP-TFEB stable cells and to Dr. David Rubinsztein for the mRFP-GFP-LC3 cells.
Disclosure statement
No potential conflict of interest was reported by the authors.
Supplementary materials
Supplementary data for this article can be accessed here.
Correction Statement
This article has been republished with minor changes. These changes do not impact the academic content of the article.
Additional information
Funding
References
- Barnham KJ, Masters CL, Bush AI. Neurodegenerative diseases and oxidative stress. Nat Rev Drug Discov. 2004;3(3):205–214.
- Sies H, Berndt C, Jones DP. Oxidative stress. Annu Rev Biochem. 2017;86(1):715–748.
- Green DR, Galluzzi L, Kroemer G. Mitochondria and the autophagy-inflammation-cell death axis in organismal aging. Science. 2011;333(6046):1109–1112.
- Scherz-Shouval R, Elazar Z. Regulation of autophagy by ROS: physiology and pathology. Trends Biochem Sci. 2011;36(1):30–38.
- Sifuentes-Franco S, Pacheco-Moisés FP, Rodríguez-Carrizalez AD, et al. The role of oxidative stress, mitochondrial function, and autophagy in diabetic polyneuropathy. J Diabetes Res. 2017;2017:1673081.
- Liochev SI. Reactive oxygen species and the free radical theory of aging. Free Radic Biol Med. 2013;60:1–4.
- Underwood BR, Imarisio S, Fleming A, et al. Antioxidants can inhibit basal autophagy and enhance neurodegeneration in models of polyglutamine disease. Hum Mol Genet. 2010;19(17):3413–3429.
- Yamamoto M, Kensler TW, Motohashi H. The KEAP1-NRF2 system: a thiol-based sensor-effector apparatus for maintaining redox homeostasis. Physiol Rev. 2018;98(3):1169–1203.
- Dinkova-Kostova AT, Fahey JW, Kostov RV, et al. KEAP1 and Done? Targeting the NRF2 pathway with sulforaphane. Trends Food Sci Technol. 2017;69(Pt B):257–269.
- Fragoulisn A, Greiber A, Pufe T, et al. Pro-inflammatory stimuli induce Nrf2/ARE signalling in macrophages mediated by ROS. Free Radic Biol Med. 2013;65:S4–S5.
- Campanella M, Klionsky DJ. Keeping the engine clean: a mitophagy task for cellular physiology. Autophagy. 2013;9(11):1647.
- Shen HM, Mizushima N. At the end of the autophagic road: an emerging understanding of lysosomal functions in autophagy. Trends Biochem Sci. 2014;39(2):61–71.
- Klionsky DJ, Abdelmohsen K, Abe A, et al. Guidelines for the use and interpretation of assays for monitoring autophagy (3rd edition). Autophagy. 2016;12(1):1–222.
- Murrow L, Debnath J. Autophagy as a stress-response and quality-control mechanism: implications for cell injury and human disease. Annu Rev Pathol. 2013;8(1):105–137.
- Sardiello M, Palmieri M, Di Ronza A, et al. A gene network regulating lysosomal biogenesis and function. Science. 2009;325(5939):473–477.
- Settembre C, Di Malta C, Polito VA, et al. TFEB links autophagy to lysosomal biogenesis. Science. 2011;332(6036):1429–1433.
- Puertollano R, Ferguson SM, Brugarolas J, et al. The complex relationship between TFEB transcription factor phosphorylation and subcellular localization. Embo J. 2018;37(11):e98804 .
- Settembre C, Zoncu R, Medina DL, et al. A lysosome-to-nucleus signalling mechanism senses and regulates the lysosome via mTOR and TFEB. Embo J. 2012;31(5):1095–1108.
- Ferron M, Settembre C, Shimazu J, et al. A RANKL-PKCbeta-TFEB signaling cascade is necessary for lysosomal biogenesis in osteoclasts. Genes Dev. 2013;27(8):955–969.
- Martina JA, Puertollano R. RRAG GTPases link nutrient availability to gene expression, autophagy and lysosomal biogenesis. Autophagy. 2013;9(6):928–930.
- Medina DL, Di Paola S, Peluso I, et al. Lysosomal calcium signalling regulates autophagy through calcineurin and TFEB. Nat Cell Biol. 2015;17(3):288–299.
- Martina JA, Chen Y, Gucek M, et al. MTORC1 functions as a transcriptional regulator of autophagy by preventing nuclear transport of TFEB. Autophagy. 2012;8(6):903–914.
- Roczniak-Ferguson A, Petit CS, Froehlich F, et al. The transcription factor TFEB links mTORC1 signaling to transcriptional control of lysosome homeostasis. Sci Signal. 2012;5(228):p. ra42.
- Zhang X, Cheng X, Yu L, et al. MCOLN1 is a ROS sensor in lysosomes that regulates autophagy. Nat Commun. 2016;7(1):12109.
- Zhang X, Yu L, Xu H. Lysosome calcium in ROS regulation of autophagy. Autophagy. 2016;12(10):1954–1955.
- Martina JA, Puertollano R. Protein phosphatase 2A stimulates activation of TFEB and TFE3 transcription factors in response to oxidative stress. J Biol Chem. 2018;293(32):12525–12534.
- Dinkova-Kostova AT, Talalay P. Direct and indirect antioxidant properties of inducers of cytoprotective proteins. Mol Nutr Food Res. 2008;52(Suppl 1):S128–38.
- Kubo E, Chhunchha B, Singh P, et al. Sulforaphane reactivates cellular antioxidant defense by inducing Nrf2/ARE/Prdx6 activity during aging and oxidative stress. Sci Rep. 2017;7(1):14130.
- Hudecova S, Markova J, Simko V, et al. Sulforaphane-induced apoptosis involves the type 1 IP3 receptor. Oncotarget. 2016;7(38):61403–61418.
- Yoshimori T, Yamamoto A, Moriyama Y, et al. Bafilomycin A1, a specific inhibitor of vacuolar-type H(+)-ATPase, inhibits acidification and protein degradation in lysosomes of cultured cells. J Biol Chem. 1991;266(26):17707–17712.
- Lee JH, Jeong JK, Park SY. Sulforaphane-induced autophagy flux prevents prion protein-mediated neurotoxicity through AMPK pathway. Neuroscience. 2014;278:31–39.
- Li P, Gu M, Xu H. Lysosomal ion channels as decoders of cellular signals. Trends Biochem Sci. 2018;44(2):110–124.
- Miao Z, Yu F, Ren Y, et al. d,l-sulforaphane induces ROS-dependent apoptosis in human gliomablastoma cells by inactivating STAT3 signaling pathway. Int J Mol Sci. 2017;18(1):72.
- Amin PJ, Shankar BS. Sulforaphane induces ROS mediated induction of NKG2D ligands in human cancer cell lines and enhances susceptibility to NK cell mediated lysis. Life Sci. 2015;126:19–27.
- McFarland AJ, Anoopkumar-Dukie S, Perkins AV, et al. Inhibition of autophagy by 3-methyladenine protects 1321N1 astrocytoma cells against pyocyanin- and 1-hydroxyphenazine-induced toxicity. Arch Toxicol. 2012;86(2):275–284.
- Popa-Wagner A, Mitran S, Sivanesan S, et al. ROS and brain diseases: the good, the bad, and the ugly. Oxid Med Cell Longev. 2013;2013:963520.
- Nishikawa T, Edelstein D, Du XL, et al. Normalizing mitochondrial superoxide production blocks three pathways of hyperglycaemic damage. Nature. 2000;404(6779):787–790.
- Carocho M, Ferreira IC. A review on antioxidants, prooxidants and related controversy: natural and synthetic compounds, screening and analysis methodologies and future perspectives. Food Chem Toxicol. 2013;51:15–25.
- Xu H, Ren D. Lysosomal physiology. Annu Rev Physiol. 2015;77(1):57–80.
- Shen D, Wang X, Li X, et al. Lipid storage disorders block lysosomal trafficking by inhibiting a TRP channel and lysosomal calcium release. Nat Commun. 2012;3(1):731.
- Sanjana NE, Shalem O, Zhang F. Improved vectors and genome-wide libraries for CRISPR screening. Nat Methods. 2014;11(8):783–784.
- Wang W, Gao Q, Yang M, et al. Up-regulation of lysosomal TRPML1 channels is essential for lysosomal adaptation to nutrient starvation. Proc Natl Acad Sci U S A. 2015;112(11):E1373–81.
- Oh CJ, Kim J-Y, Min A-K, et al. Sulforaphane attenuates hepatic fibrosis via NF-E2-related factor 2-mediated inhibition of transforming growth factor-beta/Smad signaling. Free Radic Biol Med. 2012;52(3):671–682.
- Mansueto G, Armani A, Viscomi C, et al. Transcription Factor EB Controls Metabolic Flexibility during Exercise. Cell Metab. 2017;25(1):182–196.
- Pena KA, Kiselyov K. Transition metals activate TFEB in overexpressing cells. Biochem J. 2015;470(1):65–76.
- Cho RL, Yang CC, Tseng HC, et al. Haem oxygenase-1 up-regulation by rosiglitazone via ROS-dependent Nrf2-antioxidant response elements axis or PPAR gamma attenuates LPS-mediated lung inflammation. Br J Pharmacol. 2018;175(20):3928–3946.
- Pang C, Zheng Z, Shi L, et al. Caffeic acid prevents acetaminophen-induced liver injury by activating the Keap1-Nrf2 antioxidative defense system. Free Radic Biol Med. 2016;91:236–246.
- Zhang W, Chen L, Feng H, et al. Rifampicin-induced injury in HepG2 cells is alleviated by TUDCA via increasing bile acid transporters expression and enhancing the Nrf2-mediated adaptive response. Free Radic Biol Med. 2017;112:24–35.
- Gao X, Dinkova-Kostova AT, Talalay P. Powerful and prolonged protection of human retinal pigment epithelial cells, keratinocytes, and mouse leukemia cells against oxidative damage: the indirect antioxidant effects of sulforaphane. Proc Natl Acad Sci U S A. 2001;98(26):15221–15226.
- Wang Y, Nartiss Y, Steipe B, et al. ROS-induced mitochondrial depolarization initiates PARK2/PARKIN-dependent mitochondrial degradation by autophagy. Autophagy. 2012;8(10):1462–1476.
- Porter FD, Scherrer DE, Lanier MH, et al. Cholesterol oxidation products are sensitive and specific blood-based biomarkers for Niemann-Pick C1 disease. Sci Transl Med. 2010;2(56):p. 56ra81.
- DeNicola GM, Karreth FA, Humpton TJ, et al. Oncogene-induced Nrf2 transcription promotes ROS detoxification and tumorigenesis. Nature. 2011;475(7354):106–109.
- Scherz-Shouval R, Shvets E, Fass E, et al. Reactive oxygen species are essential for autophagy and specifically regulate the activity of Atg4. Embo J. 2007;26(7):1749–1760.
- Zhou Q, Chen B, Wang X, et al. Sulforaphane protects against rotenone-induced neurotoxicity in vivo: involvement of the mTOR, Nrf2, and autophagy pathways. Sci Rep. 2016;6(1):32206.
- Yu T, Chung C, Shen D, et al. Ryanodine receptor antagonists adapt NPC1 proteostasis to ameliorate lipid storage in Niemann-Pick type C disease fibroblasts. Hum Mol Genet. 2012;21(14):3205–3214.