
ABSTRACT
Macroautophagy/autophagy plays an essential role in cellular responses to pathogens. However, the precise mechanisms and signaling pathways that modulate cellular autophagy in classical swine fever virus (CSFV)-infected host cells have not been confirmed. In this study, we showed that CSFV infection inhibits the phosphorylation of MTOR (mechanistic target of rapamycin kinase), subsequently leading to autophagy initiation. We also show that MAPK/ERK (mitogen-activated protein kinase) signaling is involved in CSFV-induced autophagy. The CSFV-induced inhibition of AKT/PKB (AKT serine/threonine kinase)-MTOR was observed to be partially responsible for the MTOR inactivation and subsequent autophagy initiation. Moreover, the CAMKK2/CaMKKβ (calcium/calmodulin dependent protein kinase kinase 2)-PRKAA/AMPK (protein kinase AMP-activated catalytic subunit alpha) axis was found to be involved in CSFV-induced autophagy. Meanwhile, CSFV non-structural protein NS5A induced autophagy via the CAMKK2-PRKAA-MTOR signaling pathway but not the AKT-MTOR or MAPK1/ERK2-MAPK3/ERK1-MTOR pathway. Although the AKT-MTOR pathway also plays an important role in the induction of autophagy by CSFV. We also found the interaction between HSP90AB1/HSPCB and NS5A by tandem affinity purification/liquid chromatography-mass spectrometry (LC-MS) and immunoprecipitation. Furthermore, the CSFV-induced [Ca2+]cyto increase potently induced autophagy through CAMKK2 and PRKAA. Moreover, we isolated and identified the BECN1/Beclin 1 protein complexes by tandem affinity purification/LC-MS and immunoprecipitation, the interaction between BECN1 and MAVS was confirmed by immunoprecipitation, laser scanning confocal microscope technology, and GST affinity-isolation experiments. Furthermore, CSFV-mediated autophagy suppressing type I IFN production is related to the interaction between MAVS and BECN1. Finally, the modulation of autophagy induction pathways by different autophagy regulatory factors significantly affected the replication of CSFV.
Abbreviations: AKT: AKT serine/threonine kinase; AMPK: Adenosine monophosphate-activated protein kinase; CAMKK2: Calcium/calmodulin dependent protein kinase kinase 2; CSFV: Classical swine fever virus; HRP: Horseradish peroxidase; HSP90AB1: Heat shock protein 90 alpha family class B member 1; IFN: Interferon; ISGs: IFN-stimulated genes; LC-MS: Liquid chromatography-mass spectrometry; MAP1LC3/LC3: Microtubule associated protein 1 light chain 3; MAPK: Mitogen-activated protein kinase; MAVS: Mitochondrial antiviral signaling protein; MOI: Multiplicity of infection; MTOR: Mechanistic target of rapamycin kinase; PBS: Phosphate-buffered saline; PRKAA: Protein kinase AMP-activated catalytic subunit alpha; shRNA: short hairpin RNA.
Introduction
Classical swine fever (CSF) is an acute infectious viral disease, which must be reported to the World Organization for Animal Health (OIE) once an outbreak [Citation1]. Classical swine fever virus (CSFV) is an enveloped, positive-sense genomic RNA virus that is a member of the Pestivirus genus within the Flaviviridae family [Citation2]. CSFV is the pathogenic agent of CSF, an extremely infectious disease of swine [Citation3,Citation4]. The open reading frame (ORF) of CSFV is split into four constitutive proteins and eight non-structural proteins [Citation5]. CSF causes serious financial ruin in the global pig industry. Due to its tremendous socioeconomic importance, primary researches of CSFV-host reciprocal action have been broadly studied [Citation5]. However, the precise signaling pathways that modulate autophagy in CSFV-infected host cells largely remain to be elucidated.
Autophagy has both positive and negative effects on the pathogenesis of viral diseases [Citation6]. However, large numbers of viruses escape or overturn autophagy for their proliferation [Citation7–9]. The presence of numerous membrane-enclosed structures is the most remarkable morphological feature of eukaryotic cells [Citation10]. Autophagy aids cell survival in response to multiple stress situations, such as nutrient or growth factor deprivation, reactive oxygen species (ROS), hypoxia, and the presence of intracellular pathogens [Citation11]. In our previous study, we provided strong evidence that CSFV infection requires the autophagy pathway to enhance viral replication and maturity in host cells [Citation12,Citation13]. Thus, understanding the details of the subsequent mechanisms underlying these observations is critical to control disease transmission.
Multiple extracellular and intracellular molecular signals, as well as a variety of stressors, are merged into the MTOR (mechanistic target of rapamycin kinase) pathway [Citation14]. Among the various factors involved in the adjustment of autophagy and growth, TOR (target of rapamycin) is a vital component that symmetrically regulates the counterbalance between growth and autophagy [Citation15]. MTOR can be divided into two complexes MTOR complex 1 (MTORC1) and MTORC2. MTORC1 is the pivotal regulator of autophagy and regulates various aspects of the autophagy progress [Citation16].
AKT modulates a large number of cellular progress [Citation17]. Activation of the PI3 K-AKT-MTOR pathway suppresses autophagy by MTOR phosphorylation [Citation18]. PRKAA (protein kinase AMP-activated catalytic subunit alpha) is an essential enzyme involved in metabolic homeostasis through its control of several homeostatic mechanisms, such as stimulation of the catabolic pathway and inhibition of energy-consuming functions [Citation19]. PRKAA senses when the AMP:ATP ratio increases, which leads to PRKAA phosphorylation at Thr172. PRKAA phosphorylation affects autophagy by inhibiting the MTORC1 complex [Citation20]. The RAS-ZHX2/RAF-MAPK signaling pathway serves a vital function for major cell metabolism [Citation21]. Different stimulus induces autophagy may be involved in MAPK14/MAPK p38 [Citation22]. Prior studies demonstrate that PCV2-mediated autophagy is relevant to the PRKAA-MAPK-TSC2-MTOR pathway [Citation23]. While previous studies also indicate that Ca2+ and calcium-sensitive proteins may play dual roles in the regulation of autophagy [Citation24,Citation25]. Interestingly, various Ca2+-mobilizing agents inhibit the activity of MTOR and induce the accumulation of autophagosomes in a BECN1- and ATG7-dependent manner [Citation26].
In our previous study, we provided evidence that CSFV infection triggers a complete autophagic response, most likely via the NS5A protein [Citation13]. Recent studies show that cocaine-mediated autophagy involves upstream stimulation of ER stress proteins, including EIF2AK3, ERN1, and ATF6 [Citation27].
MAVS (mitochondrial antiviral signaling protein) mediates the induction of interferons. Once DDX58/RIG-I and IFIH1/MDA5 recognize viral RNAs, they expose their CARD domains and activate MAVS by the homotypic interaction of their CARD domains [Citation28]. Previous studies of our research group showed that CSFV-infected host cells present a low level of IFN [Citation29]. At the same time, we also showed that CSFV-mediated autophagy might restrain type I IFN secretion by suppressing RLR signaling [Citation30].
Autophagy is relevant to the host cells’ defense mechanism and cell survival, playing a critical part in viral infection [Citation31,Citation32]. However, some viruses evolve sophisticated mechanisms for autophagy regulation to promote their proliferation [Citation33,Citation34]. Thus, understanding the precise mechanisms and signaling pathways that modulate autophagy is critical for the control of disease transmission. Therefore, we conducted a comprehensive study of the critical and authoritative signaling network of CSFV infection-induced autophagy in 3D4/2 and PK-15 cells. This study revealed that 3D4/2 and PK-15 cells infected with CSFV inhibited MTOR by initiating AKT, PRKAA, and MAPK1/3 cascades, MTOR inhibition further induced autophagy in 3D4/2 and PK-15 cells. Then CSFV-mediated autophagy suppressing IFN production was related to the interaction between MAVS and BECN1.
Results
The inhibition of MTOR phosphorylation is connected with CSFV-mediated autophagy
To determine the mechanism by which CSFV induces autophagy, we analyzed the MTOR pathway in 3D4/2 and PK-15 cells, because MTOR is the primary hub of the autophagy regulatory network [Citation35]. We used rapamycin (Rapa) as a positive control and 3-methyladenine (3-MA) as a negative control for autophagy. As illustrated in , both CSFV infection and Rapa treatment significantly decreased the level of MTOR phosphorylation compared with those of mock- or 3-MA-treated cells (P < 0.001). Although CSFV infection or rapamycin treatment both caused significant decreases in the level of p-MTOR, the decline in p-MTOR level was more evident after CSFV than after Rapa treatment (P < 0.001). To further analyze whether the inhibition of MTOR activity after CSFV infection is related to induce autophagy by CSFV, we collected samples at different time points after CSFV infection for immunoblotting analysis. As revealed in , CSFV-infected PK-15 cells (A), and 3D4/2 cells (B) had a decreased level of p-MTOR as well as a significantly increased LC3-II level from 6 to 24 h post-infection (hpi) (, lanes 1, 3, and 5). We also found that the virus copy number of CSFV-infected host cells was significantly reduced after activation of MTOR phosphorylation, but Rapa treatment significantly increased the virus copy number of CSFV-infected host cells (P < 0.05, ). Our previous studies demonstrated that CSFV infection activates autophagy in the spleen in vivo [Citation36]. To clarify the mechanism by which CSFV induces autophagy in vivo, we analyzed the MTOR pathway using immunoblotting, including AKT-MTOR, MAPK1/3-MTOR, and CAMKK2-PRKAA-MTOR pathway. Our results showed that p-PRKAA, CAMKK2, and p-MAPK1/3 expression was upregulated in CSFV-infected spleen cells, with a decrease in AKT and MTOR activity relative to mock-infected spleen cells (). These results suggested that CSFV induced autophagy by inhibiting MTOR signaling.
Figure 1. The suppression of MTOR activity is associated with CSFV-mediated autophagy. (A and B) PK-15 (A) and 3D4/2 (B) cells were infected with CSFV at an MOI of 1 or mock-infected. At 6, 12 and 24 hpi, cell samples were analyzed by immunoblotting with antibodies against p-MTOR, LC3B, CSFV-E2, and ACTB (loading control). The level of protein was quantified using Image-Pro Plus. Error bars indicate the mean (± SD) of 3 independent experiments. *, P < 0.05; **, P < 0.01; and ***, P < 0.001 (one-way ANOVA). (C) PK-15 and 3D4/2 cells were mock-infected or infected with CSFV (MOI = 1) or treated with 3-MA (5 mM) or rapamycin (Rapa, 100 nM) for 48 h. The level of protein was quantified using Image-Pro Plus. Error bars: mean (± SD) of 3 independent experiments. *, P < 0.05; **, P < 0.01; and ***, P < 0.001 (one-way ANOVA). (D) PK-15 and 3D4/2 cells were pretreated with rapamycin (100 nM) or DMSO (control) for 1.5 h, followed by CSFV adsorption for 1.5 h at an MOI of 1. The host cells were further cultured in fresh medium in the presence of rapamycin (100 nM). At 24 and 48 hpi, the mRNA level of Npro(CSFV) were detected by qRT-PCR as described in Materials and Methods. (E) PK-15 and 3D4/2 cells were pretreated with 3-MA (5 mM) or DMSO (control) for 1.5 h, followed by CSFV adsorption for 1.5 h at an MOI of 1. The host cells were further cultured in fresh medium in the presence of 3-MA (5 mM). At 24 and 48 hpi, the mRNA level of Npro(CSFV) were detected by qRT-PCR as described in Materials and Methods. (F) Analysis of autophagy-related proteins by western blotting in infected CSFV splenic cells. splenic lysates were prepared as described in Materials and Methods, splenic samples were analyzed by immunoblotting with antibodies against p-MTOR, p-PRKAA, CAMKK2, MAPK1/3, p-MAPK1/3, p-AKT, AKT, and ACTB (loading control). The level of protein was quantified using Image-Pro Plus. Error bars indicate the mean (± SD) of 3 independent experiments. *, P < 0.05; **, P < 0.01; and ***, P < 0.001 (one-way ANOVA)
CSFV dysregulates the AKT-MTOR pathway in host cells to induce autophagy
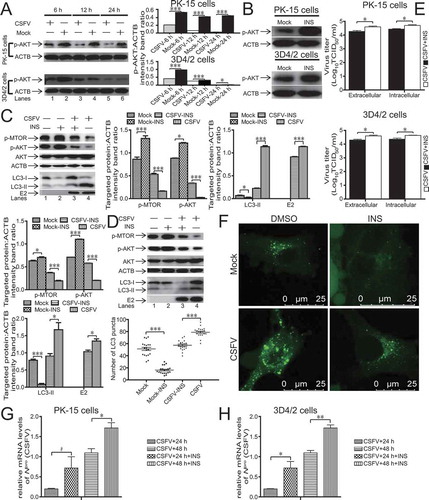
Several studies demonstrate that the AKT-MTOR pathway plays an important role in autophagy adjustment [Citation37–39]. Indeed, the inhibition of the AKT-MTOR pathway leads to the activation of autophagy [Citation38–41]. Therefore, we first measured AKT phosphorylation to determine further whether the activation of autophagy by CSFV infection is relevant to the AKT-MTOR pathway. As presented in , CSFV-infected host cells had a decreased level of AKT phosphorylation from 6 to 24 hpi (P < 0.05, , lanes 1, 3, and 5). Next, we further confirmed the connection between AKT signaling and autophagy. We observed the level of AKT phosphorylation following therapy with or without INS in host cells to confirm the effects of INS (insulin) on host cells. As displayed in , INS treatment increased the level of AKT phosphorylation in both 3D4/2 and PK-15 cells. We then exposed 3D4/2 and PK-15 cells to INS, an activator of AKT, with or without CSFV infection. As represented in , the reduction in MTOR and AKT activity after INS treatment were restored in CSFV-infected host cells. The restoration in MTOR and AKT phosphorylation further reduced autophagy level (P < 0.05, , lanes 3 and 4). As depicted in , accumulated LC3 fluorescence puncta were detected in CSFV-infected PK-15. In contrast, fewer accumulated LC3 fluorescence puncta were detected in INS-treated cells or mock (P < 0.001). Furthermore, the inhibition of autophagy during CSFV infection reduced virus copy number and titer after INS treatment (P < 0.05, ). These findings indicated that the AKT-MTOR pathway was relevant to the activation of autophagy and significantly affected CSFV replication.
Figure 2. CSFV dysregulates AKT-MTOR signaling in 3D4/2 and PK-15 cells to induce autophagy. (A) 3D4/2 and PK-15 cells were infected with CSFV at an MOI of 1 or mock-infected. At 6, 12 and 24 hpi, cell samples were analyzed by immunoblotting with antibodies against p-AKT and ACTB (loading control). The level of protein was quantified using Image-Pro Plus. Error bars indicate the mean (± SD) of 3 independent experiments. *, P < 0.05; **, P < 0.01; and ***, P < 0.001 (one-way ANOVA). (B) 3D4/2 and PK-15 cells were pretreated with INS (100 ng/ml) or DMSO (control) for 24 h, and cell samples were analyzed by immunoblotting with antibodies against p-AKT and ACTB (loading control). (C and D) PK-15 (C) and 3D4/2 (D) cells were pretreated with INS (100 ng/ml) or DMSO (control) for 1.5 h, followed by mock infection and CSFV infection for 1.5 h at an MOI of 1. The host cells were cultured in fresh medium in the presence or absence of INS (100 ng/ml). At 36 hpi, cell samples were analyzed by immunoblotting with antibodies against p-MTOR, LC3B, AKT, p-AKT, CSFV-E2, and ACTB (loading control). The level of protein was quantified using Image-Pro Plus. Error bars indicate the mean (± SD) of 3 independent experiments. *, P < 0.05; **, P < 0.01; and ***, P < 0.001 (one-way ANOVA). (E) 3D4/2 and PK-15 cells were pretreated and infected as described in (C and D). At 48 hpi, both the intracellular and extracellular viral titers were measured by TCID50. Error bars indicate the mean (± SD) of 3 independent experiments. *, P < 0.05; **, P < 0.01; and ***, P < 0.001 (one-way ANOVA). (F) PK-15 cells were pretreated and infected as described in (C). At 48 hpi, the cells were fixed and processed for indirect immunofluorescence using antibodies against LC3B, followed by the corresponding secondary antibodies conjugated to Alexa Fluor 488 as described in the Materials and Methods. The LC3 fluorescence signals were analyzed by confocal immunofluorescence microscopy. In the images, LC3 staining is shown in green. Scale bar: 25 µm. The average number of LC3 puncta per cell from at least 20 cells in each group. Error bars indicate the mean (± SD) of 3 independent experiments. *, P < 0.05; **, P < 0.01; and ***, P < 0.001 (one-way ANOVA). (G and H) PK-15 (G) and 3D4/2 (H) cells were pretreated with INS (100 ng/ml) or DMSO (control) for 1.5 h, followed by CSFV adsorption for 1.5 h at an MOI of 1. The host cells were further cultured in fresh medium in the presence of INS (100 ng/ml) or DMSO (control). At 24 and 48 hpi, the mRNA level of Npro (CSFV) were detected by qRT-PCR as described in Materials and Methods
CSFV activates autophagy is associated with the MAPK1/3-MTOR pathway
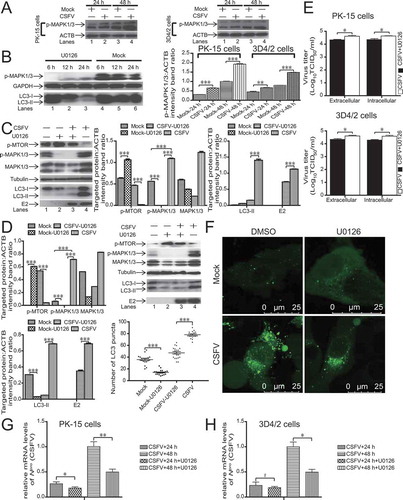
Prior reports demonstrate that the RAS-RAF-MAPK pathway is essential to autophagy [Citation21]. In the present study, we examined if MAPK1/3 is relevant to autophagy induction in CSFV-infected host cells. As revealed in , the densitometric ratios of p-MAPK1/3, relative to ACTB, not only increased in CSFV-infected host cells compared with mock but also increased progressively with increasing infection time (P < 0.01, ). U0126 is a selective inhibitor of MAP2 K/MEK (mitogen-activated protein kinase kinase), the kinase upstream of MAPK/ERK [Citation42]. To confirm whether U0126 treatment can inhibit autophagy, we determined the levels of LC3-II and p-MAPK1/3 following therapy with or without U0126 in host cells. As illustrated in , U0126 treatment reduced the levels of LC3-II and p-MAPK1/3 in host cells at 12 and 24 hpi compared with the controls. These findings suggested that U0126 treatment could inhibit autophagy in host cells. showed that U0126 treatment significantly decreased the level of p-MAPK1/3 (, lanes 2 and 3), indicating that the inhibitory effect of U0126 was apparent (P < 0.001). Concurrently, the CSFV-infected host cells had an increased level of p-MAPK1/3 relative to that of mock (P < 0.001, , lanes 1, 4), which implied that CSFV-mediated autophagy was relevant to p-MAPK1/3. The suppression of p-MAPK1/3 significantly altered the tendency of MTOR activity and LC3 conversion (P < 0.001, , lanes 3 and 4), which indicated that MAPK1/3 was the upstream switch of the MTOR-LC3 pathway in CSFV-infected host cells. Furthermore, LC3 puncta were observed by laser confocal microscopy to analyze the level of autophagy. The addition of U0126 altered the number of LC3 puncta relative to the addition of DMSO with CSFV infection in PK-15 cells (, P < 0.001). Moreover, the determination of the virus copy number and viral titer were in accordance with the results of E2 by immunoblotting, which indicated that inhibition of autophagy with U0126 during CSFV infection reduced viral replication (P < 0.05, ). These findings indicated that CSFV-mediated autophagy was associated with the MAPK1/3-MTOR pathway.
Figure 3. CSFV induces autophagy by activating the MAPK1/3-MTOR pathway. (A) 3D4/2 and PK-15 cells were infected with CSFV at an MOI of 1 or mock-infected. At 24 and 48 hpi, cell samples were analyzed by immunoblotting with antibodies against p-MAPK1/3 and ACTB (loading control). The level of protein was quantified using Image-Pro Plus. Error bars indicate the mean (± SD) of 3 independent experiments. *, P < 0.05; **, P < 0.01; and ***, P < 0.001 (one-way ANOVA). (B) PK-15 cells were pretreated with U0126 (7.5 µM) or DMSO (control). At 6, 12 and 24 hpi, cell samples were analyzed by immunoblotting with antibodies against LC3B, p-MAPK1/3, and ACTB (loading control). (C and D) PK-15 (C) and 3D4/2 (D) cells were pretreated with U0126 (7.5 µM) or DMSO (control) for 1.5 h, followed by mock infection and CSFV infection for 1.5 h at an MOI of 1. The host cells were further cultured in fresh medium in the presence or absence of U0126 (7.5 µM). At 36 hpi, the expression of p-MTOR, LC3B, MAPK1/3, p-MAPK1/3, CSFV-E2, and ACTB (loading control) were analyzed by immunoblotting. The level of protein was quantified using Image-Pro Plus. Error bars indicate the mean (± SD) of 3 independent experiments. *, P < 0.05; **, P < 0.01; and ***, P < 0.001 (one-way ANOVA). (E) 3D4/2 and PK-15 cells were pretreated and infected as described in (C and D). At 48 hpi, both the intracellular and extracellular viral titers were measured by TCID50. Error bars indicate the mean (± SD) of 3 independent experiments. *, P < 0.05; **, P < 0.01; and ***, P < 0.001 (one-way ANOVA). (F) PK-15 cells were pretreated and infected as described in (C). At 48 hpi, cells were analyzed as described in the legend to . (G and H) PK-15(G) and 3D4/2(H) cells were pretreated with U0126 (7.5 µM) or DMSO (control) for 1.5 h, followed by CSFV adsorption for 1.5 h at an MOI of 1. The host cells were further cultured in fresh medium in the presence of U0126 (7.5 µM). At 24 and 48 hpi, the mRNA level of Npro(CSFV) were detected by qRT-PCR as described in Materials and Methods
PRKAA is an upstream switch of MTOR in CSFV-mediated autophagy
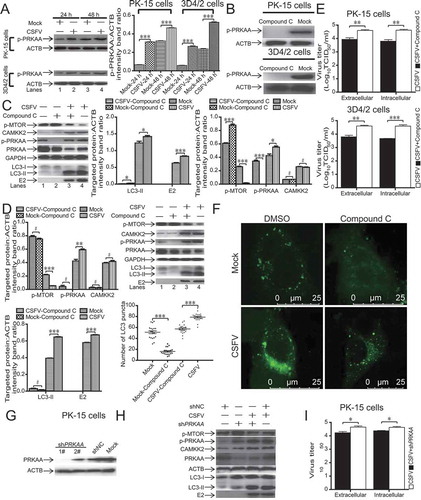
Researchers report that autophagy can be stimulated by the PRKAA signaling pathway, which is closely associated with energy metabolism [Citation43]. As displayed in , CSFV-infected host cells had an increased level of p-PRKAA from 24 to 48 hpi (P < 0.001, , lanes 2 and 4). These findings indicated that PRKAA induced autophagy by negatively regulating MTOR. To confirm the effects of compound C on host cells, we observed the level of PRKAA phosphorylation following therapy with or without compound C in both 3D4/2 and PK-15 cells. As revealed in , compound C treatment decreased the level of p-PRKAA in both 3D4/2 and PK-15 cells. Then, to further explore the relationship of PRKAA activation and MTOR phosphorylation suppression by CSFV infection, the levels of related proteins were detected following therapy with or without the compound C in CSFV-infected host cells and mock by using western blotting of proteins including LC3B, p-PRKAA, PRKAA, p-MTOR, and CAMKK2. (lanes 3 and 4) showed that compound C treatment significantly inhibited PRKAA phosphorylation in CSFV-infected host cells (P < 0.05), indicating a clear inhibitory effect of compound C. As revealed in (lanes 3 and 4), phosphorylation of MTOR was partially restored by PRKAA inhibition in CSFV-infected host cells (P < 0.001). Moreover, the restored MTOR activity further inhibited CSFV-mediated autophagy (P < 0.05), but compound C treatment did not alter CAMKK2 expression in CSFV-infected host cells (P > 0.05). This finding suggested that PRKAA phosphorylation inhibited MTOR signaling and thus activated autophagy, but the regulation of autophagy by PRKAA should occur downstream of CAMKK2 regulation. We further detected LC3 puncta by confocal laser microscopy. The pre-treatment of PK-15 cells with compound C altered the number of LC3-positive puncta relative to that of PK-15 cells pretreated with DMSO and infected with CSFV (P < 0.001, ). We performed the shRNA knockdown experiments to deplete endogenous PRKAA protein specifically. We designed two pairs of shRNAs targeting PRKAA and tested the silencing effect (). We used the most effective shRNA (1#) targeting PRKAA. As illustrated in (lanes 2 and 3), PK-15 cells transfected with shPRKAA presented significantly decreased level of endogenous PRKAA proteins than cells transfected with non-targeting (scrambled) shRNAs comprising the control group (, lanes 1 and 4). The suppression of PRKAA expression also reduced LC3-II formation in CSFV-infected PK-15 cells (, lanes 3 and 4), whereas the inhibition of PRKAA by shPRKAA did not inhibit CAMKK2 expression in response to CSFV infection, suggesting that PRKAA was downstream of CAMKK2. We also found that the intracellular and extracellular viral titers of CSFV-infected host cells were significantly reduced after inhibition of PRKAA (P < 0.05, ), which was similar to the western blot result for the viral envelope protein E2 (, lanes 3, 4). These findings indicated that CSFV-mediated autophagy might be associated with PRKAA activation, and PRKAA phosphorylation promotes MTOR dephosphorylation.
Figure 4. PRKAA is an upstream switch of MTOR in CSFV-mediated autophagy. (A) 3D4/2 and PK-15 cells were infected with CSFV at an MOI of 1 or mock-infected. At 24 and 48 hpi, cell samples were analyzed by immunoblotting with antibodies against p-PRKAA and ACTB (loading control). The level of protein was quantified using Image-Pro Plus. Error bars indicate the mean (± SD) of 3 independent experiments. *, P < 0.05; **, P < 0.01; and ***, P < 0.001 (one-way ANOVA). (B) 3D4/2 and PK-15 cells were pretreated with compound C (50 µM) or DMSO (control) for 24 h, and cell samples were analyzed by immunoblotting with antibodies against p-PRKAA and ACTB (loading control). (C and D) PK-15(C) and 3D4/2(D) cells were pretreated with compound C (50 µM) or DMSO (control) for 1.5 h after 1.5 h of virus absorption at an MOI of 1 and mock infection. The host cells were further cultured in fresh medium in the presence or absence of compound C (50 µM). At 36 hpi, cell samples were analyzed by immunoblotting with antibodies against p-MTOR, LC3B, PRKAA, p-PRKAA, CAMKK2, CSFV-E2, and ACTB (loading control). The level of protein was quantified using Image-Pro Plus. Error bars indicate the mean (± SD) of 3 independent experiments. *, P < 0.05; **, P < 0.01; and ***, P < 0.001 (one-way ANOVA). (E and I) 3D4/2 and PK-15 cells were pretreated and infected as described in (C, D, and H). At 48 hpi, both the intracellular and extracellular viral titers were measured by TCID50. Error bars indicate the mean (± SD) of 3 independent experiments. *, P < 0.05; **, P < 0.01; and ***, P < 0.001 (one-way ANOVA). (F) PK-15 cells were pretreated and infected as described in (C). At 48 hpi, cells were analyzed as described in the legend to . (G) PK-15 cells were transfected with negative control shRNA or specific shRNA against PRKAA for 48 h and then analyzed by western blotting. (H) PK-15 cells were transfected with either shNC or PRKAA-specific shRNA for 6 h and then infected with CSFV or mock-infected for an additional 48 h, after which cells were harvested for western blotting assay
CSFV-mediated autophagy is involved in CAMKK2-PRKAA-MTOR pathway activation
Several studies demonstrate that [Ca2+]cyto and CAMKK2 are relevant to PRKAA phosphorylation [Citation26]. Therefore, we further detected and analyzed the level of CAMKK2 after CSFV infection. As revealed in , CSFV-infected host cells had increased expression level of CAMKK2 from 6 to 24 hpi (P < 0.05, , lanes 1, 3, and 5). Therefore, these data suggested that the CAMKK2-PRKAA-MTOR signaling pathway might be relevant to CSFV-mediated autophagy. We determined the level of CAMKK2 following therapy with or without STO-609 in both 3D4/2 and PK-15 cells to confirm the effects of STO-609 on host cells. As revealed in , STO-609 treatment decreased the level of CAMKK2 expression in both 3D4/2 and PK-15 cells. Based on the speculation mentioned earlier, we detected the levels of related proteins following therapy with or without the CAMKK2-specific inhibitor STO-609 in CSFV-infected host cells and mock by western blotting for LC3 conversion, PRKAA and MTOR activity, and CAMKK2 expression to further confirm that the CAMKK2-PRKAA-MTOR signaling pathway is relevant to CSFV-mediated autophagy. (lanes 3 and 4) showed that STO-609 treatment inhibited the expression of CAMKK2 (P < 0.05) in CSFV-infected host cells, indicating that an inhibitory effect of STO-609. STO-609 treatment inhibited the increase of PRKAA phosphorylation in CSFV-infected host cells (P < 0.05) and restored the decrease of MTOR phosphorylation in CSFV-infected host cells (P < 0.01), indicating that CAMKK2 was an upstream switch of the PRKAA-MTOR axis (, lanes 3 and 4). As represented in , accumulated LC3 fluorescence puncta were detected in CSFV-infected PK-15 (P < 0.001). In contrast, we detected fewer accumulated LC3 fluorescence puncta in STO-609-treated cells, suggesting that autophagy was inhibited. These results indicated that CAMKK2 positively regulated autophagy. We also found that the virus copy number and viral titer of CSFV-infected host cells were significantly reduced after inhibition of CAMKK2 (P < 0.05, ). These results indicated that CAMKK2 regulated the PRKAA-MTOR axis in CSFV-infected host cells.
Figure 5. CSFV induces autophagy through the CAMKK2-PRKAA-MTOR signaling pathway. (A) 3D4/2 and PK-15 cells were infected with CSFV at an MOI of 1 or mock-infected. At 6, 12 and 24 hpi, cell samples were analyzed by immunoblotting with antibodies against CAMKK2 and ACTB (loading control). The level of protein was quantified using Image-Pro Plus. Error bars indicate the mean (± SD) of 3 independent experiments. *, P < 0.05; **, P < 0.01; and ***, P < 0.001 (one-way ANOVA). (B) 3D4/2 and PK-15 cells were pretreated with STO-609 (50 µM) or DMSO (control) for 24 h, and cell samples were prepared and analyzed by immunoblotting with antibodies against CAMKK2 and ACTB (loading control). (C and D) PK-15 (C) and 3D4/2 (D) cells were pretreated with STO-609 (50 µM) or DMSO (control) for 1.5 h, followed by mock infection and CSFV infection for 1.5 h at an MOI of 1. The host cells were further cultured in fresh medium in the presence or absence of STO-609 (50 µM). At 36 hpi, cell lysates were prepared and analyzed by immunoblotting using anti-p-MTOR, anti-LC3B, anti-PRKAA, anti-p-PRKAA, anti-CAMKK2, anti-E2, and anti-ACTB antibodies. The level of protein was quantified using Image-Pro Plus. Error bars indicate the mean (± SD) of 3 independent experiments. *, P < 0.05; **, P < 0.01; and ***, P < 0.001 (one-way ANOVA). (E) 3D4/2 and PK-15 cells were pretreated and infected as described in (C and D). At 48 hpi, both the intracellular and extracellular viral titers were measured by TCID50. Error bars indicate the mean (± SD) of 3 independent experiments. *, P < 0.05; **, P < 0.01; and ***, P < 0.001 (one-way ANOVA). (F) PK-15 cells were pretreated and infected as described in (C). At 48 hpi, cells were analyzed as described in the legend to . (G and H) PK-15(G) and 3D4/2(H) cells were pretreated with STO-609 (50 µM) or DMSO (control) for 1.5 h, followed by CSFV adsorption for 1.5 h at an MOI of 1. The host cells were further cultured in fresh medium in the presence of STO-609 (50 µM). At 24 and 48 hpi, the mRNA level of Npro(CSFV) were detected by qRT-PCR as described in Materials and Methods
CSFV-mediated [Ca2+]cyto increase induces autophagy potently via the CAMKK2-PRKAA-MTOR pathway
To analyze the autophagy induction mechanism by the CAMKK2-PRKAA-MTOR pathway, we explored possible upstream induction factors. Researchers discover that intracellular Ca2+ plays a vital role in the upregulation of autophagy [Citation24]. 1,2-Bis (2-aminophenoxy)-ethane-N, N, N’, N’-tetraacetic acid tetrakis (acetoxymethyl ester) BAPTA-AM is a potent cell-permeant Ca2+ chelator [Citation25]. Ionomycin (Iono) is a Ca2+ ionophore that releases Ca2+ from intracellular stores, which increases the intracytosolic level of Ca2+ [Citation44]. We determined the level of CAMKK2 in both 3D4/2 and PK-15 cells following therapy with or without BAPTA-AM to confirm the effects of BAPTA-AM on host cells. As shown in , BAPTA-AM treatment decreased the level of CAMKK2 expression in both 3D4/2 and PK-15 cells. To further analyze whether the CSFV-induced increase in [Ca2+]cyto signals through CAMKK2 and PRKAA to induce autophagy, we determined the levels of related proteins following therapy with or without BAPTA-AM in CSFV-infected host cells and mock by using immunoblotting for LC3B, p-PRKAA, PRKAA, p-MTOR, and CAMKK2. We applied ionomycin as a positive control. We measured the level of intracellular Ca2+ with the BBcellProbeTM F04 dye solution. We then visualized the fluorescence signals with a fluorescence microscope. As expected, CSFV infection in PK-15 cells significantly improved the fluorescence intensity of the BBcellProbeTM F04 Ca2+ dye (P < 0.001, ). These results suggested that [Ca2+]cyto level surged in responding to CSFV infection. However, the level of [Ca2+]cyto declined after therapy with BAPTA-AM in CSFV-infected PK-15 cells and mock (P < 0.001, ), suggesting that BAPTA-AM therapy declined [Ca2+]cyto level. Then, to further analyze the links of intracellular Ca2+ release and the CAMKK2-PRKAA-MTOR signaling pathway in CSFV-mediated autophagy, we determined the levels of related proteins following therapy with or without BAPTA-AM in CSFV-infected host cells and mock by using immunoblotting for LC3B, p-PRKAA, PRKAA, p-MTOR, and CAMKK2. We applied ionomycin as a positive control. Our results suggested that CSFV-induced PRKAA phosphorylation declined in the presence of BAPTA-AM (, lanes 3 and 4), which indicates that [Ca2+]cyto regulates PRKAA phosphorylation. As [Ca2+]cyto accumulation induces the activation of PRKAA via CAMKK2 [Citation45], these results suggest that CSFV infection-induced [Ca2+]cyto release promotes autophagy via the CAMKK2-PRKAA-MTOR pathway. As represented in , C, 3D4/2 and PK-15 cell treated with CSFV or ionomycin exhibited analogous tendencies in relevant molecules (, C, lanes 4 and 5) compared with mock, indicating that CSFV-mediated Ca2+ signaling might activate autophagy by the same way. Adding BAPTA-AM to CSFV-infected host cells significantly inhibited the levels of CAMKK2 and p-PRKAA (P < 0.001, , C, lanes 3, 4). The BAPTA-AM-mediated inhibition of the [Ca2+]cyto increase significantly affected the CAMKK2 and LC3 conversion trends caused by CSFV infection (P < 0.05, , C, lanes 3 and 4), which suggested that [Ca2+]cyto is the upstream switch of the MTOR-LC3 pathway. Furthermore, we detected accumulated LC3 fluorescence puncta by laser confocal microscopy. The BAPTA-AM-treated group of PK-15 cells had an altered number of LC3 puncta relative to the DMSO group of PK-15 cells (, P < 0.001). Also, the inhibition of autophagy during CSFV infection reduced virus copy number and titer after BAPTA-AM treatment (P < 0.05, , G). These results clearly demonstrated that the [Ca2+]cyto increase was vital for autophagy induction via the CAMKK2-PRKAA-MTOR pathway during CSFV infection.
Figure 6. CSFV-induced [Ca2+]cyto increase potently induces autophagy through the CAMKK2-PRKAA-MTOR signaling pathway. (A) 3D4/2 and PK-15 cells were pretreated with BAPTA-AM (18 µM) or DMSO (control) for 24 h, and cell samples were analyzed by immunoblotting with antibodies against CAMKK2 and ACTB (loading control). (B and C) PK-15 (B) and 3D4/2 (C) cells were pretreated with ionomycin (7 µM), BAPTA-AM (18 µM) or DMSO (control) for 1.5 h after 1.5 h of virus absorption at an MOI of 1 and mock infection. The host cells were further cultured in fresh medium in the presence or absence of ionomycin (7 µM), BAPTA-AM (18 µM). At 36 hpi, the expression of p-MTOR, LC3B, PRKAA, p-PRKAA, CAMKK2, CSFV-E2, and ACTB (loading control) were analyzed by immunoblotting. The level of protein was quantified using Image-Pro Plus. Error bars indicate the mean (± SD) of 3 independent experiments. *, P < 0.05; **, P < 0.01; and ***, P < 0.001 (one-way ANOVA). (D) PK-15 cells were pretreated and infected as described in (B). At 48 hpi, cells were analyzed as described in the legend to . (E) PK-15 cells were pretreated and infected as described in (B). At 48 hpi, cells were stained with BBcellProbeTM F04 solution at 37°C for 30 min. The fluorescence signals were visualized with a fluorescence microscope. The IOD/area of fluorescence signals was determined in each group. Error bars indicate the mean (± SD) of 3 independent experiments. *, P < 0.05; **, P < 0.01; and ***, P < 0.001 (one-way ANOVA). (F) 3D4/2 and PK-15 cells were pretreated and infected as described in (B and C). At 48 hpi, both the intracellular and extracellular viral titers were measured by TCID50. Error bars indicate the mean (± SD) of 3 independent experiments. *, P < 0.05; **, P < 0.01; and ***, P < 0.001 (one-way ANOVA). (G) PK-15 and 3D4/2 cells were pretreated with BAPTA-AM (18 µM) or DMSO (control) for 1.5 h, followed by CSFV adsorption for 1.5 h at an MOI of 1. The host cells were further cultured in fresh medium in the presence of BAPTA-AM (18 µM). At 24 and 48 hpi, the mRNA level of Npro(CSFV) were detected by qRT-PCR as described in Materials and Methods
![Figure 6. CSFV-induced [Ca2+]cyto increase potently induces autophagy through the CAMKK2-PRKAA-MTOR signaling pathway. (A) 3D4/2 and PK-15 cells were pretreated with BAPTA-AM (18 µM) or DMSO (control) for 24 h, and cell samples were analyzed by immunoblotting with antibodies against CAMKK2 and ACTB (loading control). (B and C) PK-15 (B) and 3D4/2 (C) cells were pretreated with ionomycin (7 µM), BAPTA-AM (18 µM) or DMSO (control) for 1.5 h after 1.5 h of virus absorption at an MOI of 1 and mock infection. The host cells were further cultured in fresh medium in the presence or absence of ionomycin (7 µM), BAPTA-AM (18 µM). At 36 hpi, the expression of p-MTOR, LC3B, PRKAA, p-PRKAA, CAMKK2, CSFV-E2, and ACTB (loading control) were analyzed by immunoblotting. The level of protein was quantified using Image-Pro Plus. Error bars indicate the mean (± SD) of 3 independent experiments. *, P < 0.05; **, P < 0.01; and ***, P < 0.001 (one-way ANOVA). (D) PK-15 cells were pretreated and infected as described in (B). At 48 hpi, cells were analyzed as described in the legend to Figure 2F. (E) PK-15 cells were pretreated and infected as described in (B). At 48 hpi, cells were stained with BBcellProbeTM F04 solution at 37°C for 30 min. The fluorescence signals were visualized with a fluorescence microscope. The IOD/area of fluorescence signals was determined in each group. Error bars indicate the mean (± SD) of 3 independent experiments. *, P < 0.05; **, P < 0.01; and ***, P < 0.001 (one-way ANOVA). (F) 3D4/2 and PK-15 cells were pretreated and infected as described in (B and C). At 48 hpi, both the intracellular and extracellular viral titers were measured by TCID50. Error bars indicate the mean (± SD) of 3 independent experiments. *, P < 0.05; **, P < 0.01; and ***, P < 0.001 (one-way ANOVA). (G) PK-15 and 3D4/2 cells were pretreated with BAPTA-AM (18 µM) or DMSO (control) for 1.5 h, followed by CSFV adsorption for 1.5 h at an MOI of 1. The host cells were further cultured in fresh medium in the presence of BAPTA-AM (18 µM). At 24 and 48 hpi, the mRNA level of Npro(CSFV) were detected by qRT-PCR as described in Materials and Methods](/cms/asset/97078f58-bac1-4c9e-8fa0-19a622adc7c4/kaup_a_1739445_f0006_oc.jpg)
NS5A induces autophagy through the activation of the CAMKK2-PRKAA-MTOR signaling pathway
To confirm whether the expression of CSFV non-structural proteins (Npro, NS4A, NS2, NS5A, and NS3) and structural proteins (E2, E1, Erns, and C) can activate autophagy, we transfected host cells with the CSFV non-structural proteins (Npro, NS4A, NS2, NS5A, and NS3) and structural proteins (E2, E1, Erns, and C) expression plasmids, and we determined the LC3 level by using immunoblotting. When non-structural proteins (Npro, NS4A, NS2, NS5A, and NS3) and structural proteins (E2, E1, Erns, and C) were expressed in host cells, NS5A expression increased the level of LC3-II (P < 0.001), but the expression of the non-structural proteins (Npro, NS4A, NS2, NS3) and structural proteins (E2, E1, Erns, and C) did not affect the LC3-II level (, B). The CSFV non-structural protein NS5A could induce autophagy, suggesting that NS5A played an essential role in CSFV-mediated autophagy. It has been reported that CSFV NS5A in the endoplasmic reticulum induces oxidative stress [Citation46,Citation47]. Prior studies demonstrate that ER stress-induced autophagy mainly includes ER stress-mediated autophagy and reticulophagy. The signaling pathways of ERN1 (endoplasmic reticulum to nucleus signaling 1), EIF2AK3 (eukaryotic translation initiation factor 2 alpha kinase 3), ATF6 (activating transcription factor 6), and Ca2+ are necessary for the activation of ER stress [Citation48]. To further analyze whether the expression of CSFV non-structural proteins (Npro, NS4A, NS2, NS5A, and NS3) and structural proteins (E2, E1, Erns, and C) can activate the CAMKK2-PRKAA-MTOR signaling pathway in CSFV-mediated autophagy, we determined the levels of related proteins including PRKAA, CAMKK2, and MTOR activity by immunoblotting. When non-structural proteins (Npro, NS4A, NS2, NS5A, and NS3) and structural proteins (E2, E1, Erns, and C) were expressed in 3D4/2 and PK-15 cells, NS5A expression improved the levels of CAMKK2 and p-PRKAA (P < 0.001) but reduced the level of p-MTOR (P < 0.001, , B). On the other hand, NS5A expression did not affect the AKT-MTOR pathway and MAPK1/3-MTOR pathway ().
Figure 7. NS5A induces autophagy through the activation of the CAMKK2-PRKAA-MTOR signaling pathway. (A) 3D4/2 and PK-15 cells were transfected with p-EGFP-Erns (CSFV), p-EGFP-E1 (CSFV), p-EGFP-E2 (CSFV), p-EGFP-C (CSFV), and p-EGFP-NS5A (CSFV) vectors. At 48 hpi, cell samples were analyzed by immunoblotting with antibodies against p-MTOR, PRKAA, p-PRKAA, CAMKK2, LC3B, and ACTB (loading control), and the efficiency of transfection was measured using an antibody against GFP. The level of protein was quantified using Image-Pro Plus. Error bars indicate the mean (± SD) of 3 independent experiments. *, P < 0.05; **, P < 0.01; and ***, P < 0.001 (one-way ANOVA). (B) 3D4/2 and PK-15 cells were transfected with p-EGFP-Npro (CSFV), p-EGFP- NS4A (CSFV), p-EGFP-NS2 (CSFV), p-EGFP- NS5A (CSFV), p-EGFP-NS3 (CSFV), and p-EGFP-C1 vectors. At 48 hpi, cell samples were analyzed by immunoblotting with antibodies against p-MTOR, PRKAA, p-PRKAA, CAMKK2, and ACTB (loading control), and the efficiency of transfection was measured using an antibody against GFP. The level of protein was quantified using Image-Pro Plus. Error bars indicate the mean (± SD) of 3 independent experiments. *, P < 0.05; **, P < 0.01; and ***, P < 0.001 (one-way ANOVA). (C) 3D4/2 and PK-15 cells were transfected with either pEGFP-C1 or pEGFP-NS5A. At 24 and 48 hpi, the cell samples were analyzed by immunoblotting with antibodies against p-MTOR, p-PRKAA, CAMKK2, MAPK1/3, p-MAPK1/3, LC3B, p-AKT, AKT, and ACTB (loading control). The level of protein was quantified using Image-Pro Plus. Error bars indicate the mean (± SD) of 3 independent experiments. *, P < 0.05; **, P < 0.01; and ***, P < 0.001 (one-way ANOVA). (D) PK-15 cells were transfected with plasmids encoding NS5A-Flag and HSP90AB1-HA protein, followed by immunoprecipitation (IP) with anti-Flag beads and immunoblot analysis with anti-HA. (E) PK-15 cells were transfected with plasmids encoding NS5A-Flag protein, followed by immunoprecipitation (IP) with anti-HSP90AB1 antibody and immunoblot analysis with anti-Flag
To reveal the molecular mechanism by which NS5A induces autophagy through the activation of the CAMKK2-PRKAA-MTOR signaling pathway. We cloned the NS5A using PrimeSTAR HS DNA polymerase and constructed NS5A-3× Flag fusion genes by cleavage and ligation of the NS5A gene into the p3× Flag-CMV vector. Then, we performed a tandem affinity purification 48 h after we transiently transfected the plasmid p3× Flag-NS5A into PK-15 cells. We separated the final eluates from p3× Flag-NS5A transfected PK-15 cells by 12% SDS-PAGE and stained with Coomassie Brilliant Blue. Then peptides were extracted and introduced into an ion-trap mass spectrometer. We identified the sequenced peptides of NS5A-3× Flag protein complexes by database searching and MS/MS analysis. Then immunoprecipitation and western blot assays were conducted to determine if HSP90AB1 (heat shock protein 90 alpha family class B member)-HA were interacting with NS5A-3× Flag protein. Our results suggested that HSP90AB1-HA could be co-immunoprecipitated with NS5A-3× Flag protein (). Furthermore, the endogenous HSP90AB1 that co-immunoprecipitated with NS5A-3× Flag protein could be detected by the HSP90AB1-specific antibody (). NS5A-3× Flag (CSFV) protein interacting with HSP90AB1 might inhibit the functionality of HSP90AB1, leading to activation of the CAMKK2-PRKAA-MTOR signaling pathway.
We used the autophagy inhibitors U0126, INS, and compound C in host cells to determine the main autophagy pathway induced by CSFV. We measured CSFV E2 protein, LC3-II, and MTOR activity by immunoblotting. As revealed in , therapy with different autophagy inhibitors decreased the expression of CSFV structural protein E2 and LC3-II at 48 hpi in CSFV-infected host cells and increased MTOR activity (, P < 0.05). However, the inhibitory effect of INS on the AKT-MTOR pathway was most significant (, P < 0.01).
Figure 8. AKT-MTOR pathway plays an important role in the induction of autophagy by CSFV. (A) PK-15 cells were pretreated with U0126 (7.5 µM), INS (100 ng/mg), compound C (50 µM) or DMSO (control) for 1.5 h, followed by CSFV infection for 1.5 h at an MOI of 1. The host cells were further cultured in fresh medium in the presence of U0126 (7.5 µM), INS (100 ng/mg), compound C (50 µM) or DMSO (control). And then the infected PK-15 cells were studied by electron microscopy at 48 hpi. The average number of autophagosome-like vesicles per cell from at least 20 cells in each group. Error bars indicate the mean (± SD) of 3 independent experiments. *, P < 0.05; **, P < 0.01; and ***, P < 0.001 (one-way ANOVA). scale bar: 2 µm. Black arrows indicate the structures with the characteristics of autophagosomes. (B) 3D4/2 and PK-15 cells were pretreated with U0126 (7.5 µM), INS (100 ng/mg), compound C (50 µM) or DMSO (control) for 1.5 h, followed by CSFV infection for 1.5 h at an MOI of 1. The host cells were further cultured in fresh medium in the presence of U0126 (7.5 µM), INS (100 ng/mg), compound C (50 µM) or DMSO (control). At 48 hpi, cell samples were analyzed by immunoblotting with antibodies against p-MTOR, LC3B, CSFV-E2, and ACTB (loading control). The level of protein was quantified using Image-Pro Plus. Error bars indicate the mean (± SD) of 3 independent experiments. *, P < 0.05; **, P < 0.01; and ***, P < 0.001 (one-way ANOVA)
Meanwhile, we analyzed the formation of autophagosome-like vesicles by transmission electron microscopy (TEM) and quantitative analysis. As revealed in , the number of vesicles decreased in the cytoplasm of CSFV-infected PK-15 cell therapy with different autophagy inhibitors (, P < 0.001). However, the quantitative analysis also showed a significant decrease in the quantity of single- and double-membrane vesicles in the INS-treated CSFV-infected cells compared with the U0126-treated CSFV-infected cells or compound C-treated CSFV-infected cells (P < 0.001). These results indicated that NS5A induced autophagy via the CAMKK2-PRKAA-MTOR signaling pathway but not the AKT-MTOR pathway or MAPK1/3-MTOR pathway, but the AKT-MTOR pathway played an important role in the induction of autophagy by CSFV.
Inhibition of autophagy decreases CSFV yield
To search the influence of autophagy on CSFV replication, the autophagy inhibitors U0126, INS, and compound C were used to inhibit autophagy in PK-15 cells. We analyzed CSFV proliferation by detecting CSFV E2 protein and virus titer by using indirect immunofluorescence assays and immunoblotting. As revealed in , therapy with different autophagy inhibitors decreased the expression of CSFV structural protein E2 and LC3-II at 48 hpi in PK-15 cells infected with CSFV (, C,E) and decreased the viral titer (, D,F). These results showed that autophagy induced by CSFV promoted CSFV replication.
Figure 9. Inhibition of autophagy decreases CSFV virus yield. (A) PK-15 cells were pretreated with DMSO (control) or INS (100 ng/ml) for 1.5 h, followed by CSFV adsorption for 1.5 h at an MOI of 1. The host cells were further cultured in fresh medium in the presence or absence of INS (100 ng/ml). At 24 and 48 hpi, the cell samples were analyzed by immunoblotting with antibodies against LC3B, p-AKT, AKT, CSFV-E2, and ACTB (loading control). The level of protein was quantified using Image-Pro Plus. Error bars indicate the mean (± SD) of 3 independent experiments. *, P < 0.05; **, P < 0.01; and ***, P < 0.001 (one-way ANOVA). (C) PK-15 cells were pretreated with DMSO (control) or U0126 (7.5 µM) for 1.5 h, followed by CSFV infection for 1.5 h at an MOI of 1. The host cells were further cultured in fresh medium in the presence or absence of U0126 (7.5 µM). At 24 and 48 hpi, the cell samples were analyzed by immunoblotting with antibodies against p-MAPK1/3, LC3B, MAPK1/3, CSFV-E2, and ACTB (loading control). The relative levels of the targeted proteins were estimated by densitometric scanning, and the ratios were calculated relative to ACTB. Error bars indicate the mean (± SD) of 3 independent experiments. *, P < 0.05; **, P < 0.01; and ***, P < 0.001 (one-way ANOVA). (E) PK-15 cells were pretreated with DMSO (control) or compound C (50 µM) for 1.5 h, followed by CSFV infection for 1.5 h at an MOI of 1. The host cells were further cultured in fresh medium in the presence or absence of compound C (50 µM). At 24 and 48 hpi, the cell samples were analyzed by immunoblotting with antibodies against p-PRKAA, LC3B, PRKAA, CSFV-E2, and ACTB (loading control). The relative level of the targeted proteins were estimated by densitometric scanning and the ratios were calculated relative to ACTB. Error bars indicate the mean (± SD) of 3 independent experiments. *, P < 0.05; **, P < 0.01; and ***, P < 0.001 (one-way ANOVA). (B, D, and F) PK-15 cells were pretreated and infected as described in (A, C, and E). At 24 and 48 hpi, both the extracellular and intracellular viral titers were measured by TCID50. Error bars indicate the mean (± SD) of 3 independent experiments. *, P < 0.05; **, P < 0.01; and ***, P < 0.001 (one-way ANOVA)
Pharmacological treatments do not affect cell viability
Since the cytotoxicity of different autophagy regulatory factors may affect the activity of experimental cells and interfere with the determination and accuracy of the results, we performed the MTT assay to analyze the influence of different autophagy regulatory factors on cell viability. The experimental results showed no overt toxicity of different autophagy regulatory factors to cells at the designated drug treatment concentration, and the viability of cells treated with different autophagy regulatory factors was not significantly affected compared with controls (P > 0.05, ).
Isolation and identification of BECN1 protein complexes by tandem affinity purification/LC-MS, colocalization of BECN1 and MAVS.
Figure 10. Modulation of autophagy activity with autophagy regulators does not affect cell viability. The viability of host cells was analyzed using the MTT assay after treatment with U0126 (7.5 µM), INS (100 ng/ml), STO-609 (50 µM), BAPTA-AM (18 µM), compound C (50 µM), rapamycin (100 nM) or ionomycin (7 µM) for 48 h. Error bars indicate the mean (± SD) of 3 independent experiments. *, P < 0.05; **, P < 0.01; and ***, P < 0.001 (one-way ANOVA)
Recent studies show that overexpressing BECN1, which is essential for the initiation of autophagosomes, inhibits type I IFN production by blocking DDX58-MAVS interaction [Citation28]. Thus, we first measured the expression of BECN1 in CSFV-infected cells by immunoblotting. As presented in , CSFV-infected host cells had an increased level of BECN1 from 24 to 48 hpi (P < 0.001, , lanes 2 and 4).
Figure 11. Isolation and identification of BECN1 protein complexes by tandem affinity purification/LC-MS, colocalization of BECN1 and MAVS. (A) 3D4/2 and PK-15 cells were infected with CSFV at an MOI of 1 or mock-infected. At 24 and 48 hpi, cell samples were analyzed by immunoblotting with antibodies against BECN1 and ACTB (loading control). The level of protein was quantified using Image-Pro Plus. Error bars indicate the mean (± SD) of 3 independent experiments. *, P < 0.05; **, P < 0.01; and ***, P < 0.001 (one-way ANOVA). (B) PK-15 cells were transfected with negative control shRNA or specific shRNA against MAVS for 48 h and then analyzed by western blotting. (C) 3D4/2 and PK-15 cells were transfected with negative control shRNA or specific shRNA against MAVS for 24 h and then infected with CSFV or mock-infected at an MOI of 1, At 48 hpi, the mRNA levels of IFN1A and IFNB1 were detected by qRT-PCR as described in Materials and Methods. (D) Coomassie Brilliant Blue staining of tandem affinity purified protein complexes. Proteins purified from Protein G/GFP-tagged BECN1 AND Protein G/Flag-tagged BECN1 were separated on a 4-12% gel and Coomassie Brilliant Blue-stained. (E) PK-15 cells were transfected with plasmids encoding Flag-BECN1 and BECN1 protein complexes (HA-ATG5, GFP-ATG14, and GFP-MAVS), followed by immunoprecipitation (IP) with anti-GFP beads (or anti-HA beads) and immunoblot analysis with anti-Flag. (F) Colocalization of BECN1 and MAVS. 293 FT cells were cotransfected with expression plasmids p-EGFP-MAVS and p3× Flag-CMV-BECN1. A single transfection was used as a control. At 48 h after transfection, the cells subjected to indirect immunofluorescence assays to detect BECN1 (red) and MAVS (green) with anti-Flag monoclonal antibody and anti-EGFP monoclonal antibody. DAPI (blue) was used to indicate the nucleus. The distribution and colocalization of BECN1 and MAVS were examined using a Leica SP2 confocal system. (G) Glutathione S-transferase (GST) affinity-isolation assay. MAVS-GST or GST proteins expressed in Escherichia coli BL21(DE3) were purified with glutathione-Sepharose 4B resin and incubated with the lysate of HEK293 FT cells overexpressing the Flag-tagged BECN1. After washing with cold PBS, the bound proteins were subjected to SDS-PAGE and immunoblotting using the anti-GST polyclonal antibody (PAb) (1:2000) and the anti-flag monoclonal antibody (MAb) (1:1000)
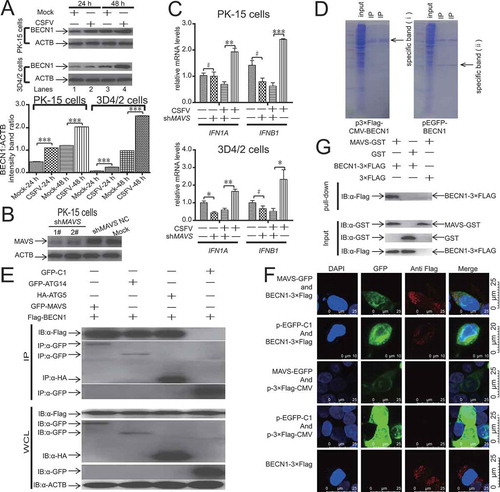
To reveal the molecular mechanism by which CSFV-mediated autophagy inhibits IFN production in host cells. We cloned the BECN1 cDNA from total mRNA of PK-15 cells using PrimeSTAR HS DNA polymerase and constructed BECN1-eGFP fusion genes and BECN1-Flag fusion genes by cleavage and ligation of the BECN1 gene into the p-EGFP-C1 and p3× Flag-CMV vector. We transiently transfected the plasmids p-EGFP-BECN1 and p3× Flag-BECN1 into PK-15 cells. Then we performed tandem affinity purification 48 h after the plasmids p-EGFP-BECN1 and p3× Flag-BECN1 were transiently transfected into PK-15 cells. The final eluates from p-EGFP-BECN1 and p3× Flag-BECN1-transfected PK-15 cells were separated by 12% SDS-PAGE and stained with Coomassie Brilliant Blue. These specific bands (ⅰ and ⅱ) in were excised and discarded to improve the accuracy of the identification of BECN1 protein complexes. These nonspecific bands were excised and digested, and peptides were extracted and introduced into an ion-trap mass spectrometer. We identified the sequenced peptides of BECN1 protein complexes by database searching and MS/MS analysis. Then immunoprecipitation and western blot assays were conducted to determine if those identified proteins, including ATG5, ATG14, and MAVS, were interacting with BECN1 protein. Our results suggested that ATG5, ATG14, and MAVS could be co-immunoprecipitated with BECN1 protein, and the strength of the interaction between MAVS and BECN1 was significantly higher than that of ATG5 and ATG14 (). Also, we used confocal immunofluorescence microscopy to visualize the intracellular colocalization of BECN1 and MAVS in 293 FT cells cotransfected with p-EGFP-MAVS and p3× Flag-CMV-BECN1. Our results demonstrated that BECN1 located in the cytoplasm with MAVS (). To determine whether the interaction between recombinant BECN1-3× Flag and MAVS-GFP in vivo occurs in vitro, we conducted a GST affinity-isolation assay with the GST-tagged MAVS protein and the Flag-tagged BECN1 protein. The results demonstrated that GST-MAVS but not GST interacted with BECN1-3× Flag ().
Inhibition of autophagy increases the expression of IFN in CSFV-infected host cells
To determine the influence of CSFV-mediated autophagy on IFN production, the autophagy inhibitors INS, compound C, BAPTA-AM, U0126, and STO-609 were used to inhibit autophagy in 3D4/2 and PK-15 cells. We detected mRNA expression of IFN1A/IFN-α and IFNB1/IFN-β derived from CSFV-infected host cells. As revealed in , therapy with autophagy inhibitors increased the expression of IFN at 24 hpi (–J).
Figure 12. Inhibition of autophagy increases the expression of type I IFN in CSFV-infected host cells. (A-E) PK-15 cells were pretreated with compound C (50 µM) (A), INS (100 ng/ml) (B), BAPTA-AM (18 µM) (C), U0126 (7.5 µM) (D), STO-609 (50 µM) (E) or DMSO (control) for 1.5 h, followed by CSFV adsorption for 1.5 h at an MOI of 1. The host cells were further cultured in fresh medium in the presence of compound C (50 µM) (A), INS (100 ng/ml) (B), BAPTA-AM (18 µM) (C), U0126 (7.5 µM) (D), STO-609 (50 µM) (E). At 24 and 48 hpi, the mRNA levels of IFN1A and IFNB1 were detected by qRT-PCR as described in Materials and Methods. (F-J) 3D4/2 cells were pretreated with compound C (50 µM) (F), INS (100 ng/ml) (G), BAPTA-AM (18 µM) (H), U0126 (7.5 µM) (I), STO-609 (50 µM) (J) or DMSO (control) for 1.5 h, followed by CSFV adsorption for 1.5 h at an MOI of 1. The host cells were further cultured in fresh medium in the presence of compound C (50 µM) (F), INS (100 ng/ml) (G), BAPTA-AM (18 µM) (H), U0126 (7.5 µM) (I), STO-609 (50 µM) (J). At 24 and 48 hpi, the mRNA levels of IFN1A and IFNB1 were detected by qRT-PCR as described in Materials and Methods
CSFV-mediated autophagy suppressing IFN production is related to the interaction between MAVS and BECN1
To determine the effect of RLR signaling on interferon secretion during CSFV infection, we performed the shRNA knockdown experiments to deplete endogenous MAVS protein specifically. We designed two pairs of shRNAs targeting MAVS and tested the silencing effect (). We used the most effective shRNA (1#) targeting MAVS. As illustrated in , 3D4/2 and PK-15 cells transfected with shMAVS have a significant decrease in mRNA expression of IFN genes compared with scrambled shRNAs transfected host cells.
We designed two pairs of siRNAs targeting BECN1, and also tested the silencing effect (). We used the most effective siRNA (2#) targeting BECN1. As illustrated in , PK-15 cells transfected with siBECN1 presented significantly decreased level of endogenous BECN1 proteins than cells transfected with scrambled siRNAs comprising the control group. To determine if CSFV-mediated autophagy affects IFN production, we detected mRNA expression of IFN1A, IFNB1 and ISG15 derived from CSFV-infected host cells and mock, which we transfected with siBECN1 or scrambled siRNA (control). As illustrated in , 3D4/2 and PK-15 cells transfected with siBECN1 had a significant increase in mRNA expression of IFN genes compared with scrambled siRNA-transfected host cells (). Moreover, CSFV-infected cells had a significant difference in the expression of IFN compared with mock-infected cells (). Besides, the analogous conclusion was also observed in IFNB1 production in the supernatant detected by ELISA (). To verify if overexpression of BECN1 affects IFN production. We detected mRNA expression of IFN1A, IFNB1 and ISG15 derived from CSFV-infected host cells and mock, which we transfected with p-EGFP-BECN1 or p-EGFP-C1 (control). As illustrated in , 3D4/2 and PK-15 cells transfected with p-EGFP-BECN1 had a significant decrease in mRNA expression of IFN genes in CSFV-infected host cells compared with CSFV-infected (scrambled siRNA) host cells. Furthermore, we also observed the analogous conclusion in IFNB1 production in the supernatant detected by ELISA (). These findings indicated that CSFV-mediated autophagy suppressing IFN production was related to the interaction between MAVS and BECN1.
Figure 13. CSFV-mediated autophagy suppressing IFN production is related to the interaction between MAVS and BECN1. (A) PK-15 cells were transfected with negative control siRNA or specific siRNA against BECN1 for 48 h and then analyzed by western blotting. (B) PK-15 cells were transfected with either siNC or BECN1-specific siRNA for 24 h and then infected with CSFV or mock infected at an MOI of 1 for an additional 48 h, after which cells were harvested for western blotting assay. (C) 3D4/2 and PK-15 cells were pretreated and infected as described in (B). At 48 hpi, the mRNA levels of IFN1A, IFNB1, and ISG15 were detected by qRT-PCR as described in Materials and Methods. (D) PK-15 cells were pretreated and infected as described in (B). At 24 and 48 hpi, the production of IFNB1 was assessed by the ELISA assay. (E) 3D4/2 and PK-15 cells were transfected with either p3× Flag-BECN1 or p3× Flag-CMV for 24 h and then infected with CSFV or mock infected at an MOI of 1 for an additional 48 h, after which the mRNA levels of IFN1A, IFNB1, and ISG15 were detected by qRT-PCR as described in Materials and Methods. (F) PK-15 cells were pretreated and infected as described in (E). At 24 and 48 hpi, the production of IFNB1 was assessed by the ELISA assay
Discussion
Autophagy is commonly associated with many signaling pathways [Citation49]. Our previous studies demonstrated that CSFV induces autophagy to promote virus proliferation in host cells [Citation13]. For CSFV, the precise signaling pathways modulating autophagy in CSFV-infected host cells have remained mostly unknown to date. In this study, we have conducted a detailed study of the critical autophagy induction signaling network in CSFV-infected host cells.
MTORC1 is a primary control complex for autophagy. Moreover, MTOR is reportedly involved in the negative modulation of autophagy [Citation50,Citation51]. To define the underlying mechanism by which CSFV induces autophagy, we analyzed the MTOR pathway in 3D4/2 and PK-15 cells. When we infected the host cells with CSFV, we found that CSFV-infected host cells had a decreased level of p-MTOR as well as a significant increase in the level of LC3-II (–C). Furthermore, the AKT-MTOR, MAPK1/3-MTOR, and CAMKK2-PRKAA-MTOR pathways were activated in CSFV-infected spleen cells (). Previous studies demonstrate that coxsackievirus B3 induces autophagy via the PI3 K-AKT-MTOR signaling pathway [Citation38]. Moreover, Zika virus infection inhibits AKT-MTOR signaling pathway in host cells to activate autophagy [Citation39]. We observed that CSFV-infected host cells had reduced the level of p-AKT, and the AKT-MTOR pathway was activated in CSFV-infected host cells. (–F). Similar to CSFV, HCV induces autophagy via the AKT-TSC-MTOR signaling pathway [Citation34,Citation52]. Previous studies demonstrate that circovirus type 2 and avian reovirus induce autophagy via MAPK1/3 signaling [Citation33,Citation34]. Here, we presented evidence showing that CSFV-infected host cells increased the level of p-MAPK1/3 () and MAPK1/3 was the upstream maintainer of the MTOR-LC3 pathway in CSFV-infected host cells (, D). Interestingly, inhibition of autophagy with U0126 during CSFV infection reduced viral replication (, G,H). PRKAA is one of the critical molecular energy sensors [Citation53]. Prior studies demonstrate that autophagy can be activated by the PRKAA signaling pathway, which is closely associated with energy metabolism [Citation43]. Recent studies show that taurine therapy downregulates autophagy by regulating the ROS-PRKAA-MTOR signaling, thereby suppressing OTA-mediated PCV2 replication [Citation54]. Our data showed that CSFV-infected host cells had an increased level of p-PRKAA (, C,D,H) but the regulation of autophagy by PRKAA should be downstream of CAMKK2 regulation. Additionally, we showed that compound C or shPRKAA not only reduced the level of E2 in CSFV-infected host cells (, D,H) but also suppressed CSFV reproduction (, I). Previous studies demonstrate that excess calcium in the cytoplasm is released from the ER to regulate the activation of PRKAA through CAMKK2, thereby inhibiting the activity of MTOR and inducing autophagy [Citation26,Citation55]. Here, we presented evidence that CSFV-infected host cells had increased CAMKK2 expression level (, C,D) and CAMKK2 is an upstream switch of the PRKAA-MTOR axis. Previous reports indicate that porcine circovirus type 2 infection upregulates CAMKK2 by increasing [Ca2+]cyto [Citation23]. We found that the [Ca2+]cyto concentration surged in response to CSFV infection () and [Ca2+]cyto is the functional upstream regulator of the CAMKK2-PRKAA-MTOR pathway in CSFV infection (, C).
The CSFV non-structural protein 5A is a phosphorylated protein that can combine to multitudinous host proteins [Citation56]. Prior studies demonstrate that HSPA1B/HSP70 (heat shock protein family A [Hsp70] member 1B) and HSPB2/HSP27 (heat shock protein family B [small] member 2) are associated with CSFV NS5A protein [Citation57,Citation58]. Our data showed that NS5A expression activated autophagy through the stimulation of the CAMKK2-PRKAA-MTOR signaling pathway (, B) but not the AKT-MTOR pathway or MAPK1/3-MTOR pathway () but the AKT-MTOR pathway played an important role in the induction of autophagy by CSFV (, B). When we isolated and identified the NS5A protein complexes by tandem affinity purification/LC-MS and immunoprecipitation, our results showed that not only HSP90AB1-HA could be co-immunoprecipitated with NS5A-3× Flag protein (), but also the endogenous HSP90AB1 could be co-immunoprecipitated with NS5A-3× Flag (CSFV) protein (). Further studies will be required to demonstrate the functions of NS5A in vitro spleen organoid models and in vivo swines models.
To search the influence of autophagy on CSFV replication, We analyzed CSFV proliferation by detecting CSFV E2 protein and virus titer in PK-15 cells treated with different autophagy inhibitors. Our data showed that autophagy induced by CSFV promoted viral replication (–F), and the results were consistent with our previous research conclusions [Citation13].
Some research data indicate that autophagy may inhibit antiviral immunity [Citation59–61]. HCV mediates cellular autophagy and inhibits antiviral immunity [Citation62]. Dengue virus-induced autophagy suppresses RLR-mediated Type I IFN-independent signaling [Citation63]. Our previous studies showed that CSFV-mediated autophagy may restraint type I IFN secretion by suppressing RLR signaling [Citation30]. Our results showed that CSFV-infected host cells had an increased level of BECN1 (). Meanwhile, 3D4/2 and PK-15 cells transfected with shMAVS or p-EGFP-BECN1 had a decreased levels of type I IFN (). In contrast, 3D4/2 and PK-15 cells transfected with siBECN1 had an increased levels of type I IFN (). More importantly, therapy with the autophagy inhibitors INS, compound C, BAPTA-AM, U0126, and STO-609 increased the expression of IFN1A and IFNB1 in host cells infected with CSFV (–J). Then we isolated and identified the BECN1 protein complexes by tandem affinity purification/LC-MS and immunoprecipitation (), the interaction between BECN1 and MAVS was confirmed by immunoprecipitation, laser scanning confocal microscope technology, and GST affinity-isolation experiments (, F,G).
In conclusion, our results suggested that CSFV-mediated autophagy was driven by the repression of MTOR through [Ca2+]cyto-CAMKK2-PRKAA activation, MAPK1/3 activation, and AKT inhibition. Moreover, CSFV-mediated autophagy suppressing IFN production was related to the interaction between MAVS and BECN1 (). All of these pathways could be utilized to support CSFV proliferation. Our study concerning the signaling adjustment of CSFV-mediated autophagy will offer a new understanding of CSFV pathogenesis and accelerate to potential antiviral drug development. However, the molecular mechanisms of the CSFV-mediated autophagy signaling pathways and immunological function remain to be characterized, the understanding of which is essential for the further control of viral infections.
Figure 14. Proposed model of the signaling network in CSFV-mediated autophagy and CSFV-mediated autophagy suppressing IFN production. CSFV infection induces the suppression of AKT, upregulation of MAPK1/3, and upregulation of PRKAA via [Ca2+]cyto-mediated CAMKK2 activation, leading to the inhibition of MTOR, ultimately leading to the initiation of autophagy. Then CSFV-mediated autophagy suppressed IFN production
![Figure 14. Proposed model of the signaling network in CSFV-mediated autophagy and CSFV-mediated autophagy suppressing IFN production. CSFV infection induces the suppression of AKT, upregulation of MAPK1/3, and upregulation of PRKAA via [Ca2+]cyto-mediated CAMKK2 activation, leading to the inhibition of MTOR, ultimately leading to the initiation of autophagy. Then CSFV-mediated autophagy suppressed IFN production](/cms/asset/8553792a-3166-4594-ac86-7832e731cd7a/kaup_a_1739445_f0014_oc.jpg)
Materials and methods
Antibodies, plasmids, and chemicals
The primary antibodies were specific for p-PRKAA/AMPKα (Thr172) (Cell Signaling Technology, 2535), p-MAPK1/3 (ERK1/2; Thr202/Tyr204; Cell Signaling Technology, 9101), MAPK1/3 (ERK1/2; Cell Signaling Technology, 9102), AKT (Cell Signaling Technology, 9272), p-AKT (Ser473; Cell Signaling Technology, 9272), PRKAA/AMPKα (Novus Biologicals, NB100-239), MTOR (Novus Biologicals, NB100-240), BECN1/Beclin 1 (Novus Biologicals, NB110-87,318), CAMKK2/CaMKKβ (Abcam ab168818), LC3B (Novus Biologicals, NB100-2220), p-MTOR (S2448; Abcam, ab109268), HSP90AB1 (Proteintech, 11,405-1-AP), MAVS (Proteintech, 14,341-1-AP), Flag (Beyotime, AF519), HA (Beyotime, AH158), GFP (Beyotime, AF1483), and GAPDH (Gene Tex, GTX100118), Tubulin (Beyotime, AT819), ACTB (Beyotime, AA128). In addition, 4ʹ,6-diamidino-2-phenylindole (DAPI; C1005), Alexa Fluor 647-conjugated goat anti-mouse secondary antibodies (P0191) and Alexa Fluor 488-conjugated goat anti-rabbit (A0428) secondary antibodies were obtained from Beyotime. Horseradish peroxidase (HRP)-labeled goat anti-mouse (A0216) and anti-rabbit (A0208) secondary antibodies were also purchased from Beyotime. Ionomycin (S1672), U0126 (S1901), and INS/insulin (P3376) were obtained from Beyotime. STO-609 (ab141591) was purchased from Abcam. BAPTA-AM (HY-100,545) was purchased from MedChemExpress. compound C (B3252) was obtained from APExBIO. 3-MA (M9281) was obtained from Sigma-Aldrich. Rapamycin (9904) was obtained from Cell Signaling Technology. pEGFP-Npro, pEGFP-NS4A, pEGFP-NS2, pEGFP-NS3, pEGFP-NS5A, pEGFP-C1, and mouse anti-CSFV E2 antibodies were prepared in our laboratory. Viral RNA was extracted using the TAKARA MiniBEST Viral RNA/DNA Extraction Kit Ver. 5.0 (TAKARA, 9766), and the synthesis of cDNA was performed using the PrimeScriptTM II First-Strand cDNA Synthesis Kit (TAKARA,6210A) according to the manufacturer’s protocol. The four structural proteins (C, Erns, E1, and E2) of CSFV were amplified via PCR from the cDNA of CSFV and then cloned into pEGFP-C1 (Clontech, 6084–1). Moreover, We cloned the ATG5, ATG14, and MAVS cDNA from total mRNA of PK-15 cells using PrimeSTAR HS DNA polymerase (TAKARA, R010A) and constructed ATG14-GFP, MAVS-GFP, and ATG5-HA fusion genes by cleavage and ligation genes into the p-EGFP-C1 and pCAGG-HA vector (HA-tagged pCAGGS-based plasmid was prepared in our laboratory). All constructs were validated by DNA sequencing. The primers used are indicated in .
Table 1. Primers for vector construction used in this study
Cells and virus
The swine kidney cell line PK-15 (ATCC, CCL-33) was cultured in complete Dulbecco’s modified Eagle’s medium (Gibco, C11995500BT) containing 10% fetal bovine serum (Gibco, 10,099), penicillin and streptomycin (Gibco, 15,140–122) at 37°C and 5% CO2. The porcine macrophage cell line 3D4/2 (ATCC, CRL-2845) was maintained in RPMI 1640 medium (Gibco, C11875500BT) supplemented with 10% FBS and 1% penicillin/streptomycin. The cells were incubated at 37°C with 5% CO2. The CSFV strain (Shimen) used in this study was prepared in our laboratory.
Viral infection
3D4/2 and PK-15 cells were grown to approximately 80% confluence in cell culture plates and were infected with CSFV at an MOI of 1. After 1.5 h, the inoculum was removed by aspiration. The cells were then washed with sterile phosphate-buffered saline (PBS, Thermo Fisher Scientific, 10,010,023) and incubated in fresh medium at 37°C for the indicated times until harvesting. Viral titers were calculated according to Kaerber and expressed as 50% tissue culture infectious doses (TCID50) per milliliter [Citation13].
Immunoblotting
Cell monolayers were washed with PBS three times and incubated on ice with RIPA lysis buffer (Beyotime, P0013B) containing a protease/phosphatase inhibitor cocktail (Beyotime, P1051) and 1 mM PMSF (Beyotime, ST506) for 30 min. The lysates were centrifuged at 14,500 g for 15 min at 4°C, and the protein quantification was performed by the BCA protein assay kit (Beyotime, P0012). Equal amounts of protein samples were denatured for 5 min in 5 × SDS-PAGE loading buffer, and protein samples were resolved by 12% SDS-PAGE and electrotransferred to polyvinylidene fluoride (PVDF) membranes (Millipore, ISEQ00010), which were then blocked for 2 h at 25°C in PBS containing 5% (w:v) nonfat milk (Beyotime, P0216) in PBS with 0.05% (w:v) Tween 20 (Sigma-Aldrich, P2287). Next, the membranes were probed with primary antibodies at 4°C overnight and then exposed to the corresponding secondary antibodies conjugated to horseradish peroxidase at 37°C for 1 h. The protein bands were detected by the ECL Plus kit (Beyotime, P0018).
Confocal immunofluorescence microscopy
After the appropriate treatment, cells were washed 3 times with PBS and fixed with 4% paraformaldehyde for 30 min at 25°C and permeabilized with 0.2% Triton X-100 (Sigma-Aldrich, T8787) for 10 min. Then, the cells were blocked with PBS containing 5% bovine serum albumin (Sigma-Aldrich, B2064) for 30 min at room temperature. Next, cells were incubated with primary antibodies (anti-LC3B or anti-Flag) for 1 h in PBS buffer at 37°C, followed by a 1 h incubation in PBS secondary antibodies (Alexa Fluor 647-conjugated goat anti-mouse secondary antibodies or Alexa Fluor 488-conjugated goat anti-rabbit secondary antibodies) at 37°C. The fluorescence signals were acquired using a TCS SP2 confocal fluorescence microscope (Leica) with constant excitation, emission, pinhole, and exposure time parameters. The average number of LC3 puncta per cell from at least 20 cells in each group were counted.
Biochemical interventions
3D4/2 and PK-15 cells grown in 6-well culture plates were pretreated with DMSO (control), 3-MA (5 mM), U0126 (7.5 µM), INS (100 ng/ml), STO-609 (50 µM), BAPTA-AM (18 µM), compound C (50 µM), rapamycin (100 nM) or ionomycin (7 µM). After pretreatment, 3D4/2 and PK-15 cells were infected with CSFV at a multiplicity of infection (MOI) of 1 for 1 h absorption. Then, the cells were cultured in fresh media containing the same drug as the pretreatment for different times.
Transfection and gene silencing
For transfection experiments, 3D4/2 and PK-15 cells were seeded into 6-well plates overnight and transiently transfected using X-tremeGENE HP DNA transfection reagent (Roche, 6,366,236,001) according to the manufacturer’s instructions. After 48 h of transfection, the gene knockdown efficiency was evaluated by immunoblotting. Additionally, two shRNAs targeting different sites within the coding sequences of PRKAA (or MAVS) were designed by and obtained from Sangon Biotech. And two siRNAs targeting different sites within the coding sequences of BECN1 were designed by and obtained from Sangon Biotech. The shRNA specific sequences and siRNA specific sequences are described in .
Table 2. RNAi sequences used in this study
Cell viability assay
Cell viability was evaluated with the CCK8 (Beyotime, C0038) according to the manufacturer’s instructions. The optical density was determined at 570 nm by using a microplate spectrophotometer (Bio-Rad).
Immunoprecipitation
PK-15 cells were transfected for 48 h and were incubated on ice with cell lysis buffer for western and IP (P0013) containing a protease/phosphatase inhibitor cocktail (Beyotime, P1051), 0.01 mol/L DTT, and 1 mM PMSF (Beyotime, ST506). For each sample, 200 µl of lysate was incubated with 2 µg of antibody and 20 µl Protein A + G Agarose (Beyotime, P2055) overnight. The Agarose beads were washed 3 times with 0.5 ml of cell lysis buffer. The precipitates were detected by immunoblotting.
Quantification of RNA
Total RNA was isolated using a HiFi RNA Mini Kit (BLKW, 110,702) according to the provided handbook, and 1 mg of the total RNA was reverse transcribed using a PrimeScript II 1st Strand cDNA Synthesis Kit (TAKARA, 6210A). The real-time RT-PCR was performed using the PrimeScrip RT Master Mix (TAKARA, RR036A). The primers used are indicated in .
Table 3. Primers for real-time RT-PCR used in this study
ELISA
The production of IFNB1 in the supernatant was detected using enzyme-linked immunosorbent assays (ELISAs) according to the manufacturer’s protocols (USCNK, SEA222Po). The samples were quantified using a microplate reader (Bio-Rad, USA).
Ca2+ influx assay
Intracellular Ca2+ was measured with BBcellProbeTM F04 solution dye (BsetBio, BB-48,113). In brief, after CSFV infection, cells were washed with HBSS (Thermo Fisher Scientific, 14,025,076). Cell monolayers were stained with BBcellProbeTM F04 solution at 37°C for 30 min. Then, the cells were washed with HBSS. Next, cells were incubated with HBSS for 1 h at room temperature. The fluorescence signals were visualized with a fluorescence microscope.
GST affinity-isolation assays
For GST affinity-isolation assays, MAVS-GST or GST protein were generated by expression in Escherichia coli BL21(DE3; TRANSGEN, CD601-02) using the pET-N-GST-Thrombin-C-His plasmid (Beyotime, D2911). The proteins were bound to glutathione-Sepharose 4B resin (GE Healthcare, 10,049,253) according to the manufacturer’s instruction. The resin was washed four with PBS and incubated with the lysate of HEK293 FT cells (Thermo Fisher Scientific, R70007) transfected with p3× Flag-BECN1 plasmids (p3× Flag-BECN1 was prepared in our laboratory) for 2 h at 4°C. The eluted proteins were subjected to SDS-PAGE and immunoblotting.
Animal experimentation
In total, 6 Tibet swines (4 months old) bred at the specific pathogen-free (SPF) status. 3 Tibet swine were randomly selected, and each of them was infected with CSFV (105 TCID50). The other 3 control Tibet swine were injected with the same dose of PBS. when clinical symptoms appeared in most infected animals (10 dpi), all Tibet swines were sacrificed to collect spleens. The spleens samples were lysed in RIPA lysis buffer (Beyotime, P0013B) containing 1 mM PMSF (Beyotime, ST506) and homogenized by Dounce Tissue Grinders (TIANGEN, OSE-Y40). The supernatant was collected after centrifugation at 14,500 g for 15 min at 4°C. Animal breeding, care, and all experiments were performed in adherence to the guidelines of the Laboratory Animal Center of South China Agricultural University and approved by the Animal Ethics Committee.
Transmission electron microscopy
PK-15 cells grown in 10-cm dishes were collected in the bottom of 1.5-ml Eppendorf tubes by centrifugation at 1,200 g for 10 min. Then the cell samples were washed twice with PBS and then fixed in 2.5% glutaraldehyde diluted with PBS for 120 min at 25℃. Next, the cell samples were dehydrated with graded ethanol and embedded in epoxy resin. Finally, ultrathin sections were observed under a JEM-2010 HR TEM (JEOL).
Statistical analysis
All results are expressed as the mean ± standard deviation (SD). The intensities of the western blot bands were analyzed with Image-Pro Plus (version 6.0). Statistical analysis was performed by two-tailed Student’s t-test for pair-wise comparisons or by one-way ANOVA for multiple group comparisons using GraphPad Prism 5 (GraphPad Software). A value of P < 0.05 was considered statistically significant.
Ethical Considerations for Animal Experiments
Animal breeding, care, and all experiments were performed in adherence to the guidelines of the Laboratory Animal Center of South China Agricultural University and approved by the Animal Ethics Committee.
Disclosure statement
The authors declare that the research was conducted in the absence of any commercial or financial relationships that could be construed as a potential conflict of interest.
Additional information
Funding
References
- Ji W, Guo Z, Ding N-Z, et al. Studying classical swine fever virus: Making the best of a bad virus. Virus Res. 2015;197:35–47.
- Becher P, Avalos Ramirez R, Orlich M, et al. Genetic and antigenic characterization of novel pestivirus genotypes: implications for classification. Virology. 2003;311(1):96–104. DOI:10.1016/S0042-6822(03)00192-2.
- Lohse L, Nielsen J, Uttenthal A. Early pathogenesis of classical swine fever virus (CSFV) strains in Danish pigs. Vet Microbiol. 2012;159(3–4):327–336.
- Kleiboeker SB. Swine fever: classical swine fever and African swine fever. Veterin Clin North Am Food Anim Pract. 2002;18(3):431–451. DOI:10.1016/S0749-0720(02)00028-2.
- Li S, Wang J, Yang Q, et al. Complex Virus-Host Interactions Involved in the Regulation of Classical Swine Fever Virus Replication: A Minireview. Viruses. 2017;9(7):171. DOI:10.3390/v9070171.
- Levine B, Kroemer G. Autophagy in the pathogenesis of disease. Cell. 2008;132(1):27–42.
- Yin H, Zhao L, Wang Y, et al. Duck enteritis virus activates CaMKK beta-AMPK to trigger autophagy in duck embryo fibroblast cells via increased cytosolic calcium. Virol J. 2018;15(1):120. DOI:10.1186/s12985-018-1029-0.
- Yin H, Zhao L, Li S, et al. Impaired Cellular Energy Metabolism Contributes to Duck-Enteritis-Virus-Induced Autophagy via the AMPK-TSC2-MTOR Signaling Pathway. Front Cell Infect Microbiol. 2017;7. DOI:10.3389/fcimb.2017.00423.
- Jordan TX, Randall G. Dengue Virus Activates the AMP Kinase-mTOR Axis To Stimulate a Proviral Lipophagy. J Virol. 2017;91(11):e02020-16. DOI:10.1128/JVI.02020-16.
- Cao Y, Klionsky DJ. Physiological functions of Atg6/Beclin 1: a unique autophagy-related protein. Cell Res. 2007;17(10):839–849.
- Yang ZF, Klionsky DJ. Eaten alive: a history of macroautophagy. Nat Cell Biol. 2010;12(9):814–822.
- Gou H, Zhao M, Xu H, et al. CSFV induced mitochondrial fission and mitophagy to inhibit apoptosis. Oncotarget. 2017;8(24):39382–39400. DOI:10.18632/oncotarget.v8i24.
- Pei J, Zhao M, Ye Z, et al. Autophagy enhances the replication of classical swine fever virus in vitro. Autophagy. 2014;10(1):93–110. DOI:10.4161/auto.26843.
- Sage V, Cinti A, Amorim R, et al. Adapting the Stress Response: Viral Subversion of the mTOR Signaling Pathway. Viruses. 2016;8(6).:152. DOI:10.3390/v8060152
- Jung CH, Ro S-H, Cao J, et al. mTOR regulation of autophagy. FEBS Lett. 2010;584(7):1287–1295. DOI:10.1016/j.febslet.2010.01.017.
- Zhu Z, Yang C, Lyaswamy A, et al. Balancing mTOR Signaling and Autophagy in the Treatment of Parkinson’s Disease. Int J Mol Sci. 2019;20(3):728. DOI:10.3390/ijms20030728.
- Noguchi M, Hirata N, Suizu F. The links between AKT and two intracellular proteolytic cascades: Ubiquitination and autophagy. Biochimica Et Biophysica Acta-Rev Cancer. 2014;1846(2):342–352. DOI:10.1016/j.bbcan.2014.07.013.
- Heras-Sandoval D, Pérez-Rojas JM, Hernández-Damián J, et al. The role of PI3K/AKT/mTOR pathway in the modulation of autophagy and the clearance of protein aggregates in neurodegeneration. Cell Signal. 2014;26(12):2694–2701. DOI:10.1016/j.cellsig.2014.08.019.
- Hardie DG, Ross FA, Hawley SA. AMPK: a nutrient and energy sensor that maintains energy homeostasis. Nat Rev Mol Cell Biol. 2012;13(4):251–262.
- Hardie DG, Schaffer BE, Brunet A. AMPK: An energy-sensing pathway with multiple inputs and outputs. Trends Cell Biol. 2016;26(3):190–201.
- Cagnol S, Chambard J-C. ERK and cell death: Mechanisms of ERK-induced cell death - apoptosis, autophagy and senescence. FEBS J. 2010;277(1):2–21.
- Webber JL. Regulation of autophagy by p38 alpha MAPK. Autophagy. 2010;6(2):292–293. DOI:10.1038/emboj.2009.321.
- Gu Y, Qi B, Zhou Y, et al. Porcine Circovirus Type 2 Activates CaMMK to Initiate Autophagy in PK-15 Cells by Increasing Cytosolic Calcium. Viruses-Basel. 2016;8(5):135. DOI:10.3390/v8050135.
- Decuypere JP, Bultynck G, Parys JB. A dual role for Ca(2+) in autophagy regulation. Cell Calcium. 2011;50(3):242–250.
- Ghislat G, Knecht E. Ca(2)(+)-sensor proteins in the autophagic and endocytic traffic. Curr Protein Pept Sci. 2013;14(2):97–110.
- Hoyer-Hansen M, Bastholm L, Szyniarowski P, et al. Control of macroautophagy by calcium, calmodulin-dependent kinase kinase-beta, and Bcl-2. Mol Cell. 2007;25(2):193–205. DOI:10.1016/j.molcel.2006.12.009.
- Periyasamy P, Guo M-L, Buch S. Cocaine induces astrocytosis through ER stress-mediated activation of autophagy. Autophagy. 2016;12(8):1310–1329.
- Jin S, Tian S, Chen Y, et al. USP19 modulates autophagy and antiviral immune responses by deubiquitinating Beclin-1. The EMBO Journal. 2016;35(8):866–880. DOI:10.15252/embj.201593596.
- Liu W-J, Yang Y-T, Zhao M-Q, et al. PKR activation enhances replication of classical swine fever virus in PK-15 cells. Virus Res. 2015;204:47–57.
- Pei J, Deng J, Ye Z, et al. Absence of autophagy promotes apoptosis by modulating the ROS-dependent RLR signaling pathway in classical swine fever virus-infected cells. Autophagy. 2016;12(10):1738–1758. DOI:10.1080/15548627.2016.1196318.
- Chen N, Karantza V. Autophagy as a therapeutic target in cancer. Cancer Biol Ther. 2011;11(2):157–168.
- Huang JX, Manning BD. A complex interplay between Akt, TSC2 and the two mTOR complexes. Biochem Soc Trans. 2009;37(1):217–222.
- Zhu B, Zhou Y, Xu F, et al. Porcine circovirus type 2 induces autophagy via the AMPK/ERK/TSC2/mTOR signaling pathway in PK-15 cells. J Virol. 2012;86(22):12003–12012. DOI:10.1128/JVI.01434-12.
- Huang WR, Chiu H-C, Liao T-L, et al. Avian Reovirus Protein p17 Functions as a Nucleoporin Tpr Suppressor Leading to Activation of p53, p21 and PTEN and Inactivation of PI3K/AKT/mTOR and ERK Signaling Pathways (vol 10, e0133699, 2015). Plos One. 2015;10(9):e0133699. DOI:10.1371/journal.pone.0133699.
- Jung CH, Ro SH, Cao J, et al. mTOR regulation of autophagy. FEBS Lett. 2010;584(7):1287–1295. DOI:10.1016/j.febslet.2010.01.017.
- Gou H, Zhao M, Fan S, et al. Autophagy induces apoptosis and death of T lymphocytes in the spleen of pigs infected with CSFV. Scientific Reports. 2017;7(1):1–11. DOI:10.1038/s41598-017-14082-9.
- Martelli AM, Chiarini F, Evangelisti C, et al. The phosphatidylinositol 3-kinase/AKT/mammalian target of rapamycin signaling network and the control of normal myelopoiesis. Histol Histopathol. 2010;25(5):669–680. DOI:10.14670/HH-25.669.
- Chang H, Li X, Cai Q, et al. The PI3K/Akt/mTOR pathway is involved in CVB3-induced autophagy of HeLa cells. Int J Mol Med. 2017;40(1):182–192. DOI:10.3892/ijmm.2017.3008.
- Liang Q, Luo Z, Zeng J, et al. Zika Virus NS4A and NS4B Proteins Deregulate Akt-mTOR Signaling in Human Fetal Neural Stem Cells to Inhibit Neurogenesis and Induce Autophagy. Cell Stem Cell. 2016;19(5):663–671. DOI:10.1016/j.stem.2016.07.019.
- Zhang Q, Zhu H, Xu X, et al. Inactivated Sendai virus induces apoptosis and autophagy via the PI3K/Akt/mTOR/p70S6K pathway in human non-small cell lung cancer cells. Biochem Biophys Res Commun. 2015;465(1):64–70. DOI:10.1016/j.bbrc.2015.07.130.
- Hu B, Zhang Y, Jia L, et al. Binding of the pathogen receptor HSP90AA1 to avibirnavirus VP2 induces autophagy by inactivating the AKT-MTOR pathway. Autophagy. 2015;11(3):503–515. DOI:10.1080/15548627.2015.1017184.
- DeSilva DR, Jones EA, Favata MF, et al. Inhibition of mitogen-activated protein kinase kinase blocks T cell proliferation but does not induce or prevent anergy. J Immunol. 1998;160(9):4175–4181.
- Law BYK, Mok SWF, Chan WK, et al. Hernandezine, a novel AMPK activator induces autophagic cell death in drug-resistant cancers. Oncotarget. 2016;7(7):8090–8104. DOI:10.18632/oncotarget.6980.
- Ravikumar B, Sarkar S, Davies JE, et al. Regulation of Mammalian Autophagy in Physiology and Pathophysiology. Physiol Rev. 2010;90(4):1383–1435. DOI:10.1152/physrev.00030.2009.
- Pfisterer SG, Mauthe M, Codogno P, et al. Ca2+/calmodulin-dependent kinase (CaMK) signaling via CaMKI and AMP-activated protein kinase contributes to the regulation of WIPI-1 at the onset of autophagy. Molecul Pharmacol. 2011;80(6):1066–1075. DOI:10.1124/mol.111.071761.
- He L, Zhang Y-M, Lin Zh, et al. Classical swine fever virus NS5A protein localizes to endoplasmic reticulum and induces oxidative stress in vascular endothelial cells. Virus Genes. 2012;45(2):274–282. DOI:10.1007/s11262-012-0773-2.
- Chen Y, Xiao J, Xiao J, et al. Classical swine fever virus NS5A regulates viral RNA replication through binding to NS5B and 3′UTR. Virology. 2012;432(2):376–388. DOI:10.1016/j.virol.2012.04.014.
- Song S, Tan J, Miao Y, et al. Crosstalk of ER stress-mediated autophagy and ER-phagy: Involvement of UPR and the core autophagy machinery. J Cell Physiol. 2018;233(5):3867–3874. DOI:10.1002/jcp.26137.
- Kim J, Lee HW, Rhee DK, et al. Pneumolysin-induced autophagy contributes to inhibition of osteoblast differentiation through downregulation of Sp1 in human osteosarcoma cells. Biochim Biophys Acta-Gen Subj. 2017;1861(11):2663–2673. DOI:10.1016/j.bbagen.2017.07.008.
- Laplante M, Sabatini DM. mTOR Signaling in Growth Control and Disease. Cell. 2012;149(2):274–293.
- Zhou Y, Geng P, Liu Y, et al. Rotavirus-encoded virus-like small RNA triggers autophagy by targeting IGF1R via the PI3K/Akt/mTOR pathway. Biochimica Et Biophysica Acta-Molecular Basis Dis. 2018;1864(1):60–68. DOI:10.1016/j.bbadis.2017.09.028.
- Huang H, Kang R, Wang J, et al. Hepatitis C virus inhibits AKT-tuberous sclerosis complex (TSC), the mechanistic target of rapamycin (MTOR) pathway, through endoplasmic reticulum stress to induce autophagy. Autophagy. 2013;9(2):175–195. DOI:10.4161/auto.22791.
- Tamargo-Gomez I, Marino G. AMPK: Regulation of Metabolic Dynamics in the Context of Autophagy. Int J Mol Sci. 2018;19(12):3812. DOI:10.3390/ijms19123812.
- Zhai N, Wang H, Chen Y, et al. Taurine attenuates OTA-promoted PCV2 replication through blocking ROS-dependent autophagy via inhibiting AMPK/mTOR signaling pathway. Chem Biol Interact. 2018;296:220–228.
- Vingtdeux V, Giliberto L, Zhao H, et al. AMP-activated Protein Kinase Signaling Activation by Resveratrol Modulates Amyloid-beta Peptide Metabolism. J Biol Chem. 2010;285(12):9100–9113. DOI:10.1074/jbc.M109.060061.
- Sheng C, Kou S, Jiang Q, et al. Characterization of the C-terminal sequence of NS5A necessary for the assembly and production of classical swine fever virus infectious particles. Research in Veterinary Science. 2014;97(2):449–454. DOI:10.1016/j.rvsc.2014.07.017.
- Ling S, Luo M, Jiang S, et al. Cellular Hsp27 interacts with classical swine fever virus NS5A protein and negatively regulates viral replication by the NF-kappa B signaling pathway. Virology. 2018;518:202–209.
- Zhang C, Kang K, Ning P, et al. Heat shock protein 70 is associated with CSFV NS5A protein and enhances viral RNA replication. Virology. 2015;482:9–18.
- Takeshita F, Kobiyama K, Miyawaki A, et al. Non-canonical role of atg family members as suppressors of innate antiviral immune signaling. Autophagy. 2008;4(1):67–69. DOI:10.4161/auto.5055.
- Jounai N, Takeshita F, Kobiyama K, et al. The atg5 atg12 conjugate associates with innate antiviral immune responses. Proceedings of the National Academy of Sciences. 2007;104(35):14050–14055.DOI: doi:10.1073/pnas.0704014104.
- Ke P-Y, Chen SSL. Activation of the unfolded protein response and autophagy after hepatitis C virus infection suppresses innate antiviral immunity in vitro. J Clin Invest. 2011;121(1):37-56. DOI:10.1172/JCI41474DS1.
- Sun J, Desai MM, Soong L, et al. IFN alpha/beta and autophagy Tug-of-war between HCV and the host. Autophagy. 2011;7(11):1394–1396. DOI:10.4161/auto.7.11.17514.
- Huang X, Yue Y, Li D, et al. Antibody-dependent enhancement of dengue virus infection inhibits RLR-mediated Type-I IFN-independent signalling through upregulation of cellular autophagy. Scientific Reports. 2016;6(1):1–13. DOI:10.1038/srep22303.