
ABSTRACT
Macroautophagy/autophagy is an important catabolic process for maintaining cellular homeostasis by adapting to various stress conditions. Autophagy is mediated by a double-membrane autophagosome, which sequesters a portion of cytoplasmic components for delivery to the vacuole. Several autophagy-related (ATG) genes play crucial roles in autophagosome formation. The induction of ATG genes must be tightly regulated to maintain a proper autophagic activity, but their regulatory mechanisms are still largely unknown. Here, we report that the trehalose-6-phosphate phosphatase Tps2 functions as a positive regulator of autophagy in Saccharomyces cerevisiae. Cellular trehalose levels do not affect autophagy regulation by Tps2. Loss of Tps2 leads to impaired autophagic flux and reduced ATG8 expre/ssion under nitrogen starvation. In tps2Δ cells, Ume6 is predominantly dephosphorylated and represses ATG8 transcription by binding to its promoter region. Tps2 regulates nuclear translocation and activation of Rim15 kinase, a negative regulator of Ume6, by causing the dissociation of Rim15 from the 14-3-3 proteins Bmh1/2 under nitrogen starvation, suggesting that Rim15 mediates the function of Tps2 as a positive regulator of ATG8 induction. Furthermore, Tps2 plays a crucial role in the dephosphorylation of Ser1061 and Thr1075 residues of Rim15, which is important for controlling the dissociation of Rim15 from Bmh1/2 under nitrogen starvation. Together, our results reveal the role of Tps2 as a positive regulator of autophagy and provide new insight into the regulatory mechanisms of ATG gene expression.
Abbreviations: ATG: autophagy-related; ChIP: chromatin immunoprecipitation; Co-IP: co-immunoprecipitation; DAPI: 4ʹ,6-diamidino-2-phenylindole; GFP: green fluorescent protein; PKA: protein kinase A; PtdIns3K: phosphatidylinositol 3-kinase; Rim15KI: kinase-inactive Rim15; Rim15-2A: Rim15S1061A,T1075A; TEM: transmission electron microscopy; TORC1: target of rapamycin complex 1
Introduction
Macroautophagy (hereafter referred to as autophagy) is an evolutionally conserved catabolic process to maintain cellular homeostasis and adaptation during various stress conditions, including nutrient deprivation [Citation1,Citation2]. Several autophagy-related (ATG) proteins are involved in the formation of phagophores that sequester cytoplasmic components, including damaged organelles and protein aggregates, then mature into double-membrane autophagosomes that finally fuse with the lysosome (vacuole) for their degradation [Citation3]. Dysregulated autophagy is involved in various human pathologies such as neurodegenerative diseases, cancer, microbial infection, and metabolic diseases [Citation4]. Because too much or too little autophagy can lead to cell death, the autophagy process needs to be tightly controlled to maintain an appropriate level [Citation5–7]. In recent decades, yeast genetic studies have significantly advanced our knowledge about the molecular mechanisms of autophagy and identified more than 40 ATG genes involved in the multiple steps of the autophagy process. Most of these ATG genes are also conserved in higher eukaryotes [Citation8–10]. The expression of most ATG genes sharply increases under autophagy-inducing conditions [Citation11]. However, the transcriptional regulatory mechanisms of ATG genes are not well defined yet [Citation11,Citation12].
Atg8 is a ubiquitin-like protein required for autophagosome formation involving 18 ATG proteins [Citation13]. The expression levels of Atg8 are important for controlling the size of autophagosomes [Citation14]. In Saccharomyces cerevisiae, Ume6, Pho23, and Rph1 have been identified as transcriptional repressors of ATG genes and Msn2/4 as a transcriptional activator of ATG8 [Citation11,Citation12,Citation15,Citation16]. Particularly, Ume6, a subunit of the Rpd3 histone deacetylase complex, plays an essential role in the regulation of ATG8 expression. Rim15 kinase positively regulates the induction of ATG genes by inhibiting Ume6 and Rph1 through direct phosphorylation [Citation12,Citation15]. Rim15 functions as a controller of the nutrient regulatory signals, involving the G0 program (G1 cell cycle arrest, glycogen, and trehalose synthesis, and the induction of stress-responsive genes) [Citation17]. In response to cellular nutrient availability, Rim15 activity is regulated by protein kinase A (PKA), Sch9, target of rapamycin complex 1 (TORC1), and Pho80-Pho85 pathways. Under nutrient-rich conditions, Rim15 binds to the 14-3-3 proteins Bmh1/2 through TORC1-Sch9-mediated phosphorylation, and this interaction causes cytoplasmic retention and inactivation of Rim15. Under nutrient starvation conditions, TORC1 inactivation causes dephosphorylation of Ser1061 and Thr1075 residues in Rim15, leading to nuclear translocation and activation of Rim15 [Citation18–20].
Trehalose is a non-reducing disaccharide of α(1,1)-linked glucose. It is a highly stable molecule and present in many organisms, including bacteria, archaea, fungi, plants, insects, and other invertebrates [Citation21]. Trehalose plays a major role in cellular protection against various stress conditions and functions as a reserve carbohydrate as well [Citation22]. In yeast, trehalose synthesis is catalyzed by the trehalose-6-phosphate synthase Tps1 and the trehalose-6-phosphate phosphatase Tps2. When cells encounter stresses inducing trehalose synthesis, Tps1 synthesizes trehalose-6-phosphate from UDP-glucose, and Tps2 dephosphorylates trehalose-6-phosphate to yield trehalose [Citation23,Citation24]. Trehalose degradation depends on the neutral trehalase Nth1, which is controlled by PKA-dependent phosphorylation under nutrient-rich conditions [Citation25]. Over the past decades, trehalose has been known to be an autophagy enhancer mediating neuroprotection in animal models of various neurodegenerative diseases, such as Alzheimer and Parkinson diseases [Citation26–28]. However, the mechanism underlying the neuroprotective effect of trehalose is still unknown. Furthermore, a recent study suggests that trehalose interferes with autophagic flux from autophagosome to autolysosome [Citation29]. Given these, the effect of trehalose on autophagy is a controversial issue.
In this study, we report that the trehalose-6-phosphate phosphatase Tps2 is a positive regulator of autophagy in S. cerevisiae. Cellular trehalose levels do not affect autophagy regulation by Tps2. We find that loss of Tps2 results in the decrease of ATG8 expression and the reduction of autophagic body size under nitrogen starvation. In tps2Δ cells, Ume6 is predominantly dephosphorylated and represses ATG8 transcription by binding to the promoter region of ATG8. We also demonstrate that Tps2 plays an essential role in nuclear translocation and activation of Rim15, a negative regulator of Ume6, by causing the dissociation of Rim15 from the 14-3-3 proteins Bmh1/2 under nitrogen starvation. These results suggest that Rim15 mediates the function of Tps2 as a positive regulator of ATG8 induction. Furthermore, we show that Tps2 plays a crucial role in the dephosphorylation of Ser1061 and Thr1075 residues of Rim15, which is important for controlling the dissociation of Rim15 from Bmh1/2 under nitrogen starvation. Collectively, our findings reveal that Tps2 positively regulates autophagic activity by controlling ATG8 induction and enhances the cellular adaptation capacity to nitrogen starvation.
Results
Loss of the catalytic subunits of trehalose synthase, Tps1 and Tps2, impairs autophagic flux under nitrogen starvation
In S. cerevisiae, trehalose synthase is composed of four subunits: the trehalose-6-phosphate synthase Tps1, the trehalose-6-phosphate phosphatase Tps2, and two regulatory proteins, Tps3 and Tsl1. To investigate the relevance between the subunits of trehalose synthase and autophagy, we examined the autophagic activity of tps1Δ, tps2Δ, tps3Δ, and tsl1Δ cells using the Pho8Δ60 assay, a sensitive method to measure bulk autophagy [Citation30]. We also measured the autophagic activity of cells lacking the yeast phosphatidylinositol 3-kinase (PtdIns3 K) Vps34, which is known to be a crucial regulator of autophagosome formation [Citation31]. As expected, loss of Vps34 caused a severe defect in autophagy under nitrogen starvation (). Interestingly, the deletion of TPS1 and TPS2 encoding the catalytic subunits of trehalose synthase also resulted in a significant defect of autophagy under nitrogen starvation. To verify this result, we also used the green fluorescent protein (GFP)-Atg8 processing assay. When autophagy occurs, GFP-Atg8 is linked to the inner membrane of the autophagosome and delivered into the vacuole for degradation. In the vacuole, the GFP moiety is more resistant to proteolysis than Atg8. Thus, the measurement of free GFP processed from GFP-Atg8 reflects the level of autophagic activity [Citation32]. Consistent with the result of the pho8Δ60 assay, the processing of GFP-Atg8 was considerably reduced in tps1Δ and tps2Δ cells compared to wild-type cells ().
Figure 1. The catalytic subunits of trehalose synthase, Tps1 and Tps2, positively regulate autophagic flux under nitrogen starvation. (A) Wild-type (WT) (YTS159), vps34Δ (BK0001), tps1Δ (BK0002), tps2Δ (BK0003), tps3Δ (BK0004), and tsl1Δ (BK0005) cells were grown to early log phase in SC medium (SD-N 0 h) and incubated in SD-N medium for 6 h. Pho8Δ60 alkaline phosphatase activity of each sample was measured as described in Materials and methods. (B) WT (BK0006), vps34Δ (BK0007), tps1Δ (BK0008), tps2Δ (BK0009), tps3Δ (BK0010), and tsl1Δ (BK0011) cells expressing GFP-Atg8 were grown to early log phase in SC medium (SD-N 0 h) and incubated in SD-N medium for 6 h. GFP-Atg8 processing was analyzed by immunoblotting using an anti-GFP antibody. Hxk2 was used as a loading control. Data are representative of at least three independent experiments. (C) Quantification of autophagic activity at 6 h of nitrogen starvation is represented as a percentage of the ratio of GFP to GFP-Atg8 and normalized against that of WT cells, which was set to 100%. (D) WT (BK0012), atg32Δ (BK0013), tps1Δ (BK0014), tps2Δ (BK0015), tps3Δ (BK0016), and tsl1Δ (BK0017) cells expressing Om45-GFP were grown to early log phase in SC medium (SD-N 0 h) and incubated in SD-N medium for 12 h. Om45-GFP degradation was analyzed by immunoblotting using an anti-GFP antibody. Hxk2 was used as a loading control. Data are representative of at least three independent experiments. (E) Quantification of mitophagic activity at 12 h of nitrogen starvation is represented as a percentage of the ratio of GFP to Om45-GFP and normalized against that of WT cells, which was set to 100%. (F) WT (BK0018), atg36Δ (BK0019), tps1Δ (BK0020), tps2Δ (BK0021), tps3Δ (BK0022), and tsl1Δ (BK0023) cells expressing Pex11-GFP were grown to early log phase in SC medium (SD-N 0 h) and incubated in SD-N medium for 12 h. Pex11-GFP degradation was analyzed by immunoblotting using an anti-GFP antibody. Hxk2 was used as a loading control. Data are representative of at least three independent experiments. (G) Quantification of pexophagic activity at 12 h of nitrogen starvation is represented as a percentage of the ratio of GFP to Pex11-GFP and normalized against that of WT cells, which was set to 100%. (A, C, E, and G) Values are the mean of three independent experiments and the error bars indicate the standard deviation. P-values were determined by two-tailed Student’s t-test (***P < 0.001, **P < 0.01, *P < 0.05)
To further examine the role of Tps1 and Tps2 in selective autophagy processes, we monitored the processing of GFP-tagged substrates known to be eliminated by mitophagy (Om45-GFP) and pexophagy (Pex11-GFP). Om45 and Pex11 are integral membrane proteins in the mitochondrion and the peroxisome, respectively. The induction of selective autophagy results in the delivery of each organelle into the vacuole and degradation of GFP-tagged substrates. Because the GFP moiety is more stable than Om45 or Pex11, the measurement of free GFP processed from Om45-GFP and Pex11-GFP reflects the level of mitophagy and pexophagy, respectively [Citation33,Citation34]. Selective autophagy is mediated by the interaction between cargo receptors and autophagic receptor proteins. Atg32 and Atg36 are specific cargo receptors of mitophagy and pexophagy, respectively [Citation35,Citation36]. As expected, we observed that atg32Δ cells were defective in mitophagy under nitrogen starvation (). The processing of Om45-GFP was also significantly reduced in tps1Δ and tps2Δ cells. Furthermore, like atg36Δ cells, tps1Δ and tps2Δ cells exhibited a severe defect in pexophagy under nitrogen starvation (). Together, these results suggest that the catalytic subunits of trehalose synthase, Tps1 and Tps2, positively regulate both specific and nonspecific autophagy processes under nitrogen starvation.
Cellular trehalose levels do not affect autophagic flux under nitrogen starvation
It has been reported that trehalose has neuroprotective effects by reducing protein aggregates through autophagy activation [Citation26–28]. In contrast, a recent study reported that trehalose interferes with autophagy [Citation29]. The effect of trehalose on autophagy is still controversial and needs further investigation. Because Tps1 and Tps2 are the catalytic subunits of trehalose synthase, tps1Δ and tps2Δ cells exhibited complete or significant loss of trehalose (Fig. S1). We wondered whether impaired autophagy in tps1Δ and tps2Δ cells might be due to the decrease in cellular trehalose levels. To check this possibility, we first monitored the effect of the neutral trehalase Nth1 on intracellular trehalose levels. We observed that loss of Nth1 significantly increased intracellular trehalose levels under both normal and nitrogen starvation conditions (). We examined whether increased intracellular trehalose levels could enhance the autophagic activity of nth1Δ cells using the Pho8Δ60 assay. nth1Δ cells exhibited a slight increase in autophagic activity during early nitrogen starvation but did not show any difference in autophagic activity under prolonged nitrogen starvation compared to wild-type cells (). The GFP-Atg8 processing assay also showed that the autophagic flux of nth1Δ cells was similar to that of wild-type cells under both conditions (). Next, we examined whether the supplementation of trehalose could affect autophagic flux under nitrogen starvation using the CEN.PK strain, which is known to constitutively express the disaccharide transporter Mal11/Agt1 [Citation37]. As shown in Fig. S2, the supplementation of trehalose further increased intracellular trehalose levels in both wild-type and tps2Δ cells under nitrogen starvation condition. However, elevated trehalose levels did not increase the autophagic activity of wild-type and tps2Δ cells (). Together, these results suggest that trehalose is not directly involved in the regulation of autophagy in yeast, and thus trehalose synthesis function of Tps1 and Tps2 is not related to their roles in autophagy.
Figure 2. Tps1 and Tps2, not trehalose, play an important role in autophagy regulation under nitrogen starvation. (A) WT (BY4741) and nth1Δ (BK0028) cells were grown to early log phase in SC medium (SD-N 0 h) and incubated in SD-N medium for the indicated hours. Trehalose content of each sample was measured as described in Materials and methods. (B) WT (YTS159) and nth1Δ (BK0029) cells were grown to early log phase in SC medium (SD-N 0 h) and incubated in SD-N medium for the indicated hours. Pho8Δ60 alkaline phosphatase activity of each sample was measured as described in Materials and methods. (C) WT (BK0006) and nth1Δ (BK0030) cells were grown to early log phase in SC medium (SD-N 0 h) and incubated in SD-N medium for the indicated hours. GFP-Atg8 processing was analyzed by immunoblotting using an anti-GFP antibody as described in Materials and methods. Hxk2 was used as a loading control. Data are representative of at least three independent experiments. (D) Quantification of autophagic activity for the indicated hours of nitrogen starvation is represented as a percentage of the ratio of GFP to GFP-Atg8 and normalized against that of WT cells after 6 h of nitrogen starvation, which was set to 100%. (E) WT (BK0032) and tps2Δ (BK0033) cells expressing GFP-Atg8 were grown to early log phase in SC medium (SD-N 0 h) and incubated in SD-N medium for 2 h. For trehalose supplementation, cells were grown to early log phase in SC medium and incubated in SD-N medium containing 2% trehalose for 2 h. GFP-Atg8 processing was analyzed by immunoblotting using an anti-GFP antibody. Hxk2 was used as a loading control. Data are representative of at least three independent experiments. (F) Quantification of autophagic activity at 2 h of nitrogen starvation with or without 2% trehalose is represented as a percentage of the ratio of GFP to GFP-Atg8 and normalized against that of WT cells after 2 h of nitrogen starvation, which was set to 100%. (G) WT (BK0006), vps34Δ (BK0007), tps1Δ (BK0008), and tps2Δ (BK0009) cells expressing GFP-Atg8 were grown to early log phase in SCgal medium (Sgal-N 0 h) and incubated in Sgal-N medium for 3 h. GFP-Atg8 processing was analyzed by immunoblotting using an anti-GFP antibody. Hxk2 was used as a loading control. Data are representative of at least three independent experiments. (H) Quantification of autophagic activity after 3 h incubation in Sgal-N medium is represented as a percentage of the ratio of GFP to GFP-Atg8 and normalized against that of WT cells, which was set to 100%. (A, B, D, F, and H) Values are the mean of three independent experiments and the error bars indicate the standard deviation. P-values were determined by two-tailed Student’s t-test (***P < 0.001, **P < 0.01, *P < 0.05, N.S (not significant) > 0.05)
Recently, it has been reported that, in tps1Δ cells, hyper-activation of hexokinase induces an uncontrolled influx of glucose during glycolysis, which leads to hyper-activation of RAS signaling and causes apoptosis in glucose-containing medium [Citation38]. Because we used glucose as a carbon source in the nitrogen starvation medium, we wondered whether the autophagy defect in tps1Δ and tps2Δ cells might be related to hyper-activation of hexokinase. To check this possibility, we measured the autophagic activity of tps1Δ and tps2Δ cells when galactose was used as a carbon source in the nitrogen starvation medium. Because galactose is metabolized by galactokinase rather than hexokinase for production of glucose-6-phosphate, which is an entry point of carbohydrates in glycolysis, tps1Δ cells show normal glycolysis in galactose-containing medium [Citation38]. Interestingly, tps1Δ cells showed autophagic flux comparable to that of wild-type cells, while tps2Δ cells still exhibited impaired autophagic flux in nitrogen starvation medium containing galactose (). This result suggests that the autophagy defect in tps1Δ cells, but not tps2Δ cells, in glucose-containing nitrogen starvation medium is closely related to hyper-activation of hexokinase. Given that tps1Δ cells exhibited complete loss of trehalose (Fig. S1), this result also supports our notion that trehalose is not a direct autophagy inducer in yeast.
Tps2 is a positive regulator of ATG8 induction
Recently, Klionsky and colleagues have studied transcriptional regulation of ATG genes and demonstrated that the levels of Atg8, which is regulated by Ume6 transcriptional repressor, control the size of the autophagic body and the levels of Atg9, which is regulated by Pho23, control its number [Citation11,Citation15]. To further investigate the roles of Tps1 and Tps2 in autophagy regulation, we examined the protein levels of Atg8 in tps1Δ and tps2Δ cells under nitrogen starvation. We also deleted the PEP4 gene encoding the vacuolar protease, which is required for autophagic body degradation in the vacuole [Citation39]. However, we found that the deletion of PEP4 did not completely block GFP-Atg8 vacuolar degradation under nitrogen starvation (). Thus, to accurately assess the Atg8 expression levels, we measured the levels of total GFP (GFP-Atg8 and free GFP). We observed that the protein levels of Atg8 were significantly reduced in tps2Δ cells compared to wild-type cells under nitrogen starvation (). Consistent with the above results suggesting that intracellular trehalose levels do not affect autophagy, the protein levels of Atg8 did not exhibit a significant change in tps1Δ and nth1Δ cells compared to wild-type cells. Interestingly, the expression levels of Atg8 in tps2Δ cells were even lower than those of control rim15Δ cells, which lacks Rim15 kinase that positively regulates the induction of ATG genes by inhibiting Ume6 and Rph1 through direct phosphorylation [Citation12,Citation15]. The mRNA levels of ATG8 were also significantly decreased in tps2Δ cells compared to wild-type cells under nitrogen starvation (), suggesting that the decrease in Atg8 protein levels in tps2Δ cells is due to a reduction in ATG8 transcription. We next tested whether Tps2 could control the induction of other ATG genes. Among six genes tested, five (ATG7, ATG8, ATG9, ATG14, and ATG29) showed significantly reduced transcription in tps2Δ cells compared to wild-type cells under nitrogen starvation (), while Tps2 did not affect the induction of these genes under normal condition (Fig. S3). This result suggests that Tps2 is a positive regulator of transcription of multiple ATG genes under nitrogen starvation.
Figure 3. Tps2 positively regulates ATG8 induction under nitrogen starvation. (A) pep4Δ (BK0034), pep4Δ rim15Δ (BK0035), pep4Δ tps1Δ (BK0036), pep4Δ tps2Δ (BK0037), and pep4Δ nth1Δ (BK0038) cells expressing GFP-Atg8 were grown to early log phase in YPD medium (SD-N 0 h) and incubated in SD-N medium for 2 h. Protein extracts were analyzed by immunoblotting using an anti-GFP antibody as described in Materials and methods. Hxk2 was used as a loading control. Data are representative of at least three independent experiments. (B) Quantification of Atg8 expression levels at 2 h of nitrogen starvation is represented as a percentage of the ratio of total GFP levels (Sum of GFP-Atg8 and free GFP) to Hxk2 and normalized against that of WT cells, which was set to 100%. (C) WT (BY4741), rim15Δ (BK0039), tps1Δ (BK0024), tps2Δ (BK0025), and nth1Δ (BK0028) cells were grown to early log phase in SC medium (SD-N 0 h) and incubated in SD-N medium for 2 h. ATG8 mRNA levels were quantified by quantitative real-time PCR as described in Materials and methods. ATG8 mRNA levels were normalized against that of WT cells under normal condition (SD-N 0 h), which was set to 1. (D) WT (BY4741), rim15Δ (BK0039), tps2Δ (BK0025), and nth1Δ (BK0028) cells were grown to early log phase in SC medium and incubated in SD-N medium for 2 h. The mRNA levels of each ATG gene were normalized against those of the corresponding gene in WT cells under normal condition, which was set to 1. (E) Representative TEM images of WT (BK0040) (left panel) and tps2Δ (BK0041) cells (right panel), which were grown to early log phase in SC medium and incubated in SD-N medium for 2 h. Scale bar: 500 nm. (F) The estimated mean radii (in nm) of autophagic bodies in WT and tps2Δ cells after 2 h of nitrogen starvation. 100 cells were analyzed per strain. (G) The estimated average number of autophagic bodies in WT and tps2Δ cells after 2 h of nitrogen starvation. Estimation was based on the number of autophagic body cross-sections observed by TEM. 100 cells were analyzed per strain. (B, C, and D) Values are the mean of three independent experiments and the error bars indicate the standard deviation. P-values were determined by two-tailed Student’s t-test (***P < 0.001, **P < 0.01, *P < 0.05). (F and G) The error bars indicate the standard deviation. P-values were determined by two-tailed Student’s t-test (***P < 0.001, **P < 0.01, *P < 0.05)
To gain a further insight into the role of Tps2 in autophagy, we analyzed autophagic body accumulation in tps2Δ cells using transmission electron microscopy (TEM). For TEM analysis, we deleted both PEP4 and VPS4 genes to effectively distinguish the autophagic bodies within the vacuole in wild-type and tps2Δ cells [Citation40]. Under nitrogen starvation, tps2Δ cells showed a significant reduction in the size of autophagic body compared to wild-type cells (). In contrast, there was no significant difference in the average number of autophagic bodies between wild-type and tps2Δ cells (). Together, these results suggest that Tps2 positively regulates the expression of several ATG genes including ATG8 and is involved in the control of autophagic body size.
Tps2 acts upstream of Ume6 to regulate ATG8 induction under nitrogen starvation
It has been reported that the induction of ATG8 requires Rim15 activation to mediate phosphorylation of Ume6, a transcriptional repressor of ATG8 [Citation15]. We checked whether Tps2 might be related to Rim15-dependent Ume6 phosphorylation under nitrogen starvation. As expected, phosphorylation of Ume6 was elevated in wild-type cells, but not in rim15Δ cells under nitrogen starvation (). Similar to rim15Δ cells, tps2Δ cells did not show an increase in Ume6 phosphorylation under nitrogen starvation, suggesting that Tps2 plays a role in Rim15-dependent Ume6 phosphorylation. Given that phosphorylation of Ume6 decreases its binding affinity to the ATG8 promoter region [Citation15], we next examined the effect of Tps2 on the binding of Ume6 to the ATG8 promoter region using the chromatin immunoprecipitation (ChIP) assay. Remarkably, Ume6 bound highly to the ATG8 promoter region in tps2Δ cells under nitrogen starvation (). Enhanced binding of Ume6 to the ATG8 promoter region in tps2Δ cells was comparable to that in rim15Δ cells. Furthermore, we found that the deletion of UME6 in tps2Δ cells rescued the reduction in ATG8 expression () and led to the recovery of autophagic activity under nitrogen starvation (). Together, these results suggest that Tps2 acts upstream of Ume6 to promote ATG8 induction and autophagy activation by facilitating Ume6 phosphorylation mediated by Rim15 under nitrogen starvation.
Figure 4. Tps2 positively regulates Ume6 phosphorylation, which is essential for proper induction of ATG8 and autophagy activation upon nitrogen starvation. (A) WT (BK0042), rim15Δ (BK0043), tps2Δ (BK0044), and nth1Δ (BK0045) cells expressing Ume6-TAP were grown to early log phase in SC medium (SD-N 0 h) and incubated in SD-N medium for 2 h. Protein extracts were analyzed by immunoblotting as described in Materials and methods with an anti-IgG antibody. Hxk2 was used as a loading control. Data are representative of at least three independent experiments. (B) WT (BK0042), rim15Δ (BK0043), and tps2Δ (BK0044) cells expressing Ume6-TAP were grown to early log phase in SC medium (SD-N 0 h) and incubated in SD-N medium for 2 h. The association of Ume6 with the ATG8 promoter region was measured using ChIP assay as described in Materials and methods. Fold enrichment level of each strain was normalized against that of WT cells, which was set to 1. (C) WT (BY4741), ume6Δ (BK0046), tps2Δ (BK0025), and ume6Δ tps2Δ (BK0047) cells were grown to early log phase in SC medium (SD-N 0 h) and incubated in SD-N medium for 2 h. ATG8 mRNA levels were quantified by quantitative real-time PCR as described in Materials and methods. ATG8 mRNA levels were normalized against that of WT cells under normal condition (SD-N 0 h), which was set to 1. (D) WT (YTS159), vps34Δ (BK0001), rim15Δ (BK0048), ume6Δ (BK0049), tps2Δ (BK0003), and ume6Δ tps2Δ (BK0050) cells were grown to early log phase in SC medium (SD-N 0 h) and incubated in SD-N medium for 6 h. Pho8Δ60 alkaline phosphatase activity of each sample was measured as described in Materials and methods. (B to D) Values are the mean of three independent experiments and the error bars indicate the standard deviation. P-values were determined by two-tailed Student’s t-test (***P < 0.001, **P < 0.01, *P < 0.05)
Rim15 is also known to positively regulate the induction of the ATG7 gene by inhibiting Rph1 through direct phosphorylation. We observed that phosphorylation of Rph1 was not elevated in tps2Δ cells under nitrogen starvation, similar to rim15Δ cells (Fig. S4A). In addition, the deletion of RPH1 in tps2Δ cells partially rescued the reduction in ATG7 transcription levels under nitrogen starvation (Fig. S4B). These results further support that Tps2 functions as a positive regulator of ATG genes whose induction is mediated by Rim15 under nitrogen starvation.
Tps2 is required for Rim15 activation by regulating its nuclear translocation
Diverse stress conditions, including nutrient starvation, heat shock, and oxidative stress, trigger the activation of Rim15 by its nuclear translocation [Citation18]. Nuclear-localized active Rim15 induces the expression of stress-responsive genes, such as HSP12 and SSA3, through the activation of Msn2/4 and Gis1 transcription factors [Citation41]. To investigate whether Tps2 could regulate the Rim15-mediated regulatory pathway, we examined the expression of HSP12 and SSA3 genes in tps2Δ cells under nitrogen starvation. Consistent with a previous report [Citation41], rim15Δ cells exhibited a complete or significant reduction in HSP12 and SSA3 mRNA levels under nitrogen starvation (). Notably, transcriptional activation of HSP12 and SSA3 under nitrogen starvation was also significantly decreased in tps2Δ cells. We could not observe a significant difference in the expression of HSP12 and SSA3 between wild-type cells and nth1Δ cells with elevated intracellular trehalose levels. These results suggest that Tps2 plays a role in Rim15-dependent expression of stress-responsive genes under nitrogen starvation.
Figure 5. Tps2 regulates nitrogen starvation-induced nuclear localization and activation of Rim15. (A and B) WT (BY4741), rim15Δ (BK0039), tps2Δ (BK0025), and nth1Δ (BK0028) cells were grown to early log phase in SC medium (SD-N 0 h) and incubated in SD-N medium for 2 h. (A) HSP12 mRNA levels were quantified by quantitative real-time PCR and normalized against that of WT cells under normal condition (SD-N 0 h), which was set to 1. (B) SSA3 mRNA levels were quantified by quantitative real-time PCR and normalized against that of WT cells under normal condition (SD-N 0 h), which was set to 1. (C) WT (BK0057), rim15Δ (BK0058), tps2Δ (BK0059), and nth1Δ (BK0060) cells expressing Msn2-GFP were grown to early log phase in SC medium and incubated in SD-N medium (-N) for 2 h. Msn2-GFP fluorescence signals were visualized by fluorescence microscopy. DNA was stained with 4ʹ,6-diamidino-2-phenylindole (DAPI). Scale bars: 4 μm. (D) Quantification of nuclear-localized Msn2 in cells shown in (C). At least 200 cells were counted for each measurement. (E) WT (BK0061), tps2Δ (BK0062), and nth1Δ (BK0063) cells expressing GFP-Rim15 were grown to early log phase in SC medium (SD-N 0 h) and incubated in SD-N medium for 2 h. Protein extracts were analyzed by immunoblotting as described in Materials and methods with an anti-GFP antibody. Hxk2 was used as a loading control. Data are representative of at least three independent experiments. (F) sch9Δ (BK0064), sch9Δ tps2Δ (BK0065), ras2Δ (BK0066), ras2Δ tps2Δ (BK0067), ras2Δ sch9Δ (BK0068), and ras2Δ sch9Δ tps2Δ (BK0069) cells expressing GFP-Rim15KI were grown to early log phase in SC-H medium (+N) and incubated in SD-N medium (-N) for 2 h. GFP-Rim15 fluorescence signals were visualized by fluorescence microscopy. DNA was stained with DAPI. Scale bars: 4 μm. (G) Quantification of nuclear-localized Rim15 in cells shown in (F). At least 200 cells were counted for each measurement. (A, B, D, and G) Values are the mean of three independent experiments and the error bars indicate the standard deviation. P-values were determined by two-tailed Student’s t-test (***P < 0.001, **P < 0.01, *P < 0.05)
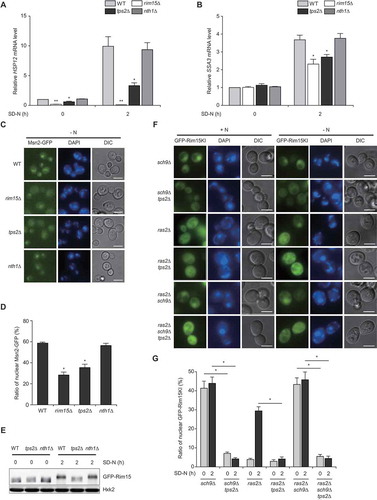
It is known that nuclear localization of a stress-responsive transcription factor Msn2/4 is regulated by PKA and Rim15-dependent phosphorylation [Citation42–44]. We next examined the effect of Tps2 on nuclear translocation of Msn2 under nitrogen starvation. We observed that both rim15Δ and tps2Δ cells exhibited a significant reduction in nuclear translocation of Msn2 under nitrogen starvation (). This result suggests that Tps2 also plays a role in the Rim15-dependent nuclear translocation of Msn2.
The above results raised the possibility that Rim15 activation might require Tps2 under nitrogen starvation. To check this, we examined the phosphorylation status of Rim15 using western blotting. A previous study reported that nuclear-localized active Rim15 shows hyperphosphorylation mediated by the autophosphorylation process [Citation18]. Indeed, we observed that Rim15 phosphorylation levels were highly elevated in wild-type cells but not in tps2Δ cells under nitrogen starvation (). Lambda phosphatase treatment of Rim15 abolished the change in Rim15 mobility (Fig. S5), demonstrating that the upshifted bands are phosphorylated forms of Rim15. This result suggests that Tps2 is required for the activation of Rim15 under nitrogen starvation.
Given that the nuclear localization of Rim15 is important for its activation, we next examined whether Tps2 could regulate the translocation of Rim15 to the nucleus under nitrogen starvation. Because the kinase-active form of Rim15 is efficiently exported from the nucleus [Citation19], we monitored the distribution of GFP-tagged kinase-inactive Rim15 (Rim15KI). Previously, it has been reported that TORC1 inactivation by rapamycin treatment or glucose starvation triggers the nuclear localization of Rim15 [Citation19,Citation20]. However, we could not observe the nuclear accumulation of GFP-Rim15KI under rapamycin treatment or nitrogen starvation (data not shown). Instead, we observed nuclear accumulation of GFP-Rim15KI in sch9Δ cells under both normal and nitrogen starvation conditions (), consistent with a previous report that TORC1-dependent cytoplasmic retention of Rim15 requires Sch9, which directly phosphorylates Ser1061 of Rim15 [Citation20]. Remarkably, loss of Tps2 abolished nuclear accumulation of GFP-Rim15KI in sch9Δ cells, suggesting that Tps2 is involved in the nuclear translocation of Rim15. It is known that PKA inhibits Rim15 activation by direct phosphorylation, but does not control nuclear translocation of Rim15 [Citation18]. In agreement with this previous report, we observed that ras2Δ cells, which are defective in PKA signaling, showed cytoplasmic retention of GFP-Rim15KI under normal conditions. Interestingly, however, nitrogen starvation still induced nuclear translocation of GFP-Rim15KI in ras2Δ cells, and the deletion of TPS2 abolished this nuclear accumulation of GFP-Rim15KI. We could not observe a significant difference in nuclear accumulation of GFP-Rim15KI in ras2Δ sch9Δ cells compared to sch9Δ cells under both normal and nitrogen starvation conditions, indicating that there is no synergistic effect between Sch9 and PKA signalings on nuclear translocation of Rim15. Loss of Tps2 abolished nuclear accumulation of GFP-Rim15KI even in ras2Δ sch9Δ cells. We also examined the effects of Sch9 and PKA signalings on the induction of Rim15 target genes, i.e., ATG8, HSP12, and SSA3. We observed that Rim15 target genes were considerably upregulated in ras2Δ and sch9Δ cells under both normal and nitrogen starvation conditions, but the deletion of TPS2 completely abolished the upregulation of Rim15 target genes (Fig. S6A and S6B). Together, these results suggest that Tps2 plays a crucial role in the nuclear translocation of Rim15 and its activation under nitrogen starvation.
Tps2 mediates the dissociation of Rim15 from Bmh1/2 under nitrogen starvation
The association of Rim15 with the 14-3-3 proteins Bmh1/2 causes cytoplasmic retention and inactivation of Rim15. Under nutrient starvation conditions, the dephosphorylation of Rim15 due to TORC1 inactivation brings about dissociation between Rim15 and Bmh1/2, leading to nuclear translocation and activation of Rim15 [Citation18–20]. Given the above results that loss of Tps2 abolishes nuclear accumulation of Rim15, we predicted that Rim15 might remain associated with Bmh1/2 in tps2Δ cells under nitrogen starvation. To check this, we performed the co-immunoprecipitation (Co-IP) assay using MYC-tagged Bmh1/2 and GFP-tagged Rim15. Consistent with a previous report [Citation19], Rim15 physically interacted with Bmh1/2 under normal condition but was dissociated from Bmh1/2 under nitrogen starvation (). However, in tps2Δ cells, the interaction between Rim15 and Bmh1/2 was still maintained under nitrogen starvation (). These results suggest that Tps2 plays an essential role in the dissociation of Rim15 from Bmh1/2 in response to nitrogen starvation.
Figure 6. Tps2 is required for the dissociation of Rim15 from the 14-3-3 proteins Bmh1/2 under nitrogen starvation. (A) WT cells expressing GFP-Rim15 and Bmh1-MYC (BK0081) or Bmh2-MYC (BK0082) were grown to early log phase in SC medium (+N) and incubated in SD-N medium (-N) for 1 h. (B) tps2Δ cells expressing GFP-Rim15 and Bmh1-MYC (BK0083) or Bmh2-MYC (BK0084) were grown to early log phase in SC medium (+N) and incubated in SD-N medium (-N) for 1 h. Co-IP assay was performed as described in Materials and methods. Data are representative of at least three independent experiments. The ratio of GFP-Rim15 co-precipitated with MYC-tagged proteins is shown below each lane
Given that TORC1 activity is crucial for phosphorylation of Rim15 and interaction between Rim15 and Bmh1/2 [Citation18–20], we next examined the effect of Tps2 on TORC1 activity by monitoring the phosphorylation status of Sch9 and Atg13, which are direct substrates of TORC1. However, we could not observe a significant difference in the phosphorylation status of Sch9 and Atg13 between wild-type and tps2Δ cells under both normal and nitrogen starvation conditions (Fig. S7A and S7B). This result suggests that Tps2 does not affect TORC1 activity. It seems that the role of Tps2 in the interaction between Rim15 and Bmh1/2 is mediated by direct regulation of Rim15 rather than by altering the TORC1 activity.
Tps2 is involved in the dephosphorylation of Rim15 under nitrogen starvation
It is known that nutrient starvation causes dephosphorylation of Ser1061 and Thr1075 of Rim15, leading to nuclear translocation and activation of Rim15 [Citation18–20]. To investigate whether Tps2 is involved in the dephosphorylation of Ser1061 and Thr1075 of Rim15, we examined the effect of Tps2 on dephosphorylation of these residues by mass spectrometry. Under nitrogen starvation, while phosphorylation of Ser1061 and Thr1075 was hardly detected, if any, in wild-type cells (Fig. S8A and S8B), phosphorylation of these residues remained detectable in tps2Δ cells (Fig. S8C and S8D). This result suggests that Tps2 is involved in the dephosphorylation of these residues of Rim15 under nitrogen starvation in vivo. Given that dephosphorylation of Ser1061 and Thr1075 of Rim15 is required for the dissociation of Rim15 from Bmh1/2 [Citation19,Citation20], we next examined the effect of alanine substitution of these residues on the interaction between Rim15 and Bmh1/2 in tps2Δ cells. Consistent with the above results, we observed that alanine substitution of Ser1061 and Thr1075 of Rim15 abolished its interaction with Bmh1/2 in tps2Δ cells under both nutrient-rich and nitrogen starvation conditions (). Together, these results suggest that Tps2 plays an important role in the regulation of Rim15 activity by controlling the dephosphorylation of Ser1061 and Thr1075 of Rim15 under nitrogen starvation ().
Figure 7. Dephosphorylation of Ser1061 and Thr1075 of Rim15 abolishes its interaction with Bmh1/2 in tps2Δ cells. (A) tps2Δ cells expressing Bmh1-MYC and GFP-Rim15 (BK0085) or GFP-Rim15S1061A,T1075A (Rim15-2A) (BK0086) were grown to early log phase in SC-H medium (+N) and incubated in SD-N medium (-N) for 1 h. (B) tps2Δ cells expressing Bmh2-MYC and GFP-Rim15 (BK0087) or GFP-Rim15-2A (BK0088) were grown to early log phase in SC-H medium (+N) and incubated in SD-N medium (-N) for 1 h. Co-IP assay was performed as described in Materials and methods. Data are representative of at least three independent experiments. The ratio of GFP-Rim15 or GFP-Rim15-2A co-precipitated with MYC-tagged proteins is shown below each lane
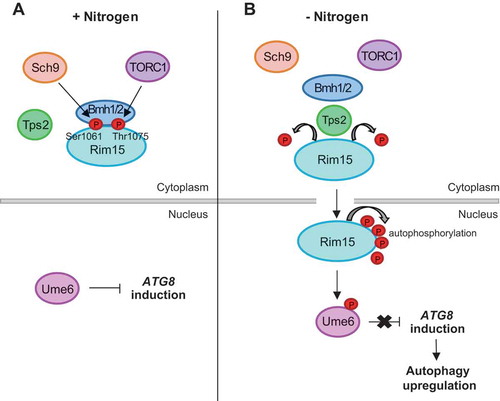
Figure 8. A model for the regulation of Atg8 expression by Tps2. (A) Under nutrient-rich condition, TORC1 and Sch9 promote cytoplasmic retention of Rim15 by mediating phosphorylation of Ser1061 and Thr1075 residues of Rim15 and thereby leading to its interaction with the 14-3-3 proteins Bmh1/2. Ume6 is predominantly dephosphorylated and inhibits ATG8 induction. (B) Under nitrogen starvation condition, TORC1 and Sch9 are inactivated and Tps2-depedent dephosphorylation of Ser1061 and Thr1075 of Rim15 leads to the dissociation of Rim15 from Bmh1/2. Rim15 translocates from the cytoplasm to the nucleus and inhibits Ume6 by phosphorylation. Inhibition of Ume6 leads to ATG8 induction and thereby autophagy upregulation
Discussion
In this study, we have demonstrated that the trehalose-6-phosphate phosphatase Tps2 is a positive regulator of autophagy in S. cerevisiae. Given that Tps2 is one of the catalytic subunits of trehalose synthase and tps2Δ cells exhibit a significant reduction in cellular trehalose levels under nitrogen starvation (Fig. S1), it is reasonable to assume that trehalose may actually regulate autophagy. However, we provide several pieces of evidence that cellular trehalose levels do not affect autophagic flux under nitrogen starvation. First, nth1Δ cells with increased intracellular trehalose levels showed similar autophagic activity to that of wild-type cells under nitrogen starvation (). Second, the supplementation of 2% trehalose did not increase the autophagic activity of tps2Δ cells (). Third, the autophagy defect in tps1Δ cells, which exhibit complete loss of trehalose, was rescued when galactose was used as a carbon source in the nitrogen starvation medium (). Together, we conclude that the trehalose synthesis function of Tps2 is not related to its role in autophagy. Although we could not find any evidence that trehalose regulates autophagy in S. cerevisiae, some previous studies reported the controversial effects of trehalose on autophagy in neuronal systems [Citation26–29]. It would be interesting to investigate whether trehalose affects autophagy in other organisms.
We observed that Tps1 also positively regulates autophagy flux under nitrogen starvation (). However, unlike Tps2, Tps1 does not seem to be involved in the regulation of Atg8 expression. In tps1Δ cells, hyper-activation of hexokinase induces an uncontrolled influx of glucose during glycolysis, which leads to hyper-activation of RAS signaling [Citation38]. Several studies have also shown that constitutive activation of the RAS/cAMP pathway prevents TORC1 inactivation-induced autophagy [Citation45,Citation46]. Together, it is likely that loss of Tps1 causes hyper-activation of hexokinase, leading to hyper-activation of the RAS/cAMP pathway, and thereby suppresses autophagy induction in glucose-containing nitrogen starvation medium.
Upon autophagy induction, Atg8 proteins play critical roles in the expansion and maturation of autophagosomes. Our results show that the average diameter of the autophagic body was ~23% reduced in tps2Δ cells compared to wild-type cells under nitrogen starvation (). We estimate that the volume of autophagic bodies in tps2Δ cells is ~50% smaller than that in wild-type cells under nitrogen starvation. In tps2Δ cells, the degree of volume reduction of autophagic bodies is comparable to the reduction in autophagic activity () and ATG8 expression (). These results suggest that the reduction in ATG8 expression mainly causes the autophagy defect in tps2Δ cells under nitrogen starvation. In addition to ATG8, tps2Δ cells showed slightly less expression of multiple ATG genes than rim15Δ cells (). Furthermore, tps2Δ cells exhibited more severely impaired autophagic flux than rim15Δ cells (). Given this, it is reasonable to assume that Tps2 may control unknown transcriptional regulator(s) of ATG genes other than Rim15. Indeed, we observed that the induction of ATG1, an essential component of the core autophagy machinery, was positively regulated by Tps2 but not by Rim15 under nitrogen starvation (data not shown).
It has been reported that nuclear localization of Msn2 is regulated by PKA but not by Rim15 under glucose starvation, even though both PKA and Rim15 control the activity of Msn2 [Citation44]. Interestingly, however, we observed that, under nitrogen starvation, nuclear localization of Msn2 was significantly decreased in rim15Δ cells compared to wild-type cells (). This result suggests that Rim15 regulates nuclear localization of Msn2 under nitrogen starvation. Most likely, the effects of PKA and Rim15 on Msn2 localization are differentially regulated in response to cellular nutrient conditions. Consistent with this notion, we observed that PKA activity was significantly reduced in cells under glucose deprivation condition but was little, if any, affected in cells under nitrogen deprivation condition (data not shown).
It has been reported that TORC1-Sch9-dependent phosphorylation of Ser1061 and Thr1075 of Rim15 is essential for cytoplasm retention of Rim15 by mediating its interaction with Bmh1/2 and inhibition of TORC1 activity by rapamycin induces nuclear accumulation of Rim15 [Citation18–20]. Intriguingly, we could not observe nuclear localization of Rim15 under various conditions leading to decreased TORC1 activity, such as nitrogen starvation, rapamycin treatment, and TOR1 deletion (data not shown). We could only observe the nuclear accumulation of Rim15 in sch9Δ cells or ras2Δ cells under nitrogen starvation (). The discrepancy between previous and our results regarding the effect of TORC1 activity on nuclear localization of Rim15 may be due to the differences in yeast strains and experimental conditions used. Yet, it is clear that Sch9 plays a major role in the regulation of the nucleocytoplasmic distribution of Rim15. It is notable that, although Sch9 is known to be mainly regulated by TORC1-dependent phosphorylation, recent studies have revealed that Sch9 can also act independently of TORC1 activity [Citation47,Citation48]. The precise regulatory mechanism of Rim15 localization under weak TORC1 activity remains to be further elucidated.
Our data demonstrate that Ser1061 and Thr1075 residues of Rim15 are not dephosphorylated in tps2Δ cells under nitrogen starvation (Fig. S8C and S8D). Taking into consideration that the dissociation of Rim15 from Bmh1/2 is mediated by dephosphorylation of these residues and Rim15S1061A,T1075A (Rim15-2A) mutant exhibits significantly reduced interaction with Bmh1/2 in tps2Δ cells under both nutrient-rich and nitrogen starvation conditions (), this result also supports our notion that Tps2 is involved in dephosphorylation of Ser1061 and Thr1075 residues of Rim15. Given that Tps2 has trehalose-6-phosphate phosphatase activity, it is presumable that Tps2 may function as a phosphatase for Rim15. Some phosphatases have been found to use both small molecules and proteins as substrates. In mammalian cells, the glycerol-3-phosphate phosphatase PGP dephosphorylates glycerol-3-phosphate into glycerol. Although PGP functions as a carbohydrate phosphatase, it also possesses tyrosine protein phosphatase activity [Citation49].
Furthermore, a negative regulator of PtdIns3 K/AKT signaling, PTEN (phosphatase and tensin homolog), acts as both a lipid phosphatase that dephosphorylates PtdIns3P and a dual protein phosphatase in regulating apoptosis and cell proliferation signalings [Citation50–52]. To examine whether Tps2 directly dephosphorylates Ser1061 and Thr1075 residues of Rim15, we performed an in vitro assay using immunoprecipitated Tps2 and Rim15. However, we could not find evidence that Tps2 directly dephosphorylates Ser1061 and Thr1075 residues of Rim15 in our experimental conditions (data not shown). Presumably, Tps2 or Rim15 might lose their functionality during the immunoprecipitation procedure. There is also a possibility that Tps2 might regulate an unidentified Rim15 phosphatase or cellular signaling pathway that controls the dephosphorylation of Ser1061 and Thr1075 residues of Rim15. It would be interesting to identify the TORC1-independent signaling pathway(s) that regulates the dephosphorylation of Ser1061 and Thr1075 residues of Rim15 in response to nitrogen starvation and investigate how Tps2 contributes to this signaling pathway(s). Further investigation into the role of Tps2 in controlling the phosphorylation status of Rim15 will broaden our understanding of Rim15-mediated autophagy regulation.
Materials and methods
Yeast strains and media
Yeast strains used in this study are listed in Table S1. Strains were constructed by PCR-mediated epitope tagging method or PCR-mediated gene deletion method. Yeast cells were grown in YPD medium (1% yeast extract [BD Difco, 212750], 2% peptone [BD Difco, 211677], and 2% glucose [Junsei Chemical, 64220–0650]) or synthetic complete medium with glucose (SC; 0.67% yeast nitrogen base without amino acids [BD Difco, 291940], 2% glucose, and appropriate nutritional supplements) or galactose (SCgal; 0.67% yeast nitrogen base without amino acids, 2% galactose [Samchun Chemicals, G0476], and appropriate nutritional supplements) lacking appropriate amino acids for selection [Citation53]. For nitrogen starvation, yeast cells grown to early log phase in YPD or SC medium were washed with distilled water and incubated in nitrogen starvation medium with glucose (SD-N; 0.17% yeast nitrogen base without amino acids and ammonium sulfate [BD Difco, 233520], 2% glucose) or galactose (Sgal-N; 0.17% yeast nitrogen base without amino acids and ammonium sulfate, 2% galactose). For solid media, 2% agar (BD Difco, 214010), was added. All cultures were incubated at 30°C.
Construction of plasmids
The oligonucleotide primers used in this study are listed in Table S2. For the construction of pFA6a-His3MX6-ATG8p-GFP vector, the ~590 bp PCR product of the ATG8 promoter obtained using BY4741 genomic DNA as a template was digested with BglII and PacI and ligated into BglII–PacI digested pFA6a-His3MX6-HXK2p-GFP [Citation54]. Vectors for expressing p413ADH-GFP-Rim15K823Y (Rim15KI), p413ADH-GFP-Rim15-2A and p413ADH-GFP-Rim15(944–1149) were generated from p413ADH (ATCC, 87370) using the QuikChange site-directed mutagenesis protocol (Agilent Technologies, 200518) and the SLIC method [Citation55].
Western blot analysis
Yeast cell extracts were prepared as previously described [Citation56]. SDS-PAGE and immunoblotting were performed using standard methods with a HRP-conjugated anti-mouse IgG antibody (Sigma-Aldrich, A9044), a HRP-conjugated anti-rabbit IgG antibody (Sigma-Aldrich, A6154), a HRP-conjugated anti-GFP antibody (Santa Cruz Biotechnology, SC-9996 HRP), a HRP-conjugated anti-MYC antibody (Santa Cruz Biotechnology, SC-40 HRP), a HRP-conjugated anti-HA antibody (Santa Cruz Biotechnology, SC-7392 HRP), a mouse anti-GFP antibody (Santa Cruz Biotechnology, SC-9996), and a rabbit anti-hexokinase antibody (United States Biological, H2035-03).
RNA extraction and quantitative reverse transcription–PCR (quantitative real-time PCR)
Total RNA was extracted from yeast cells using the RNeasy Mini Kit (QIAGEN, 74,104), and 1 μg of total RNA was reverse transcribed using the First-Strand cDNA Synthesis Kit (TOYOBO, FSQ-101). mRNA abundance was determined by quantitative real-time PCR using Quantstudio 3 with SensiFAST SYBR Low-ROX Mix (Bioline, BIO-98020). Amplification efficiencies were validated and normalized against TAF10, and relative mRNA levels were calculated by the 2−ΔΔCT method [Citation57].
TEM
Sample preparation and TEM image analysis were performed as previously described [Citation40]. Images were captured using a JEM1010 transmission electron microscope (JEOL) at the National Instrumentation Center for Environmental Management (NICEM).
Co-IP assay
Cells extracts were prepared as previously described [Citation56]. Cell extracts were incubated with an anti-GFP antibody (Santa Cruz Biotechnology, SC-9996) for 4 h at 4°C. Protein A-Sepharose beads (GE healthcare, 17-5138-01) were added and incubated overnight at 4°C. For a negative control, cell extracts were incubated with only protein A-Sepharose beads. SDS-PAGE and western blot analysis were performed using standard methods with a HRP-conjugated anti-GFP antibody (Santa Cruz Biotechnology, SC-9996 HRP) and a HRP-conjugated anti-MYC antibody (Santa Cruz Biotechnology, SC-40 HRP).
Autophagy assay
For monitoring macroautophagy, the alkaline phosphatase activity of Pho8Δ60 was measured as previously described [Citation30]. The GFP-processing assay for ATG8p-GFP-Atg8, Om45-GFP, and Pex11-GFP was performed as previously described [Citation32–34].
Measurement of intracellular trehalose content
Intracellular trehalose content was measured as previously described [Citation58]. Trehalose was hydrolyzed by trehalase (Sigma-Aldrich, T8778; 0.05 U/ml final concentration) for 16 h at 37°C with gentle shaking. Glucose content derived from trehalose was measured using a glucose assay reagent (Sigma-Aldrich, G3293).
ChIP assay
ChIP assay was performed as previously described [Citation59]. For ChIP of Ume6-TAP, 30 μl of IgG-sepharose beads (GE Healthcare, 17-0969-01) was incubated with 200 μl of lysate at 4°C for 4 h. Input and ChIP samples were analyzed by quantitative real-time PCR using Quantstudio 3 with SensiFAST SYBR Low-ROX Mix. Relative fold enrichment of Ume6-TAP at the ATG8 promoter region was determined by calculating the ratio of the ATG8 promoter region to CUP1, an internal control, using the comparative CT method.
Fluorescence microscopy analysis
Cells expressing GFP-tagged target proteins were analyzed on 96-well glass-bottomed microplates (Matrical Bioscience, MGB096) using a Nikon Eclipse E1 microscope with a Plan Fluor 100×/1.30 NA oil immersion objective lens.
Statistical analysis
Significance of differences was analyzed with two-tailed Student’s t-test (***P < 0.001, **P < 0.01, *P < 0.05). Values are the mean of three independent experiments and the error bars indicate the standard deviation.
Supplemental Material
Download MS Word (414.1 KB)Acknowledgments
We thank Claudio De Virgilio for generously providing the phospho-Ser1061 Rim15 antibody and Hyun Ah Kang for S. cerevisiae CEN.PK2-1C strain. We also thank the members of our laboratory for helpful discussions. This work was supported by the National Research Foundation of Korea grants (2018R1A2B2009169) funded by the Ministry of Education, Science and Technology, Republic of Korea.
Disclosure statement
No potential conflict of interest was reported by the authors.
Supplemental material
Supplemental data for this article can be accessed here.
Additional information
Funding
References
- Wang CW, Klionsky DJ. The molecular mechanism of autophagy. Mol Med. 2003;9(3–4):65–76.
- Onodera J, Ohsumi Y. Autophagy is required for maintenance of amino acid levels and protein synthesis under nitrogen starvation. J Biol Chem. 2005;280(36):31582–31586.
- Xie Z, Klionsky DJ. Autophagosome formation: core machinery and adaptations. Nat Cell Biol. 2007;9(10):1102–1109.
- Huang J, Klionsky DJ. Autophagy and human disease. Cell Cycle. 2007;6(15):1837–1849.
- Feng Y, Yao Z, Klionsky DJ. How to control self-digestion: transcriptional, post-transcriptional, and post-translational regulation of autophagy. Trends Cell Biol. 2015;25(6):354–363.
- Xie Y, Kang R, Sun X, et al. Posttranslational modification of autophagy-related proteins in macroautophagy. Autophagy. 2015;11(1):28–45.
- Fullgrabe J, Klionsky DJ, Joseph B. The return of the nucleus: transcriptional and epigenetic control of autophagy. Nat Rev Mol Cell Biol. 2014;15(1):65–74.
- Tsukada M, Ohsumi Y. Isolation and characterization of autophagy-defective mutants of Saccharomyces cerevisiae. FEBS Lett. 1993;333(1–2):169–174.
- Takeshige K, Baba M, Tsuboi S, et al. Autophagy in yeast demonstrated with proteinase-deficient mutants and conditions for its induction. J Cell Biol. 1992;119(2):301–311.
- Parzych KR, Ariosa A, Mari M, et al. A newly characterized vacuolar serine carboxypeptidase, Atg42/Ybr139w, is required for normal vacuole function and the terminal steps of autophagy in the yeast Saccharomyces cerevisiae. Mol Biol Cell. 2018;29(9):1089–1099.
- Jin M, He D, Backues SK, et al. Transcriptional regulation by Pho23 modulates the frequency of autophagosome formation. Curr Biol. 2014;24(12):1314–1322.
- Bernard A, Jin M, Gonzalez-Rodriguez P, et al. Rph1/KDM4 mediates nutrient-limitation signaling that leads to the transcriptional induction of autophagy. Curr Biol. 2015;25(5):546–555.
- Levine B, Klionsky DJ. Development by self-digestion: molecular mechanisms and biological functions of autophagy. Dev Cell. 2004;6(4):463–477.
- Xie Z, Nair U, Klionsky DJ. Atg8 controls phagophore expansion during autophagosome formation. Mol Biol Cell. 2008;19(8):3290–3298.
- Bartholomew CR, Suzuki T, Du Z, et al. Ume6 transcription factor is part of a signaling cascade that regulates autophagy. Proc Natl Acad Sci U S A. 2012;109(28):11206–11210.
- Vlahakis A, Lopez Muniozguren N, Powers T. Stress-response transcription factors Msn2 and Msn4 couple TORC2-Ypk1 signaling and mitochondrial respiration to ATG8 gene expression and autophagy. Autophagy. 2017;13(11):1804–1812.
- Reinders A, Burckert N, Boller T, et al. Saccharomyces cerevisiae cAMP-dependent protein kinase controls entry into stationary phase through the Rim15p protein kinase. Genes Dev. 1998;12(18):2943–2955.
- Pedruzzi I, Dubouloz F, Cameroni E, et al. TOR and PKA signaling pathways converge on the protein kinase Rim15 to control entry into G0. Mol Cell. 2003;12(6):1607–1613.
- Wanke V, Pedruzzi I, Cameroni E, et al. Regulation of G0 entry by the Pho80-Pho85 cyclin-CDK complex. Embo J. 2005;24(24):4271–4278.
- Wanke V, Cameroni E, Uotila A, et al. Caffeine extends yeast lifespan by targeting TORC1. Mol Microbiol. 2008;69(1):277–285.
- Elbein AD. The metabolism of alpha,alpha-trehalose. Adv Carbohydr Chem Biochem. 1974;30:(227–256.
- Elbein AD, Pan YT, Pastuszak I, et al. New insights on trehalose: a multifunctional molecule. Glycobiology. 2003;13(4):17R–27R.
- Bell W, Klaassen P, Ohnacker M, et al. Characterization of the 56-kDa subunit of yeast trehalose-6-phosphate synthase and cloning of its gene reveal its identity with the product of CIF1, a regulator of carbon catabolite inactivation. Eur J Biochem. 1992;209(3):951–959.
- De Virgilio C, Burckert N, Bell W, et al. Disruption of TPS2, the gene encoding the 100-kDa subunit of the trehalose-6-phosphate synthase/phosphatase complex in Saccharomyces cerevisiae, causes accumulation of trehalose-6-phosphate and loss of trehalose-6-phosphate phosphatase activity. Eur J Biochem. 1993;212(2):315–323.
- Schepers W, Van Zeebroeck G, Pinkse M, et al. In vivo phosphorylation of Ser21 and Ser83 during nutrient-induced activation of the yeast protein kinase A (PKA) target trehalase. J Biol Chem. 2012;287(53):44130–44142.
- Sarkar S, Davies JE, Huang Z, et al. Trehalose, a novel mTOR-independent autophagy enhancer, accelerates the clearance of mutant huntingtin and alpha-synuclein. J Biol Chem. 2007;282(8):5641–5652.
- Rodriguez-Navarro JA, Rodriguez L, Casarejos MJ, et al. Trehalose ameliorates dopaminergic and tau pathology in parkin deleted/tau overexpressing mice through autophagy activation. Neurobiol Dis. 2010;39(3):423–438.
- Castillo K, Nassif M, Valenzuela V, et al. Trehalose delays the progression of amyotrophic lateral sclerosis by enhancing autophagy in motoneurons. Autophagy. 2013;9(9):1308–1320.
- Yoon YS, Cho ED, Jung Ahn W, et al. Is trehalose an autophagic inducer? Unraveling the roles of non-reducing disaccharides on autophagic flux and alpha-synuclein aggregation. Cell Death Dis. 2017;8(10):e3091.
- Noda T, Klionsky DJ. The quantitative Pho8Delta60 assay of nonspecific autophagy. Methods Enzymol. 2008;451:(33–42.
- Kihara A, Noda T, Ishihara N, et al. Two distinct Vps34 phosphatidylinositol 3-kinase complexes function in autophagy and carboxypeptidase Y sorting in Saccharomyces cerevisiae. J Cell Biol. 2001;152(3):519–530.
- Shintani T, Klionsky DJ. Cargo proteins facilitate the formation of transport vesicles in the cytoplasm to vacuole targeting pathway. J Biol Chem. 2004;279(29):29889–29894.
- Reggiori F, Monastyrska I, Shintani T, et al. The actin cytoskeleton is required for selective types of autophagy, but not nonspecific autophagy, in the yeast Saccharomyces cerevisiae. Mol Biol Cell. 2005;16(12):5843–5856.
- Kanki T, Klionsky DJ. Mitophagy in yeast occurs through a selective mechanism. J Biol Chem. 2008;283(47):32386–32393.
- Kanki T, Klionsky DJ. Atg32 is a tag for mitochondria degradation in yeast. Autophagy. 2009;5(8):1201–1202.
- Motley AM, Nuttall JM, Hettema EH. Atg36: the Saccharomyces cerevisiae receptor for pexophagy. Autophagy. 2012;8(11):1680–1681.
- Plourde-Owobi L, Durner S, Parrou JL, et al. AGT1, encoding an alpha-glucoside transporter involved in uptake and intracellular accumulation of trehalose in Saccharomyces cerevisiae. J Bacteriol. 1999;181(12):3830–3832.
- Peeters K, Van Leemputte F, Fischer B, et al. Fructose-1,6-bisphosphate couples glycolytic flux to activation of Ras. Nat Commun. 2017;8(1):922.
- Teichert U, Mechler B, Muller H, et al. Lysosomal (vacuolar) proteinases of yeast are essential catalysts for protein degradation, differentiation, and cell survival. J Biol Chem. 1989;264(27):16037–16045.
- Backues SK, Chen D, Ruan J, et al. Estimating the size and number of autophagic bodies by electron microscopy. Autophagy. 2014;10(1):155–164.
- Cameroni E, Hulo N, Roosen J, et al. The novel yeast PAS kinase Rim 15 orchestrates G0-associated antioxidant defense mechanisms. Cell Cycle. 2004;3(4):462–468.
- Gorner W, Durchschlag E, Martinez-Pastor MT, et al. Nuclear localization of the C2H2 zinc finger protein Msn2p is regulated by stress and protein kinase A activity. Genes Dev. 1998;12(4):586–597.
- Smith A, Ward MP, Garrett S. Yeast PKA represses Msn2p/Msn4p-dependent gene expression to regulate growth, stress response and glycogen accumulation. Embo J. 1998;17(13):3556–3564.
- Lee P, Kim MS, Paik SM, et al. Rim15-dependent activation of Hsf1 and Msn2/4 transcription factors by direct phosphorylation in Saccharomyces cerevisiae. FEBS Lett. 2013;587(22):3648–3655.
- Budovskaya YV, Stephan JS, Reggiori F, et al. The Ras/cAMP-dependent protein kinase signaling pathway regulates an early step of the autophagy process in Saccharomyces cerevisiae. J Biol Chem. 2004;279(20):20663–20671.
- Schmelzle T, Beck T, Martin DE, et al. Activation of the RAS/cyclic AMP pathway suppresses a TOR deficiency in yeast. Mol Cell Biol. 2004;24(1):338–351.
- Yorimitsu T, Zaman S, Broach JR, et al. Protein kinase A and Sch9 cooperatively regulate induction of autophagy in Saccharomyces cerevisiae. Mol Biol Cell. 2007;18(10):4180–4189.
- Wei Y, Zheng XF. Sch9 partially mediates TORC1 signaling to control ribosomal RNA synthesis. Cell Cycle. 2009;8(24):4085–4090.
- Seifried A, Knobloch G, Duraphe PS, et al. Evolutionary and structural analyses of mammalian haloacid dehalogenase-type phosphatases AUM and chronophin provide insight into the basis of their different substrate specificities. J Biol Chem. 2014;289(6):3416–3431.
- Li J, Yen C, Liaw D, et al. PTEN, a putative protein tyrosine phosphatase gene mutated in human brain, breast, and prostate cancer. Science. 1997;275(5308):1943–1947.
- Myers MP, Stolarov JP, Eng C, et al. P-TEN, the tumor suppressor from human chromosome 10q23, is a dual-specificity phosphatase. Proc Natl Acad Sci U S A. 1997;94(17):9052–9057.
- Wozniak DJ, Kajdacsy-Balla A, Macias V, et al. PTEN is a protein phosphatase that targets active PTK6 and inhibits PTK6 oncogenic signaling in prostate cancer. Nat Commun. 2017;8(1):1508.
- Sherman F. Getting started with yeast. Methods Enzymol. 2002;350:(3–41.
- Sung MK, Huh WK. Bimolecular fluorescence complementation analysis system for in vivo detection of protein-protein interaction in Saccharomyces cerevisiae. Yeast. 2007;24(9):767–775.
- Jeong JY, Yim HS, Ryu JY, et al. One-step sequence- and ligation-independent cloning as a rapid and versatile cloning method for functional genomics studies. Appl Environ Microbiol. 2012;78(15):5440–5443.
- Shin CS, Huh WK. Bidirectional regulation between TORC1 and autophagy in Saccharomyces cerevisiae. Autophagy. 2011;7(8):854–862.
- Livak KJ, Schmittgen TD. Analysis of relative gene expression data using real-time quantitative PCR and the 2(-Delta Delta C(T)) Method. Methods. 2001;25(4):402–408.
- Parrou JL, Francois J. A simplified procedure for a rapid and reliable assay of both glycogen and trehalose in whole yeast cells. Anal Biochem. 1997;248(1):186–188.
- Huang J, Moazed D. Association of the RENT complex with nontranscribed and coding regions of rDNA and a regional requirement for the replication fork block protein Fob1 in rDNA silencing. Genes Dev. 2003;17(17):2162–2176.