
ABSTRACT
Although macroautophagy/autophagy deficiency causes degenerative diseases, the deletion of essential autophagy genes in adipocytes paradoxically reduces body weight. Brown adipose tissue (BAT) plays an important role in body weight regulation and metabolic control. However, the key cellular mechanisms that maintain BAT function remain poorly understood. in this study, we showed that global or brown adipocyte-specific deletion of pink1, a Parkinson disease-related gene involved in selective mitochondrial autophagy (mitophagy), induced BAT dysfunction, and obesity-prone type in mice. Defective mitochondrial function is among the upstream signals that activate the NLRP3 inflammasome. NLRP3 was induced in brown adipocyte precursors (BAPs) from pink1 knockout (KO) mice. Unexpectedly, NLRP3 induction did not induce canonical inflammasome activity. Instead, NLRP3 induction led to the differentiation of pink1 KO BAPs into white-like adipocytes by increasing the expression of white adipocyte-specific genes and repressing the expression of brown adipocyte-specific genes. nlrp3 deletion in pink1 knockout mice reversed BAT dysfunction. Conversely, adipose tissue-specific atg7 KO mice showed significantly lower expression of Nlrp3 in their BAT. Overall, our data suggest that the role of mitophagy is different from general autophagy in regulating adipose tissue and whole-body energy metabolism. Our results uncovered a new mitochondria-NLRP3 pathway that induces BAT dysfunction. The ability of the nlrp3 knockouts to rescue BAT dysfunction suggests the transcriptional function of NLRP3 as an unexpected, but a quite specific therapeutic target for obesity-related metabolic diseases.
Abbreviations: ACTB: actin, beta; BAPs: brown adipocyte precursors; BAT: brown adipose tissue; BMDMs: bone marrow-derived macrophages; CASP1: caspase 1; CEBPA: CCAAT/enhancer binding protein (C/EBP), alpha; ChIP: chromatin immunoprecipitation; EE: energy expenditure; HFD: high-fat diet; IL1B: interleukin 1 beta; ITT: insulin tolerance test; KO: knockout; LPS: lipopolysaccharide; NLRP3: NLR family, pyrin domain containing 3; PINK1: PTEN induced putative kinase 1; PRKN: parkin RBR E3 ubiquitin protein ligase; RD: regular diet; ROS: reactive oxygen species; RT: room temperature; UCP1: uncoupling protein 1 (mitochondrial, proton carrier); WT: wild-type.
Introduction
Metabolically active brown adipose tissue (BAT) is present in humans [Citation1], and plays an important role in body weight regulation and metabolic control [Citation2,Citation3]. In particular, anatomically defined neck fat isolated from adult human volunteers shares many similarities with classical BAT in rodents [Citation4]. Brown adipocytes are distinct from white adipocytes in that their abundant mitochondria are enriched with UCP1 (uncoupling protein 1), which generates heat from the dissipation of the mitochondrial proton gradient [Citation2]. In addition to brown adipocytes constitutively expressing high levels of UCP1, UCP1-expressing beige adipocytes with thermogenic capacity also develop in white adipose tissue in response to various stimuli [Citation5]. The origin and the transcriptional regulation of brown and beige adipocyte development are well characterized [Citation2,Citation5,Citation6]. However, the key cellular mechanisms that maintain BAT mass and function remain poorly understood.
As an important cellular pathway that is activated when nutrients are limited, macroautophagy/autophagy could be expected to counteract the primary energy storage function of white adipocytes. However, targeted deletion of the essential autophagy gene Atg7 in adipose tissue has been shown to paradoxically result in a lean phenotype in mice [Citation7,Citation8]. A recent study also found that adipocyte-specific atg5 or atg12 KO mice are resistant to diet-induced obesity [Citation9]. In that study, autophagy was found to eliminate mitochondria in beige adipocytes during exposure to ADRB3 (adrenergic receptor, beta 3) stimuli or withdrawal from cold exposure.
Deficient mitochondrial quality control results in inflammation and the death of cell populations [Citation10]. Selective autophagy of mitochondria, known as mitophagy, is an important mitochondrial quality control mechanism that eliminates damaged mitochondria [Citation11,Citation12]. Mitophagy selectively removes mitochondria, whereas general autophagy also degrades a range of cytosolic proteins and many types of organelles other than the mitochondria [Citation11,Citation12]. A central mediator of mitophagy is PINK1 (PTEN induced putative kinase 1), a serine-threonine kinase associated with a recessive form of familial Parkinson disease. In the best-characterized pathway to initiate mitophagy, PINK1 activates the E3 ubiquitin ligase PRKN/Parkin to mark depolarized mitochondria for degradation. Interestingly, PINK1 expression is increased in the muscle and adipose tissues of obese individuals or type 2 diabetes patients [Citation13].
NLRP3 (NLR family, pyrin domain containing 3) inflammasome is an intracellular multiprotein complex that links sensing of microbial products and intracellular danger signals to the proteolytic activation of proinflammatory cytokines [Citation14,Citation15]. Chronic inflammation has been linked to many immune and metabolic diseases, including arthritis, atherosclerosis, diabetes, and aging, and important roles have been described for the NLRP3 inflammasome in all of these pathologies [Citation14–17].
Autophagy/mitophagy blockade activates NLRP3 inflammasomes in macrophages [Citation18,Citation19], and we also found that NLRP3 expression was increased in BAPs from pink1 knockout mice. Surprisingly, this induction was not associated with the expected activation of the inflammasome function. Rather, previous studies have suggested a quite different function of NLRP3 as a transcriptional regulator [Citation20]. To assess the role of NLRP3 as a mediator of the deleterious effects of loss of PINK1, we generated double pink1 and nlrp3 knockouts. The striking reversal of BAT dysfunction in these double knockouts reveals a new mitochondria-NLRP3 pathway that can induce BAT dysregulation.
Results
Pink1 KO mice manifest BAT dysfunction
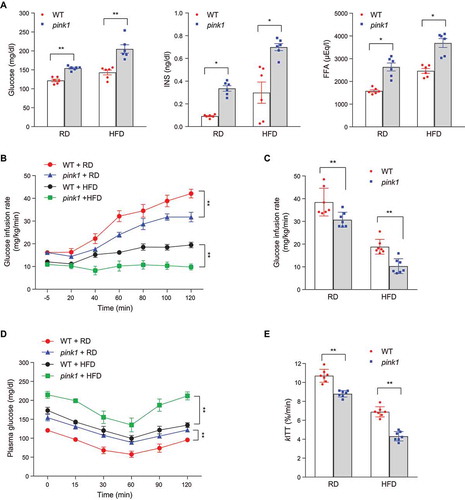
We initially investigated the function of PINK1 in controlling energy balance through monitoring weight gain among pink1 KO and wild-type (WT) male mice. Eight-week-old male mice were fed a regular diet (RD) or a high-fat diet (HFD) for 8 weeks. The body weight and fat mass of RD-fed mice were not significantly different between the two groups, but we observed a marked increase in weight gain driven by fat mass in HFD-fed pink1 KO mice ( and S1). Interestingly, HFD-fed pink1 KO mice consumed significantly less food than HFD-fed WT mice (), suggesting that the decrease in energy expenditure (EE) led to the increased weight gain in pink1 KO mice. RD-fed pink1 KO mice also consumed significantly less food than RD-fed WT mice (), which may be due to reduced energy demand in response to a decrease in EE. Accordingly, the rates of oxygen consumption (VO2), CO2 production (VCO2), and EE in pink1 KO mice were significantly lower than those of WT controls (, S2A, and S2B). In contrast, locomotor activity was not significantly different between pink1 KO and WT mice ( and S2C), consistent with the findings that dopaminergic neurodegeneration is not found in pink1 KO mice at 3 to 4 months of age [Citation21]. Interestingly, both RD-fed and HFD-fed pink1 KO mice showed insulin resistance, even though the body weight was not significantly higher in RD-fed pink1 KO mice. ().
Figure 1. Decreased energy expenditure in pink1 KO mice. (A) Body weight of pink1 KO (pink1) mice and WT littermates fed RD or HFD (n = 13). (B) Average daily food intake per mouse (n = 13). (C-F) Decreased EE in pink1 KO mice. (C) O2 consumption and CO2 production (n = 8). (D) EE was calculated as (3.815 + 1.232 × RER) × VO2/lean mass (n = 8). (E) RER and (F) locomotor activity (n = 8). Data are presented as mean ± SEM. Student’s two-tailed unpaired t-test (D) or one-way repeated-measures ANOVA (A-C, E and F); **p < 0.01, ***p < 0.001
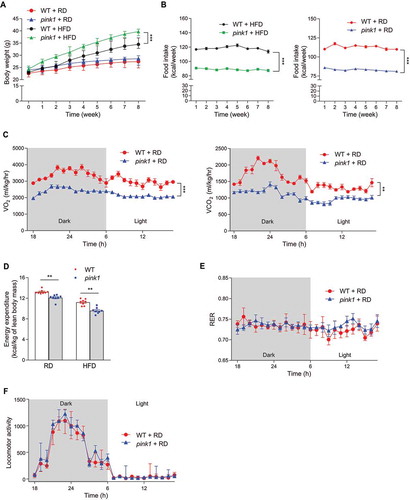
Figure 2. Insulin resistance in pink1 KO mice. (A) Fasting plasma glucose, INS, and free fatty acid (FFA) levels in pink1 KO mice (n = 6). (B) Glucose infusion rate (GIR) in the euglycemic hyperinsulinemic clamp studies (n = 7). (C) Mean GIR values from 80 to 120 min (n = 7). (D) ITT (n = 7). (E) Glucose disappearance rate for ITT (kITT; %/min) (n = 7). Data are presented as mean ± SEM. Student’s two-tailed unpaired t-test (A, C and E) or one-way repeated-measures ANOVA (B, D); *p < 0.05, **p < 0.01
Given the considerable influence of BAT on overall energy balance [Citation2], we investigated morphological differences in tissue architecture between pink1 KO and WT controls. BAT from control mice showed prototypically small and multilocular lipid droplets at 8 and 16 weeks of age ( and B). pink1 KO mice exhibited a “whitening” of BAT (i.e., the transformation of brown fat cells to cells having large and unilocular lipid droplets). HFD feeding in pink1 KO mice further increased BAT whitening [Citation22] ( and B). Electron microscopy examination showed ballooning of the mitochondrial matrix and disorganized cristae in pink1 KO brown adipocytes ( and D).
Figure 3. Brown fat dysfunction in pink1 KO mice. (A and B) H&E stained BAT sections. Scale bar: 50 µm (A). Average sizes of adipocytes in H&E sections of 16-weeks-old mice measured by ImageJ (B). For each mouse, 10 fields of H&E sections were randomly selected for analysis (n = 4). (C and D) Transmission electron micrographs of BAT revealing the ballooning of the mitochondrial matrix and disorganized mitochondrial cristae in pink1 KO mice (n = 4). Scale bar: 1 µm. (D) Morphometric analysis of TEM images performed with ImageJ on a sample of 10 randomly selected images from 4 mice. (E) Representative western blots of UCP1 protein in BAT from 3 independent experiments are shown (left panel). Equal amounts of protein (30 μg) were loaded in each lane, and the exposure times for detecting UCP1 and ACTB were both 30 s. See Fig. S3 for details. The intensities of UCP1 were quantified using the ImageJ software and compared with that of ACTB (right panel). (F) Core temperature in mice at RT and after exposure to 4°C for 6 h (n = 7). (G) mRNA expression of brown adipocyte-specific genes (n = 6). Data are presented as mean ± SEM. One-way ANOVA with Bonferroni correction for post hoc analysis (B) or Student’s two-tailed unpaired t-test (D-G). *p < 0.05, **p < 0.01, ***p < 0.001 vs WT; #p < 0.05, ##p < 0.01, ###p < 0.001 vs RD
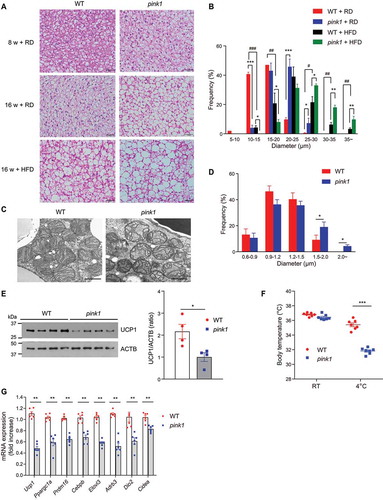
The UCP1 in BAT dissociates respiration from ATP formation and generates heat to regulate whole-body EE [Citation23]. In pink1 KO mice, UCP1 expression in BAT was significantly lower than in WT mice ( and S3). To examine the effect of PINK1 deletion on thermogenesis, we monitored the body temperatures of the mice after cold exposure. Body temperatures of pink1 KO mice were not significantly different from those of WT mice at room temperature (RT). However, after cold exposure at 4°C for 6 h, pink1 KO mice had significantly lower body temperatures than WT mice (). Mitochondrial biogenesis and mitophagy represent two opposing but coordinated processes that regulate mitochondrial content, structure, and function [Citation24]. The expression of Ppargc1a (peroxisome proliferative activated receptor, gamma, coactivator 1 alpha), the master regulator of mitochondrial biogenesis [Citation24], was significantly lower in the BAT of pink1 KO mice, and this was associated with lower expressions of brown adipocyte-specific markers ().
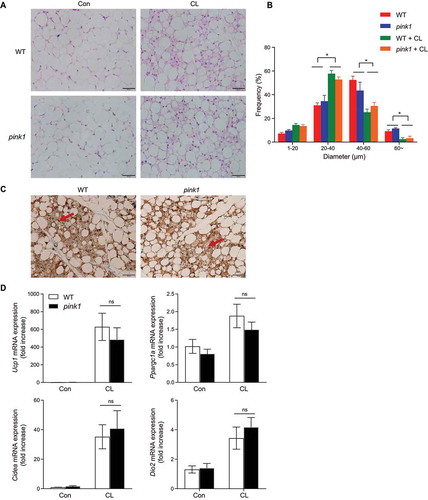
To establish how PINK1 ablation impacts beige fat thermogenesis, we injected WT and pink1 KO mice with the ADRB3 agonist (CL-316243). The inguinal adipose tissue of WT and pink1 KO mice showed similarly increased expression of UCP1, suggesting that the changes in pink1 KO mice are limited to classical brown adipocytes ().
Figure 4. Effects of the ADRB3 agonist on thermogenic gene induction in inguinal WAT (iWAT). Eight-weeks-old male WT and pink1 KO mice received daily intraperitoneal injections of CL-316,243 (CL) for 3 d. (A) H&E staining of iWAT. Scale bar: 50 µm (n = 4). Average sizes of adipocytes in H&E sections of 16-weeks-old mice measured by ImageJ (B). For each mouse, 10 fields of H&E sections were randomly selected for analysis. (C) Immunohistochemical staining of UCP1-positive adipocytes. Arrows indicate UCP1 staining in the iWAT. Scale bar: 50 µm (n = 4). (D) Ucp1 and thermogenic gene expression (n = 6). Data are presented as mean ± SEM. One-way ANOVA with Bonferroni correction for post hoc analysis (B) or Student’s two-tailed unpaired t-test (D). *p < 0.05 versus CL-untreated mice, ns; not significant
Pink1 KO BAPs differentiate into white-like adipocytes
We then examined the mechanism of BAT dysfunction in pink1 KO mice using brown adipocyte precursors (BAPs) isolated from the stromal vascular fraction of the interscapular BAT [Citation25]. Tissue-specific precursor/stem cells are required for the maintenance of physiological and regenerative responses [Citation26], and deterioration in their function underlies aging-related BAT dysfunction [Citation27]. We noted that differentiation of BAPs derived from pink1 KO mice was defective, as grossly reflected by larger lipid droplets () and significantly decreased levels of Ucp1 and brown adipocyte-specific marker genes (). On the other hand, the expression levels of white adipocyte-specific genes were significantly increased in pink1 KO BAPs ().
Figure 5. BAPs of pink1 KO fail to differentiate into brown adipocytes. (A-C) BAPs obtained from the stromal vascular fraction of interscapular BAT of WT and pink1 KO mice were differentiated into brown adipocytes. After 7 d of differentiation, adipocytes were fixed, and the lipid droplets were stained with Oil Red O solution. (A) Phase-contrast fields. Scale bar: 50 µm (n = 4). (B and C) Oil-red O micrographs of differentiated brown adipocytes. Lipid droplet area was measured with ImageJ. For analysis, 10–12 fields in each slide were randomly selected. Scale bar: 10 µm (n = 4). (D and E) mRNA expression levels of brown adipocyte-specific genes (D) and white adipocyte-specific genes (E) in differentiated brown adipocytes (n = 6). (F) Estimation of mitophagy by mt-Keima method in WT and pink1 KO BAPs. The ratio of fluorescence intensity in mt-Keima staining (458 nm) and mitochondria fused with the lysosome (561 nm) was measured using ImageJ (n = 9). (G) Measurements of mitochondrial ROS by flow cytometry using mitochondrial superoxide probe MitoSox Red. Quantitative analysis of MitoSox Red fluorescence intensity (n = 5). Data are presented as mean ± SEM. Student’s two-tailed unpaired t-test (C-G). *p < 0.05, **p < 0.01, ***p < 0.001
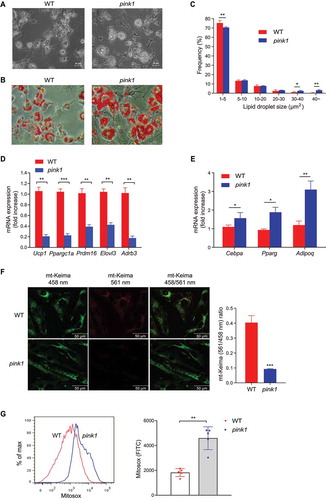
Mitophagy can be estimated by several methods, such as the recruitment of PRKN (parkin RBR E3 ubiquitin protein ligase) to chemically depolarized mitochondria, or using MitoTimer, a fluorescent probe that investigates mitochondrial turnover on the subcellular level [Citation28]. Recently, a pH-sensitive, dual-excitation, ratiometric, mitochondrial-targeted, fluorescent protein – mt-Keima – was described that also exhibits resistance to lysosomal proteases [Citation29]. At the physiological pH of the mitochondria (pH 8.0), shorter-wavelength excitation predominates. Within the acidic lysosome (pH 4.5) after mitophagy, mt-Keima undergoes a gradual shift to longer-wavelength excitation [Citation29]. As expected, pink1 KO BAPs showed defective mitophagy ( and S4), and this was associated with increased mitochondrial ROS generation ().
Increased NLRP3 expression in pink1 KO BAPs is not associated with inflammasome activation
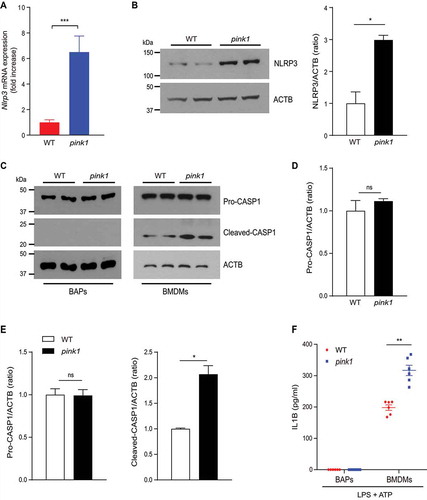
Inflammasomes are multiprotein complexes that activate CASP1 (caspase 1), which induces the maturation of the proinflammatory cytokines, IL1B (interleukin 1 beta) and IL18 (interleukin 18). Autophagy/mitophagy blockade activates NLRP3 inflammasomes in macrophages [Citation18,Citation19]. However, NLRP3 protein and inflammasome activity are also present in non-myeloid cells [Citation30–32]. We observed NLRP3 expression was significantly higher in the BAPs of pink1 KO mice (, and S5A). Interestingly, however, the increased NLRP3 expression in the BAPs isolated from pink1 KO mice did not correlate with the canonical measures of inflammasome activity. Thus, CASP1 cleavage or IL1B secretion (, 6D, 6F, S5B, and S5D) was not observed in BAPs incubated with lipopolysaccharide (LPS) and ATP. In contrast, bone marrow-derived macrophages (BMDMs) stimulated with LPS and ATP showed CASP1 cleavage and IL1B secretion into the supernatant, and this was significantly higher in the BMDMs of pink1 KO mice than of WT mice (, 6E, 6F, S5C, and S5E). These findings indicate that while inflammasome-dependent NLRP3 activation occurs in pink1 KO BMDMs, this response does not occur in BAPs.
Figure 6. Increased NLRP3 expression in pink1 KO BAPs is not associated with inflammasome activation. (A) mRNA expression (n = 6) and (B) representative western blots of NLRP3 in the BAPs of WT and pink1 KO mice from 3 independent experiments are shown. Equal amounts of protein (10 μg) were loaded in each lane, and the exposure times for detecting NLRP3 and ACTB were both 2 min. See Fig. S5A for details. The level of NLRP3 was quantified using the ImageJ software and compared with that of ACTB. (C) Immunoblot of cleaved-CASP1. LPS-primed (100 ng/ml for 4 h) BAPs and BMDMs from WT or pink1 KO mice were stimulated with ATP (5 mM for 30 min). Representative blots from 3 replicated independent experiments are shown. (D) Equal amounts of protein (10 μg) were loaded in each lane, and the exposure times for detecting CASP1 and ACTB in BAPs were 5 min and 2 min, respectively. See Fig. S5B and S5D for details. (E) The exposure times for detecting pro-CASP1, cleaved-CASP1, and ACTB in BMDMs were 30 s, 30 min, and 30 s, respectively. See Fig. S5 C and S5E for details. (F) ELISA measurement of IL1B levels of supernatants after LPS and ATP treatment (n = 6). Data are presented as mean ± SEM. Student’s two-tailed unpaired t-test; *p < 0.05, **p < 0.01, ***p < 0.001, ns; not significant
NLRP3 induces white-like adipocytes in pink1 KO BAPs
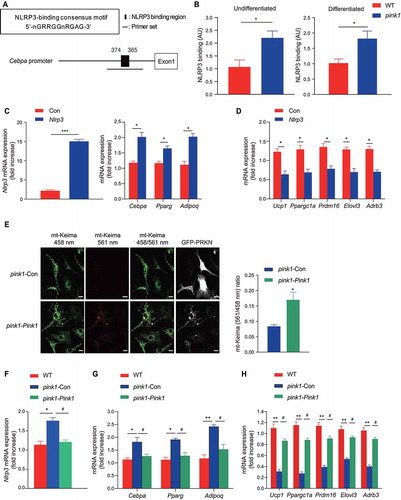
in addition to acting as an intracellular complex for cytokine maturation, NLRP3 can act as a transcription factor [Citation20]. The sequence 5ʹ-nGRRGGnRGAG-3ʹ (where ‘n’ is any nucleotide and ‘R’ is any purine) has been suggested as the consensus motif for NLRP3 binding [Citation20]. The transcription factor CEBPA (CCAAT/enhancer binding protein [C/EBP], alpha) plays an essential role in the differentiation and maintenance of WAT [Citation33-35]. We found that Cebpa contains the NLRP3 consensus motif in its promoter regions (), and the chromatin immunoprecipitation (ChIP) assay revealed that NLRP3 binding near the Cebpa was higher in both undifferentiated and differentiated BAPs from pink1 KO mice (). To examine whether NLRP3 can induce white-like adipocytes, we introduced Nlrp3 into WT BAPs using lentiviral vectors. As expected, NLRP3 induced the expression of Cebpa, and Pparg (peroxisome proliferator activated receptor gamma) and Adipoq (adiponectin, C1Q and collagen domain containing), white adipocyte-specific genes that are regulated by Cebpa [Citation36-38]. NLRP3 also repressed the expression of brown adipocyte-specific genes ( and D). Conversely, Pink1 overexpression in pink1 KO BAPs reversed defective mitophagy () and decreased the expression of Nlrp3 (), which was associated with the reversal of the aforementioned changes in white and brown fat-specific markers ( and H). Based on these results, we suggest that NLRP3 transcriptionally regulates BAPs in pink1 KO mice.
Figure 7. Increased Nlrp3 in BAPs from pink1 KO mice transcriptionally activates white adipocyte-like differentiation. (A and B) Binding of NLRP3 to the promoter regions of Cebpa. ChIP assay was performed to assess the NLRP3 binding sites in the nt −374 to −365 region of the Cebpa promoter. Four independent experiments were performed. Undifferentiated BAPs or 5 d post-differentiation BAPs were used in the ChIP assay. (C and D) Effect of overexpression of Nlrp3 in WT BAPs on the expression of Nlrp3, white adipocyte- (C), and brown adipocyte-specific markers (D). BAPs were transfected with a lentivirus carrying Nlrp3 or control vector (Con) and harvested 7 d after differentiation (n = 6). (E-H) Rescue of mitophagy by overexpression of Pink1 in pink1 KO BAPs. pink1 KO BAPs were transfected with lentiviruses for pink1 (pink1-Pink1) or control vector (pink1-Con). (E) Estimation of mitophagy by mt-Keima method. The ratio of fluorescence intensity in mt-Keima staining (458 nm) and mitochondria fused with the lysosome (561 nm) was measured using ImageJ (n = 4). (F-H) mRNA expressions of Nlrp3 (F), white adipocyte markers (G) and brown adipocyte (H) (n = 6). Data are presented as mean ± SEM. Student’s two-tailed unpaired t-test (B-E); *p < 0.05, ***p < 0.001. One-way ANOVA with Bonferroni correction for post hoc analysis (F-H); *p < 0.05, **p < 0.01 vs WT BAPs; #p < 0.05 vs pink1 KO BAPs
BAT changes in pink1 KO mice are reversed in pink1 nlrp3 double-KO mice
To test whether the induction of NLRP3 is an important mediator of BAT dysfunction in pink1 KO mice, we generated mice deficient for both pink1 and nlrp3. Changes in VO2 and VCO2 in pink1 KO mice were almost completely reversed in pink1 nlrp3 double-KO mice (). BAT changes in pink1 KO mice were also reversed in pink1 nlrp3 double-KO mice (, S6A, and S6B), whereas pink1 casp1 double-KO mice did not show such reversal ( and S6C).
Figure 8. BAT changes in pink1 KO mice are reversed in the pink/nlrp3 double-KO mice. (A-D) Eight-week-old male mice in each group were fed RD for 8 weeks. Gas exchange (A), H&E staining of BAT in pink1 nlrp3 double-KO mice (pink1 nlrp3) (n = 4). Scale bar: 50 µm (B), and representative transmission electron micrograph of BAT from pink1 KO and pink1 nlrp3 double-KO mice (n = 4). Bar: 1 µm (C). mRNA expression of BAT-specific genes in the BAT (n = 6) (D). (E) H&E staining of BAT in pink1 casp1 double-KO (pink1 casp1) mice (n = 4). Scale bar: 50 µm. Data are presented as mean ± SEM. One-way repeated-measures ANOVA with Bonferroni correction for post hoc analysis (A) or one-way ANOVA with Bonferroni correction for post hoc analysis (D); **p < 0.01, ***p < 0.001 vs. WT; ##p < 0.01 vs. pink1 KO mice. (F and G) Reversal of defective differentiation to mature brown adipocytes in pink1 nlrp3 KO BAPs. (F) Phase-contrast microscopy (top) and Oil-Red O (down) images were showing the reversal of morphologic changes in differentiated brown adipocytes obtained from pink1 nlrp3 double-KO mice (n = 4). After 7 d of differentiation, images were obtained. Scale bar: 5 µm (phase-contrast) and 50 µm (Oil-Red O). (G) mRNA expression of BAT markers in the BAPs (n = 6). Data are presented as mean ± SEM. One-way ANOVA with Bonferroni correction for post hoc analysis. **p < 0.01 vs WT BAPs; ##p < 0.01 vs pink1 KO BAPs
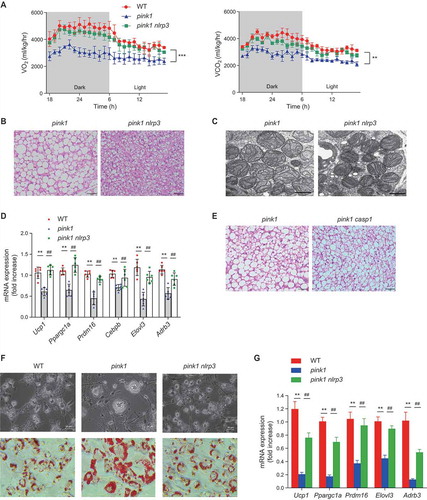
Likewise, BAPs isolated from pink1 nlrp3 double-KO mice exhibited normal differentiation into mature brown adipocytes (, and S6D), indicating that NLRP3 hinders BAT development in pink1 KO mice.
Pink1 deficiency in brown adipocytes induces brown fat dysfunction but not insulin resistance
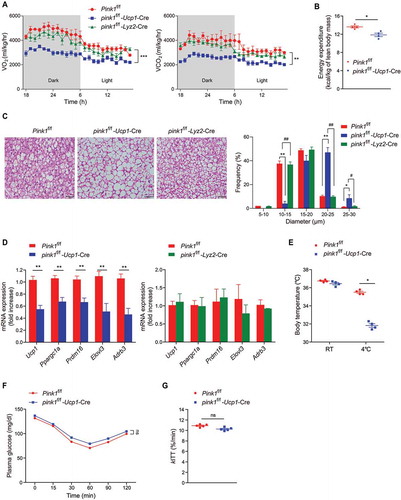
To test whether defective mitophagy in brown adipocytes per se or that in macrophages is responsible for BAT dysfunction, we produced brown adipocyte-specific (pink1 f/f-Ucp1-Cre) and myeloid-specific pink1 KO mice (pink1 f/f-Lyz2-Cre). Brown adipocyte-specific pink1 KO mice (but not myeloid cell-specific pink1 KO mice) showed VO2, VCO2, EE, morphologic features, and gene expression profiles of BAT similar to those of pink1 global KO mice (). Brown adipocyte-specific pink1 KO mice also had significantly lower body temperatures than did WT mice after cold exposure at 4°C for 6 h ().
Figure 9. Pink1 deficiency in brown adipocytes is sufficient to induce brown fat dysfunction. (A) O2 consumption and CO2 production in brown fat-specific (pink1 f/f-Ucp1-Cre) or myeloid cell-specific (pink1 f/f-Lyz2-Cre) pink1 KO mice (n = 4). (B) EE in pink1 f/f-Ucp1-Cre pink1 KO mice and Pink1 f/f mice (n = 4). (C) H&E staining of BAT. Scale bar: 50 µm (n = 4). (D) mRNA expression levels of brown fat-specific genes (n = 4). (E) Core temperature in pink1 f/f-Ucp1-Cre pink1 KO mice and Pink1 f/f mice at RT and after exposure to 4°C for 6 h (n = 4). (F and G) ITT (F) and glucose disappearance rate for ITT (kITT; %/min) (G) in pink1 f/f-Ucp1-Cre pink1 KO mice (n = 5). Data are presented as mean ± SEM. One-way repeated-measures ANOVA (A and F), or One-way ANOVA with Bonferroni correction for post hoc analysis (C) or Student’s two-tailed unpaired t-test (B, D, E and G); *p < 0.05, **p < 0.01, ***p < 0.001 vs Pink1 f/f, #p < 0.05, ##p < 0.01 vs pink1 f/f-Ucp1-Cre; ns, not significant
We then performed an insulin tolerance test (ITT) in brown adipocyte-specific pink1 KO mice to test whether brown adipocyte mitophagy contributes to insulin sensitivity. We found that brown adipocyte-specific pink1 KO mice did not show alterations in INS (insulin) sensitivity ( and G), indicating that brown adipocyte mitophagy contributes to the maintenance of energy expenditure but not of INS sensitivity.
Discussion
When dysfunctional mitochondria are not cleared adequately by mitophagy/autophagy, this leads to aging-associated diseases, including obesity [Citation10]. PINK1 was originally linked to Parkinson disease, but no substantial Parkinson disease-relevant phenotypes are observed in pink1 KO mice [Citation21]. However, a recent study found that vigorous exercise and mitochondrial DNA mutations lead to inflammation through the CGAS (cyclic GMP-AMP synthase)-STING1 (stimulator of interferon response cGAMP interactor 1) pathway in these mice [Citation39]. Our study newly shows that PINK1-mediated mitophagy is essential for maintaining the function of BAT, in which mitochondria are abundant.
The effects of mitophagy that we observed corroborate the recent results that showed cold-induced induction of mitophagy in BAT [Citation40]. Our study is also consistent with recent research demonstrating defective mitophagy, BAT dysfunction, and insulin resistance in mice with adipocyte-specific deletion of AMP-activated protein kinase [Citation41]. However, in adipocytes, the ablation of mitophagy (Pink1) yielded contrasting effects to the ablation of autophagy (Atg7) on diet-induced obesity; the latter results in the lean phenotype after HFD feeding [Citation7,Citation8]. To explain the lean phenotype of adipose-atg7 KO mice, it was proposed that Atg7 plays important roles in normal adipogenesis and that inhibition of autophagy affects white adipocyte differentiation, thereby leading to the lean phenotype [Citation7,Citation8]. In addition, atg7 KO mice showed increased BAT mass [Citation8]. Such seemingly discrepant results may be explained by the fact that adipocyte-specific atg7 KO mice showed significantly lower expression of Nlrp3 in their BATs compared with those of control mice (Figure S7). The cause of this decrease in Nlrp3 is unclear.
A recent study found that autophagy eliminates mitochondria in beige adipocytes during withdrawal from cold exposure or ADRB3 stimuli [Citation9]. By using adipocyte-specific atg5 or atg12 KO mice, the authors showed that autophagy deficiency leads to the resistance to diet-induced obesity. In another study, the same group showed that PRKN-dependent mitophagy is upstream of autophagy-induced mitochondrial clearance [Citation42]. The cause of this discrepancy is unclear, but the role of mitophagy may be different between the lineages of brown and beige adipocytes, considering that the two cell types arise from divergent precursor cells [Citation2,Citation43].
in this study, we show that NLRP3 expression was increased in the BAPs of pink1 KO mice and that this led to BAT dysfunction. In addition to its role as an intracellular sensor that detects microbial products and endogenous danger signals to activate NLRP3 inflammasome, NLRP3 can induce the differentiation of white-like adipocytes from BAPs. While targeting of NLRP3 as a therapeutic for multiple diseases is rapidly progressing, current treatment focuses on inhibition of the inflammasome-derived cytokine IL1B [Citation44]. However, it was pointed out that directly targeting NLRP3 by small molecules is specific, cost-effective, and less invasive than the cytokine blockade [Citation44]. In this regard, our study showing the transcriptional function of NLRP3 provides an additional rationale for directly targeting NLRP3 for obesity-related metabolic diseases.
BAT possesses a large capacity for glucose uptake and metabolism, and an ability to regulate insulin sensitivity [Citation45]; however, RD-fed brown adipocyte-specific pink1 KO mice showed normal results in ITT, whereas RD-fed global pink1 KO mice showed insulin resistance. This discrepancy suggests that brown adipocyte mitophagy contributes to the maintenance of energy expenditure but not of insulin sensitivity, and that other tissues or organs might contribute to the insulin resistance in global pink1 KO mice. Further studies are warranted to examine the possible role of mitophagy in other INS target tissues (i.e., skeletal muscle, liver, and white adipose tissue) in the generation of insulin resistance [Citation46].
in summary, our data suggest that the role of mitophagy is different from general autophagy in regulating adipose tissue and whole-body energy metabolism. Our data show that mitophagy plays a crucial role in maintaining the BAT function and energy metabolism of the whole body. pink1 deficiency increased NLRP3 to induce white-like adipocytes from BAPs, and this led to brown fat dysfunction. Therefore, in addition to its role in Parkinson disease, PINK1 may act as a target for managing metabolic diseases associated with obesity. In particular, the transcriptional function of NLRP3 may be an unexpected, but quite specific therapeutic target for metabolic diseases.
Materials and methods
Mice
All mice were housed in ambient RT (22 ± 1°C) with 12/12 h light-dark cycles and free access to water and food. Eight-week-old male mice in each group were given RD or HFD (Research Diets, Inc, D12492) and were sacrificed after feeding for 8 weeks. All animal experiment protocols were approved by the Institutional Animal Care and Use Committee of the Asan Institute for Life Sciences, Seoul, Korea.
Generation of KO mouse lines
The pink1 KO mouse line has been described previously [Citation47]. Breeding pairs were obtained from the Mary Lyon Centre at the MRC Harwell Institute, Oxfordshire, UK. pink1 nlrp3 double-KO mice were generated using the TALEN method, as described elsewhere [Citation48] (Table S1). The pink1 casp1 double-KO mice strain was generated by crossing pink1 KO and casp1 KO mice (Jackson Laboratory, 016621). Myeloid cell-specific and brown fat-specific pink1 KO mice were generated by crossing floxed pink1 mice (European Mouse Mutant Archive, EM:07320) with Lyz2 (Jackson Laboratory, 004781) and Ucp1 Cre mice (Jackson Laboratory, 024670), respectively. First, WT/del (F1) and WT/flox (F1) mice were generated by cross-breeding WT/flox mice and Cre mice. Then, del/del, flox/flox, and WT/WT mice were generated by cross-breeding within the F1 generation.
atg7 flox/flox mice of C57BL/6 background were kindly provided by Dr. Komatsu at Niigata University, Japan. atg7 flox/flox mice and Fabp4 Cre mice (Jackson Laboratory, 005069) were crossed to produce adipose-atg7 KO mice [Citation8].
Indirect calorimetry
VO2, VCO2, RER, and locomotor activity were assessed using an eight-chamber Oxymax system (Columbus Instruments). Mice were placed in the chambers at 23°C with free access to food and water and acclimated for more than 50 min before measurement. EE was calculated as (3.815 + 1.232 × RER) × VO2/lean mass.
Electron microscopy
BAT was cut into 1-mm3 fragments, washed in fresh 0.1 M phosphate buffer (pH 7.4), and fixed in 2.5% glutaraldehyde in the same buffer at RT for 4 h. After three times of wash in fresh 0.1 M phosphate buffer (pH 7.4) for 10 min, tissues were fixed in 1% OsO4 for 1 h at RT and washed three times in 0.1 M phosphate buffer for 10 min. Tissues were embedded in Epon (Sigma-Aldrich, 45,345), according to standard techniques, after dehydration with ethyl alcohol and propylene oxide. Ultrathin sections (60 nM) were cut from the blocks. The sections were collected and stained with uranyl acetate, followed by lead citrate, and then observed using a JEM 1400 transmission electron microscope (JEOL Ltd).
Cold tolerance test
Solitary caged mice were kept at 4°C for 6 h, and a control experiment was carried out at RT. Afterward, rectal temperatures were measured using a microprobe thermometer (Physitemp).
Western blot analysis
BAT and primary brown adipocytes were lysed using tissue extraction reagent I (Invitrogen, FNN0071) or NP40 cell lysis buffer (Invitrogen, FNN0021) containing protease/phosphatase inhibitor cocktail (Roche, 04693132001) and 1 mM phenylmethylsulfonyl fluoride (Sigma-Aldrich, P7626). Soluble proteins (10 μg per lane) were separated on a 12% SDS polyacrylamide gel and blotted on a nitrocellulose membrane (GE Healthcare, 1060004). Membranes were incubated with primary antibody at 4°C overnight, and horseradish peroxidase-conjugated secondary antibody at RT for 1 h in 5% skim milk (Carl Roth, T145.2) with TBST, visualized using an chemiluminescence detection system (NLRP3: GeneDepot, W3680-010; CASP1: Biomax, BWD0100; UCP1 and ACTB: Biomax, BWP0200), and exposed to film (Agfa, CP-BU NEW). To determine the available linear range of western blots, the exposure time was collected in every experiment.
Anti-UCP1 (1:10,000 dilution) antibody was purchased from Abcam (ab10983). Anti-NLRP3 (1:1,000 dilution) and anti-CASP1 (1:2,000 dilution) antibodies were purchased from Adipogen (AG-20B-0014-C100, AG-20B-0042-C100). Anti-ACTB (1:20,000 dilution) antibody was purchased from Sigma-Aldrich (A5441). The signal intensities of protein bands were quantified with the ImageJ software (NIH) and normalized using the intensity of the loading control ACTB.
Real-time polymerase chain reaction (PCR) analysis
Total RNA (2 µg) was reverse-transcribed using RevertAid First Strand cDNA Synthesis Kit (Thermo Scientific, K1622). Tbp was used as internal control. The primers were designed on the basis of nucleotide sequences in the GenBank database (Table S2). The relative amounts of the mRNAs were calculated using the relative Ct method (PerkinElmer Wallace).
Measurement of plasma metabolic parameters
Plasma glucose concentration was measured using a glucose analyzer (Yellow Springs, YSI 2300). Plasma INS was determined via radioimmunoassay (Linco Research, EZRMI-13 K). Plasma free fatty acid (FFA) concentration was assayed using an enzymatic assay kit (Wako Chemical, C1057).
Measurement of INS (insulin) sensitivity
Following an overnight fast, a 2-h hyperinsulinemic-euglycemic clamp study was carried out with a primed-continuous infusion of human INS (Humulin, Eli Lilly) at a rate of 5 mU/kg/min, with 150 mU/kg body weight priming. Blood samples (20 µl) were collected at 20 min intervals for immediate measurement of plasma glucose concentration, and 20% glucose was infused at variable rates to maintain plasma glucose at the basal concentration (~120 mg/dl) [Citation49]. The ITT was performed in mice fasted for 5 h in the morning. Mice were intraperitoneally injected with 0.75 mU/kg of regular human INS. Blood was collected before injection and at 15, 30, 60, 90, and 120 min after injection for the measurement of blood glucose level. The glucose disappearance rate for the ITT (kITT) was calculated using the formula kITT (%/min) = 0.693/t½, where t½ is derived from the slope of the plasma glucose concentration from 0 to 15 min after INS injection [Citation50].
Immunohistochemistry of UCP1
UCP1 immunostaining was calibrated on a Benchmark XT staining module (Ventana Medical Systems). The slides were warmed to 60°C for 1 h and then processed with a fully automated protocol. After the sections were dewaxed and rehydrated, CC1 (Ventana Medical Systems) pre-treatment was carried out for 60 min for antigen retrieval. Tissue sections were stained with rabbit polyclonal anti-UCP1 antibody (1:500; Abcam, ab10983) at 37°C for 36 min, and then with secondary Discovery UltraMap anti-rabbit horseradish peroxidase antibody (Ventana Medical Systems) at 37°C for 36 min. Detection was performed using the UltraView DAB (3,3ʹ-diaminobenzidine) detection kit (Ventana Medical Systems). Counterstaining was conducted for 4 min using hematoxylin (Ventana Medical Systems). After completion of the automated staining protocol, the slides were dehydrated in 90% ethanol for 1 min, followed by 100% ethanol for 1 min. Before cover-slipping, the sections were cleared in xylene for 1 min and mounted with a synthetic mountant (Thermo Fisher Scientific). The samples were visualized using a BX53 upright microscope (Olympus) and CellSens software (Olympus).
Isolation of BAPs and culture
BAPs were isolated from interscapular BAT, as previously described [Citation25]. Cells were grown to 70%–80% confluence before passaging every week.
Measurement of mitochondrial ROS generation
Mitochondria-specific ROS generation was monitored by fluorescence-activated cell sorting analysis using the MitoSox Red fluorescent dye (Molecular Probes, ENZ-51011).
Differentiation into brown adipocytes
Confluent cultures of BAPs were exposed to α-MEM (Welgene; LM008-01) differentiation medium containing dexamethasone (1 µM; Sigma-Aldrich, D4902), INS/insulin (850 nM; Sigma-Aldrich, I6634), isobutylmethylxanthine (0.5 mM; Sigma-Aldrich, 5879), indomethacin (125 µM; Sigma-Aldrich, I7378), rosiglitazone (1 µM; Cayman Chemical, 71740), T3 (1 nM; Sigma-Aldrich, T2877), and 10% FBS (Gibco Life Technologies, 16000044). Three days after differentiation, the cells were maintained in media containing INS (850 nM), rosiglitazone (1 µM), T3 (1 nM), and 10% FBS until they were ready for collection.
Phase-contrast microscopy
Cell images were acquired using an image capture system, consisting of an IX70 inverted microscope (Olympus).
Oil Red O staining
Differentiated brown adipocytes were fixed with 10% formaldehyde for 20 min. After washing with PBS, the cells were stained with Oil Red O solution (Sigma-Aldrich, O1516) for 30 min. The slides were then washed several times with water, and excess water was evaporated by heating the stained cultures to approximately 32°C.
Dual-energy X-ray absorptiometry (DEXA)
Body composition was determined using the INSIGHT VET DXA (Osteosys) at 16 weeks with or without HFD exposure. To ensure good immobilization, mice were anesthetized with an intraperitoneal injection of 40 mg/kg ketamine and 0.8 mg/kg medetomidine. The weights of lean tissue and fat tissue were provided by the scanner, as previously reported [Citation51].
Image analysis
The images of in vitro confocal imaging, in vivo H&E cross-sections, and EM images were quantified using ImageJ (NIH). Cell size was averaged from 10 representative images per H&E-stained sections or EM images from four mice. For measurement of in vitro lipid droplet area, 10 random images were examined per sample with four samples per condition.
Detection of mitophagy using mt-Keima
For mitophagy evaluation [Citation29], mt-Keima lentivirus-infected BAPs were treated with 10 µM carbonyl cyanide m-chlorophenylhydrazone (Sigma-Aldrich, C2759) and 2 µM oligomycin (Sigma-Aldrich, O4876), or serum-free media, and analyzed using a confocal microscope (LSM780, Carl Zeiss). Images of fluorescent protein mt-Keima (emission at 588–633 nm) were taken at excitation wavelengths of 458 and 561 nm, and the GFP-fused protein (emission at 510 nm) was imaged using a 488 nm excitation filter.
Inflammasome activation
BAPs (1.0 × 10⁶ cells per well) or BMDMs (1.0 × 10⁶ cells per well) from WT or pink1 KO mice were plated in 12-well plates and then primed for 4 h with 100 ng/ml LPS (Sigma-Aldrich, L6529) in RPMI 1640 medium (Welgene, LM011-01) containing 10% FBS and antibiotics. For the last 30 min, the medium was replaced with RPMI 1640 medium supplemented with 5 mM ATP (Sigma-Aldrich, A6419). IL1B in the media was quantified using an ELISA kit (R&D Systems, DY-401).
Isolation of BMDMs
Bone marrow cells were flushed from the femurs and tibias of mice and then depleted of RBCs using RBC lysis buffer (Sigma-Aldrich, R7757). The cells were then cultured in Dulbecco’s modified Eagle’s medium (DMEM; Welgene, LM001-05) supplemented with 10% FBS and 20 ng/ml murine CSF1 (Peprotech, 315–02). Non-adherent cells were carefully removed, and fresh medium was added every 2 d. On day 6, the cells were collected for experiments [Citation52].
Plasmids and lentiviruses
To produce GFP–Prkn, – Nlrp3, – Pink1, and mt-Keima lentiviruses, GFP–Prkn, – Nlrp3, – Pink1, and mt-Keima (Addgene, 72342, Richard Youle) were subcloned into the pCDH-MCS lentiviral vector (System Biosciences, CD513B-1), and the plasmids were transfected in Lenti-X 293T cells (Clontech, 632180) along with packaging plasmids pMDLg/pRRE (Addgene, 12251, Didier Trono) and pRSV-Rev (Addgene, 12253, Didier Trono) and envelope plasmid pCMV-VSV-G (Addgene, 8454, Bob Weinberg) using Lipofectamine 3000 (Invitrogen, L30000015).
ChIP assay
The ChIP assay was performed with a ChIP-IT express kit (Active Motif, 53014). Undifferentiated BAPs (1 × 10⁷) or differentiated BAPs (1 × 10⁶) from WT or pink1 KO mice were fixed with 1% formaldehyde at RT for 15 min to allow cross-linking of DNA with proteins, and glycine solution (final concentration of 0.125 M) was added to stop the cross-linking reaction. The fixed BAPs were lysed using a Dounce homogenizer to induce nuclei release. After sonication, the chromatins were immunoprecipitated overnight at 4°C with 2 µg anti-NLRP3 (AdipoGen Life Sciences, AG-20B-0014) and protein G magnetic beads. The chromatins were then washed and eluted from the protein G magnetic beads using buffers supplied with the kit DNA was purified using a ChIP DNA Clean and Concentration kit (Zymo Research, D5201) and analyzed by quantitative PCR (Table S2).
Statistical analysis
Data are expressed as mean ± standard error of the mean (SEM). Unpaired two-tailed Student’s t-tests were used to compare variables between the two groups. One-way ANOVA was used to compare multiple groups. For the comparison of multiple measurements made at different time points, one-way repeated-measures ANOVA was used. Bonferroni correction was applied for post hoc analysis of the multiple comparisons. All statistical tests were conducted according to two-sided sample sizes and were determined on the basis of previous experiments using similar methods. For all experiments, all stated replicates are biological replicates. Statistical analysis and graphing were performed using IBM SPSS Statistics version 22.0 (IBM Corp.) or GraphPad Prism 7 (GraphPad Software).
Supplemental Material
Download Zip (123 MB)Acknowledgments
We thank the Mary Lyon Centre at the MRC Harwell Institute, Oxfordshire, UK, for their donation of pink1 KO mice. We also thank the Confocal Microscopy Core Facility at the Convergence Medicine Research Center (CREDIT), Asan Medical Center, for support and instrumentation, and Dr. Joon Seo Lim from the Scientific Publications Team at Asan Medical Center for his editorial assistance in preparing this manuscript. We thank Hwa Jung Kim from the University of Ulsan College of Medicine for assistance with statistical analysis.
Disclosure statement
No potential conflict of interest was reported by the authors.
Additional information
Funding
References
- Cypess AM, Lehman S, Williams G, et al. Identification and importance of brown adipose tissue in adult humans. N Engl J Med. 2009;360(15):1509–1517. . PMID:19357406
- Peirce V, Carobbio S, Vidal-Puig A. The different shades of fat. Nature. 2014;510(7503):76–83. . PMID:24899307
- Lowell BB, Spiegelman BM. Towards a molecular understanding of adaptive thermogenesis. Nature. 2000;404(6778):652–660. . PMID:10766252
- Cypess AM, White AP, Vernochet C, et al. Anatomical localization, gene expression profiling and functional characterization of adult human neck brown fat. Nat Med. 2013;19(5):635–639. . PMID:23603815
- Harms M, Seale P. Brown and beige fat: development, function and therapeutic potential. Nat Med. 2013;19(10):1252–1263. . PMID:24100998
- Kajimura S, Seale P, Spiegelman BM. Transcriptional control of brown fat development. Cell Metab. 2010;11(4):257–262. . PMID:20374957
- Zhang Y, Goldman S, Baerga R, et al. Adipose-specific deletion of autophagy-related gene 7 (atg7) in mice reveals a role in adipogenesis. Proc Natl Acad Sci U S A. 2009;106(47):19860–19865. . PMID:19910529
- Singh R, Xiang Y, Wang Y, et al. Autophagy regulates adipose mass and differentiation in mice. J Clin Invest. 2009;119(11):3329–3339. . PMID:19855132
- Altshuler-Keylin S, Shinoda K, Hasegawa Y, et al. Beige adipocyte maintenance is regulated by autophagy-induced mitochondrial clearance. Cell Metab. 2016;24(3):402–419. . PMID:27568548
- Green DR, Galluzzi L, Kroemer G. Mitochondria and the autophagy-inflammation-cell death axis in organismal aging. Science. 2011;333(6046):1109–1112. . PMID:21868666
- Youle RJ, Narendra DP. Mechanisms of mitophagy. Nat Rev Mol Cell Biol. 2011;12(1):9–14. . PMID:21179058
- Jang JY, Blum A, Liu J, et al. The role of mitochondria in aging. J Clin Invest. 2018;128(9):3662–3670. . PMID:30059016
- Franks PW, Scheele C, Loos RJ, et al. Genomic variants at the PINK1 locus are associated with transcript abundance and plasma nonesterified fatty acid concentrations in European whites. Faseb J. 2008;22(9):3135–3145. . PMID:18495756
- Schroder K, Zhou R, Tschopp J. The NLRP3 inflammasome: a sensor for metabolic danger? Science. 2010;327(5963):296–300. . PMID:20075245
- Strowig T, Henao-Mejia J, Elinav E, et al. Inflammasomes in health and disease. Nature. 2012;481(7381):278–286. . PMID:22258606
- Davis BK, Wen H, Ting JP. The inflammasome NLRs in immunity, inflammation, and associated diseases. Annu Rev Immunol. 2011;29707–29735. DOI:10.1146/annurev-immunol-031210-101405. PMID:21219188
- Goldberg EL, Dixit VD. Drivers of age-related inflammation and strategies for healthspan extension. Immunol Rev. 2015;265(1):63–74. . PMID:25879284
- Nakahira K, Haspel JA, Rathinam VA, et al. Autophagy proteins regulate innate immune responses by inhibiting the release of mitochondrial DNA mediated by the NALP3 inflammasome. Nat Immunol. 2011;12(3):222–230. . PMID:21151103
- Zhou R, Yazdi AS, Menu P, et al. A role for mitochondria in NLRP3 inflammasome activation. Nature. 2011;469(7329):221–225. . PMID:21124315
- Bruchard M, Rebe C, Derangere V, et al. The receptor NLRP3 is a transcriptional regulator of TH2 differentiation. Nat Immunol. 2015;16(8):859–870. . PMID:26098997
- Gautier CA, Kitada T, Shen J. Loss of PINK1 causes mitochondrial functional defects and increased sensitivity to oxidative stress. Proc Natl Acad Sci U S A. 2008;105(32):11364–11369. . PMID:18687901
- Shimizu I, Aprahamian T, Kikuchi R, et al. Vascular rarefaction mediates whitening of brown fat in obesity. J Clin Invest. 2014;124(5):2099–2112. . PMID:24713652
- Feldmann HM, Golozoubova V, Cannon B, et al. UCP1 ablation induces obesity and abolishes diet-induced thermogenesis in mice exempt from thermal stress by living at thermoneutrality. Cell Metab. 2009;9(2):203–209. . PMID:19187776
- Zhu J, Wang KZ, Chu CT. After the banquet: mitochondrial biogenesis, mitophagy, and cell survival. Autophagy. 2013;9(11):1663–1676. . PMID:23787782
- Cannon B, Nedergaard J. Cultures of adipose precursor cells from brown adipose tissue and of clonal brown-adipocyte-like cell lines. Methods Mol Biol. 2001;155213–155224. DOI:10.1385/1-59259-231-7:213. PMID:11293074
- Oh J, Lee YD, Wagers AJ. Stem cell aging: mechanisms, regulators and therapeutic opportunities. Nat Med. 2014;20(8):870–880. . PMID:25100532
- Graja A, Schulz TJ. Mechanisms of aging-related impairment of brown adipocyte development and function. Gerontology. 2015;61(3):211–217. . PMID:25531079
- Ferree AW, Trudeau K, Zik E, et al. MitoTimer probe reveals the impact of autophagy, fusion, and motility on subcellular distribution of young and old mitochondrial protein and on relative mitochondrial protein age. Autophagy. 2013;9(11):1887–1896. . PMID:24149000
- Sun N, Malide D, Liu J, et al. A fluorescence-based imaging method to measure in vitro and in vivo mitophagy using mt-Keima. Nat Protoc. 2017;12(8):1576–1587. . PMID:28703790
- Stienstra R, Joosten LA, Koenen T, et al. The inflammasome-mediated caspase-1 activation controls adipocyte differentiation and insulin sensitivity. Cell Metab. 2010;12(6):593–605. . PMID:21109192
- Wree A, Eguchi A, McGeough MD, et al. NLRP3 inflammasome activation results in hepatocyte pyroptosis, liver inflammation, and fibrosis in mice. Hepatology. 2014;59(3):898–910. . PMID:23813842
- Shahzad K, Bock F, Dong W, et al. Nlrp3-inflammasome activation in non-myeloid-derived cells aggravates diabetic nephropathy. Kidney Int. 2015;87(1):74–84. . PMID:25075770
- Linhart HG, Ishimura-Oka K, DeMayo F, et al. C/EBPalpha is required for differentiation of white, but not brown, adipose tissue. Proc Natl Acad Sci U S A. 2001;98(22):12532–12537. . PMID:11606718
- Yang J, Croniger CM, Lekstrom-Himes J, et al. Metabolic response of mice to a postnatal ablation of CCAAT/enhancer-binding protein alpha. J Biol Chem. 2005;280(46):38689–38699. . PMID:16166091
- Rosen ED, Hsu CH, Wang X, et al. C/EBPalpha induces adipogenesis through PPARgamma: a unified pathway. Genes Dev. 2002;16(1):22–26. . PMID:11782441
- Elberg G, Gimble JM, Tsai SY. Modulation of the murine peroxisome proliferator-activated receptor gamma 2 promoter activity by CCAAT/enhancer-binding proteins. J Biol Chem. 2000;275(36):27815–27822. . PMID:10862621
- Wu Z, Rosen ED, Brun R, et al. Cross-regulation of C/EBP alpha and PPAR gamma controls the transcriptional pathway of adipogenesis and insulin sensitivity. Mol Cell. 1999;3(2):151–158. . PMID:10078198
- Qiao L, Maclean PS, Schaack J, et al. C/EBPalpha regulates human adiponectin gene transcription through an intronic enhancer. Diabetes. 2005;54(6):1744–1754. . PMID:15919796
- Sliter DA, Martinez J, Hao L, et al. Parkin and PINK1 mitigate STING-induced inflammation. Nature. 2018;561(7722):258–262. . PMID:30135585
- Lu Y, Fujioka H, Joshi D, et al. Mitophagy is required for brown adipose tissue mitochondrial homeostasis during cold challenge. Sci Rep. 2018;8(1):8251. . PMID:29844467
- Mottillo EP, Desjardins EM, Crane JD, et al. Lack of adipocyte AMPK exacerbates insulin resistance and hepatic steatosis through brown and beige adipose tissue function. Cell Metab. 2016;24(1):118–129. . PMID:27411013
- Lu X, Altshuler-Keylin S, Wang Q, et al. Mitophagy controls beige adipocyte maintenance through a Parkin-dependent and UCP1-independent mechanism. Sci Signal. 2018;11(527):eaap8526. . PMID:29692364
- Wang W, Seale P. Control of brown and beige fat development. Nat Rev Mol Cell Biol. 2016;17(11):691–702. . PMID:27552974
- Swanson KV, Deng M, Ting JP. The NLRP3 inflammasome: molecular activation and regulation to therapeutics. Nat Rev Immunol. 2019;19(8):477–489. . PMID:31036962
- Townsend KL, Tseng YH. Brown fat fuel utilization and thermogenesis. Trends Endocrinol Metab. 2014;25(4):168–177. . PMID:24389130
- Petersen MC, Shulman GI. Mechanisms of insulin action and insulin resistance. Physiol Rev. 2018;98(4):2133–2223. . PMID:30067154
- Xiong H, Wang D, Chen L, et al. Parkin, PINK1, and DJ-1 form a ubiquitin E3 ligase complex promoting unfolded protein degradation. J Clin Invest. 2009;119(3):650–660. . PMID:19229105
- Sung YH, Baek IJ, Kim DH, et al. Knockout mice created by TALEN-mediated gene targeting. Nat Biotechnol. 2013;31(1):23–24. PMID:23302927
- Hong EG, Ko HJ, Cho YR, et al. Interleukin-10 prevents diet-induced insulin resistance by attenuating macrophage and cytokine response in skeletal muscle. Diabetes. 2009;58(11):2525–2535. . PMID:19690064
- Masi LN, Martins AR, Crisma AR, et al. Combination of a high-fat diet with sweetened condensed milk exacerbates inflammation and insulin resistance induced by each separately in mice. Sci Rep. 2017;7(1):3937. . PMID:28638152
- Gargiulo S, Gramanzini M, Megna R, et al. Evaluation of growth patterns and body composition in C57Bl/6J mice using dual energy X-ray absorptiometry. Biomed Res Int. 2014:2014253067. DOI:10.1155/2014/253067. PMID:25110666
- Mao K, Chen S, Chen M, et al. Nitric oxide suppresses NLRP3 inflammasome activation and protects against LPS-induced septic shock. Cell Res. 2013;23(2):201–212. . PMID:23318584