
 ?Mathematical formulae have been encoded as MathML and are displayed in this HTML version using MathJax in order to improve their display. Uncheck the box to turn MathJax off. This feature requires Javascript. Click on a formula to zoom.
ABSTRACT
Macroautophagy/autophagy is an intracellular process involved in the breakdown of macromolecules and organelles. Recent studies have shown that PKD2/PC2/TRPP2 (polycystin 2, transient receptor potential cation channel), a nonselective cation channel permeable to Ca2+ that belongs to the family of transient receptor potential channels, is required for autophagy in multiple cell types by a mechanism that remains unclear. Here, we report that PKD2 forms a protein complex with BECN1 (beclin 1), a key protein required for the formation of autophagic vacuoles, by acting as a scaffold that interacts with several co-modulators via its coiled-coil domain (CCD). Our data identified a physical and functional interaction between PKD2 and BECN1, which depends on one out of two CCD domains (CC1), located in the carboxy-terminal tail of PKD2. In addition, depletion of intracellular Ca2+ with BAPTA-AM not only blunted starvation-induced autophagy but also disrupted the PKD2-BECN1 complex. Consistently, PKD2 overexpression triggered autophagy by increasing its interaction with BECN1, while overexpression of PKD2D509V, a Ca2+ channel activity-deficient mutant, did not induce autophagy and manifested diminished interaction with BECN1. Our findings show that the PKD2-BECN1 complex is required for the induction of autophagy, and its formation depends on the presence of the CC1 domain of PKD2 and on intracellular Ca2+ mobilization by PKD2. These results provide new insights regarding the molecular mechanisms by which PKD2 controls autophagy.
Abbreviations: ADPKD: autosomal dominant polycystic kidney disease; ATG: autophagy-related; ATG14/ATG14L: autophagy related 14; Baf A1: bafilomycin A1; BCL2/Bcl-2: BCL2 apoptosis regulator; BCL2L1/BCL-XL: BCL2 like 1; BECN1: beclin 1; CCD: coiled-coil domain; EBSS: Earle’s balanced salt solution; ER: endoplasmic reticulum; GAPDH: glyceraldehyde-3-phosphate dehydrogenase; GFP: green fluorescent protein; GOLGA2/GM130: golgin A2; GST: glutathione s-transferase; LAMP1: lysosomal associated membrane protein 1; MAP1LC3/LC3: microtubule associated protein 1 light chain 3; MTORC1: mechanistic target of rapamycin kinase complex 1; NBR1: NBR1 autophagy cargo receptor; PIK3C3/VPS34: phosphatidylinositol 3-kinase catalytic subunit type 3; PKD2/PC2: polycystin 2, transient receptor potential cation channel; RTN4/NOGO: reticulon 4; RUBCN/RUBICON: rubicon autophagy regulator; SQSTM1/p62: sequestosome 1; UVRAG: UV radiation resistance associated; WIPI2: WD repeat domain, phosphoinositide interacting 2
Introduction
Autophagy is a cellular recycling mechanism for macromolecules and organelles that promotes maintenance of cell homeostasis [Citation1]. Indeed, autophagy has a protective role against stressful stimuli such as nutrient deprivation, microorganism infection, protein misfolding and mechanical stress, among others [Citation2,Citation3]. The molecular mechanism of autophagy is highly conserved from yeast to mammals and relies on sequestration of cargo into double-membrane vesicles called autophagosomes [Citation4]. To complete the degradation of the cargo, the autophagosome fuses with a lysosome, an organelle that contains a low lumenal pH and several hydrolytic enzymes [Citation5]. Autophagosomes are formed when the phosphatidylinositol moieties of specific membrane domains are phosphorylated by the class-III phosphatidylinositol (PtdIns) 3-kinase complex (PtdIns3K) [Citation6]. The modification of phosphatidylinositol functions as a signal to recruit autophagy-related (ATG) proteins harboring PX- or FYVE- domains [Citation7,Citation8]. One crucial component of the PtdIns3K complex is the protein BECN1 (beclin 1), the mammalian ortholog of yeast Vps30/Atg6 [Citation9]. BECN1 is a scaffolding protein that harbors multiple interacting domains: an evolutionarily conserved domain (ECD) between residues 244–377, which interacts with PIK3C3/VPS34, the catalytic subunit of the PtdIns3K [Citation10]; a coiled-coil domain (CCD) between residues 144–269, which binds to co-activators (ATG14, UVRAG and AMBRA1) [Citation11–14] and co-repressors (RUBCN) of the PtdIns3K activity [Citation15]; and a BH3-domain between the residues 114–123 that interacts with BCL2 or BCL2L1/BCL-XL, leading to the sequestration and inactivation of BECN1 [Citation16,Citation17]. To form the complex, BECN1 must adopt an active conformation, such as following the ULK1-mediated phosphorylation at Ser15, which in turn is inactivated by MTORC1 [Citation18]. Indeed, the chemical compound, rapamycin, and starvation, classic autophagic stimuli, both inactivate MTORC1 [Citation2,Citation19].
PKD2 (polycystin 2, transient receptor potential cation channel) is a mechanosensor Ca2+ channel involved in protecting cardiac and renal tissues [Citation20–22], as well as in the modulation of renal cell volume [Citation23]. PKD2 contains six transmembrane domains, with both amino-terminal and carboxy-terminal tails oriented toward the cytoplasm [Citation24]. The amino-terminal tail is structurally highly disorganized, but it has been shown that the first 223 residues are important to decrease PKD2 activity by an inhibitory self-interaction [Citation25,Citation26]. Within the carboxy-terminal tail there are two well-characterized domains: an EF-hand for Ca2+ binding, between residues 719–798, and a coiled-coil domain, CCD, between residues 830–872, hereafter referred to as CC2, that allows the interaction of PKD2 with other CCD-containing proteins, such as PKD1/PC1 (polycystin 1, transient receptor potential channel interacting) [Citation25,Citation27]. Recent studies have also reported the existence of another CCD within the EF-hand sequence, hereafter referred as CC1, between residues 719–796. However, its role within PKD2 remains to be elucidated [Citation28]. Furthermore, recent studies have shown that PKD2 is required for autophagy [Citation29,Citation30]. Consistently, we have previously shown that PKD2 is required for autophagy induced by hyperosmotic stress in colon, HCT116, and cervical, HeLa, cancer cell lines [Citation31]. Additionally, it has been shown that PKD2 is required for fluid flow- and starvation-induced autophagy in renal cells and cardiomyocytes, respectively [Citation23]. Although some of these studies have shown that downregulation of PKD2 reduces autophagy by increasing MTORC1 activity, PKD2 overexpression failed to modulate MTORC1 despite the increase in autophagy [Citation23,Citation30–32]. Thus, additional, MTORC1-independent mechanisms might explain the role of PKD2 in the regulation of autophagy. Interestingly, PKD2 is normally found at phagophore assembly sites, such as mitochondria-associated membranes, MAMs, at the endoplasmic reticulum and the primary cilium [Citation33,Citation34]. Indeed, it has been shown that when autophagy is induced, BECN1 and its interacting partners re-localize to these specialized membrane domains [Citation35,Citation36].
As PKD2 and BECN1 localize in the same specific cellular subdomains and harbor possible interacting domains within both structures, such as the CCDs, we evaluated whether PKD2 interacts with BECN1 to induce autophagy. Here, we show that PKD2 is necessary for basal, starvation-, and rapamycin-induced autophagy. In addition, our data indicate that PKD2 participates in a multi-protein complex, directly interacting with BECN1. The formation of this complex increases when autophagy is enhanced, such as following starvation or in conditions of PKD2 overexpression. Moreover, we show that the CC1 region in PKD2 is required both for PKD2-BECN1 complex formation and autophagy induction. Finally, our results suggest that PKD2 requires its Ca2+ channel activity to form a complex with BECN1.
Results
PKD2 is required for basal and starvation- or rapamycin-induced autophagy
To study the contribution of PKD2 to basal autophagy, PKD2 was downregulated following transfection with specific siRNAs targeting PKD2 in HeLa cells. To confirm the specificity of the observed effect, we silenced PKD2 using two different siRNA sequences, siPKD2#1 and siPKD2#2, in the presence or absence of the chemical inhibitor of autophagic flux bafilomycin A1 (Baf A1) [Citation37,Citation38]. As expected, the levels of a specific marker of autophagic vesicles, the conjugated form of MAP1LC3/LC3 (microtubule associated protein 1 light chain 3), LC3-II [Citation39,Citation40], increased when cells were exposed to Baf A1 (). However, downregulation of PKD2 blunted Baf A1-induced LC3-II accumulation (). Consistently, we observed that downregulation of PKD2 increased the levels of the autophagy receptor protein SQSTM1/p62 (sequestosome 1) (), which is degraded when autophagic flux increases [Citation38,Citation41]. Interestingly, when we evaluated the levels of another SQSTM1-like protein, such as NBR1, we did not see its accumulation after downregulation of PKD2, indicating that SQSTM1 is a specific receptor for PKD2-dependent autophagy (Fig. S1A and S1B). These data suggest that PKD2 is required for autophagy induction under basal conditions ().
Figure 1. PKD2 is required for basal and induced autophagy. Role of PKD2 in basal autophagy (A-D). HeLa cells were transfected with a control siRNA (siUNR) or with two different siRNAs sequences targeting PKD2 (siPKD2#1 and siPKD2#2) for 24 h in presence or absence of 30 nM Baf A1. Protein extracts were prepared, resolved by SDS-PAGE and PKD2 and LC3 detected by western blot. GAPDH levels were used as loading controls. Representative gels are shown in (A) and quantified in the graphic in (B) (mean ± SEM, n = 3, ***p < 0.001 vs. siUNR; &&&p < 0.001 vs. siUNR + Baf A1). (C) HeLa cells were transfected with siPKD2#2 for 24 h and SQSTM1 levels evaluated by western blot. Representative gels are shown in (C) and relative levels of SQSTM1 normalized by the loading control GAPDH (D) (mean ± SEM, n = 3, *p < 0.05 vs. siUNR). Role of PKD2 in starvation- and rapamycin-induced autophagy (E-I). HeLa cells were transfected with a control siRNA (siUNR) or with siRNAs targeting for PKD2 (siPKD2) for 24 h. Then, cells were starved with EBSS or treated with 1 μM rapamycin for 2 h and endogenous LC3 puncta were identified by immunofluorescence. Representative pictures are shown in (E) and quantification of the percentage of autophagic cells is shown in (F). Nuclei were dyed with 10 μg/mL Hoechst 33342 (mean ± SEM, n = 3, **p < 0.01, ***p < 0.001 vs. Co; &&p < 0.01 vs. Co + Rapa/EBSS). HeLa cells were transfected as in (E) and starved with EBSS for 2 h. Protein extracts were resolved by SDS-PAGE and LC3-I to LC3-II conversion, SQSTM1 and PKD2 evaluated by western blot. Representative gels are shown in (G) and immunoblot quantification of LC3-II and SQSTM1 are represented in (H) and (I), respectively (mean ± SEM, n = 3, **p < 0.01 vs. Co; +++p < 0.001 vs. EBSS). GAPDH levels were used as loading control. PKD2 overexpression is sufficient to induce autophagy (J-M). HeLa cells were transfected with GFP-WIPI2 and then PKD2 transduced with AdPKD2 for 24 h. WIPI2 dots formation was evaluated by microscopy and incubation with EBSS for 30 min was used as positive control. Representative pictures are shown in (J) and the percentage of WIPI2-positive cells is depicted in (K), (mean ± SEM, n = 3, **p < 0.01 ***p < 0.001 vs. Co). (L) PKD2 was overexpressed as in (J) in the presence or absence of 30 nM Baf A1 and LC3-I to LC3-II conversion and PKD2 evaluated by western blot. Representative gels are shown in (L) and immunoblot quantification of LC3-II is depicted in (M) (mean ± SEM, n = 4, ***p < 0.001 vs. AdCo; &&p < 0.01 vs. AdCo + Baf A1; +++p < 0.001 vs. AdPKD2)
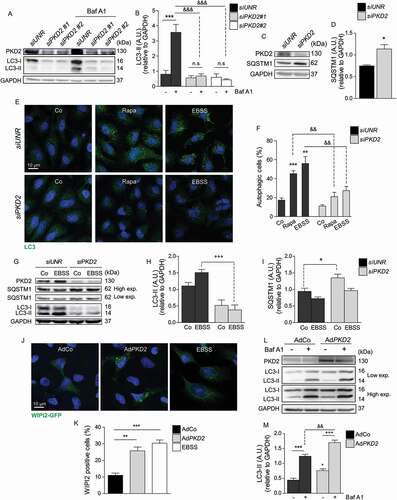
Given that autophagy is regulated by PKD2 under basal conditions, we studied the role of PKD2 following autophagy induction, such as following starvation- or rapamycin treatment in HeLa cells. Our results show that LC3 puncta accumulation induced both by nutrient deprivation with EBSS culture media or by treatment with the pharmacological inhibitor of MTORC1, rapamycin, was inhibited following downregulation of PKD2 in HeLa cells (). In addition, western blot assays showed that LC3-I to LC3-II conversion and SQSTM1 degradation were inhibited following nutrient deprivation when PKD2 levels were reduced (). These results were confirmed in HeLa cells, in which autophagy was induced by rapamycin under control conditions and following PKD2 downregulation. As expected, Baf A1 triggered accumulation of LC3-II in cells subjected to rapamycin. However, siPKD2-transfected cells did not show significant accumulation of LC3-II in the presence of Baf A1 (Fig. S1C and S1D). Moreover, since PKD2 is known to be located at the endoplasmic reticulum (ER), we assessed whether PKD2 is required for reticulophagy, a specialized type of autophagy in which portions of the ER are sequestered and degraded by the autophagic process. Reticulophagy was studied by colocalization of LAMP1 (lysosomal associated membrane protein 1; a lysosomal marker) and the RTN4/NOGO protein (an ER marker). Our results showed that starvation increased colocalization of LAMP1 and RTN4, which was prevented when PKD2 was downregulated with specific siRNAs (Fig. S1E and S1F). These data suggest that PKD2 is required for reticulophagy.
Given that downregulation of PKD2 impaired autophagy induction under starvation conditions or by inactivation of MTORC1 with rapamycin, we evaluated whether PKD2 overexpression was sufficient to induce autophagy. To this end, HeLa cells were transduced with an adenovirus coding for a wild-type form of PKD2 (AdPKD2) and autophagy was quantified. Our results show that PKD2 overexpression induced puncta formation of WIPI2 (WD repeat domain phosphoinositide interacting 2), which binds phosphatidylinositol 3-phosphate (PtdIns3P) in the nascent phagophore and autophagosome membranes [Citation42] (), indicating that PKD2 enhances autophagy by promoting one of the first steps of the process, such as phagophore formation. In addition, western blot assays showed that increased levels of PKD2 upregulate LC3-I to LC3-II conversion, which was exacerbated in the presence of Baf A1 (). Altogether, these data indicate that PKD2 is required for starvation- and rapamycin-induced autophagy and that PKD2 overexpression is sufficient to induce autophagy.
PKD2 forms a complex with BECN1
As shown in , PKD2 positively regulates autophagy. Furthermore, previous studies indicate that PKD2 and BECN1, an essential protein for the induction of autophagy, are localized at the same subcellular compartments [Citation33–36]. In addition, BECN1, together with PIK3C3, PIK3R4/VPS15 and ATG14, forms the PtdIns3K complex [Citation11–13,Citation15,Citation43]. Thus, we evaluated whether BECN1 formed a protein complex with PKD2 in HeLa cells. Our results indicate that PKD2 co-immunoprecipitated with BECN1, similarly to other positive and negative regulators of autophagy, which have previously been identified as BECN1 interactors, such as RUBCN, PIK3C3 and ATG14 () [Citation11,Citation13,Citation15]. This was shown not only in HeLa cells () but also in other cells types such as in the renal epithelial cell line HEK-293 and primary cell cultures of rat cardiomyocytes (Fig. S2A and S2B). Consistently, in HeLa cells, co-immunoprecipitation of PKD2 led to complex formation with BECN1 and the negative regulator of autophagy, RUBCN (). EBSS-mediated nutrient deprivation increased the interaction between PKD2 and BECN1, further indicating that induction of autophagy enhances formation of the PKD2-BECN1 complex (). Overexpression of PKD2, which was sufficient to induce autophagy (), increased the interaction between PKD2 and BECN1 (). In this condition, we did not observe important changes in RUBCN levels when compared to control conditions, suggesting that PKD2-induced autophagy was not caused by the loss in the interaction between BECN1 and RUBCN ().
Figure 2. PKD2 forms a protein complex with BECN1. Co-immunoprecipitation of endogenous BECN1 and PKD2 (A,B). Protein extracts were isolated from HeLa cells and BECN1 was immunoprecipitated with specific antibodies. Samples were resolved on SDS-PAGE and PKD2, RUBCN, PIK3C3, ATG14 and BECN1 were evaluated by western blot. IgG was used as control and representative gels are shown in (A) (n = 3). Co-immunoprecipitation with PKD2 antibodies and evaluation of PKD2, RUBCN and BECN1 by western blot using IgG as control (n = 3) (B). The formation of the PKD2-BECN1 complex depends on autophagy induction (C,D). HeLa cells were maintained in control medium, exposed to EBSS for 1 h (C) or infected with an adenovirus that overexpresses PKD2 (AdPKD2) for 24 h (D). Protein extracts were immunoprecipitated for BECN1 and samples resolved on SDS-PAGE to identify PKD2 (C), or PKD2 and RUBCN (D), by western blot. IgG was used as a control and representative gels are shown in (C) and (D) (n = 3). PKD2 interacts with the carboxy-terminal region of BECN1. The human recombinant proteins amino [1-265]- or carboxy [248-450]-terminal of BECN1 (500 ng) were immobilized on a nitrocellulose membrane and incubated with a supernatant containing the human recombinant carboxy-terminal [682–968] of PKD2 tagged to GST (GST-PKD2 C-term[682–968]). Incubation with recombinant GST or binding buffer was used as controls. Then, dot blot was performed using specific antibodies against GST. Red Ponceau staining of the membranes was used as loading control. Representative gels are shown in (E) (n = 3). Co-localization of PKD2 with BECN1. HeLa cells were transfected with a plasmid coding for full-length PKD2 (GFP-FL PKD2) and colocalization with endogenous BECN1 was evaluated by confocal microscopy. Nuclei were dyed with 10 mg/mL Hoechst 33342 and representative pictures are shown (F) (n = 3). Starvation-induced BECN1 puncta area is depicted in the graph in (G) and Mander’s colocalization is depicted in (H) (mean ± SEM, n = 3, *p < 0.05 **p < 0.01 vs. Co). Proximity Ligation Assay (PLA) between PKD2 and BECN1. HeLa cells were either maintained in control medium or stimulated with EBSS for 1 h. Close proximity (<40 nm) between PKD2 and BECN1 is detected as red dots and evaluated by fluorescence microscopy. Representative pictures are shown (I) (n = 3) and the number PLA puncta per cell is depicted in (J) (mean ± SEM, n = 3, *p < 0.05 vs. Co)
![Figure 2. PKD2 forms a protein complex with BECN1. Co-immunoprecipitation of endogenous BECN1 and PKD2 (A,B). Protein extracts were isolated from HeLa cells and BECN1 was immunoprecipitated with specific antibodies. Samples were resolved on SDS-PAGE and PKD2, RUBCN, PIK3C3, ATG14 and BECN1 were evaluated by western blot. IgG was used as control and representative gels are shown in (A) (n = 3). Co-immunoprecipitation with PKD2 antibodies and evaluation of PKD2, RUBCN and BECN1 by western blot using IgG as control (n = 3) (B). The formation of the PKD2-BECN1 complex depends on autophagy induction (C,D). HeLa cells were maintained in control medium, exposed to EBSS for 1 h (C) or infected with an adenovirus that overexpresses PKD2 (AdPKD2) for 24 h (D). Protein extracts were immunoprecipitated for BECN1 and samples resolved on SDS-PAGE to identify PKD2 (C), or PKD2 and RUBCN (D), by western blot. IgG was used as a control and representative gels are shown in (C) and (D) (n = 3). PKD2 interacts with the carboxy-terminal region of BECN1. The human recombinant proteins amino [1-265]- or carboxy [248-450]-terminal of BECN1 (500 ng) were immobilized on a nitrocellulose membrane and incubated with a supernatant containing the human recombinant carboxy-terminal [682–968] of PKD2 tagged to GST (GST-PKD2 C-term[682–968]). Incubation with recombinant GST or binding buffer was used as controls. Then, dot blot was performed using specific antibodies against GST. Red Ponceau staining of the membranes was used as loading control. Representative gels are shown in (E) (n = 3). Co-localization of PKD2 with BECN1. HeLa cells were transfected with a plasmid coding for full-length PKD2 (GFP-FL PKD2) and colocalization with endogenous BECN1 was evaluated by confocal microscopy. Nuclei were dyed with 10 mg/mL Hoechst 33342 and representative pictures are shown (F) (n = 3). Starvation-induced BECN1 puncta area is depicted in the graph in (G) and Mander’s colocalization is depicted in (H) (mean ± SEM, n = 3, *p < 0.05 **p < 0.01 vs. Co). Proximity Ligation Assay (PLA) between PKD2 and BECN1. HeLa cells were either maintained in control medium or stimulated with EBSS for 1 h. Close proximity (<40 nm) between PKD2 and BECN1 is detected as red dots and evaluated by fluorescence microscopy. Representative pictures are shown (I) (n = 3) and the number PLA puncta per cell is depicted in (J) (mean ± SEM, n = 3, *p < 0.05 vs. Co)](/cms/asset/7e93f41b-90c4-43d1-8c1a-4abb93fd1712/kaup_a_1782035_f0002_oc.jpg)
To gain further insights about the nature of this interaction and to identify the regions within BECN1 required for this interaction, we engineered recombinant amino (1-265)- and carboxy (248-450)-terminal constructs of human BECN1, both tagged to a 6xHis (6xHis-BECN1[1–265] and 6xHis-BECN1[248–450], respectively). The recombinant forms of BECN1 were immobilized on nitrocellulose membranes and incubated with the carboxy-terminal tail of human PKD2 (682–968) tagged to GST, GST-PKD2 C-term[682–968], because this region is known to be required for the interaction between PKD2 and its partners [Citation33,Citation44–46]. Dot blot assays revealed that BECN1[248–450], and not BECN1[1–265], physically interacted with the GST-PKD2 C-term[682–968] (). These results were consistent with previously reported studies, as in contrast to the amino-terminal region of PKD2, which is intrinsically disordered, the carboxy-terminal domain of PKD2 has been shown previously to interact with other proteins [Citation25,Citation26]. Furthermore, we observed by confocal microscopy analysis that, in HeLa cells, nutrient deprivation increased the number and the size of endogenous BECN1-positive puncta as well as their colocalization with a full-length PKD2 construct tagged to GFP (FL PKD2) in HeLa cells (). Consistently, by performing a Proximity Ligation Assay (PLA), we observed by fluorescence microscopy positive red dots, indicative of BECN1 and PKD2 molecules located closer than 40 nm in control conditions (). Importantly, the amount of these red dots was significantly higher after 1 h of nutrient deprivation, suggesting an increase in PKD2 and BECN1 complex formation in these conditions. Additionally, in HeLa cells transfected with a GFP-WIPI2 plasmid, we noted by PLA a similar localization of PKD2-BECN1 dots with GFP-WIPI2 dots, suggesting that, at least in part, the association of PKD2 and BECN1 might occur in the context of the omegasome (Fig. S2C). Furthermore, downregulation of PKD2 did not alter reticular localization of BECN1, but reduced BECN1 puncta size, suggesting that PKD2 may participate in the enrichment of BECN1 at the ER (Fig. S2D).
Altogether, these data indicate that PKD2 forms a multi-protein complex by direct interaction with BECN1.
Studies of rupture force, adhesion frequency, and binding parameters in the PKD2 C-term [682-968] and BECN1[248-450] binding through single-molecule force spectroscopy
To confirm the existence of the PKD2-BECN1 protein complex, we used optical tweezers. This technique can be used as a single-molecule force transducer in order to characterize the mechanical response and the unbinding kinetics in the interaction between the carboxy-terminal tail of PKD2, PKD2 C-term[682–968] and BECN1[248–450]. In order to use optical tweezers and perform the force spectroscopy experiments, GST-PKD2 C-term[682–968] and 6xHis-BECN1[248–450] recombinant proteins were produced in a prokaryotic system and then attached to GSH- and anti-His-coated polystyrene beads, respectively (). To promote the bimolecular protein binding, the optically trapped bead coated with GST-PKD2 C-term[682–968] was exposed to micropipette-attached beads bound to 6xHis-BECN1[248–450] () and after a 1 s period, to allow the interaction of the beads, they were separated by pulling the laser beam-trapped bead at a constant force-loading rate (force-ramp assay). If an interaction was formed, the optically trapped bead would be displaced from the center and a force would be generated until the interaction ruptures. Thus, the rupture force could be obtained from a force-trap position trace (). In order to improve the characterization of the GST-PKD2 C-term[682–968] interaction with 6xHis-BECN1[248–450], and to discriminate between specific and nonspecific binding events in our system, we first performed an adhesion frequency assay using the force-ramp strategy by measuring the number of total binding events compared to the total approaching-retraction cycles between both beads. We observed a significantly higher adhesion frequency for the GST-PKD2 C-term[682-968]-6xHis-BECN1[248–450] interaction (0.63 ± 0.04) compared to the control condition of GST-coated bead-6xHis-BECN1[248–450] (0.08 ± 0.06) (). Thus, these data show that the interaction between GST-PKD2 C-term[682–968] and 6xHis-BECN1[248–450] is direct, specific and independent of the GST tag ().
Figure 3. miniTweezers system for the characterization of rupture force, adhesion frequency and binding parameters between PKD2 C-term[682–968] and BECN1[248–450]. Scheme of the optical miniTweezers technique used to study the GST-PKD2 C-term[682-968]-6xHis-BECN1[248–450] interaction. Two different polystyrene beads were used: a GSH-coated bead (2.5 μm) containing purified GST-PKD2 C-term[682–968] or GST attached to a laser beam and held in the focus of the microscope and the anti-histidine bead (3.1 μm) containing the 6xHis-BECN1[248–450] protein, trapped on a micropipette by suction (A). Protein interaction was promoted by approaching the laser beam-trapped bead to the second bead. Then, after <1 s of contact, the beads were separated by pulling the laser beam-trapped bead at a constant force-loading rate (10 pN/s) until interaction rupturing. Force-trap position trace for one approach-retraction cycle obtained from miniTweezers measurements between GST-PKD2 C-term[682–968] or GST alone, with 6xHis-BECN1[248–450] (B). Adhesion frequency was evaluated using either GST-PKD2 C-term[682–968] or 6xHis-BECN1[248–450] (4 nM). At least 250 binding events per four pairs of new beads were measured. GST was used as control (C). Rupture force histograms between GST-PKD2 C-term[682-968]-6xHis-BECN1[248–450] and GST-6xHis-BECN1[248–450] (D). Force-dependent lifetime for the GST-PKD2 C-term[682-968]-6xHis-BECN1[248–450] interaction, estimated from each bin in (D) was analyzed using the Dudko-Hummer-Szabo model (E). Solid line corresponds to the fitted equation 2 [48] (υ = 0.5). Energy landscape of the dissociation process for GST-PKD2 C-term[682-968]-6xHis-BECN1[248–450] shows off-rate at zero force (koff0), distance to the transition state (Δx‡) and the free energy of activation (ΔG‡) (F)
![Figure 3. miniTweezers system for the characterization of rupture force, adhesion frequency and binding parameters between PKD2 C-term[682–968] and BECN1[248–450]. Scheme of the optical miniTweezers technique used to study the GST-PKD2 C-term[682-968]-6xHis-BECN1[248–450] interaction. Two different polystyrene beads were used: a GSH-coated bead (2.5 μm) containing purified GST-PKD2 C-term[682–968] or GST attached to a laser beam and held in the focus of the microscope and the anti-histidine bead (3.1 μm) containing the 6xHis-BECN1[248–450] protein, trapped on a micropipette by suction (A). Protein interaction was promoted by approaching the laser beam-trapped bead to the second bead. Then, after <1 s of contact, the beads were separated by pulling the laser beam-trapped bead at a constant force-loading rate (10 pN/s) until interaction rupturing. Force-trap position trace for one approach-retraction cycle obtained from miniTweezers measurements between GST-PKD2 C-term[682–968] or GST alone, with 6xHis-BECN1[248–450] (B). Adhesion frequency was evaluated using either GST-PKD2 C-term[682–968] or 6xHis-BECN1[248–450] (4 nM). At least 250 binding events per four pairs of new beads were measured. GST was used as control (C). Rupture force histograms between GST-PKD2 C-term[682-968]-6xHis-BECN1[248–450] and GST-6xHis-BECN1[248–450] (D). Force-dependent lifetime for the GST-PKD2 C-term[682-968]-6xHis-BECN1[248–450] interaction, estimated from each bin in (D) was analyzed using the Dudko-Hummer-Szabo model (E). Solid line corresponds to the fitted equation 2 [48] (υ = 0.5). Energy landscape of the dissociation process for GST-PKD2 C-term[682-968]-6xHis-BECN1[248–450] shows off-rate at zero force (koff0), distance to the transition state (Δx‡) and the free energy of activation (ΔG‡) (F)](/cms/asset/e430d9e6-9b0c-4f8d-b363-93fabbc5ea43/kaup_a_1782035_f0003_oc.jpg)
Using the force-ramp assay, we obtained the rupture force distribution graph for the specific interaction between GST-PKD2 C-term[682–968] and 6xHisBECN1[248–450] (). Fitting with a Gaussian distribution curve resulted in a single-peak rupture force of 12.5 ± 1.2 pN, characteristic of single molecule interaction. By applying the mathematical model of Dudko-Hummer-Szabo (DHS) [Citation47], the unbinding kinetics parameters of this bimolecular interaction were characterized from the rupture force histogram. Specifically, the GST-PKD2 C-term[682-968]-6xHis-BECN1[248–450] interaction lifetime (τ) was calculated for each bin of the rupture force histogram by applying the DHS equation (Equation (1) [Citation48],). shows the bond lifetime as a function of each rupture force. The lifetime data were fitted by applying the nonlinear DHS model (Equation (2) [Citation48]), thus characterizing the energy landscape of the dissociation process between GST-PKD2 C-term[682–968] and 6xHis-BECN1[248–450] in the absence of force (). The values obtained at zero force were as follows: the binding lifetime (τ0 = 2.8 ± 0.7s), the off-rate constant (which is inversely related to τ, koff0 = 0.28 ± 0.08s-1), the distance to the transition state (related to the type of bond involved in the interaction, ΔG‡ = 0.32 ± 0.11 nm), and the free energy of activation (energy barrier that must be overcome to dissociate the binding, ΔG‡ = 2.98 ± 0.4 kBT) (). In addition, this last figure describes the mechanical response of the GST-PKD2 C-term[682-968]- 6xHis-BECN1[248–450] interaction showing that force accelerates its dissociation, indicating an ordinary slip bond behavior. These results allowed us to characterize the mechanical response and the force-dependent kinetics parameters of the dissociation process between PKD2 C-term[682–968] and BECN1[248–450].
The CC1 domain within PKD2 is required both for its interaction with BECN1 and to regulate autophagy
The carboxy-terminal region of PKD2 contains two homo-oligomerization coiled-coil domains, CC1 and CC2, which might be required to mediate its interaction with BECN1. Of note, PKD2 lacks a BH3 domain sequence, which would also explain a homotypic interaction with BECN1 (Fig. S3). To determine if CCD domains are involved in PKD2-BECN1 interaction, we engineered different GFP-tagged constructs of human PKD2, including full-length (FL)-PKD2 and PKD2 mutants lacking its CC1 (aa 719–798, PKD2∆CC1) or CC2 (aa 830–872, PKD2∆CC2) regions (). These constructs were transfected in HeLa cells and the interaction between FL PKD2, PKD2∆CC1 or PKD2∆CC2 with BECN1 was assessed by co-immunoprecipitation of GFP. As expected, we confirmed that FL PKD2 co-immunoprecipitated with BECN1 (). However, PKD2∆CC1, but not PKD2∆CC2, manifested significantly less co-immunoprecipitation with BECN1 (), suggesting that the CC1 domain of PKD2 is required for the formation of the PKD2-BECN1 complex.
Figure 4. The CC1 domain of PKD2 interacts with BECN1 and is necessary for autophagy induction. Schematic representation showing human GFP-tagged PKD2 constructs: full-length PKD2 (FL PKD2) and deletion of the first (CC1) and second (CC2) coiled-coil domain (PKD2ΔCC1 and PKD2ΔCC2, respectively). Transmembrane regions (TM) are indicated as TM1-6 (A). Co-immunoprecipitation of PKD2 constructs with BECN1. GFP-FL PKD2, GFP-PKD2ΔCC1 or GFP-PKD2ΔCC2 constructs were transfected in HeLa cells. 24 h later, the overexpressed forms of PKD2 were immunoprecipitated with specific antibodies for GFP and the precipitate was resolved by SDS-PAGE and revealed against BECN1. Total levels of GFP-tagged proteins and BECN1 were evaluated in the whole extracts. Representative gels are shown in (B) (n = 3). Induction of RFP-LC3 aggregation by PKD2 constructs (C,D). GFP-FL PKD2, GFP-PKD2ΔCC1 or GFP-PKD2ΔCC2 was co-transfected with an RFP-LC3-encoding plasmid for 24 h. Co-transfection with GFP alone was used as a control. Then, cells were fixed and autophagy quantified by immunofluorescence. Nuclei were dyed with 10 mg/mL of Hoechst 33342 and representative pictures are shown (C). The percentage of cells with RFP-LC3 puncta, % of autophagic cells, is reported in (D) (mean ± SEM, n = 3, *p < 0.05 vs. WT). HeLa cells were transfected as in (B) and then cultured in presence or absence of 30 nM Baf A1 for 2 h. GFP overexpression was used as control. Whole-cell extracts were resolved by western blot and PKD2, GFP, LC3-I and II were identified with specific antibodies. Representative gels are shown in (E) and the levels of LC3-II normalized to the loading control (GAPDH) are indicated at the bottom of the gels and in the graph in (F) (mean ± SEM, n = 3, *p < 0.05 vs. GFP+Baf A1)
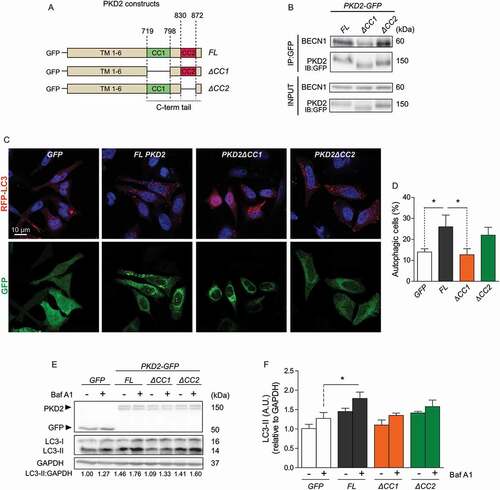
Given that the CC1 domain within PKD2 was required for its interaction with BECN1, we tested whether CC1 is also necessary for PKD2-induced autophagy. To this aim, the GFP-tagged constructs of human PKD2, FL PKD2, PKD2∆CC1 or PKD2∆CC2 were transfected in HeLa cells and autophagy was assessed by fluorescence microscopy, evaluating the number of autophagic vesicles in cells co-transfected with RFP-LC3. Interestingly, whereas overexpression of FL PKD2 increased autophagy, as indicated by the accumulation of RFP-LC3 dots and the increased percentage of autophagic cells, PKD2∆CC1 overexpression did not affect autophagy (). Consistent with the hypothesis that induction of autophagy depends on PKD2-BECN1 interaction, overexpression of PKD2∆CC2 promoted basal autophagy, as observed with FL PKD2, indicating that CC1, but not CC2, is required to induce autophagy in HeLa cells (). The requirement of CC1 and CC2 within PKD2 for the induction of autophagy was also confirmed by western blotting, measuring the turnover of LC3-I to LC3-II, in the presence and absence of Baf A1. Our data showed that both overexpression of FL PKD2 and PKD2∆CC2, but not PKD2∆CC1, increased autophagic flux (). Altogether, these data indicate that CC1 within PKD2 is required to increase the autophagic flux induced by PKD2 overexpression.
In order to evaluate the intracellular location of the different constructs of PKD2, we monitored the colocalization between FL PKD2, PKD2∆CC1 or PKD2∆CC2 and the ER protein RTN4. Despite the mutations, we did not observe an aberrant distribution of the constructs of PKD2 and all of them localized to the ER (Fig. S4A). Indeed, consistently with other studies [Citation49], we found that a portion of PKD2 localized at the Golgi, specifically in cis-Golgi, as observed by co-immunofluorescence of PKD2 with GOLGA2/GM130 (Fig. S4B).
PKD2 Ca2+ channel activity is required for PKD2-BECN1 complex formation and autophagy activation
Studies have shown the role of different Ca2+ microdomains in the regulation of autophagy [Citation50–52]. MAMs, primary cilia, cytosol, lysosomes and ER contain specific Ca2+ microdomains that regulate autophagy either positively or negatively [Citation50–52]. Thus, cytosolic Ca2+ has shown to be a critical trigger of autophagy in different cell types and in response to different stimuli. Since PKD2 is a Ca2+ channel, we evaluated whether PKD2 Ca2+ channel activity is required for PKD2-BECN1 complex formation and autophagy regulation. We observed that treatment of HeLa cells with BAPTA-AM, an intracellular Ca2+ chelator, prevented LC3 puncta accumulation and thereby the increase in the autophagy rates following nutrient deprivation for 2 h (). Interestingly, we observed that in this condition the treatment with BAPTA-AM inhibits the formation of the PKD2-BECN1 complex promoted by starvation in HeLa cells (), suggesting that intracellular Ca2+ is key not only for autophagy induction but also for the formation of the PKD2-BECN1 complex when autophagy is induced.
Figure 5. PKD2 Ca2+ channel function is required for PKD2-BECN1 complex formation and autophagy. Cytosolic Ca2+ is required for autophagy and BECN1-PKD2 complex formation (A-C). Hela cells were subjected to nutrient deprivation with EBSS medium for 2 h with or without 20 μM of BAPTA-AM. Subsequently, autophagy was evaluated by immunofluorescence against endogenous LC3. Nuclei were dyed with 10 mg/mL of Hoechst 33342. Representative pictures are shown in (A) and the percentage of cells with LC3 puncta (autophagic cells) are shown in (B) (mean ± SEM, n = 3, *p < 0.05 vs. Co). WT PKD2 was overexpressed in HeLa cells by infecting the cells with the adenoviral construct AdPKD2 for 24 h. Then, cells were subjected to nutrient deprivation with the EBSS medium with or without 20 μM BAPTA-AM. Immunoprecipitation against BECN1 was performed and PKD2 was evaluated by western blot. Samples containing the whole-cell lysate were used as control and PKD2 and BECN1 were evaluated. Representative gels are shown in (C). PKD2 Ca2+ channel function is required for PKD2-BECN1 complex formation and autophagy (D-H). WT PKD2 or the PKD2D509 V mutant was overexpressed in HeLa cells by transducing the cells for 24 h with adenoviruses. Infection with an empty vector was used as control. Whole protein extracts were prepared, BECN1 immunoprecipitated and PKD2 evaluated by western blot. Representative gels are shown in (D) (n = 3). AdPKD2 or AdPKD2D509 V was overexpressed in HeLa cells for 24 h and autophagy evaluated both by immunofluorescence of endogenous LC3 (E,F) or by western blot by assessing LC3-I to LC3-II turnover in presence or absence of 30 nM Baf A1 (G,H). An empty adenovirus (AdCo) was used as control. Representative pictures are shown in (E) and the percentage of autophagic cells represented in the graph in (F) (mean ± SEM, n = 3, ***p < 0.005 vs. AdCo and &&p < 0.01 vs. AdPKD2). Representative gels of PKD2, LC3-I, LC3-II and the loading control GAPDH are shown in (G) and its quantifications depicted in (H) (mean ± SEM, n = 3, ***p < 0.001 vs. AdCo and &&&p < 0.001 vs. AdPKD2)
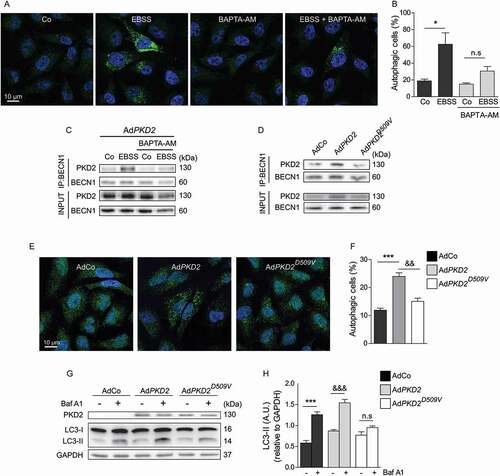
Given that PKD2 functions as a Ca2+‐permeable channel, we evaluated whether PKD2 Ca2+ channel activity is required to form a complex with BECN1 and to induce autophagy. To accomplish this, we used adenoviruses to overexpress either the WT or a single-residue mutation within the pore-forming region (D509V) of PKD2, which codes for a nonfunctional Ca2+ channel. In accordance with additional studies in which the overexpression of PKD2 in proximal tubule cells from the porcine kidney (LLC-PK1 cells) enhanced the amplitude of Ca2+ transients [Citation53], we observed that PKD2WT overexpression in HeLa cells increased both basal and thapsigargin-induced intracellular Ca2+ levels when compared to control cells or cells overexpressing the PKD2D509V mutant (Fig. S5A); these findings suggest that HeLa cells experience higher Ca2+ leakage when the WT form of PKD2 is overexpressed. Next, we evaluated the co-immunoprecipitation of BECN1 with PKD2, and we observed increased PKD2-BECN1 co-precipitation when WT PKD2, but not PKD2D509V, was overexpressed (), suggesting that Ca2+ channel function of PKD2 is required to form the complex with BECN1. These results correlate with the role of PKD2 in autophagy; whereas WT PKD2 overexpression triggers autophagy as indicated by LC3 puncta formation () and by LC3-I to LC3-II turnover in the presence or absence of Baf A1 (), overexpression of the PKD2D509V mutant is unable to upregulate autophagy. In conclusion, these data indicate that the Ca2+ channel function of PKD2 is required for the protein’s interaction with BECN1 and to stimulate autophagy. Finally, we observed that FL PKD2 and PKD2ΔCC1 constructs showed similar Ca2+ peak leakage (Fig. S5B); thus, our study suggests that the reduced complex formation between PKD2ΔCC1 and BECN1 () may be due to a deletion in the interaction domain, and not because of a reduction in Ca2+ release.
Discussion
Recent studies have shown that PKD2 positively regulates autophagy in different cell types [Citation22,Citation23,Citation30,Citation31]. Indeed, we showed that PKD2 is required for osmotic stress-induced autophagy in cancer cell lines [Citation31] and for starvation- and rapamycin-induced autophagy in vitro, in cultured cardiomyocytes and in vivo in animals lacking PKD2 in the heart tissue [Citation22]. Consistently, other groups have observed that PKD2 is necessary for autophagy induction; in mouse kidney epithelial cells, when cultures were exposed to fluid-flow stress [Citation23] and in human stem cell-derived cardiomyocytes exposed to glucose deprivation [Citation30]. However, despite these studies, little is known about the mechanisms underlying PKD2-dependent control of autophagic activation, and no evidence directly connects PKD2 with key modulators of the autophagy machinery. Here, we show that PKD2 is necessary and sufficient for autophagy induction, physically and functionally interacting with the autophagy essential protein BECN1. In this context, we showed that nutrient deprivation increased the interaction of PKD2 with BECN1 and consistently, overexpression of PKD2, which was sufficient to induce autophagy (), increased its co-immunoprecipitation and colocalization with BECN1, suggesting that PKD2-BECN1 complex formation correlated with autophagy activation (). BECN1, together with PIK3C3, ATG14 and PIK3R4, is not only a component of the PtdIns3K complex, but it also interacts with other positive and negative modulators of autophagy, such as AMBRA1, UVRAG, RUBCN, BCL2 and BCL2L1 [Citation11–13,Citation15,Citation43]. Indeed, we showed that PKD2 belonged to the BECN1 partners, co-immunoprecipitating with RUBCN and with additional components of the PtdIns3K complex, PIK3C3 and ATG14 (). Although we observed that PKD2 interacted with RUBCN, an autophagy inhibitor part of the BECN1 interactome, PKD2 overexpression did not affect RUBCN-BECN1 interaction (), indicating that RUBCN is not essential in PKD2-induced autophagy. Future studies will determine if other negative regulators of autophagy, such as BCL2 or BCL2L1, are required by PKD2 to induce autophagy.
Additionally, to gain more insight into the nature of the BECN1-PKD2 interaction, we observed that the human PKD2 carboxy-terminal (aa 682–968), whose sequence is highly conserved across different organisms [Citation54], interacted directly with BECN1, specifically with the carboxy-terminal portion of human BECN1 (aa 248–450). This was consistent with previous studies that indicate that the N-terminus of PKD2 is not required to interact with previously reported partners of PKD2 [Citation26], whereas the PKD2 carboxy-terminal tail is involved in the hetero-oligomerization with PKD1 [Citation44], ITPR (inositol 1,4,5-triphosphate receptor) [Citation33], RYR (ryanodine receptor) [Citation45] and STX5 [Citation46].
In addition, using optical tweezers, we studied how forces were implicated in the PKD2 C-term[682-968]-BECN1[248–450] interaction. The study of bimolecular interactions using optical tweezers has previously been applied to different protein complexes, such as the complex of THY1 with the integrin ITGAV-ITGB3 [Citation48], the complex of FG (fibrinogen) with the integrin ITGA2B-ITGB3 [Citation55,Citation56], the complexes of SELP (selectin P) and SELL with SELPLG (selectin P ligand) [Citation57], and the complex of SPP1/osteopontin (secreted phosphoprotein 1) with the integrin ITGAV-ITGB3 [Citation58]. However, there are no previous studies that performed this type of analysis for autophagy core proteins or partners of PKD2. To execute this assay, both PKD2 and BECN1 were purified from a prokaryotic expression system, providing molecules without post-translational modifications, simplifying PKD2-BECN1 interaction analysis to their primary structures. Indeed, whereas PKD2 contains several post-translational modifications, such as phosphorylation in different sites [Citation59–61], BECN1 has residues sensitive to acetylation, phosphorylation, ubiquitination, glycosylation and ISGlation [Citation62]. Despite the absence of potential post-translational modifications, the rupture force and the dissociation rate, koff0, of PKD2 C-term[682-968]-BECN1[248–450] complex were determined as 12 pN and 0.28 ± 0.08s-1, respectively, which indicates that complex formation is weak and transient. To study the critical amino acid residues involved in the interaction/dissociation forces of the PKD2 C-term[682-968]-BECN1[248–450] complex, future studies should generate specific mutations in PKD2 and/or BECN1 and evaluate how these forces are affected.
Two CCD regions, CC1 (aa 719–798) and CC2 (aa 830–872) have been identified in the carboxy-terminal tail of PKD2 [Citation63]. Our data showed that whereas deletion of CC2 did not affect the interaction of PKD2 with BECN1, lack of the CC1 (aa 719–798) region significantly reduced PKD2-BECN1 interaction, preventing autophagy induction. Altogether, these results indicate the physical interaction between PKD2 and BECN1, which depends on the CC1 region of PKD2, is required to regulate autophagy.
Different groups have shown the requirement of Ca2+ for the activation of autophagy in several cell types [Citation50,Citation64–66] and despite the few studies that correlate PKD2-dependent Ca2+ handling with the regulation of autophagy [Citation22,Citation30], there are no reports that explain how PKD2 affects the autophagy machinery. Consistent with previous studies [Citation50,Citation64–66], we observed that Ca2+ was necessary for the induction of autophagy and, in addition to this, we showed here that Ca2+ was required for the PKD2-BECN1 complex formation. Interestingly, we observed that the Ca2+-channel activity of PKD2 was required to stimulate the formation of the PKD2-BECN1 complex, as well as for the induction of autophagy, suggesting that PKD2-dependent Ca2+ microdomains may engage key components of the autophagy machinery core, such as BECN1. Previous studies have reported that specific Ca2+-microdomains, such as cytosolic, mitochondrial or lysosomal are involved in the induction of autophagy either basal or stimulated conditions, both in vitro and in vivo [Citation67–69]. Whether these pools of Ca2+ regulate the formation of the PKD2-BECN1 complex formation remains to be determined. Importantly, despite the CC1 domain of PKD2 containing an EF-hand (aa 717–790 of human PKD2), an important PKD2 calcium channel modulator [Citation70,Citation71], we did not observe changes in Ca2+ release between PKD2ΔCC1 and FL PKD2. This suggests that the reduced complex formation between PKD2ΔCC1 and BECN1 may be explained by the lack of a portion of the interaction site in the mutant. Taken together, our results indicate that Ca2+ release and the CC1 region in PKD2 are two different factors required for the complex formation between PKD2 and BECN1.
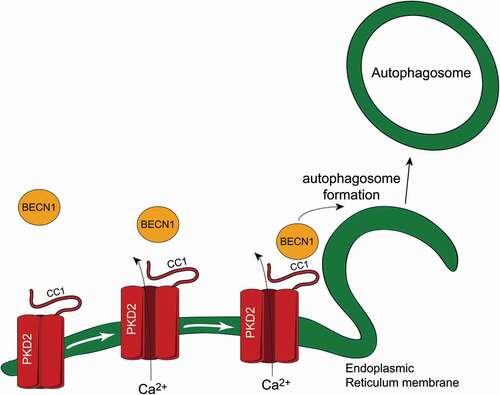
Given that the PKD2-BECN1 complex formation is enhanced when autophagy is stimulated, and that the intracellular localization of PKD2 is consistent with well-known phagophore assembly sites, PKD2 may be acting as a platform to recruit BECN1 to specific membrane Ca2+ microdomains, where the autophagy machinery can function optimally (). However, more studies are required to test this hypothesis as the current study only demonstrates that PKD2 regulates autophagy through its interaction with BECN1.
Figure 6. PKD2-BECN1 in the regulation of autophagy. Proposed model of how PKD2-BECN1 complex formation is involved in autophagy. PKD2 resides at the endoplasmic reticulum membrane, while BECN1 is mainly diffuse throughout the cytoplasm. Interaction between PKD2 and BECN1 increases in autophagy conditions, which is mediated by CC1 domain within PKD2. Finally, cytosolic Ca2+, which can be modulated by PKD2, is required both for PKD2-BECN1 complex formation and autophagy
The present findings provide potential new approaches for the treatment of PKD2 deficiency-related diseases [Citation72–74]. Indeed, specific mutations of PKD2 have been related with different human diseases, such as autosomal dominant polycystic kidney disease, ADPKD, which affects the normal function of renal tubular epithelial cells [Citation75]. Various pathogenic mutations of ADPKD have been identified in the carboxy-terminal domain of PKD2, suggesting that the PKD2 C-term[682–968] region is functionally related to disease pathogenesis. In these conditions, autophagy may be impaired in ADPKD patients given that administration of rapamycin, which is commonly used to induce autophagy, improves ADPKD symptoms. In this scenario, it is tempting to speculate that in epithelial kidney cells of ADPKD patients, autophagy is inhibited because of the lack of interaction between BECN1 and the mutant PKD2. This hypothesis should be evaluated in future studies.
Materials and methods
Cell culture and treatment
Human cervical cancer cell line, HeLa (ATCC, CCL-2), and human embryonic kidney cells, HEK-293 (ATCC, CRL-1573), were grown in Dulbecco’s Modified Eagle Medium (DMEM) 4.5 g/L containing L-glutamine and 100 mg/L sodium pyruvate (HyClone, GE Healthcare Life Sciences, SH30243.02), and supplemented with 10 mM HEPES (Thermo Fisher Scientific, 15630–080) and 10% v:v fetal bovine serum (Thermo Fisher Scientific, 10437–028). Cells were maintained in a 5% CO2 incubator at 37°C. Earle´s Balanced Salt Solution, EBSS (Sigma-Aldrich, E2888) and 1 µM rapamycin (Sigma-Aldrich, R0395) were used to stimulate autophagy. For autophagy flux evaluation, cells were treated with 30 nM bafilomycin A1 (Baf A1; Sigma-Aldrich, B1793). For depletion of intracellular Ca2+, cells were treated with 20 μM of 1,2-Bis(2-aminophenoxy)ethane-N,N,N′,N′-tetraacetic acid tetrakis (acetoxymethyl ester), BAPTA-AM (Thermo Fisher Scientific, B6769) in DMSO (Winkler, BM-0660).
Western blot
Cells were lysed with T-PER™ reagent (Thermo Fisher Scientific, 78510) supplemented with protease inhibitors (Thermo Fisher Scientific, A32955) and the phosphatase inhibitor sodium orthovanadate (Santa Cruz Biotechnology, sc-3540). Protein extracts were suspended in Laemmli buffer (from 4x stock: 2% w:v SDS [United States Biological, S5010], 10% v:v glycerol [Sigma-Aldrich, G5516], 62.5 mM Tris-HCl, pH 6.8, 5% v:v 2-mercaptoethanol [Merck KGaA, 444203], and 0.01% w:v bromophenol blue [Bio-Rad Laboratories, 1610404]) and heat-denaturated at 95°C. Protein samples were resolved in SDS-PAGE gels (For resolving gels: 8–12% acrylamide/Bis-acrylamide 29:1 [Bio-Rad Laboratories, 1610146], 0.375M Tris-base, pH 8.8, 0.1% w:v SDS [United States Biological, S5010], 0.15% v:v tetramethylethylenediamine [TEMED; Bio-Rad Laboratories, 1610801] and 0.45% w:v ammonium persulfate [Thermo Fisher Scientific, 17874]; for stacking gels: 3% acrylamide/Bis-acrylamide 29:1 [Bio-Rad Laboratories, 1610146], 0.125M Tris-base, pH 6.8, 0.04% w:v SDS [United States Biological, S5010], 0.15% v:v tetramethylethylenediamine [TEMED; Bio-Rad Laboratories, 1610801] and 0.3% w:v ammonium persulfate [Thermo Fisher Scientific, 17874]) and subjected to immunoblotting in nitrocellulose membranes (Sigma-Aldrich, GE10600003) with antibodies for LC3 (Cell Signaling Technology, 4108), GAPDH (Santa Cruz Biotechnology, sc-365962), PKD2/PC2 (Santa Cruz Biotechnology, sc-25749), BECN1 (Santa Cruz Biotechnology, sc-11427), SQSTM1/p62 (Cell Signaling Technology, 5114), RUBCN/RUBICON (Abcam, Ab92388), PIK3C3/VPS34 (Abcam, Ab137784), ATG14 (Sigma-Aldrich, A6358), GFP (Santa Cruz Biotechnology, sc-8334), GST (Millipore Corporation, AB3282). Membranes were then incubated with secondary antibodies coupled to horseradish peroxidase obtained from Kirkegaard & Perry Laboratories (Rabbit HRP 074–1506; Mouse HRP 074–1806) and revealed in Amersham™ Imager 600 (GE Healthcare Life Sciences; Chicago, Illinois, USA) with the chemiluminescence kit EZ-ECL (Biological Industries, 20–500-500). Images were quantified using the ImageJ software (Rasband, W.S., U. S. National Institutes of Health, Bethesda, Maryland, USA, https://imagej.nih.gov/ij/).
Immunofluorescence
Cells were washed with PBS (140 mM NaCl, 2.5 mM KCl, 10 mM Na2HPO4, 2 mM KH2PO4) and either fixed with 4% PFA (Thermo Fisher Scientific, 28908) and permeabilizated with 0.1% Triton X-100 (Winkler, BM-2020) or fixed and permeabilizated with methanol (Sigma-Aldrich, 34860). Samples were incubated with primary antibodies for LC3 (Cell Signaling Technology, 4108), BECN1 (Santa Cruz Biotechnology, sc-11427), GFP (Santa Cruz Biotechnology, sc-8334), RTN4/NOGO (Santa Cruz Biotechnology, sc-271878), GOLGA2/GM130 (BD Biosciences, 610823), LAMP1 (Santa Cruz Biotechnology, sc-20011) overnight at 4ºC, and fluorescent secondary antibodies (Alexa Fluor 488 and 568; Life Technologies, A11094, A28175, A11004, A11011) for 2 h at room temperature. Nuclei were stained with 10 μg/mL Hoechst 33342 (Thermo Fisher Scientific, H3570). Images were obtained by using a Zeiss LSM 700 confocal fluorescent microscope (Carl Zeiss AG; Oberkochen, Germany) and pictures were analyzed using the ImageJ software (Rasband, W.S., U. S. National Institutes of Health, Bethesda, Maryland, USA, https://imagej.nih.gov/ij/).
Proximity Ligation Assay (PLA)
Cells were washed with PBS (140 mM NaCl, 2.5 mM KCl, 10 mM Na2HPO4, 2 mM KH2PO4) and fixed/permeabilizated with methanol (Sigma-Aldrich, 34860). Then, samples were processed as indicated in the Duolink® (Sigma-Aldrich, DUO92101) manufacturer’s protocol, using BECN1 (Santa Cruz Biotechnology, sc-11427,) and PKD2/PC2 (Novus Biologicals, 4C8) as primary antibodies. Briefly, after blocking the slides, the primary antibodies were incubated overnight at 4°C. The antibodies were tagged with a nucleotide probe, which was ultimately ligated and amplificated, leading to a positive signal (red dot) if the primary antibodies remained closer than 40 nm. Finally, after mounting, images were obtained using an epifluorescence microscope Nikon TiE (Tokyo, Japan) and pictures were analyzed using the ImageJ software (Rasband, W.S., U. S. National Institutes of Health, Bethesda, Maryland, USA, https://imagej.nih.gov/ij/).
Co-immunoprecipitation
Cells were washed with PBS (140 mM NaCl, 2.5 mM KCl, 10 mM Na2HPO4, 2 mM KH2PO4) and proteins were extracted with a lysis buffer (50 mM Tris, 150 mM NaCl, 0.5% Nonidet P40 [Winkler, BM-1225], pH 7.5) supplemented with protease inhibitors (Thermo Fisher Scientific, A32955). Protein G agarose beads (Kirkegaard & Perry Laboratories, 223–51-00) were conjugated with 2 μg antibody (BECN1, Santa Cruz Biotechnology, sc-11427; GFP, Santa Cruz Biotechnology, sc-8334; PKD2/PC2, Santa Cruz Biotechnology, sc-25749) and then incubated with 300 μg of protein extracts at 4ºC for 2 h. The beads were resuspended in Laemmli buffer (from 4x stock: 2% w:v SDS [United States Biological, S5010], 10% v:v glycerol [Sigma-Aldrich, G5516], 62.5 mM Tris-HCl pH 6.8, 5% v:v 2-mercaptoethanol [Merck KGaA, 444203], and 0.01% w:v bromophenol blue [Bio-Rad Laboratories, 1610404]) and denaturated at 95°C. Protein complexes were analyzed by western blot.
Small interference RNA, plasmid transfection and adenovirus transduction
For siRNA transfection, 120 nM siRNA (Sigma-Aldrich) targeted to PKD2 (siPKD2#1 SASI_Hs01_00100552; siPKD2#2 SASI_Hs01_00100554), BECN1 (siBECN1 SASI_Hs01_00090913) and Control siRNA (siUNR SIC001) were transfected by using Lipofectamine® RNAiMax (Invitrogen, 13778–150) and Opti-MEM™ medium (Thermo Fisher Scientific, 51985–034). For plasmid transfection, 2 μg DNA (pGFP, pFL PKD2-GFP, pPKD2-ΔCC1-GFP and pPKD2-ΔCC2-GFP constructed in the pTagGFP2 vector and kindly provided by Dr. Peter Harris from Mayo Clinic, Rochester, Minnesota, USA; pGFP-WIPI2 was kindly provided by Dr. Li Yu from Tsinghua University, Beijing, China; and pmRFP-LC3 was obtained from Addgene, 21075; deposited by Tamotsu Yoshimori) were incorporated into the cells by using Lipofectamine® 2000 (Invitrogen, 11668–027) and Opti-MEM™ medium. For adenovirus transduction, AdPKD2 and AdPKD2D509V adenoviruses were used at a MOI 50, and protein expression was evaluated after 24 h of infection [Citation76].
Expression and purification of recombinant proteins
Truncated BECN1 domains His6-Tag: plasmids pET21b that encodes the human constructs of BECN1[1–265] (residues 1–265) and BECN1[248–450] (residues 248–450) each having a His6-tag amino-terminal were generously provided by Dr. Matthew J. Ranaghan, Broad Institute of MIT and Harvard University (6xHis-BECN1[1–265] and 6xHis-BECN1[248–450]). Constructs were transformed in BL21 SHuffle T7 Express E. coli (New England Biolabs, C2566). Expression of BECN1 fusion proteins and truncated protein were prepared from bacterial cultures grown in Terrific buffer (2.4% w:v yeast extract (Thermo Fisher Scientific, 212750), 2% w:v tryptone (Thermo Fisher Scientific, 211705), 0.4% v:v glycerol (Sigma-Aldrich, G5516), 17 mM KH2PO4, 72 mM K2HPO4) at 37°C with orbital shaking at 22 x g to mid-log phase (A600 ~ 0.6). Cultures were cooled to 21°C for 30 min and expression was induced by incubation with 0.5 mM isopropyl β-D-1-thiogalactopyranoside (IPTG) (United States Biological, I8500) for 18 h at 21°C. Recombinant proteins were purified by affinity chromatography using a HisPur Ni-NTA resin (Thermo Fisher Scientific, 88221).
GST and GST-PKD2 C-terminus: A plasmid encoding the C-terminus domain (aa 682–968) of PKD2 fused to GST (GST-PKD2 C-term[682–968]) was kindly provided by Dr. Xing-Zhen Chen, University of Alberta, Canada. Expression of the constructs in E. coli BL21 Star (DE3; Thermo Fisher Scientific, EC0114) was induced by incubation with 1 mM IPTG (United States Biological, I8500) for 18 h at 22°C. Finally, recombinant proteins were purified using GSH-Sepharose beads (GE Healthcare Life Sciences, 17–0756-01).
Dot blot overlay
Truncated BECN1 domains (BECN1[1–265] and BECN1[248–450]) were immobilized on dry nitrocellulose membrane strips and nonspecific reactivity was blocked by incubation of the membranes with 3% BSA (Winkler, BM-0150), T-TBS (TBS, 0.1% Tween-20 [Sigma-Aldrich, P1379]) for 1 h at room temperature (RT). Membranes were subsequently incubated with recombinant protein GST-PKD2 C-term[682–968] or GST in 1% BSA, T-TBS at 4°C overnight and then washed twice with T-TBS. Then, strip membranes were incubated with 1:4,000 primary anti-GST (Millipore Corporation, AB3282) in T-TBS for 1 h at RT, washed twice and incubated with HRP-conjugated secondary antibodies (Kirkegaard & Perry Laboratories; Rabbit HRP 074–1506; Mouse HRP 074–1806) during 1 h at RT in T-TBS. Finally, the immunoreactivity was monitored by a chemiluminescence kit EZ-ECL (Biological Industries, 20–500-500) and visualized by the use of the imaging system Amersham™ Imager 600 (GE Healthcare Life Sciences; Chicago, Illinois, USA).
Optical tweezers and rupture force evaluation
Molecular force spectroscopy experiments were performed with the miniTweezers instrument, which has a dual-laser beam single trap design, as described in [Citation77]. The rupture forces required to dissociate protein-protein interactions were measured optically by the change in momentum of the light beams leaving the trap using the methods described in [Citation48]. Details of the miniTweezers instrument and its operation are available on http://tweezerslab.unipr.it. All experiments were carried out in a temperature-controlled room at 24°C employing binding buffer (50 mM Tris, pH 7.5, 150 mM NaCl), and using a microchamber with a glass micropipette (inner diameter <1 μm; Steven B. Smith Engineering). We used GSH-coated polystyrene beads (Spherotech, GSHP-20-5) to bind the recombinant GST-PKD2 C-term[682–968]. We constructed anti-His-coated polystyrene beads to bind the recombinant 6xHis-BECN1[248–450]. Construction of anti-His-coated polystyrene beads was done by incubating 0.2 mg/mL of mouse monoclonal anti 6xHis tag antibody (Abcam, ab5000) with protein-G-polystyrene beads (3.1 μm Spherotech, PGP-30-5), in the presence of 1.5 mg/mL DMP (Thermo Fisher Scientific, 21666), and mixing by rotation for 60 min at 4°C. To quench the reaction, beads were mixed in 2M Tris-Base by 2 h at RT and then washed and resuspended in PBS.
To study the mechanical rupture of the PKD2-BECN1 interaction, the bead (2.5 μm) coated with GST-PKD2 C-term[682–968] was held in the optical trap, while the bead (3.1 μm) coated with BECN1 6xHis-BECN1[248–450] was held on the tip of the micropipette by suction. Subsequently, cycles of approaching and retraction of the beads were performed. Binding between proteins was observed after bringing the beads into close proximity by moving the optically trapped bead toward the other bead attached to the micropipette (approaching). To dissociate PKD2 C-term[682-968]-BECN1[248–450] interaction, a force-ramp assay was performed, where the optically trapped bead is moved in the opposite direction at a constant loading rate of 0.1 pN/s (retraction) [Citation47].
If protein-protein interaction occurs, the trapped bead is displaced from the center of the optical trap and force is generated until force suddenly drops to zero, “rupture force”. The rupture force histogram was obtained with at least 110 binding events per four pairs of new beads and normalized for the total number of approaching cycles (250 cycles). The bin size (b) was calculated using Scott’s rule: in which σ is the SD and n the number of rupture events [Citation48]. Adhesion frequency was calculated by measuring the total number of binding events observed in at least 110 approach–retraction cycles per four pairs of new beads.
Ca2+ measurements
Cells were maintained in Ca2+-free Krebs buffer (145 mM NaCl, 5 mM KCl, 1 mM EGTA [Merck KGaA, 324626], 1 mM MgCl2, 10 mM HEPES, 5.6 mM glucose [Sigma-Aldrich, G8270], pH 7.4) and loaded with 5 μM Fura-2AM (Invitrogen, F1221) or 10 μM Rhod-3AM (Invitrogen, R10145) for 30 min in Krebs buffer. Fluorescent response at 340 nm and 380 nm wavelengths for Fura-2AM, or 550 nm and 600 nm wavelengths for Rhod-3AM, was determined by using a Zeiss LSM 700 confocal fluorescent microscope (Carl Zeiss AG; Oberkochen, Germany). The fluorescence images were collected every 2s and analyzed using the NIH open-access software ImageJ. Reticular leakage was evaluated by adding 500 nM thapsigargin (Invitrogen, T7459) 100s after the start of the kinetic. Changes in Ca2+ concentration are expressed as changes in the ratio between fluorescence emission and excitation wavelengths after background subtraction. An oscillating cell was defined as a cell that displayed two or more Ca2+ peaks and each peak’s amplitude was at least 10% over baseline. Amplitude of responses is expressed as the fractional increase of the probe ratio versus the resting ratio (Ro) (Δ Ratio:R0).
Statistical analysis
Results are shown as mean ± SEM from at least 3 independent experiments. Statistical analysis (ANOVA and Bonferroni’s posttest) was performed with GraphPad Prism software. p < 0.05 was considered as statistically significant.
Supplemental Material
Download PDF (629.1 KB)Acknowledgments
We sincerely thank everyone in the Criollo and Lavandero laboratories for discussion and constructive criticism. We also thank Dr. Matthew J. Ranaghan, from Broad Institute of MIT and Harvard University, USA, for providing the BECN1[1-265]- and the BECN1[248-450]-coding plasmids; Dr. Xing-Zhen Chen from University of Alberta, Canada, for providing the GST-PKD2 C-term[682-968]-coding plasmid; Dr. Li Yu from Tsinghua University, Beijing, China for providing the GFP-WIPI2 plasmid; Dr. Peter Harris from Mayo Clinic, Rochester, Minnesota, USA, for providing the FL PKD2-, PKD2ΔCC1- and PKD2ΔCC2-coding plasmids. Finally, we thank the Advanced Cellular and Tissue Microscopy Core at Houston Methodist Research Institute for providing access to the Olympus FV3000 confocal microscope.
Disclosure statement
No potential conflict of interest was reported by the authors
Supplementary material
Supplemental data for this article can be accessed here.
Additional information
Funding
References
- Galluzzi L, Baehrecke EH, Ballabio A, et al. Molecular definitions of autophagy and related processes. Embo J. 2017;36(13):1811–1836.
- Onodera J, Ohsumi Y. Autophagy is required for maintenance of amino acid levels and protein synthesis under nitrogen starvation. J Biol Chem. 2005;280(36):31582–31586.
- Rich KA, Burkett C, Webster P. Cytoplasmic bacteria can be targets for autophagy. Cell Microbiol. 2003;5(7):455–468.
- Klionsky DJ, Cregg JM, Dunn WA, et al. A unified nomenclature for yeast autophagy-related genes. Dev Cell. 2003;5(4):539–545.
- Liu R, Zhi X, Zhong Q. ATG14 controls SNARE-mediated autophagosome fusion with a lysosome. Autophagy. 2015;11(5):847–849.
- Axe EL, Walker SA, Manifava M, et al. Autophagosome formation from membrane compartments enriched in phosphatidylinositol 3-phosphate and dynamically connected to the endoplasmic reticulum. J Cell Biol. 2008;182(4):685–701.
- Proikas-Cezanne T, Takacs Z, Donnes P, et al. WIPI proteins: essential PtdIns3P effectors at the nascent autophagosome. J Cell Sci. 2015;128(2):207–217.
- Lystad AH, Simonsen A. Phosphoinositide-binding proteins in autophagy. FEBS Lett. 2016;590(15):2454–2468.
- Cao Y, Klionsky DJ. Physiological functions of Atg6/Beclin 1: a unique autophagy-related protein. Cell Res. 2007;17(10):839–849.
- Furuya N, Yu J, Byfield M, et al. The evolutionarily conserved domain of Beclin 1 is required for Vps34 binding, autophagy and tumor suppressor function. Autophagy. 2005;1(1):46–52.
- Itakura E, Mizushima N. Atg14 and UVRAG: mutually exclusive subunits of mammalian Beclin 1-PI3K complexes. Autophagy. 2009;5(4):534–536.
- Fimia GM, Stoykova A, Romagnoli A, et al. Ambra1 regulates autophagy and development of the nervous system. Nature. 2007;447(7148):1121–1125.
- Li X, He L, Che KH, et al. Imperfect interface of Beclin1 coiled-coil domain regulates homodimer and heterodimer formation with Atg14L and UVRAG. Nat Commun. 2012;3:662.
- Mei Y, Su M, Sanishvili R, et al. Identification of BECN1 and ATG14 coiled-coil interface residues that are important for starvation-induced autophagy. Biochemistry. 2016;55(30):4239–4253.
- Matsunaga K, Saitoh T, Tabata K, et al. Two Beclin 1-binding proteins, Atg14L and Rubicon, reciprocally regulate autophagy at different stages. Nat Cell Biol. 2009;11(4):385–396.
- Maiuri MC, Criollo A, Tasdemir E, et al. BH3-only proteins and BH3 mimetics induce autophagy by competitively disrupting the interaction between Beclin 1 and Bcl-2/Bcl-X(L). Autophagy. 2007;3(4):374–376.
- Maiuri MC, Le Toumelin G, Criollo A, et al. Functional and physical interaction between Bcl-X(L) and a BH3-like domain in Beclin-1. Embo J. 2007;26(10):2527–2539.
- Russell RC, Tian Y, Yuan H, et al. ULK1 induces autophagy by phosphorylating Beclin-1 and activating VPS34 lipid kinase. Nat Cell Biol. 2013;15(7):741–750.
- Ravikumar B, Berger Z, Vacher C, et al. Rapamycin pre-treatment protects against apoptosis. Hum Mol Genet. 2006;15(7):1209–1216.
- Mochizuki T, Wu G, Hayashi T, et al. PKD2, a gene for polycystic kidney disease that encodes an integral membrane protein. Science. 1996;272(5266):1339–1342.
- Luo Y, Vassilev PM, Li X, et al. Native polycystin 2 functions as a plasma membrane Ca2+-permeable cation channel in renal epithelia. Mol Cell Biol. 2003;23(7):2600–2607.
- Criollo A, Altamirano F, Pedrozo Z, et al. Polycystin-2-dependent control of cardiomyocyte autophagy. J Mol Cell Cardiol. 2018;118:110–121.
- Orhon I, Dupont N, Zaidan M, et al. Primary-cilium-dependent autophagy controls epithelial cell volume in response to fluid flow. Nat Cell Biol. 2016;18(6):657–667.
- Grieben M, Pike ACW, Shintre CA, et al. Structure of the polycystic kidney disease TRP channel Polycystin-2 (PC2). Nat Struct Mol Biol. 2017;24(2):114–122.
- Yang Y, Ehrlich BE. Structural studies of the C-terminal tail of polycystin-2 (PC2) reveal insights into the mechanisms used for the functional regulation of PC2. J Physiol. 2016;594(15):4141–4149.
- Feng S, Okenka GM, Bai C-X, et al. Identification and functional characterization of an N-terminal oligomerization domain for polycystin-2. J Biol Chem. 2008;283(42):28471–28479.
- Somlo S, Ehrlich B. Human disease: calcium signaling in polycystic kidney disease. Curr Biol. 2001;11(9):R356–60.
- Gainullin VG, Hopp K, Ward CJ, et al. Polycystin-1 maturation requires polycystin-2 in a dose-dependent manner. J Clin Invest. 2015;125(2):607–620.
- Ravichandran K, Edelstein CL. Polycystic kidney disease: a case of suppressed autophagy? Semin Nephrol. 2014;34(1):27–33.
- Lu J, Boheler KR, Jiang L, et al. Polycystin-2 plays an essential role in glucose starvation-induced autophagy in human embryonic stem cell-derived cardiomyocytes. Stem Cells. 2018;36(4):501–513.
- Pena-Oyarzun D, Troncoso R, Kretschmar C, et al. Hyperosmotic stress stimulates autophagy via polycystin-2. Oncotarget. 2017;8(34):55984–55997.
- Shillingford JM, Leamon CP, Vlahov IR, et al. Folate-conjugated rapamycin slows progression of polycystic kidney disease. J Am Soc Nephrol. 2012;23(10):1674–1681.
- Li Y, Wright JM, Qian F, et al. Polycystin 2 interacts with type I inositol 1,4,5-trisphosphate receptor to modulate intracellular Ca2+ signaling. J Biol Chem. 2005;280(50):41298–41306.
- Pazour GJ, San Agustin JT, Follit JA, et al. Polycystin-2 localizes to kidney cilia and the ciliary level is elevated in orpk mice with polycystic kidney disease. Curr Biol. 2002;12(11):R378–80.
- Pampliega O, Orhon I, Patel B, et al. Functional interaction between autophagy and ciliogenesis. Nature. 2013;502(7470):194–200.
- Hamasaki M, Furuta N, Matsuda A, et al. Autophagosomes form at ER-mitochondria contact sites. Nature. 2013;495(7441):389–393.
- Mousavi SA, Kjeken R, Berg TO, et al. Effects of inhibitors of the vacuolar proton pump on hepatic heterophagy and autophagy. Biochim Biophys Acta. 2001;1510(1–2):243–257.
- Klionsky DJ, Abdelmohsen K, Abe A, et al. Guidelines for the use and interpretation of assays for monitoring autophagy (3rd edition). Autophagy. 2016;12(1):1–222.
- Tanida I, Ueno T, Kominami E. Human light chain 3/MAP1LC3B is cleaved at its carboxyl-terminal Met121 to expose Gly120 for lipidation and targeting to autophagosomal membranes. J Biol Chem. 2004;279(46):47704–47710.
- Hanada T, Noda NN, Satomi Y, et al. The Atg12-Atg5 conjugate has a novel E3-like activity for protein lipidation in autophagy. J Biol Chem. 2007;282(52):37298–37302.
- Yoshii SR, Mizushima N. Monitoring and measuring autophagy. Int J Mol Sci. 2017;18(9):1865.
- Proikas-Cezanne T, Ruckerbauer S, Stierhof Y-D, et al. Human WIPI-1 puncta-formation: a novel assay to assess mammalian autophagy. FEBS Lett. 2007;581(18):3396–3404.
- Lindmo K, Brech A, Finley KD, et al. The PI 3-kinase regulator Vps15 is required for autophagic clearance of protein aggregates. Autophagy. 2008;4(4):500–506.
- Behn D, Bosk S, Hoffmeister H, et al. Quantifying the interaction of the C-terminal regions of polycystin-2 and polycystin-1 attached to a lipid bilayer by means of QCM. Biophys Chem. 2010;150(1–3):47–53.
- Anyatonwu GI, Estrada M, Tian X, et al. Regulation of ryanodine receptor-dependent calcium signaling by polycystin-2. Proc Natl Acad Sci U S A. 2007;104(15):6454–6459.
- Geng L, Boehmerle W, Maeda Y, et al. Syntaxin 5 regulates the endoplasmic reticulum channel-release properties of polycystin-2. Proc Natl Acad Sci U S A. 2008;105(41):15920–15925.
- Dudko OK, Hummer G, Szabo A. Theory, analysis, and interpretation of single-molecule force spectroscopy experiments. Proc Natl Acad Sci U S A. 2008;105(41):15755–15760.
- Burgos-Bravo F, Figueroa NL, Casanova-Morales N, et al. Single-molecule measurements of the effect of force on Thy-1/αvβ3-integrin interaction using nonpurified proteins. Mol Biol Cell. 2018;29(3):326–338.
- Hoffmeister H, Babinger K, Gürster S, et al. Polycystin-2 takes different routes to the somatic and ciliary plasma membrane. J Cell Biol. 2011;192(4):631–645.
- Gao W, Ding W-X, Stolz DB, et al. Induction of macroautophagy by exogenously introduced calcium. Autophagy. 2008;4(6):754–761.
- Brady NR, Hamacher-Brady A, Yuan H, et al. The autophagic response to nutrient deprivation in the hl-1 cardiac myocyte is modulated by Bcl-2 and sarco/endoplasmic reticulum calcium stores. Febs J. 2007;274(12):3184–3197.
- Hoyer-Hansen M, Bastholm L, Szyniarowski P, et al. Control of macroautophagy by calcium, calmodulin-dependent kinase kinase-beta, and Bcl-2. Mol Cell. 2007;25(2):193–205.
- Kuo IY, DesRochers TM, Kimmerling EP, et al. Cyst formation following disruption of intracellular calcium signaling. Proc Natl Acad Sci U S A. 2014;111(39):14283–14288.
- Li A, Tian X, Zhang X, et al. Human polycystin-2 transgene dose-dependently rescues ADPKD phenotypes in Pkd2 mutant mice. Am J Pathol. 2015;185(10):2843–2860.
- Litvinov RI, Bennett JS, Weisel JW, et al. Multi-step fibrinogen binding to the integrin (alpha)IIb(beta)3 detected using force spectroscopy. Biophys J. 2005;89(4):2824–2834.
- Litvinov RI, Barsegov V, Schissler AJ, et al. Dissociation of bimolecular alphaIIbbeta3-fibrinogen complex under a constant tensile force. Biophys J. 2011;100(1):165–173.
- Rinko LJ, Lawrence MB, Guilford WH. The molecular mechanics of P- and L-selectin lectin domains binding to PSGL-1. Biophys J. 2004;86(1 Pt 1):544–554.
- Litvinov RI, Vilaire G, Shuman H, et al. Quantitative analysis of platelet alpha v beta 3 binding to osteopontin using laser tweezers. J Biol Chem. 2003;278(51):51285–51290.
- Cantero Mdel R, Velázquez IF, Streets AJ, et al. The cAMP signaling pathway and direct protein kinase A phosphorylation regulate polycystin-2 (TRPP2) channel function. J Biol Chem. 2015;290(39):23888–23896.
- Streets AJ, Needham AJ, Gill SK, et al. Protein kinase D-mediated phosphorylation of polycystin-2 (TRPP2) is essential for its effects on cell growth and calcium channel activity. Mol Biol Cell. 2010;21(22):3853–3865.
- Streets AJ, Wessely O, Peters DJM, et al. Hyperphosphorylation of polycystin-2 at a critical residue in disease reveals an essential role for polycystin-1-regulated dephosphorylation. Hum Mol Genet. 2013;22(10):1924–1939.
- Hill SM, Wrobel L, Rubinsztein DC. Post-translational modifications of Beclin 1 provide multiple strategies for autophagy regulation. Cell Death Differ. 2019;26(4):617–629.
- Celic A, Petri ET, Demeler B, et al. Domain mapping of the polycystin-2 C-terminal tail using de novo molecular modeling and biophysical analysis. J Biol Chem. 2008;283(42):28305–28312.
- Medina DL, Di Paola S, Peluso I, et al. Lysosomal calcium signalling regulates autophagy through calcineurin and TFEB. Nat Cell Biol. 2015;17(3):288–299.
- Luyten T, Welkenhuyzen K, Roest G, et al. Resveratrol-induced autophagy is dependent on IP3Rs and on cytosolic Ca(2). Biochim Biophys Acta Mol Cell Res. 2017;1864(6):947–956.
- Pfisterer SG, Mauthe M, Codogno P, et al. Ca2+/calmodulin-dependent kinase (CaMK) signaling via CaMKI and AMP-activated protein kinase contributes to the regulation of WIPI-1 at the onset of autophagy. Mol Pharmacol. 2011;80(6):1066–1075.
- Choi S, Kim HJ. The Ca2+ channel TRPML3 specifically interacts with the mammalian ATG8 homologue GATE16 to regulate autophagy. Biochem Biophys Res Commun. 2014;443(1):56–61.
- Ghislat G, Patron M, Rizzuto R, et al. Withdrawal of essential amino acids increases autophagy by a pathway involving Ca2+/calmodulin-dependent kinase kinase-β (CaMKK-β). J Biol Chem. 2012;287(46):38625–38636.
- Cardenas C, Miller RA, Smith I, et al. Essential regulation of cell bioenergetics by constitutive InsP3 receptor Ca2+ transfer to mitochondria. Cell. 2010;142(2):270–283.
- Petri ET, Celic A, Kennedy SD, et al. Structure of the EF-hand domain of polycystin-2 suggests a mechanism for Ca2+-dependent regulation of polycystin-2 channel activity. Proc Natl Acad Sci U S A. 2010;107(20):9176–9181.
- Kuo IY, Keeler C, Corbin R, et al. The number and location of EF hand motifs dictates the calcium dependence of polycystin-2 function. Faseb J. 2014;28(5):2332–2346.
- Kuo IY, Kwaczala AT, Nguyen L, et al. Decreased polycystin 2 expression alters calcium-contraction coupling and changes beta-adrenergic signaling pathways. Proc Natl Acad Sci U S A. 2014;111(46):16604–16609.
- Paavola J, Schliffke S, Rossetti S, et al. Polycystin-2 mutations lead to impaired calcium cycling in the heart and predispose to dilated cardiomyopathy. J Mol Cell Cardiol. 2013;58:199–208.
- Peintner L, Borner C. Role of apoptosis in the development of autosomal dominant polycystic kidney disease (ADPKD). Cell Tissue Res. 2017;369(1):27–39.
- Sweeney WE Jr., Avner ED. Pathophysiology of childhood polycystic kidney diseases: new insights into disease-specific therapy. Pediatr Res. 2014;75(1–2):148–157.
- Sammels E, Devogelaere B, Mekahli D, et al. Polycystin-2 activation by inositol 1,4,5-trisphosphate-induced Ca2+release requires its direct association with the inositol 1,4,5-trisphosphate receptor in a signaling microdomain. J Biol Chem. 2010;285(24):18794–18805.
- Smith SB, Cui Y, Bustamante C. Optical-trap force transducer that operates by direct measurement of light momentum. Methods Enzymol. 2003;361:134–162.