
ABSTRACT
Liver dysfunction is an outstanding dose-limiting toxicity of gefitinib, an EGFR (epidermal growth factor receptor)-tyrosine kinase inhibitor (TKI), in the treatment of EGFR mutation-positive non-small cell lung cancer (NSCLC). We aimed to elucidate the mechanisms underlying gefitinib-induced hepatotoxicity, and provide potentially effective intervention strategy. We discovered that gefitinib could sequentially activate macroautophagy/autophagy and apoptosis in hepatocytes. The inhibition of autophagy alleviated gefitinib-induced apoptosis, whereas the suppression of apoptosis failed to lessen gefitinib-induced autophagy. Moreover, liver-specific Atg7+/− heterozygous mice showed less severe liver injury than vehicle, suggesting that autophagy is involved in the gefitinib-promoted hepatotoxicity. Mechanistically, gefitinib selectively degrades the important anti-apoptosis factor COX6A1 (cytochrome c oxidase subunit 6A1) in the autophagy-lysosome pathway. The gefitinib-induced COX6A1 reduction impairs mitochondrial respiratory chain complex IV (RCC IV) function, which in turn activates apoptosis, hence causing liver injury. Notably, this autophagy-promoted apoptosis is dependent on PLK1 (polo like kinase 1). Both AAV8-mediated Plk1 knockdown and PLK1 inhibitor BI-2536 could mitigate the gefitinib-induced hepatotoxicity in vivo by abrogating the autophagic degradation of the COX6A1 protein. In addition, PLK1 inhibition could not compromise the anti-cancer activity of gefitinib. In conclusion, our findings reveal the gefitinib-hepatotoxicity pathway, wherein autophagy promotes apoptosis through COX6A1 degradation, and highlight pharmacological inhibition of PLK1 as an attractive therapeutic approach toward improving the safety of gefitinib-based cancer therapy.
Abbreviations: 3-MA: 3-methyladenine; AAV8: adeno-associated virus serotype 8; ATG5: autophagy related 5; ATG7: autophagy related 7; B2M: beta-2-microglobulin; CCCP: carbonyl cyanide m-chlorophenylhydrazone; CHX: cycloheximide; COX6A1: cytochrome c oxidase subunit 6A1; c-PARP: cleaved poly(ADP-ribose) polymerase; CQ: chloroquine; GOT1/AST: glutamic-oxaloacetic transaminase 1, soluble; GPT/ALT: glutamic pyruvic transaminase, soluble; HBSS: Hanks´ balanced salt solution; H&E: hematoxylin and eosin; MAP1LC3/LC3: microtubule associated proteins 1 light chain 3; PLK1: polo like kinase 1; RCC IV: respiratory chain complex IV; ROS: reactive oxygen species; TUBB8: tubulin beta 8 class VIII
Introduction
Gefitinib, an EGFR (epidermal growth factor receptor)-tyrosine kinase inhibitor (TKI), is the most widely used drug for the treatment of non-small cell lung cancer (NSCLC) [Citation1], turning this fatal disease into a manageable chronic condition in many cases [Citation2]. According to recent statistics, up to 50–70% of patients treated with gefitinib have developed hepatic impairment, and 16–26% of these patients are diagnosed with severe abnormities including fatal liver failures [Citation3–5]. Persistent hepatic complication demands dose reduction or discontinuation of the treatment, which will hamper the overall efficacy of gefitinib therapy [Citation6]. However, the underlying mechanism of gefitinib-induced hepatotoxicity is largely unknown. There is hence a lack of effective intervention strategy to improve the drug safety.
Autophagy is a catabolic process of cytoplasmatic component digestion, a cellular pathway crucial for liver development, survival, and homeostasis. Recent data have shown that autophagy mediates hepatocyte apoptosis, the pathogenic characteristic of liver disease [Citation7,Citation8]. Some autophagic activities suppress apoptotic cell death under certain stress conditions, whereas others facilitate apoptosis through degradative processes [Citation9–12], such as removing the negative regulator of FASLG/Fas ligand CD95 signaling as reported by Gump et al. [Citation12]. Interestingly, many studies have indicated that gefitinib induces autophagy and apoptosis concurrently in cancer cells [Citation13–15], which prompted us to examine whether autophagic activities are involved in gefitinib-induced hepatotoxicity.
Mitochondrial respiratory chain complex IV (RCC IV), also known as cytochrome c oxidase (COX), is a transmembrane protein complex vital for the physiological balance of a liver. It has been reported that COX-deficient hepatocytes are more susceptible to apoptosis under stress [Citation16]. Moreover, for mice deficient of COX6A1, a crucial mammalian nuclear encoding subunit of COX, liver dysfunction is more regularly developed, highlighting the pivotal role of COX6A1 in maintaining liver homeostasis [Citation17].
In this study, we revealed the pathway underpinning gefitinib-induced hepatotoxicity. Mechanistically, gefitinib activates in hepatocytes excessive autophagic degradation of COX6A1, which leads to RCC IV dysfunction, ultimately resulting in aberrant apoptosis, a primary feature of liver injury. Notably, this autophagy-promoted apoptosis is dependent on PLK1 (polo like kinase 1). Both Plk1 knockdown by adeno-associated virus serotype 8 (AAV8) and PLK1 inhibition by BI-2536 could protect against gefitinib-induced hepatotoxicity by rescuing COX6A1 expression, without interfering with the anti-cancer activity of gefitinib. PLK1 is hence a potentially attractive intervention strategy to improve the therapeutic safety of gefitinib-based cancer treatment.
Results
Autophagy and apoptosis are sequentially activated in gefitinib-induced hepatotoxicity
We embarked on our study by validating the toxic effect of gefitinib in human liver cells. As shown in Figure S1A, increasing the concentration of gefitinib reduced the survival rates of both HL-7702 cells and human primary hepatocytes, with IC50 values of 19.9 µM and 23.2 µM, respectively. This result is consistent with previously reported outcomes of liver biopsy and biochemical testing revealing the predominant occurrence of hepatocellular injury in gefitinib-treated patients [Citation18]. Next, ANXA5/Annexin V-PI staining followed by flow cytometry was performed on the vehicle and gefitinib-treated cells to examine the hepatocyte apoptosis, a pathogenic characteristic of liver disease [Citation19]. As a result, gefitinib overtly elicited apoptotic response in hepatocytes (). Meanwhile, western blot analysis on the expression level of the c-PARP (cleaved poly(ADP-ribose) polymerase), an endogenous marker of apoptosis, corroborated our findings ( and S1B). We thus concluded that gefitinib induces cytotoxicity in the liver by promoting hepatocyte apoptosis.
Figure 1. Gefitinib activates hepatocytes apoptosis and autophagy. (A) HL-7702 cells were treated for 48 h as indicated. Apoptotic cells were identified by flow cytometry (n = 3). (B–E) HL-7702 cells were treated with gefitinib as indicated for 24 h. (B) Expression of c-PARP was analyzed by western blot. (C) Representative images of transmission electron microscope. For 1750× magnification, scale bar: 5 µm; for 10000× magnification, scale bar: 1 µm. Yellow arrowheads denote autolysosomes. Autophagic vesicles (autophagosome/autolysosome) per cell were quantified (n > 20, one-way ANOVA, Dunnett T3 test). (D) Representative confocal fluorescence micrographs of HL-7702 cells transfected with Ad-mCherry-GFP-LC3B. Scale bar: 20 μ. Quantification of autophagosome and autolysosome puncta was represented (n > 30, one-way ANOVA, Dunnett T3 test). (E) Expression of LC3 was analyzed by western blot. Western blot was repeated at least three times and densitometric analysis was carried out. All data are presented as the mean ± SD. *p < 0.05; **p< 0.01; ***p< 0.001. Abbreviations: GEFI, gefitinib; c-PARP, cleaved PARP
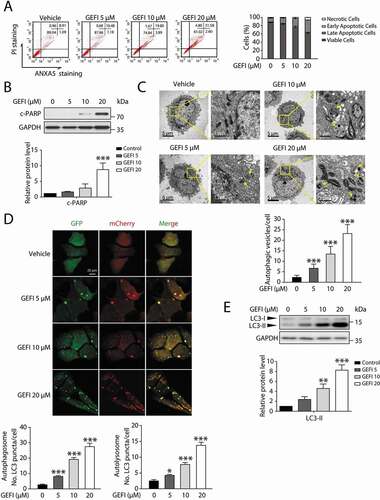
Next, we proceeded to confirm the previously reported involvement of autophagy machinery in liver injury [Citation7–10]. A transmission electron microscopy analysis revealed cytoplasmic accumulation of autophagosomes and autolysosomes, the characteristic of increasing autophagic activities, with dependence on gefitinib concentration (). Moreover, we utilized MAP1LC3/LC3 staining to compare the autophagosome levels between the vehicle, gefitinib-treated group, and hepatocytes treated by Hanks´ balanced salt solution (HBSS). As shown in Figure S1C, gefitinib apparently promoted the formation of LC3 puncta compared with the vehicle, and the number of LC3 puncta in 20 μ gefitinib-treated group was even higher than that in HBSS (starvation) group. To further visualize autophagic flux, we infected hepatocytes with Ad-mCherry-GFP-LC3B. Since GFP is sensitive to acidic conditions, its green fluorescence disappears in lysosomes, wherein the red signal remains stable. The use of tandem luminescent tags with varying pH sensitivity allow to distinguish between two stages of autophagy: autophagosomes colocalized by both GFP and mCherry (yellow), and autolysosomes containing mCherry alone (red). The amount of autophagosome and autolysosome, indicated by the autophagy marker protein LC3 readouts, was increased by gefitinib (). Consistently, western blot analysis demonstrated that gefitinib elevated the expression level of LC3-II in both HL-7702 cells and human primary hepatocytes ( and S1D). When treated with bafilomycin A1, a vacuolar-type H+-translocating ATPase inhibitor, the level of LC3-II was further increased which suggested gefitinib activated autophagy (Figure S1E and S1F). To further validate the result in vivo, we treated the mice with CMC-Na or gefitinib (200 mg/kg/day) by gavage for 4 weeks and injected Ad-mCherry-GFP-LC3B into mice by tail vein 2 weeks before sacrifice. As illustrated in Figure S1G, GPT/ALT (glutamic pyruvic transaminase, soluble) and GOT1/AST (glutamic-oxaloacetic transaminase 1, soluble) were markedly increased in gefitinib-treated mice compared with the vehicle group, indicating gefitinib-mediated liver damage. In line with the in vitro data, the ratio of red positive cells in the gefitinib-treated group was significantly higher than that in the vehicle group (Figure S1H). Taken together, these findings sufficiently demonstrated that gefitinib induced autophagy in hepatocytes.
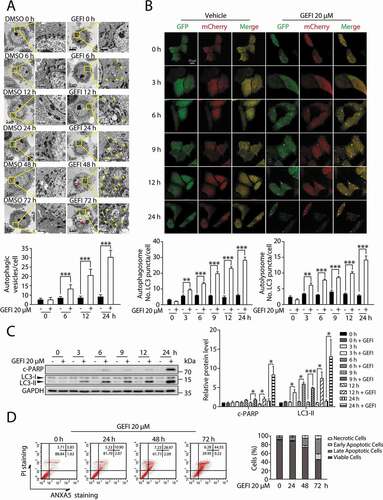
It has been reported that autophagy promotes apoptosis in some cellular settings, while adaptively responds to abnormal apoptotic stress in others [Citation7–11,Citation20]. In order to determine the temporal relationship between autophagy and apoptosis in gefitinib-treated hepatocytes, we conducted transmission electron microscopy analysis in a time-dependent manner. As a result, significant cytoplasmic accumulation of autophagosomes and autolysosomes occurred 6 h after gefitinib treatment, while pyknosis, a prominent morphological feature of apoptosis, appeared after 24 h (). Subsequent autophagic flux quantification () and LC3-II expression assay () both confirmed the evident activation of autophagy around 3 h time point. And the later appearance of apoptosis was further corroborated by c-PARP expression level () and ANXA5-PI staining (). In aggregate, these data suggested that gefitinib-induced autophagy preceded apoptosis during hepatotoxicity development.
Figure 2. Autophagy and apoptosis activated by gefitinib are in sequence. (A) Representative electron micrographs of HL-7702 cells from different time period with DMSO or 20 µM gefitinib treatment. For 1750× magnification, scale bar: 5 µm; for 10000× magnification, scale bar: 1 µm. Yellow arrowheads indicate autolysosomes. Red arrowheads indicated the condensation of nucleus. Autophagic vesicles were quantified (n > 20, Student´s t-test). (B) Representative confocal fluorescence micrographs of HL-7702 cells transfected with Ad-mCherry-GFP-LC3B under gefitinib treatment. Scale bar: 20 μ. Quantification of autophagosome and autolysosome puncta was represented (n > 30, Student´s t-test). (C) HL-7702 cells were treated with 20 µM gefitinib at indicated time periods. Expressions of c-PARP and LC3 were analyzed by western blot. (D) HL-7702 cells were treated with 20 µM gefitinib as indicated. Apoptotic cells were identified by flow cytometry (n = 3). Western blot was repeated at least three times and densitometric analysis was carried out. All data are presented as the mean ± SD. *p < 0.05; **p < 0.01; ***p < 0.001. Abbreviations: GEFI, gefitinib; DMSO, dimethyl sulfoxide; c-PARP, cleaved PARP
Autophagy facilitates apoptosis in gefitinib-induced hepatotoxicity
To assess whether gefitinib-induced autophagy led to apoptosis in hepatocytes, we first attempted to determine the direct effect of gefitinib-induced autophagy on hepatocyte apoptosis. By using siRNA targeting ATG5 (autophagy related 5) or ATG7 (autophagy related 7), we constructed ATG5- or ATG7-deficient hepatocytes and observed in them significant declination of apoptosis compared with negative controls after gefitinib treatment (). We then examined the effect of apoptosis inhibition on autophagy. Blocking apoptosis by pan-caspase inhibitor Z-VAD-FMK failed to prevent the gefitinib-treated hepatocytes from developing autophagic activities (). Collectively, these results suggested that autophagy could cause apoptosis in gefitinib-treated hepatocytes, but not vice versa.
Figure 3. Gefitinib-induced autophagy promotes apoptosis-associated hepatotoxicity. (A) HL-7702 cells were transfected with siRNA, targeting ATG5 (siATG5) or ATG7 (siATG7), or non-targeting siRNA (NC) for 24 h as indicated, followed by treatment with or without gefitinib. Relative protein expressions were detected by western blot. Apoptotic cells were identified using ANXA5-PI staining by flow cytometry after 48-h exposure (n = 3, one-way ANOVA, LSD test). (B) Determining the effect of Z-VAD-FMK on HL-7702 cells treated with gefitinib. Relative protein expressions were detected by western blot. Apoptotic cells were identified by flow cytometry after 48-h exposure (n = 3, one-way ANOVA, LSD test). (C-F) Atg7+/+ and Atg7+/- mice (n = 6 per group) were treated with gefitinib (200 mg/kg/day) by gavage for 4 weeks. The livers and sera were extracted. (C) The expressions of ATG7 and LC3 were analyzed by western blot. (D) Relative liver weights were calculated (n = 6, one-way ANOVA, LSD test) and (E) the levels of GPT/ALT and GOT1/AST were analyzed (n = 6, one-way ANOVA, Dunnett T3 test). (F) H&E staining of liver tissues. For 100× magnification, scale bar: 100 µm; for 200× magnification, scale bar: 50 µm. Yellow arrowheads indicated the cellular level showing prominent hematoxylin and eosin staining objects that were suggestive of apoptosis in specific regions. Western blot was repeated at least three times and densitometric analysis was carried out. The results are presented as the mean ± SD. n.s = no significance; *p < 0.05; **p < 0.01; ***p < 0.001. Abbreviations: GEFI, gefitinib; c-PARP, cleaved PARP; LW, liver weight; BW, body weight; GOT1/AST, glutamic-oxaloacetic transaminase 1, soluble; GPT/ALT, glutamic pyruvic transaminase, soluble; H&E, hematoxylin and eosin; SE, short exposure; LE, long exposure
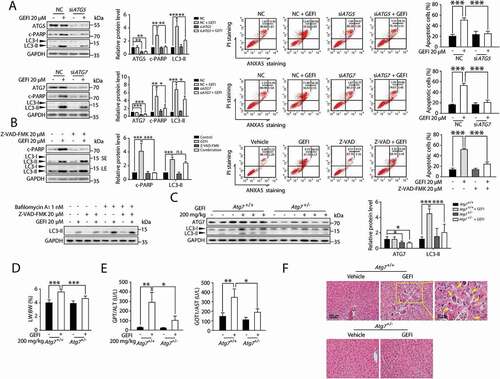
Next, we aimed to evaluate the role of autophagy in gefitinib-induced hepatotoxicity in vivo. Since protein ATG7 is essential for the formation of autophagosome, it is rational to select mice with hepatic Atg7 knockdown for the experiment. In our case, heterozygous hepatocyte-specific Atg7-deficient (Atg7+/-) mice, which exhibited normal hepatic function and intermediate autophagic activity, were chosen over homozygous analogs (atg7-/) to avoid additional hepatic dysfunction caused by complete atg7 knockout [Citation21–23]. Western blot analysis confirmed the specificity of Atg7 knockdown in Atg7+/- mice ( and S2). Initially, Atg7+/- mice were administered 200 mg/kg gefitinib intragastrically for 4 weeks. A consequential disruption of hepatocyte autophagy was observed by western blot analysis (). Notably, atg7flox/flox (referred to as Atg7+/+) mice treated with gefitinib developed severe liver damage as indicated by the increased liver somatic index (), elevated activities of hepatic enzymes GPT/ALT and GOT1/AST (), as well as cellular changes observed by liver histopathology (). Hematoxylin and eosin (H&E) staining of Atg7+/+ mice livers showed normal sinusoidal structure, which was severely damaged in the gefitinib-treated Atg7+/+ mice livers. In contrast, Atg7+/− mice were much less sensitive to gefitinib, exhibiting significantly reduced hepatotoxicity. We also examined NFE2L2/NRF2 activation, a secondary compensatory effect of liver-specific atg7-/- mice [Citation23]. Apparently, gefitinib elicited little influence on NFE2L2 activation, evidenced by the stable transcription level of NFE2L2 target gene Nqo1 both in Atg7+/+ and Atg7+/- mice while increasing dramatically in atg7-/- mice (Figure S3A). In addition, we found that NFE2L2 overexpression failed to affect the gefitinib-induced hepatocyte apoptosis (Figure S3B). NFE2L2 activation was not participated in the intervention of gefitinib-induced hepatotoxicity in Atg7+/- mice.
Taken together, our data demonstrated that gefitinib-induced autophagy could induce apoptosis and promote hepatotoxicity both in vitro and in vivo.
Gefitinib-induced autophagy selectively degrades anti-apoptosis factor COX6A1
The basic process of autophagy in liver disease is to fuse expendable cytoplasmic constituents or intracellular organelles like mitochondria with lysosomes for bulk degradation [Citation24]. Then, we analyzed whether mitochondrial loss occurred under gefitinib treatment. Firstly, we measured mitochondria quantity by using MitoTracker Deep Red probe. After gefitinib treatment, the reduction of mitochondria mass was not observed (Figure S4A). As the relative mitochondrial number can be predicted by quantifying the mitochondrial DNA copy number, we detected the level of mtDNA content and found that gefitinib treatment could not decrease mtDNA copy number (Figure S4B). Furthermore, we used mito-QC to monitor and quantify mitophagy. mito-QC displays red and green fluorescence during steady-state conditions, but the mCherry signal becomes stable when mitophagy is induced [Citation25]. As the results shown in Figure S4C, there was no obvious red puncta with gefitinib treatment while mitophagy inducer carbonyl cyanide m-chlorophenylhydrazone (CCCP) activated mitophagy in this system. Consistently, as we analyzed the expression levels of two mitochondrial markers, mitochondrial matrix protein HSPD1/HSP60 (heat shock protein family D (Hsp60) member 1) and mitochondrial outer membrane receptor TOMM20 (translocase of outer mitochondrial membrane 20) (Figure S4D), the results showed that neither protein marker level was affected by gefitinib. We therefore speculated it is the autophagic degradation of certain key proteins that activated apoptosis in gefitinib-induced hepatotoxicity. To globally screen the gefitinib responders potentially associated with autophagy, we conducted a proteomics study based on TMT labeling and LC-MS/MS using three treatment groups: vehicle, gefitinib-treated and gefitinib-plus-chloroquine (CQ)-treated liver cells. We sought the proteins that were either down-regulated in the gefitinib treatment group relative to the vehicle group, or up-regulated in the combination group relative to the gefitinib group (Table S1). As shown in the Venn diagram, three proteins were highlighted meeting both selection conditions: B2M (beta-2-microglobulin), COX6A1 (cytochrome c oxidase subunit 6A1) and TUBB8 (tubulin beta 8 class VIII) (). Subsequent western blot analysis revealed that COX6A1 and TUBB8 were much more susceptible to gefitinib treatment in a dose- and time-dependent manner, than B2M ().
Figure 4. Gefitinib activates autophagic degradation of COX6A1 in hepatocytes. (A) TMT quantitative proteomic profiling was used to determine the protein expression levels. The levels of the differentially expressed proteins were summarized, p < 0.05. (B) Differentially expressed proteins were detected by western blot in HL-7702 cells with gefitinib treatment. (C) The effect of autophagy inhibition on the expression of specific proteins. The influence of CQ and gefitinib treatment (left panel) and the effect of ATG5 knockdown under gefitinib treatment (right panel). The expression levels of COX6A1, TUBB8, LC3 and ATG5 were analyzed by western blot. (D) HL-7702 cells were treated with gefitinib at the indicated doses and time, and the mRNA expression of COX6A1 was analyzed by qPCR (one-way ANOVA, Dunnett T3 test and LSD test). (E) HL-7702 cells were treated with CHX with or without gefitinib for indicated time. COX6A1 was detected by western blot. (F) HL-7702 cells were treated with gefitinib or vehicle for 24 h or with MG132 for 8 h before the final time point. Western blot analysis was used to detect the expression levels of COX6A1 and Ub. (G) HL-7702 cells were treated by 3-MA with or without gefitinib for 24 h. Western blot was performed to measure the expression levels of COX6A1 and LC3. (H) Expressions of ATG7 and COX6A1 were analyzed by western blot in Atg7+/+ and Atg7+/- mice treated with gefitinib (200 mg/kg/day). (I) The cellular distribution of LAMP1 and COX6A1 in HL-7702 cells was observed by immunofluorescence. Scale bar: 25 μ. Pearson´s correlation coefficient and overlap coefficient values were analyzed. Western blot was repeated at least three times and densitometric analysis was carried out. The results are presented as the mean ± SD. n.s = no significance; *p < 0.05; **p < 0.01; ***p < 0.001. Abbreviations: TMT, Tandem Mass Tag; GEFI, gefitinib; CQ, chloroquine; qPCR, quantitative polymerase chain reaction; CHX, cycloheximide; Ub, ubiquitin; 3-MA, 3-methyladenine; SE, short exposure; LE, long exposure
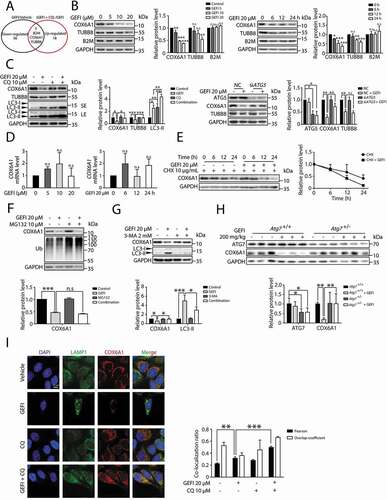
Next, we proceeded to examine whether autophagy contributed to the gefitinib-induced down-regulation of COX6A1 and TUBB8. Western blot assay showed that CQ, a late-stage autophagy inhibitor, successfully rescued COX6A1 and TUBB8 expressions (). Meanwhile, only the level of COX6A1, but not of TUBB8, was overtly increased in gefitinib-treated siATG5 cells, compared with the negative control (). Similar results were also observed in human primary hepatocytes wherein COX6A1 level could be decreased by gefitinib and rescued by CQ (Figure S5A and S5B). These data implied that gefitinib-induced autophagy may have selectively removed COX6A1, the isoform subunit of mitochondrial respiratory chain complex IV (RCC IV) [Citation26]. Having already excluded the involvement of mitophagy in gefitinib treatment, we concluded that COX6A1 itself was removed under gefitinib treatment.
To further validate the gefitinib-activated autophagic degradation of COX6A1, we first examined the effect of gefitinib on the COX6A1 transcription level by quantitative PCR (qPCR) assay. As a result, gefitinib treatment failed to down-regulate the transcription level of COX6A1 (), suggesting that the transcription process was not responsible for COX6A1 reduction. Furthermore, gefitinib treatment substantially decreased the half-life of COX6A1 in cells pre-treated with cycloheximide (CHX), a protein biosynthesis inhibitor () [Citation27]. This outcome eliminated the effect of protein translation on the COX6A1 level. Besides the autophagy-lysosome pathway, the ubiquitin-proteasome system is another way to mediate protein quantity control. To exclude the contribution of the proteasome to gefitinib-induced COX6A1 degradation, we employed proteasome inhibitor MG132 for western blot analysis and found it failed to affect the COX6A1 level ().
After excluding the aforementioned factors, we found 3-methyladenine (3-MA), a widely used autophagy inhibitor by hampering the class III phosphatidylinositol 3-kinase (PtdIns3K) activity [Citation28], effectively reversed gefitinib-induced COX6A1 reduction (). Similar results were obtained in vivo in the liver of Atg7+/− mice (). By immunofluorescence, we found COX6A1 could colocalization with mCherry-GFP-LC3B in some part of area under gefitinib-plus-CQ treatment which suggested that COX6A1 was enclosed in autophagosome (yellow puncta) (Figure S5C). In addition, by co-staining COX6A1 and lysosome marker LAMP1, we confirmed that gefitinib could promote COX6A1 to lysosome for degradation (). Hence, we concluded that COX6A1 was abated by gefitinib through an autophagic degradation mechanism both in vitro and in vivo.
Gefitinib-induced COX6A1 degradation promotes apoptosis by impairing the function of RCC IV
To determine how COX6A1 degradation influences gefitinib-induced hepatotoxicity, we generated COX6A1-overexpressing hepatocytes whereof the apoptosis rates and related protein levels were measured. The results showed that rescuing COX6A1 expression in hepatocytes alleviated gefitinib-induced apoptosis (), suggesting that COX6A1 reduction contributed to gefitinib-induced hepatotoxicity. Furthermore, we constructed COX6A1-deficient hepatocytes by transfecting liver cells with two siRNA strands targeting COX6A1 (siCOX6A1). As expected, COX6A1 down-regulation promoted hepatocyte apoptosis ().
Figure 5. Gefitinib-induced COX6A1 degradation impairs mitochondrial function and promotes apoptosis of hepatocytes. (A) HL-7702 cells were transfected with pcDNA3.0-COX6A1 plasmid or vector and exposed to gefitinib. COX6A1 and c-PARP were analyzed by western blot after 24-h exposure, and apoptotic cells were quantified by flow cytometry with ANXA5-PI staining after 48-h exposure (n = 3, one-way ANOVA, LSD test). (B) HL-7702 cells were transfected with non-targeting siRNA (NC) or siRNA targeting COX6A1 (siCOX6A1). The expression levels of COX6A1, c-PARP and GAPDH were determined after 24-h exposure, and the apoptosis rates were determined after 48-h exposure (n = 3, one-way ANOVA, LSD test). (C) HL-7702 cells were treated with or without gefitinib for 24 h, and the mitochondria were extracted to measure the expression of COX6A1. (D–F) The mitochondrial complex IV function was tested. (D) HL-7702 cells were treated with or without gefitinib for 24 h and collected for mitochondrial isolation (n = 3, Student´s t-test). (E) Isolated mitochondria were pre-treated with gefitinib directly in a dose-dependent manner for 15 min (n = 3). (F) HL-7702 cells were transfected with vector or pcDNA3.0-COX6A1 and then treated with gefitinib for 24 h and mitochondria were isolated (n = 3, one-way ANOVA, Dunnett T3 test). Western blot was repeated at least three times and densitometric analysis was carried out. The data are expressed as the mean ± SD; *p < 0.05; **p < 0.01; ***p < 0.001. Abbreviations: GEFI, gefitinib; c-PARP, cleaved PARP; RCC IV, mitochondrial respiratory chain complex IV; Cyto, cytoplasm; Mito, mitochondria
Next, we sought to investigate the mechanism of gefitinib-induced hepatotoxicity by first examining whether gefitinib could trigger RCC IV dysfunction through down-regulating COX6A1 in hepatocytes. To verify this, we measured the COX6A1 expression level in mitochondria isolated from hepatocytes with or without gefitinib treatment. As expected, substantially less COX6A1 was detected in the mitochondria of gefitinib-treated hepatocytes compared with that in the control cells (). Concomitantly, RCC IV activity was found to be significantly down-regulated by gefitinib treatment ().
To assess whether the gefitinib-mediated COX6A1 reduction abrogated RCC IV activity, we treated isolated mitochondria with gefitinib of varying concentrations and evaluated the corresponding RCC IV functions. Interestingly, RCC IV activity was not affected by gefitinib (), suggesting that gefitinib cannot directly cause RCC IV disorder. To further determine the role of COX6A1 in RCC IV dysfunction, we overexpressed COX6A1 in hepatocytes to examine whether gefitinib-induced RCC IV dysfunction could be reversed. As a result, COX6A1 up-regulation markedly recovered RCC IV function in gefitinib-treated hepatocytes (). Taken together, these results provided proof-of-concept data that gefitinib selectively activated autophagic degradation of COX6A1, which inhibited RCC IV function, resulting in apoptosis activation.
PLK1-dependent autophagy is involved in gefitinib-induced hepatotoxicity
Based on the findings thus far, we speculated that blocking the autophagic degradation of COX6A1 may be a promising intervention against gefitinib-induced hepatotoxicity. It might be rational to consider CQ or another popular autophagy inhibitor hydroxychloroquine as an intervention agent, but since both have been reported to cause liver abnormalities [Citation29,Citation30]. In addition, the results showed in Figure S5D suggested that CQ could accumulate the portion of COX6A1 in the cytoplasmic fraction while could not rescue the level of COX6A1 in the mitochondrial fraction under gefitinib treatment. We therefore must seek alternative candidates. Through comparing microarray gene expression data between the vehicle and the gefitinib-treated liver tissues, as well as monitoring the gefitinib-induced hepatocellular response by qPCR, we identified PLK1 as a potential regulator of gefitinib-induced autophagy (). PLK1 is a serine and threonine kinase that promotes autophagy activation via inhibition of MTOR complex 1 (MTORC1) kinase in eukaryotic cells [Citation31–33]. Western blot analysis revealed that PLK1 expression level in HL-7702 cells and human primary hepatocytes could be increased by gefitinib (). Notably, PLK1 level positively correlated with LC3-II expression, the surrogate of autophagic activity (). We then used the mCherry-GFP-LC3B probe to further investigate the relationship between PLK1 and autophagy. As a result, knockdown of PLK1 reversed the gefitinib-induced autophagic flux, while overexpression of PLK1 enhanced autophagy as expected (). Of note, knockdown or overexpression of COX6A1 caused little effect on gefitinib-activated autophagy ().
Figure 6. PLK1 is involved in the gefitinib-induced autophagy. (A) The transcription level of PLK1 was determined by qPCR (n = 3, one-way ANOVA, LSD test). (B) HL-7702 cells or human primary hepatocytes were treated with gefitinib. The expression levels of PLK1 and GAPDH were determined by western blot. (C–F) HL-7702 cells were transfected with non-targeting siRNA (NC) or siRNA targeting PLK1 (siPLK1) or COX6A1 (siCOX6A1), followed by treatment with or without gefitinib. HL-7702 cells were transfected with pCMV6-PLK1 or pcDNA3.0-COX6A1 or vector, followed by treatment with or without gefitinib for 24 h. (C) The expression levels of PLK1, LC3, COX6A1 and c-PARP were measured by western blot. (D, E) Representative confocal fluorescence micrographs of HL-7702 cells transfected with Ad-mCherry-GFP-LC3B. Scale bar: 20 μm. Quantification of autophagosome and autolysosome puncta was represented (n > 30, one-way ANOVA, Dunnett T3 test). (F) Apoptotic cells were quantified by flow cytometry with ANXA5-PI staining (n = 3, one-way ANOVA, LSD test). Western blot was repeated at least three times and densitometric analysis was carried out. The data are expressed as the mean ± SD; n.s = no significance; * p < 0.05; **p < 0.01; ***p < 0.001. Abbreviations: GEFI, gefitinib; c-PARP, cleaved PARP
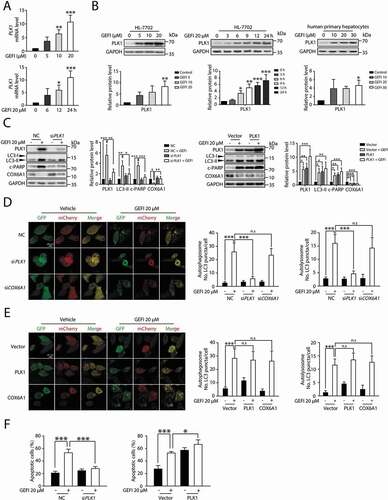
Next, we proceeded to clarify the correlation between PLK1 and gefitinib-induced hepatotoxicity. By silencing PLK1 in hepatocytes, we were able to examine its impact on apoptosis activation. In the siPLK1 cells, gefitinib failed to induce apoptosis, indicated by the unaffected c-PARP level (), a result consistent with the flow cytometry data of ANXA5-PI staining (). Conversely, overexpression of PLK1 enhanced apoptotic activity in gefitinib-treated hepatocytes (). Taken together, these results represented PLK1 as a mediator of gefitinib-induced autophagy and apoptosis.
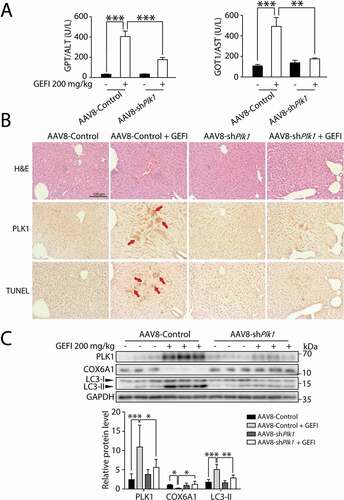
In addition, we sought to determine the significance of PLK1 in autophagy-promoted hepatotoxicity in vivo. First, we constructed ALB-Plk1 shRNA, a liver-specific AAV8 vector with an albumin promoter, to knock down PLK1 expression. As shown in , the elevated GPT/ALT and GOT1/AST levels by gefitinib in hepatocytes were both reversed by the AAV8-knockdown of Plk1, suggesting that PLK1 could mediate gefitinib-induced hepatotoxicity. Moreover, liver histological analysis by immunohistochemistry (IHC) showed localization of PLK1 in injured hepatic regions, and that Plk1 knockdown by AAV8 led to alleviation of liver injury (). Furthermore, western blot analysis showed that the liver-specific knockdown of PLK1 in mice could restore the LC3-II and COX6A1 levels altered by gefitinib (). Taken together, these data suggested that knockdown of PLK1 in vivo could inhibit the gefitinib-induced activation of autophagy and apoptosis. PLK1 therefore could be considered as a positive regulator of autophagy-related liver injury caused by gefitinib.
Figure 7. PLK1 is associated with gefitinib-induced liver damage. C57BL/6 mice were randomly divided into 4 groups (n = 6 per group). After injection of AAV8-shPlk1 adeno virus by tail vein for 3 weeks, mice were treated with CMC-Na or gefitinib (200 mg/kg/day) by gavage for another 4 weeks. (A) The levels of GPT/ALT and GOT1/AST were determined (n = 6, one-way ANOVA, Dunnett T3 test). (B) H&E staining, IHC for PLK1 and TUNEL staining of liver tissues. Scale bar: 100 μm. H&E staining distinguish normal or damaged sinusoidal structure. Red arrowheads indicated positive regions. (C) Liver tissues were extracted and lysed, and the expression levels of PLK1, COX6A1, LC3 and GAPDH were analyzed by western blot. Western blot was repeated at least three times and densitometric analysis was carried out. The data are expressed as the mean ± SD; *p < 0.05; **p < 0.01; ***p < 0.001. Abbreviations: GEFI, gefitinib; H&E, hematoxylin and eosin. GOT1/AST, glutamic-oxaloacetic transaminase 1, soluble; GPT/ALT, glutamic pyruvic transaminase, soluble; IHC, immunohistochemistry
PLK1 inhibitor BI-2536 prevents gefitinib-induced hepatotoxicity via blocking COX6A1 degradation
The modulatory role of PLK1 in gefitinib-mediated hepatocyte autophagy prompted us to examine the possibility to use a potent PLK1 inhibitor, such as BI-2536, as a therapeutic intervention for gefitinib-induced hepatotoxicity. Western blot analysis showed that BI-2536 could partially reverse the gefitinib-induced LC3-II boost and COX6A1 loss, as well as alleviate the raised apoptosis rate ().
Figure 8. Gefitinib-induced hepatotoxicity is alleviated by PLK1 inhibitor BI-2536 without compromising the anti-cancer activity of gefitinib. (A) HL-7702 cells were treated with BI-2536 or gefitinib or vehicle for 24 h. The expressions levels of LC3 and COX6A1 were determined. HL-7702 cells were treated with BI-2536 or gefitinib or vehicle for 48 h. Apoptotic cells were identified by flow cytometric analysis (n = 3, one-way ANOVA, LSD test). (B–E) Female ICR mice (n = 6 per group) were treated with BI-2536 (5 mg/kg, twice a week) by intraperitoneal injection or gefitinib (200 mg/kg/day) by gavage. (B) Liver lysates were used to detect the expressions of COX6A1 and LC3. (C) Relative liver weights were calculated (n = 6, one-way ANOVA, LSD test). (D) Serum samples were collected to analyze the levels of GPT/ALT and GOT1/AST (n = 6, one-way ANOVA, Dunnett T3 test). (E) Liver tissues from the mice were collected and stained with H&E for histopathological analysis. Yellow arrowheads indicated the cellular level showing prominent hematoxylin and eosin staining objects that were suggestive of apoptosis in specific regions. For 100× magnification, scale bar: 100 µm; for 200× magnification, scale bar: 50 µm. (F) SRB staining analysis was carried out to determine the survival rates of three different NSCLC cell lines (n = 3, one-way ANOVA, LSD test). Western blot was repeated at least three times and densitometric analysis was carried out. The data are expressed as the mean ± SD; n.s = no significance; *p < 0.05; **p < 0.01; ***p < 0.001. Abbreviations: GEFI, gefitinib; LW, liver weight; BW, body weight; GOT1/AST, glutamic-oxaloacetic transaminase 1, soluble; GPT/ALT, glutamic pyruvic transaminase, soluble; H&E, hematoxylin and eosin; SRB, sulforhodamine B; SE, short exposure; LE, long exposure
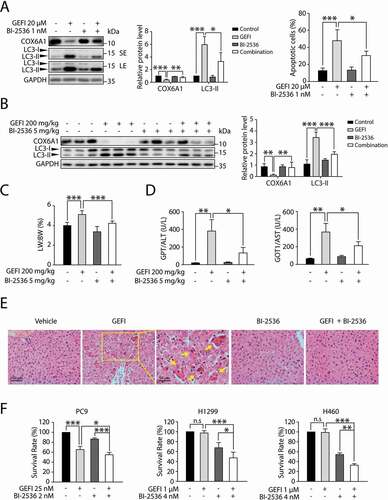
Encouraged by the in vitro results, we sought to evaluate whether BI-2536 could protect the liver from gefitinib-induced hepatotoxicity in mice. As expected, BI-2536 could partially restore the LC3-II and COX6A1 levels altered by gefitinib (). Meanwhile, the assessment of liver weight and hepatic enzymes activity showed that the BI-2536-plus-gefitinib treatment group had milder liver damage than the group receiving gefitinib solely (). These results are consistent with the outcome of liver histopathology with H&E staining (), suggesting that PLK1 inhibitor BI-2536 could protect against gefitinib-induced hepatotoxicity via inhibition of PLK1-dependent autophagy.
Next, we employed one gefitinib-sensitive NSCLC cell line, PC9, and two gefitinib-resistant NSCLC cell lines, H1299 and H460, to determine the effect of BI-2536 on the anti-cancer activity of gefitinib [Citation34]. The results showed that BI-2536 slightly promoted gefitinib-induced apoptosis of PC9 cells while evidently improved the efficacy of gefitinib in H1299 and H460 cells (). Taken together, these data showed that BI-2536 could be a potential treatment for gefitinib-induced liver toxicity without compromising the anti-cancer activity of the drug.
Discussion
In this study, we first revealed a pivotal role of autophagy in gefitinib-induced hepatotoxicity and provided mechanistic insight into the gefitinib-mediated autophagy-promoted apoptosis pathway. After being administered with gefitinib at a toxic dose, Atg7+/− mice developed mild liver injuries. Mechanistically, gefitinib-induced autophagic degradation of liver-specific COX6A1 activates apoptosis, a prime cellular feature of hepatotoxicity. In fact, gefitinib-induced hepatotoxicity could be reversed by the overexpression of COX6A1. Remarkably, we also found that the toxic activity of gefitinib-induced autophagy is dependent on PLK1. The AAV8-mediated knockdown of Plk1 and PLK1 inhibitor BI-2536 could both protect against gefitinib-induced hepatotoxicity by disrupting COX6A1 autophagic degradation.
The concentration of gefitinib used in our study was decided based on the following considerations. In some studies, the average of maximum plasma concentration is around 492 −679 ng/mL (1.0–1.5 μM). Some individuals, from whom the level of Cmax was higher than 2.0 μM [Citation35,Citation36]. Compounds that are extensively bound to plasma proteins may have a low volume of distribution, can have long plasma half-life and have low clearance by liver and kidney. In the study of Prashant B. Nigade et al., they demonstrate that the ratio of liver to plasma concentrations after administration of gefitinib 2 h in mice was 20.83 ± 8.49 [Citation37]. The data suggested that the concentration in liver is much higher than plasma concentration and the concentration used in this study correspond to clinical settings and patient plasma levels.
The reason for liver dysfunction being more frequently associated with gefitinib than other EGFR inhibitors remains unclear [Citation38,Citation39]. Our study identified the vital role of autophagy in gefitinib-induced liver dysfunction. Among several commonly used EGFR inhibitors, only gefitinib was found to activate excessive autophagic activity in hepatocytes (Figure S6A), which in part explains the high incidence and severity of hepatotoxicity restricted to gefitinib-treated cohorts.
Autophagy and apoptosis often occur in the same cell, wherein excessive autophagic activities precede apoptotic cell death [Citation9–12]. Our findings are the first report on autophagy-promoted apoptosis in drug-induced liver injury. We herein provide several additional lines of evidence to support our finding. First, blockage of autophagy by silencing ATG5 or ATG7 in hepatocytes could diminish gefitinib-mediated hepatocyte apoptosis (). Next, we assessed other possible responders of gefitinib treatment that might affect autophagy and apoptosis in hepatocytes. We found silencing EGFR, the drug target, failed to enhance autophagy or apoptosis in gefitinib-treated hepatocytes (Figure S6B). We also tested that NFE2L2 activation was not involved in gefitinib-induced hepatotoxicity in Atg7+/- mice suggesting the significant role of autophagy. Taken together, these additional data further corroborated our conclusion that excessive autophagy induced by gefitinib led to liver damage by promoting apoptosis.
It has been reported that aberrant autophagy can stimulate apoptosis by depleting endogenous inhibitors of the cell death pathway [Citation12,Citation40]. In our study, we found COX6A1, a vital keeper of RCC IV function, was in fact degraded by autophagy. Inhibition of RCC IV blocks the electron transfer process of the mitochondrial respiratory chain and induces rapid apoptosis [Citation41]. Conversely, gefitinib-induced RCC IV disorder could be significantly reversed by COX6A1 overexpression in hepatocytes. In part, our finding explains the mechanism of COX6A1 deficiency-stimulated liver dysfunction, and the level of COX6A1 may be used to predict drug-induced hepatotoxicity.
Our report also for the first time provides evidence that COX6A1 could be degraded by autophagy-lysosomal pathway. This observation is distinct from the general mechanisms whereby autophagy inducer HBSS or mitophagy inducer CCCP [Citation42] functions. In fact, both HBSS and CCCP failed to selectively decrease the COX6A1 level (Figure S7). In cancer cells, gefitinib has been reported to induce reactive oxygen species (ROS) production, which participates in a variety of stress-activated autophagy. We therefore assessed whether ROS could mediate COX6A1 protein degradation. As a result, we found that gefitinib failed to induce ROS formation in hepatocytes (Figure S8). ROS hence is not involved in the gefitinib-induced autophagic degradation of COX6A1. With the combination of CQ, we found it is cytoplasmic COX6A1 that is degraded by autophagy under gefitinib treatment (Figure S5D). However, the specific molecular mechanism for regulating COX6A1 autophagic degradation is still elusive and requests for further study.
Finally, our study highlighted that PLK1, a positive regulator of gefitinib-induced autophagy in hepatocytes, could lead to apoptosis-associated hepatotoxicity. This observation is consistent with previous literature showing that inhibition of the PLK1-regulated MTOR signaling pathway stimulates autophagy in non-mitotic cells [Citation32]. It was reported that overexpression of PLK1 in cancer cells promotes cell proliferation [Citation43], however, the role in non-cancerous cells with low or no expression of PLK1 is unclear. Among Alzheimer disease (AD) patients, the aggregation of PLK1 is often observed in the susceptible hippocampal and cortical neurons. Inhibition of PLK1 activity with BI-2536 or depletion of PLK1 by RNAi could both reduce β-amyloid (Aβ)-induced neuronal cell death [Citation44]. PLK1 is thus found to be a mediator of cell death in AD. Our data are similar with these findings. Given that liver-specific plk1 knockout mice do not show any liver dysfunction [Citation45], PLK1 inhibitors therefore can be considered as potential intervention agents for gefitinib-induced hepatotoxicity. Of note, how gefitinib increases the PLK1 transcription level merits further investigation.
In conclusion, our research reveals a new system of drug-induced hepatotoxicity where excessive autophagy promotes hepatocyte apoptosis. We further expound the autophagic degradation of COX6A1 as the distinct component of the pathway underlying this toxicity model. Based on our mechanistic findings, we identify PLK1 as a novel therapeutic target for gefitinib-induced hepatotoxicity. The clinical development of PLK1 inhibitor may bring new hope to patients under gefitinib-based cancer therapy, and open a new avenue for the study of hepatic adverse drug reactions.
Materials and methods
Animals
atg7flox/flox mice (RBRC02759) were provided by RIKEN BioResource Research Center (Tsukuba, Japan) through the National BioResource Project of the MEXT (Japan) [Citation21]. The details of their genetic background are as follows: B6.Cg-ATG7 <tm1Tchi>. The ALB-Cre transgenic mice (JAX-003574), expressing Cre recombinase under the control of albumin promoter, were obtained from the Shanghai Research Center for Model Organisms (Shanghai, China). atg7flox/flox mice were crossed with ALB-Cre mice to generate Atg7flox/+: Cre mice (referred to as Atg7+/–). C57BL/6 and ICR mice were purchased from the Shanghai Laboratory Animal Center (Shanghai, China). All treatment groups consisted of littermates that were age- and sex-matched. All mice were bred according to the Institutional Animal Care and Use Committee (IACUC) protocol of Zhejiang University. All the experiments were approved by the Center for Drug Safety Evaluation and Research of Zhejiang University. The mice were housed in barrier facilities with a 12-h light/dark cycle, food and water available ad libitum. Approximately 1 week was provided before starting experiments to allow the animals to acclimate the laboratory environment.
Cell culture and treatment
The human hepatocyte cell line HL-7702 was purchased from Jennio Biological Technology (JNO-048). HL-7702 cells were maintained in RPMI-1640 (Gibco, 21870076) supplemented with 10% fetal bovine serum (Gibco, 16140071), 100 U/mL penicillin and 100 μg/mL streptomycin (Gibco, 15140122) in a humidified atmosphere with 5% CO2 and 95% air at 37°C. The human primary hepatocytes were purchased from BioreclamationIVT (F00995-P and M00995-P), and the clinical characteristics of the donors are shown in Table S2-S4. Human primary hepatocytes were thawed in INVITROGROTM CP Medium (BioreclamationIVT, S03316) with 10% fetal bovine serum (Gibco, 16140071) at 37°C in a humidified atmosphere with 5% CO2 for 24 h and then replaced with INVITRO TM HI Medium (BioreclamationIVT, Z99009).
Gefitinib (SML1657), chloroquine (CQ; C6628), cycloheximide (CHX; C7698), MG132 (M8699), 3-methyladenine (3-MA; M9281) and Hanks´ balanced salt solution 10× (HBSS; H1641) were purchased from Sigma-Aldrich. Bafilomycin A1 (S1413) and BI-2536 (S1109) were purchased from Selleck Chemicals. Z-VAD-FMK (c1202) was purchased from Beyotime. Erlotinib (T0373), afatinib (T2303), carbonyl cyanide m-chlorophenylhydrazone (CCCP; T7081) were purchased from Targetmol. Throughout the experiments (if not stated otherwise), HL-7702 cells were treated with 20 μM gefitinib for the indicated time periods or with 5, 10 or 20 μM gefitinib for 24 h. In selected samples, 20 μM Z-VAD-FMK, 10 μg/mL CHX, 2 mM 3-MA, 1 nM BI-2536, 20 μM erlotinib, 5 μM afatinib and 20 μM CCCP were used. In some samples, 10 μM CQ and 1 nM bafilomycin A1 was added 2 h before the gefitinib treatment, and 10 μM MG132 was added 8 h before cell collection.
Plk1 knockdown by adeno-associated virus (AAV)
A liver-specific adeno-associated virus serotype 8 (AAV8), allowing for hepatocyte-targeted RNAi against Plk1 (AAV8-shPlk1) under the control of albumin promoter, was constructed and packaged by Vigene Biosciences. The AAV8 vectors (1.02 × 10¹³ vg/mL) and AAV8-shPlk1 (1.38 × 10¹³ vg/mL) were then injected into C57BL/6 mice through the tail vein (4 × 10¹¹ vg per mouse). Three weeks after injection, the mice were treated with CMC-Na or gefitinib (200 mg/kg/day) by gavage for 4 weeks.
Autophagic flux measurement
Ad-mCherry-GFP-LC3B was employed to monitor autophagic flux. For in vitro analysis, firstly, HL-7702 cells were grown on glass bottom cell culture dish and infected with Ad-mCherry-GFP-LC3B (Vigene Biosciences, AD202001) according to the manufacturer´s instructions. After virus transfection at a multiplicity of infection (MOI) of 20 for 6 h, the adenovirus-containing supernatant was removed and the cells were cultured in fresh medium for another 24 h. After being treated with experimental conditions as indicated, cells were washed with phosphate-buffered saline (PBS; Gibco, 10010023) twice and fixed with 4% paraformaldehyde (Sigma-Aldrich, P6148) for 20 min at room temperature. Cells were then washed with PBS three times, sealed by antifade mounting medium and kept in a dark place. Finally, images were taken with an Olympus FV1000 confocal laser scanning microscope (Tokyo, Japan). For in vivo analysis, C57BL/6 mice were randomly divided into 2 groups (n = 6 per group) and treated with CMC-Na or gefitinib (200 mg/kg/day) by gavage for 4 weeks. Ad-mCherry-GFP-LC3B was injected into mice through the tail vein (5 × 10⁸ pfu per mouse) 2 weeks before sacrificed. Autophagic flux was evaluated by calculating the number of yellow and red puncta.
Gene identification
Tissue-genotyping PCR was performed with following primers:
Hind-Fw (5´-TGGCTGCTACTTCTGCAATGATGC-3´)
and Pst-RV (5´-CAGGACAGAGACCATCAGCTCCAC-3´) for the Atg7 flox allele, and ATG7-wt-forward (5´-ATTGTGGCTCCTGCCCCAGT-3´)
and Pst-RV (5´-CAGGACAGAGACCATCAGCTCCAC-3´) for the wild type allele.
Mitochondria isolation
Mitochondria were separated using the mitochondria isolation kit (Beyotime, C3601). Briefly, cells were suspended in ice-cold isolation buffer for 10–15 min and homogenized with a Dounce type homogenizer (Kimble-chase, 885300–0002). The sample was centrifuged at 1000 × g for 10 min, and the supernatant was further centrifuged at 3500 × g for 10 min. The pellet was washed once with the isolation buffer and centrifuged again at 11000 × g for 10 min to collect the mitochondria.
Activity evaluation of respiratory chain complex IV
The activities of respiratory chain complex IV were detected using the MitoCheck® Complex IV Activity Assay Kit (Cayman Chemical Company, 2A-700990-96). The submitochondrial particles were prepared by subjecting the intact mitochondria to three successive freeze-thaw cycles, and 50 μg submitochondrial particles (0.5 mg/mL, 100 μL) were used per test. Mitochondria provided by the kit were treated with gefitinib for 15 min before incubation. Isolated mitochondrial particles or gefitinib-treated mitochondria were then incubated with reduced cytochrome c. The changes in the absorbance at 550 nm were measured every 30 s for 15 min at 25°C. The slope of the linear portion of the curve was calculated to represent the rate of activity. Complex IV activity was calculated as follows: % activity = (rate of the sample/rate of the vehicle control) × 100%.
Flow cytometric analysis
For ANXA5-PI staining, cells were treated for the indicated time periods, harvested and washed with PBS. The Pharmingen™ FITC Annexin V Apoptosis Detection Kit I (BD Pharmingen, 556547) was used to measure the apoptosis rate, according to the manufacturer´s instructions. For each sample, 1 × 10⁴ cells were acquired and analyzed using a FACSCalibur cytometer (BD, San Jose, CA, USA). ANXA5− PI−, ANXA5− PI+, ANXA5+ PI−, ANXA5+ PI+ cells represented viable cells, necrotic cells, early apoptotic cells and late apoptotic cells respectively.
For mitochondria staining, cells were treated for the indicated time periods, harvest and washed with fresh media. MitoTrackerTM Deep Red FM (Invitrogen, M22426) was used to label mitochondria. The cells were incubated in prewarmed (37°C) staining solution containing 200 nM MitoTracker probe for 15 min. After staining was complete, re-pellet the cells by centrifugation and resuspend cells in fresh prewarmed medium. For each sample, 1 × 10⁴ cells were acquired and analyzed using a FACSCalibur cytometer.
mtDNA quantitation
mtDNA was isolated by using Mitochondrial DNA Isolation Kit (Abcam, ab65321) and genomic DNA was isolated by using EasyPure® Genomic DNA Kit (Transgene, EE101-02). To quantify nDNA, we used a primer set that detects the PECAM1 (platelet/endothelial cell adhesion molecule 1) gene on chromosome 6. Quantification of the relative copy number of mtDNA to nDNA was carried out using analysis of the difference in threshold amplification between mtDNA and nDNA (ΔΔC(t) method) using qPCR. The forward and reverse sequences were shown as below:
nDNA (PECAM 1) forward, 5'- ATGGAAAGCCTGCCATCATG −3´;
nDNA (PECAM 1) reverse, 5'- TCCTTGTTGTTCAGCATCAC −3´;
mtDNA (MT-ND2) forward, 5'- CCTATCACCCTTGCCATCAT −3´;
mtDNA (MT-ND2) reverse, 5'- GAGGCTGTTGCTTGTGTGAC −3´.
Mitophagy assay
mito-QC, a tandem mCherry-GFP tag fused to the mitochondrial targeting sequence of the outer mitochondrial membrane protein FIS1, was a gift from Prof. Xiangnan Zhang (Zhejiang University, China). Cells were transfected with mito-QC and were plated on coverglass bottom dish. After treated with gefitinib or CCCP for 24 h, cells were visualized using a Leica TCS SP8 confocal laser scanning microscope (Mannheim, Germany).
Transmission electron microscopic analysis
HL-7702 cells were fixed in 3% glutaraldehyde solution (Sigma-Aldrich, G5882) at pH 7.2, post-fixed in 2% osmic acid (Sigma-Aldrich, 419494), dehydrated, embedded, sectioned at a thickness of 1 µm and stained with uranyl acetate (Polysciences, 21447–25) and lead citrate (HEDE BIOTECHNOLOGY Co.,LTD, 21447–25). Ultrathin sections were examined in a PHILIPS TECNAI 10 electron microscope (Amsterdam, Dutch).
Histological and immunohistochemical staining
The specimens were fixed in formalin (Sigma-Aldrich, F8775) and embedded in paraffin before being cut into 3 μm slices. For H&E staining, after dewaxing and rehydration, the tissue sections were stained in hematoxylin (Beyotime, C0105) for 8 min and were washed with running tap water for 5 min. Next, the sections were stained in eosin (Beyotime, C0105) for 30 s. Finally, the sections were dehydrated and mounted using neutral resins to visualize the pattern in the livers. For immunohistochemical staining, the tissue sections were pretreated with 3% H2O2 (ZSGB-BIO, PV-6001) at room temperature for 10 min and blocked with 10% goat serum (Gibco, 16210064) for 15 min after dewaxing, rehydration and antigen retrieval. The PLK1 expression profile in mice livers was determined by incubating the sections with blocking solution containing anti-PLK1 (Abcam, ab17056) (1:200) at 4°C overnights. The primary antibody was recognized by the horseradish peroxidase (HRP) conjugated secondary antibody (ZSGB-BIO, PV-6002). The slides were incubated with peroxidase substrate DAB kit (ZSGB-BIO, ZLI-9017), and nuclei were stained in hematoxylin for 3 s. The histological and immunohistochemical images were observed and captured under a light microscope (Olympus, Tokyo, Japan).
TUNEL staining
The specimens were fixed in formalin (Sigma-Aldrich, F8775) and embedded in paraffin before being cut into 3 μm slices. The tissue sections were pretreated with 3% H2O2 (ZSGB-BIO, PV-6001) at room temperature for 10 min and Proteinase K working solution (Beyotime, ST532, 20 μg/mL in 10 mM Tris/HCl, pH 7.4–8) at room temperature for 15 min after dewaxing, rehydration and antigen retrieval. Add 50 μL TUNEL reaction mixture (Roche, 11684817910) on sample and incubate 60 min at 37°C in a humidified chamber in the dark. Rinse slide 3 times with PBS, add 50 μL TUNEL-POD (Roche, 11772465001) on sample and incubate slide in a humidified chamber for 30 min at 37°C. Rinse slide 3 times with PBS and incubate with DAB (ZSGB-BIO, ZLI-9017). Nuclei were stained in hematoxylin for 3 s. The histological and immunohistochemical images were observed and captured under a light microscope (Olympus, Tokyo, Japan).
Plasmid construction and transfection
pCMV6-XL5-PLK1 (SC110978) was purchased from Origene and pUC19-hNFE2L2 (HG17384-U) was obtained from Sino Biological Inc. pcDNA3.0-COX6A1 was generated by restriction digestion of the plasmids with EcoRI plus XhoI, followed by ligations. EcoRI-HF (R3101V), XhoI (R0146S) and T4 DNA ligase (M0202S) were purchased from New England Biolabs. A full-length COX6A1 cDNA was obtained from hepatocytes. Cells were transfected with plasmids using the Lipofectamine 2000 transfection reagent (Invitrogen, 11668–019) according to the manufacturer´s instructions.
Transfection of siRNA oligonucleotides
siRNA oligonucleotides were transfected at final concentrations of 40 nM using Oligofectamine (Invitrogen, 12252–011). The following oligonucleotides were purchased from GenePharma (Shanghai, China).
siRNA targeting ATG5, 5'- CAUCUGAGCUACCCGGAUAUUdTdT-3´;
siRNA targeting ATG7, 5'- GCCGUGGAAUUGAUGGUAUUUdTdT-3´;
siRNA targeting PLK1, 5'- AGACUCAGGCGGUAUGUGCdTdT-3´;
siRNA targeting COX6A1 #1, 5'- GGAAGACUCUCACCUUCUUdTdT-3´;
siRNA targeting COX6A1 #2, 5´-GCAUGCUGAAUGUGUACCUdTdT-3´;
siRNA targeting EGFR, 5´- CGCAAAGUGUGUAACGGAAUAdTdT-3´;
siRNA negative control, 5´-UUCUCCGAACGUGUCACGUdTdT-3´.
Western blot
Protein lysates (20–50 μg per sample) were separated on SDS-polyacrylamide gels, transferred to PVDF membranes (Millipore Corporation, IPVH00010) and blocked with a blocking buffer. Incubation of primary antibodies, secondary antibodies and the Western Lightning Plus-ECL Enhanced Chemiluminescence Substrate (PerkinElmer, NEL105001EA) was performed to detect the signal. Primary antibodies directed against GAPDH (sc-25778), HSPD1/HSP60 (sc-59567), HSP90 (sc-13119), TOMM20 (sc-17764) and Ub (sc-9133) were purchased from Santa Cruz Biotechnology. Primary antibodies directed against LC3B (2775s), LC3A/B (4108s), ATG7 (2631s), ATG5 (8540s), cleaved PARP (5625s) and EGFR (4267s) were purchased from Cell Signaling Technology. PLK1 (ab17056) and NFE2L2/NRF2 (ab62352) were purchased from Abcam. COX6A1 (11460-1-AP) was obtained from Proteintech. TUBB8 (AP13248a) was obtained from ABGENT, and B2M (beta 2 microglobulin) (ET1608-45) was purchased from Huabio. HRP-labeled secondary antibodies (GAR007, GAM007, RAG007) were purchased from MultiSciences (Lianke) Biotech.
Cell survival analysis
Cell survival was assessed with the sulforhodamine B (SRB; Sigma-Aldrich, S1402) colorimetric assay. After 72 h of drug exposure, cells were fixed to the bottom by cold 80% (wt/vol) trichloro acetic acid (TCA) (final concentration, 16% TCA) and incubated for 60 min at 4°C. The fixative was then discarded; plates were washed with deionized water and air-dried. Fixed cells were then stained with SRB (0.4% SRB wt/vol in 1% acetic acid) using 100 µL/well followed by 10-min incubation at room temperature. Unbound SRB was removed by washing with 1% acetic acid and air-dried. Bound stains were solubilized with 10 mM Tris base and optical density (OD) of all the wells and were read on an automated spectrophotometric plate reader at a single wavelength of 515 nm. Using these OD values, cellular viability was calculated using the formula 100×[(T− TZ)/(C− TZ)] where TZ denotes time zero value of SRB protein content at the beginning of drug incubation; T represents a set of drug treated test values at the end of 72-h drug incubation period; and C shows a control value (vehicle control) at the end of 72-h drug incubation period. The absorbance at 515 nm was measured using a Multiskan Spectrum reader (Thermo Electron Corporation, Marietta, OH, USA) until the absorbance values were stable. Assays were performed in triplicate.
Quantitative polymerase chain reaction (qPCR)
After treatment, cells were harvested with the Trizol reagent (Invitrogen, 15596–026). Equal amounts of RNA were reverse transcribed into complementary DNA with the cDNA reverse transcription kit (Transgene, AT311). qPCR was performed on a 7500 Fast System (Applied Biosystems, Singapore) using the iTaq Universal SYBR Green Supermix (Bio-Rad, 172–5124). The samples underwent two-step amplification with an initial step at 95°C (3 min), followed by 95°C (3 sec) and 60°C (31 sec) for 39 cycles. The melting curve was analyzed. Fold changes in the expression of each gene were calculated by the comparative threshold cycle (Ct) method using the formula 2−(ΔΔCt). Three independent biological samples were quantified in technical duplicates and expression values were normalized to housekeeper gene.
The primer sequences were as follows:
PLK1 forward, 5'- TGACTCAACACGCCTCATCC -3´;
PLK1 reverse, 5'- GCTCGCTCATGTAATTGCGG -3´;
COX6A1 forward, 5'- CTCAGCTCGCATGTGGAAGA -3´;
COX6A1 reverse, 5'- CTTGGTCCTGATGCGGAGAT -3´;
GAPDH forward, 5'- TTTGGTCGTATTGGGCGCCTGGTCA 3´;
GAPDH reverse, 5'-TTGTGCTCTTGCTGGGGCTGGTGGT -3´;
Nqo1 forward, 5'- AGCGTTCGGTATTACGATCC -3´;
Nqo1 reverse, 5'- AGTACAATCAGGGCTCTTCTCG -3´;
Gapdh forward, 5'- GGAGAAACCTGCCAAGTATGA -3´;
Gapdh reverse, 5'- TCCTCAGTGTAGCCCAAGA -3´.
Quantitative analysis of global proteome in Homo sapiens
An integrated approach involving TMT labeling and LC-MS/MS to quantify the dynamic changes of the whole proteome of Homo sapiens was worked out by PTM Biolabs. HL-7702 cells were treated with or without 20 µM gefitinib and 10 µM CQ for 24 h. Cell lysates were separated on SDS-PAGE and gel samples were collected. Three treatment groups were involved in this analysis, including hepatocytes treated with gefitinib, combination of gefitinib and CQ, and vehicle group. Briefly, the work process encompassed protein extraction, trypsin digestion, labeling, HPLC fractionation, LC-MS/MS analysis, database search and bioinformatic analysis. The fold-change cutoff was set when proteins with quantitative ratios above 1.3 or below 1/1.3 were deemed significant.
Immunofluorescence assay
Cells grown on poly-D-lysine-coated coverslips were washed with PBS and fixed with 4% paraformaldehyde (Sigma-Aldrich, P6148) in PBS for 15 min at room temperature. The cells were then permeabilized with 0.2% Triton X-100 (BioFROXX, 1139ML100) in PBS for 15 min, blocked with 4% Bovine Serum Albumin (BSA; Sigma-Aldrich, B2064) in Tris-buffered saline (20 mM Tris-HCl, 500 mM NaCl, pH 7.4) for 0.5 h and incubated with primary antibodies at 4°C overnights. After washing with PBS, the cells were incubated with Alexa Fluor 488-, Alexa Fluor 568- or Alexa Fluor 647-conjugated secondary antibodies (Thermo Fisher Scientific, A21202, A10042, A31573, 1:200) for 1 h at room temperature, stained with DAPI (Dojindo, D212) for 5 min and mounted for fluorescence microscopy. The following primary antibodies were used: anti-LC3 (Santa Cruz Biotechnology, sc-376404, 1:100), anti-COX6A1 (Proteintech, 11460-1-AP, 1:100) and anti-LAMP1 (Cell signaling technology, 15665s, 1:200).
Microarray processing and analysis
Whole genome expression analysis was performed by Shanghai OE Biotech Company according to the protocol of one-color microarray-based gene expression analysis [Agilent Mouse Gene Expression Microarray (80*60K, Design ID:028005)]. Total RNA was extracted from the mouse livers using the RNeasy minikit (Qiagen, German). Then the sample labeling, microarray hybridization and washing were performed. The array images were scanned by Agilent Scanner G2505C (Agilent Technologies, China) and the data were extracted using Agilent Feature Extraction Software (version10.7.1.1, Agilent Technologies, China). Genespring (version 12.5, Agilent Technologies, China) was employed to complete the basic analysis. Differentially expressed genes were then identified according to the threshold set as fold change ≥ 2.0 and a p value < 0.05 calculated with Student t-test.
Intracellular ROS quantification assay
Intracellular ROS levels were determined by staining cells with dichlorofluorescin diacetate (DCFH-DA; S0033), which was obtained from Beyotime. Rosup is a ROS positive control reagent. Cells were harvested and washed with PBS, then incubated with 10 μM DCFH-DA at 37°C for 20 min. After three washes in PBS and resuspension, the cells were analyzed using a FACSCalibur cytometer (BD, San Jose, CA, USA).
Statistical analysis
Data are expressed as the mean ± standard deviation (SD). Statistical comparisons between 2 groups were performed using Student´s t-test; multiple group comparisons were made using a one-way analysis of variance (ANOVA) with follow-up LSD or Dunnett T3 tests, using SPSS 22.0.
Supplemental Material
Download MS Word (16 MB)Acknowledgments
We would like to thank the Riken BioResource Center (Tsukuba, Japan) for providing B6.Cg-ATG7 <tm1Tchi> and Prof. Xiangnan Zhang (Zhejiang University, China) for providing mito-QC. We would also like to thank experimenter Wei Yin from the Image Centre, Core Facilities, Zhejiang University School of Medicine for the confocal laser scanning microscope images.
Disclosure statement
The authors declare that they have no conflicts of interests.
Supplementary material
Supplemental data for this article can be accessed here.
Additional information
Funding
References
- Sordella R, Bell DW, Haber DA, et al. Gefitinib-sensitizing EGFR mutations in lung cancer activate anti-apoptotic pathways. Science. 2004 Aug 20;305(5687):1163–1167.
- Lynch TJ, Bell DW, Sordella R, et al. Activating mutations in the epidermal growth factor receptor underlying responsiveness of non-small-cell lung cancer to gefitinib. N Engl J Med. 2004 May 20;350(21):2129–2139.
- Chen XQ, Pan YL, Zhang SR, et al. Rechallenge with gefitinib following severe drug-induced hepatotoxicity in a patient with advanced non-small cell lung cancer: a case report and literature review. Oncol Lett. 2014 Mar;7(3):878–880.
- Mitsudomi T, Morita S, Yatabe Y, et al. Gefitinib versus cisplatin plus docetaxel in patients with non-small-cell lung cancer harbouring mutations of the epidermal growth factor receptor (WJTOG3405): an open label, randomised phase 3 trial. Lancet Oncol. 2010 Feb;11(2):121–128.
- Shah RR, Morganroth J, Shah DR. Hepatotoxicity of tyrosine kinase inhibitors: clinical and regulatory perspectives. Drug Saf. 2013 July;36(7):491–503.
- Kijima T, Shimizu T, Nonen S, et al. Safe and successful treatment with erlotinib after gefitinib-induced hepatotoxicity: difference in metabolism as a possible mechanism. J clin oncol. 2011 July 01;29(19):e588–90.
- Rautou PE, Mansouri A, Lebrec D, et al. Autophagy in liver diseases. J Hepatol. 2010 Dec;53(6):1123–1134.
- Li S, Dou X, Ning H, et al. Sirtuin 3 acts as a negative regulator of autophagy dictating hepatocyte susceptibility to lipotoxicity. Hepatology. 2017 Sept;66(3):936–952.
- Wang K. Autophagy and apoptosis in liver injury. Cell Cycle. 2015;14(11):1631–1642.
- Zhang C, Cuervo AM. Restoration of chaperone-mediated autophagy in aging liver improves cellular maintenance and hepatic function. Nat Med. 2008 Sept;14(9):959–965.
- Goodall ML, Fitzwalter BE, Zahedi S, et al. The autophagy machinery controls cell death switching between apoptosis and necroptosis. Dev Cell. 2016 May 23;37(4):337–349.
- Gump JM, Staskiewicz L, Morgan MJ, et al. Autophagy variation within a cell population determines cell fate through selective degradation of Fap-1. Nat Cell Biol. 2014 Jan;16(1):47–54.
- Sui X, Chen R, Wang Z, et al. Autophagy and chemotherapy resistance: a promising therapeutic target for cancer treatment. Cell Death Dis. 2013 Oct 10;4:e838.
- Cheng Y, Zhang Y, Zhang L, et al. MK-2206, a novel allosteric inhibitor of Akt, synergizes with gefitinib against malignant glioma via modulating both autophagy and apoptosis. Mol Cancer Ther. 2012 Jan;11(1):154–164.
- Sugita S, Ito K, Yamashiro Y, et al. EGFR-independent autophagy induction with gefitinib and enhancement of its cytotoxic effect by targeting autophagy with clarithromycin in non-small cell lung cancer cells. Biochem Biophys Res Commun. 2015 May 22;461(1):28–34.
- Diaz F, Garcia S, Hernandez D, et al. Pathophysiology and fate of hepatocytes in a mouse model of mitochondrial hepatopathies. Gut. 2008 Feb;57(2):232–242.
- Tamiya G, Makino S, Hayashi M, et al. A mutation of COX6A1 causes a recessive axonal or mixed form of Charcot-Marie-Tooth disease. Am J Hum Genet. 2014 Sept 4;95(3):294–300.
- Ho C, Davis J, Anderson F, et al. Side effects related to cancer treatment: CASE 1. Hepatitis following treatment with gefitinib. J clin oncol. 2005 Nov 20;23(33):8531–8533.
- Guicciardi ME, Gores GJ. Apoptosis: a mechanism of acute and chronic liver injury. Gut. 2005 July;54(7):1024–1033.
- Jing K, Song KS, Shin S, et al. Docosahexaenoic acid induces autophagy through p53/AMPK/mTOR signaling and promotes apoptosis in human cancer cells harboring wild-type p53. Autophagy. 2011 Nov;7(11):1348–1358.
- Komatsu M, Waguri S, Ueno T, et al. Impairment of starvation-induced and constitutive autophagy in Atg7-deficient mice. J Cell Biol. 2005 May 9;169(3):425–434.
- Komatsu M, Waguri S, Koike M, et al. Homeostatic levels of p62 control cytoplasmic inclusion body formation in autophagy-deficient mice. Cell. 2007 Dec 14;131(6):1149–1163.
- Komatsu M, Kurokawa H, Waguri S, et al. The selective autophagy substrate p62 activates the stress responsive transcription factor Nrf2 through inactivation of Keap1. Nat Cell Biol. 2010 Mar;12(3):213–223.
- Maiuri MC, Zalckvar E, Kimchi A, et al. Self-eating and self-killing: crosstalk between autophagy and apoptosis. Nat Rev Mol Cell Biol. 2007 Sept;8(9):741–752.
- McWilliams TG, Prescott AR, Allen GF, et al. mito-QC illuminates mitophagy and mitochondrial architecture in vivo. J Cell Biol. 2016 Aug 1;214(3):333–345.
- Cogliati S, Calvo E, Loureiro M, et al. Mechanism of super-assembly of respiratory complexes III and IV. Nature. 2016 Nov 24;539(7630):579–582.
- Ennis HL, Lubin M. Cycloheximide: aspects of inhibition of protein synthesis in mammalian cells. Science. 1964 Dec 11;146(3650):1474–1476.
- Seglen PO, Gordon PB. 3-Methyladenine: specific inhibitor of autophagic/lysosomal protein degradation in isolated rat hepatocytes. Proc Natl Acad Sci U S A. 1982 Mar;79(6):1889–1892.
- Chlumska A, Chlumsky J, Malina L. Liver changes in porphyria cutanea tarda patients treated with chloroquine. Br J Dermatol. 1980 Mar;102(3):261–266.
- Fries JF, Singh G, Lenert L, et al. Aspirin, hydroxychloroquine, and hepatic enzyme abnormalities with methotrexate in rheumatoid arthritis. Arthritis Rheumatism. 1990 Nov;33(11):1611–1619.
- Chen LL, Wang YB, Song JX, et al. Phosphoproteome-based kinase activity profiling reveals the critical role of MAP2K2 and PLK1 in neuronal autophagy. Autophagy. 2017 Sept 21;13:1969–1980.
- Ruf S, Heberle AM, Langelaar-Makkinje M, et al. PLK1 (polo like kinase 1) inhibits MTOR complex 1 and promotes autophagy. Autophagy. 2017;13(3):486–505.
- Valianou M, Cox AM, Pichette B, et al. Pharmacological inhibition of Polo-like kinase 1 (PLK1) by BI-2536 decreases the viability and survival of hamartin and tuberin deficient cells via induction of apoptosis and attenuation of autophagy. Cell Cycle. 2015 Feb 1;14(3):399–407.
- Benkafadar N, Menardo J, Bourien J, et al. Reversible p53 inhibition prevents cisplatin ototoxicity without blocking chemotherapeutic efficacy. EMBO Mol Med. 2017 Jan;9(1):7–26.
- Zhao M, Hartke C, Jimeno A, et al. Specific method for determination of gefitinib in human plasma, mouse plasma and tissues using high performance liquid chromatography coupled to tandem mass spectrometry. J Chromatogr B Analyt Technol Biomed Life Sci. 2005 May 05;819(1):73–80.
- Zhao J, Chen M, Zhong W, et al. Cerebrospinal fluid concentrations of gefitinib in patients with lung adenocarcinoma. Clin Lung Cancer. 2013 Mar;14(2):188–193.
- Nigade PB, Gundu J, Sreedhara Pai K, et al. Prediction of tissue-to-plasma ratios of basic compounds in mice. Eur J Drug Metab Pharmacokinet. 2017 Oct;42(5):835–847.
- Yonesaka K, Suzumura T, Tsukuda H, et al. Erlotinib is a well-tolerated alternate treatment for non-small cell lung cancer in cases of gefitinib-induced hepatotoxicity. Anticancer Res. 2014 Sept;34(9):5211–5215.
- Zenke Y, Umemura S, Sugiyama E, et al. Successful treatment with afatinib after grade 3 hepatotoxicity induced by both gefitinib and erlotinib in EGFR mutation-positive non-small cell lung cancer. Lung Cancer. 2016 Sept;99:1–3.
- Nezis IP, Shravage BV, Sagona AP, et al. Autophagy as a trigger for cell death: autophagic degradation of inhibitor of apoptosis dBruce controls DNA fragmentation during late oogenesis in Drosophila. Autophagy. 2010 Nov;6(8):1214–1215.
- Wolvetang EJ, Johnson KL, Krauer K, et al. Mitochondrial respiratory chain inhibitors induce apoptosis. FEBS Lett. 1994 Feb 14;339(1–2):40–44.
- Narendra D, Tanaka A, Suen DF, et al. Parkin is recruited selectively to impaired mitochondria and promotes their autophagy. J Cell Biol. 2008 Dec 1;183(5):795–803.
- Yuan J, Horlin A, Hock B, et al. Polo-like kinase, a novel marker for cellular proliferation. Am J Pathol. 1997 Apr;150(4):1165–1172.
- Song B, Davis K, Liu XS, et al. Inhibition of Polo-like kinase 1 reduces beta-amyloid-induced neuronal cell death in Alzheimer´s disease. Aging-Us. 2011 Sept 3;3(9):846–851.
- Trakala M, Partida D, Salazar-Roa M, et al. Activation of the endomitotic spindle assembly checkpoint and thrombocytopenia in Plk1-deficient mice. Blood. 2015 Oct 01;126(14):1707–1714.