
ABSTRACT
Diabetic retinopathy (DR) is a serious complication of diabetes mellitus and currently one of the major causes of blindness. Several previous studies have demonstrated that autophagy, which is regulated by HMGB1 (high mobility group box 1), is involved in DR development. However, the role of autophagy in DR is quite complicated in that it promotes pericyte survival in early DR, whereas excessive autophagy causes excess stress and leads to necrosis. Therefore, this study aimed to investigate the relationship between HMGB1, the macroautophagy/autophagy-lysosome pathway, and DR, as well as their underlying molecular mechanisms. In brief, the relationship between high glucose (HG) and the autophagy-lysosome pathway was examined in retinal pigment epithelial (RPE) cells. The relationship was studied by detecting classical autophagic features, and siRNAs targeting HMGB1 and pharmacological regulators were used to explore the role of the autophagy-lysosome pathway in DR development. The results demonstrated that HG inhibited autophagy and diminished the degradative capacity of autophagy due to lysosome membrane permeabilization (LMP). In addition, HMGB1 was found to be involved in LMP via the CTSB (cathepsin B)-dependent pathway, but not the CTSL (cathepsin L)-dependent pathway. Knockdown of HMGB1 expression rescued LMP, restored the degradative capacity of autophagy, decreased the expression of inflammatory factors and VEGF (vascular endothelial growth factor), and protected against apoptosis in RPE cells in the early stages of DR.
Introduction
Diabetic retinopathy (DR) is the most common complication of diabetes and remains a major cause of blindness throughout the world [Citation1]. Several molecular mechanisms have been proposed for DR, such as the formation of advanced glycated end products, oxidative stress, polyol accumulation, and protein kinase C activation, which subsequently lead to disruption of the mitochondrial membrane potential (MMP), CYCS (cytochrome c, somatic) release, and reactive oxygen species (ROS) production [Citation2]. These mechanisms regulate disease progression by affecting cellular metabolism and signaling pathways, which cause overproduction of inflammatory factors and VEGF (vascular endothelial growth factor), a known therapeutic target for pharmacologic treatment of DR and macular edema [Citation3]. However, the exact biochemical pathways underlying DR are not yet fully understood. Therefore, further elucidation of the pathophysiological mechanisms of DR is urgently needed to develop prevention strategies and novel treatment modalities for this destructive disease.
Macroautophagy/autophagy is an evolutionarily conserved catabolic pathway that degrades damaged organelles and abnormal proteins and recycles cellular components. This process is initiated by a double-membrane phagophore that matures into an autophagosome. Next, the autophagosomes fuse with the lysosomes, resulting in the degradation of their content by lysosomal hydrolases. Subsequently, lysosomes release the end products of autophagic digestion (such as amino acids, lipids, and nucleotides) into the cytoplasm, which then participate in cellular metabolism [Citation4]. Therefore, any damage incurred throughout this process may result in autophagic dysfunction. It has been reported that lysosomal dysfunction is a major cause of reduced autophagic degradative capacity, resulting in the accumulation of damaged organelles and protein aggregates, thus leading to cellular toxicity [Citation5]. Therefore, the autophagy-lysosome pathway confers protection against certain cancers, infections, neurodegenerative disorders, and metabolic diseases [Citation6]. Previous studies have shown that an abnormal level of autophagy will promote DR occurrence, including promoting damage to vascular endothelial cells, the release of VEGF, neovascularization, and even damage to the neuroepithelial layer of the retina [Citation7–9]. Recently, some researchers have shown that autophagy-lysosome pathway dysfunction is present in Müller cells and is involved in DR development [Citation10]. The retinal pigment epithelial (RPE) cells form the outer blood-retinal barrier (BRB) and monitor retinal structure and function. However, whether the autophagy-lysosome pathway in RPE cells is dysfunctional and involved in DR is still unknown, and hence the focus of our current research [Citation11]. Human RPE (ARPE-19) cells do not behave identically to human primary RPE (HsRPE) cells [Citation12]. Therefore, to validate our work, we confirmed the known data involving ARPE-19 cells by repeating major findings in HsRPE cells.
HMGB1 (high mobility group box 1) is a nuclear DNA-binding protein with an array of functions throughout the cell; for example, the detection and regulation of the cellular stress response. HMGB1 plays a significant role as a DNA chaperone, chromosome guardian, autophagy sustainer, immune modulator, and protector against apoptosis [Citation13]. Under diabetic conditions, HMGB1 may trigger the production of proinflammatory cytokines and angiogenic factors, thereby promoting a high glucose (HG) milieu [Citation14]. Additionally, HMGB1 is a critical mediator of autophagy in many diseases, including diabetes [Citation15]. It has been demonstrated that DR patients exhibit increased HMGB1 expression, which is associated with DR development [Citation16]. However, it remains largely unknown whether HMGB1 can mediate the autophagy-lysosome pathway in DR. Therefore, our study aimed to investigate the relationship between HMGB1, the autophagy-lysosome pathway, and DR, as well as their underlying molecular mechanisms.
Results
Autophagic markers and vacuoles accumulate in RPE cells during the progression of DR
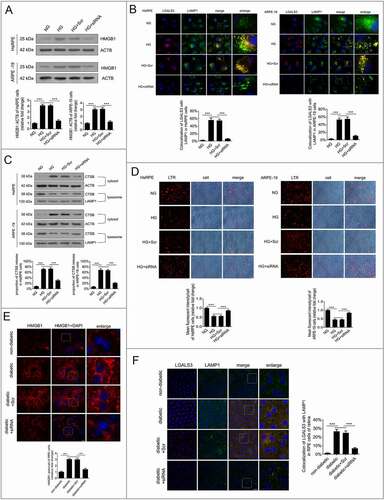
MAP1LC3B/LC3B (microtubule associated protein 1 light chain 3 beta) and BECN1/Beclin 1 are two well-established markers of autophagy in mammalian cells [Citation9]. To detect the expression of markers of autophagy in diabetic rats, the RPE cells of non-diabetic rats and streptozotocin (STZ)-induced diabetic rats (all non-diabetic and STZ-induced diabetic rats were fed with a regular diet) were flat-mounted and stained for the detection of LC3B-II and BECN1. Significantly augmented expression levels of LC3B-II and BECN1 were observed in the retinal tissues of STZ-induced diabetic rats compared with the non-diabetic rats (). To verify the immunofluorescence results in the retina, we performed western blot analysis to quantify the expression of LC3B-II and BECN1 in the retinas of non-diabetic rats and STZ-induced diabetic rats. The results showed that the expression levels of LC3B-II/LC3B-I and BECN1 were significantly increased in RPE cells of STZ-induced diabetic rats (). The formation of autophagic vacuoles, one of the most important signs of autophagy [Citation10], was analyzed through transmission electron microscopy (TEM). Furthermore, to confirm our results in vivo, we detected the autophagic vacuoles of HsRPE and ARPE-19 cells (hereinafter referred to as RPE cells) under HG conditions. Compared with the normal glucose (NG) group, we found an increased number of autolysosomes (ALs) in RPE cells under HG conditions (). We examined the expression of LC3B-II in RPE cells by immunofluorescence analysis. Compared with the NG group, there was a larger number of LC3B-II-positive puncta in the cytoplasm of RPE cells after 24 h of exposure to HG ().
Figure 1. Autophagic vacuoles and markers accumulate in RPE cells during DR progression. (a) The RPE cells of non-diabetic and STZ-induced diabetic rats were flat-mounted (all the non-diabetic and STZ-induced diabetic rats were fed with a regular diet) and then stained for BECN1 and LC3B. The pictures were taken on the upper retina 100 μm away from the optic nerve. Scale bars: 10 μm, n = 10. (b) Western blot was performed to quantify the expression levels of BECN1 and LC3B in the retinas of non-diabetic and diabetic rats (all the non-diabetic and STZ-induced diabetic rats were fed with a regular diet); representative images from three independent experiments with biological and technical replicates are shown, n = 10. (c) After exposure to NG (5.5 mM) or HG (25 mM) for 24 h, HsRPE and ARPE-19 cells were processed for TEM imaging. Magnifications of the boxed areas are presented on the right. Arrowhead, autophagic vacuole; black delineation, AP; red delineation, electron-dense AL. Note the accumulation of AL in HG conditions. Scale bars: 2 μm (left), 1 μm (right), n = 6. (d) Immunofluorescence staining of LC3B-II showing quantitative changes in HsRPE and ARPE-19 cells after exposure to NG or HG for 24 h; representative images from three independent experiments with biological and technical replicates are shown. Scale bars: 25 μm, n = 6. (e) After exposure to HG for 0, 12, 24, 48, 72, and 96 h, HsRPE and ARPE-19 cells were subjected to western blot analysis using the indicated antibodies (BECN1, ATG5, LC3B, and ACTB). ACTB was used as a protein loading control; representative images from three independent experiments with biological and technical replicates are shown, n = 6. #P > 0.05; *P < 0.05; **P < 0.01; ***P < 0.001.
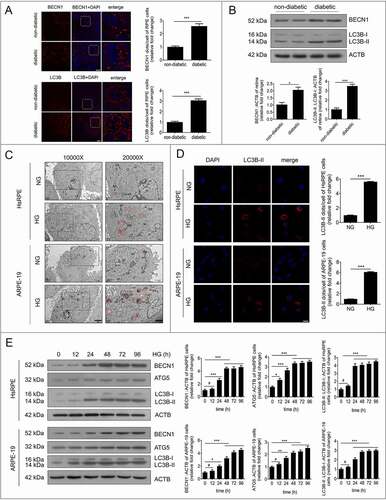
To verify the immunofluorescence data, we quantified the expression of LC3B-II and LC3B-I in RPE cells by western blot. We found that LC3B-II/LC3B-I levels were significantly increased in RPE cells in the HG group compared with the NG group at 12, 24, 48, 72, and 96 h (). In addition, the expression levels of ATG5 (autophagy related 5) and BECN1, two markers of autophagy, were quantified by western blot. We found that ATG5 and BECN1 gave similar results to LC3B-II (). Additionally, we detected the mRNA levels of LC3B, ATG5, and BECN1 by real-time quantitative polymerase chain reaction (RT-PCR). There was an increasing trend of LC3B, ATG5 and BECN1 at the mRNA level after HG treatment, but there were no statistically significant changes found in ARPE-19 cells (Figure S1A). These results indicate that autophagic markers and vacuoles accumulate in RPE cells during the progression of DR.
Autophagy is inhibited by HG in RPE cells during DR
Further experiments were performed to investigate whether the degradation of autophagy was stimulated in RPE cells after HG exposure. SQSTM1/p62 (sequestosome 1), which serves as a signaling hub for autophagic cargo, is degraded by autophagy. The impairment of autophagic degradation is often accompanied by SQSTM1 accumulation [Citation17]. The SQSTM1 levels in RPE cells were detected by RT-PCR. The results showed there was an increasing trend of SQSTM1 at the mRNA level after HG treatment; however, no statistically significant changes were found (Figure S1B). Additionally, we detected the expression of SQSTM1 at the protein level by western blot. The results showed that SQSTM1 levels were increased significantly in RPE cells after exposure to HG at 12, 24, 48, 72, and 96 h. Notably, the expression levels of SQSTM1 reached a peak at 24 h and remained at a high level even at 96 h (). Hence, our subsequent experiments focused on RPE cells with 24 h of HG exposure. To further verify our western blot results, we performed an immunofluorescence experiment to determine the levels of SQSTM1 in RPE cells. Immunofluorescence analysis revealed many SQSTM1-positive puncta in RPE cells exposed to HG for 24 h (). In addition, to further confirm our results in vitro, the RPE cells of non-diabetic rats and STZ-induced diabetic rats (all the non-diabetic and STZ-induced diabetic rats were fed with a regular diet) were flat-mounted and stained for the detection of SQSTM1. Significantly augmented levels of SQSTM1 were observed in STZ-induced diabetic retinal tissues in the RPE cell layer compared with the levels of non-diabetic rats (). Consistent with the immunofluorescence results, western blot analysis showed that SQSTM1 levels were significantly higher in retinal tissues of STZ-induced diabetic rats () compared with non-diabetic rats, which is an indicator of autophagy inhibition.
Figure 2. Autophagy is inhibited by HG in RPE cells during DR. (a) After exposure to HG for 0, 12, 24, 48, 72, and 96 h, HsRPE and ARPE-19 cells were subjected to western blot analysis using the indicated antibodies (SQSTM1 and ACTB). ACTB was used as a protein loading control. Representative images from three independent experiments with biological and technical replicates are shown, n = 6. (b) Immunofluorescence staining of SQSTM1 showing quantitative changes in HsRPE and ARPE-19 cells after exposure to NG or HG for 24 h. Representative images from three independent experiments with biological and technical replicates are shown. Scale bars: 20 μm, n = 6. (c) The RPE cells of non-diabetic and diabetic rats were flat-mounted and stained for SQSTM1. The pictures were taken on the upper retina 100 μm away from the optic nerve. Representative images from three independent experiments with biological and technical replicates are shown. Scale bars: 10 μm, n = 10. (d) Western blot analysis was performed to quantify the levels of SQSTM1 in the retinas of non-diabetic and diabetic rats (all the non-diabetic and STZ-induced diabetic rats were fed with a regular diet). Representative images from three independent experiments with biological and technical replicates are shown, n = 10. (e) Fluorescent microscopic analysis of ARPE-19 cells transfected with plasmid constructs harboring LC3B fused with a tandem mRFP-GFP tag (tfLC3B) and treated with NG, NG+rapamycin (RAP, 1 μM), NG+chloroquine (CQ, 30 μM), HG, HG+rapamycin (RAP, 1 μM), or HG+chloroquine (CQ, 30 μM) for 24 h. The yellow puncta indicate autophagosomes. The free red puncta indicate autolysosomes. Representative images from three independent experiments with biological and technical replicates are shown. Scale bars: 10 μm, n = 6. (f) Western blot analysis of LC3B and SQSTM1. The difference in LC3B-II and SQSTM1 levels between ARPE-19 cell samples with or without bafilomycin A1 (Baf A1, 50 nM), leupeptin (LEU, 10 μm), chloroquine (CQ, 30 μM), and rapamycin (RAP, 1 μM) was compared after exposure to NG or HG for 24 h. Representative images from three independent experiments with biological and technical replicates are shown, n = 6. #P > 0.05; *P < 0.05; **P < 0.01; *** P < 0.001.
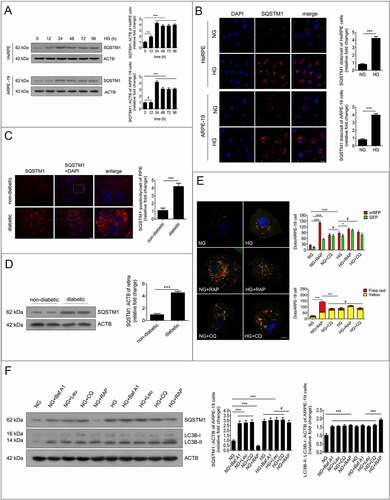
To determine which stage of autophagic degradation was dysfunctional, both autophagosomes and autolysosomes (a combination of autophagosome and lysosome) were examined independently by transfecting ARPE-19 cells with mRFP-GFP tandem fluorescent-tagged LC3B (tfLC3B). After tfLC3B transfection, autophagosomes in the cells displayed yellow dots (overlay between red and green fluorescence), while autolysosomes appeared as red dots (GFP is structurally disrupted in the acidic environment of lysosomes). After NG-treated or HG-treated cells were exposed to rapamycin (an autophagy inducer) or chloroquine (a lysosomal inhibitor), both free red and yellow dots were increased significantly in the rapamycin+NG-treated group compared with the NG group, indicating that both autolysosomes and autophagosomes were increased. Nevertheless, yellow dots, but not the free red dots, were found to be significantly increased in the NG+chloroquine-treated group compared with the NG group, indicating that massive amounts of autophagosomes were not degraded by lysosomes. Compared with the NG group, yellow dots, but not the free red dots, were found to be increased in the HG group. Compared with the group treated with HG alone, yellow dots, but not the free red dots, were significantly increased in the HG+rapamycin group. However, the free red and yellow dots were not significantly changed in the HG+chloroquine-treated group ().
As is known, bafilomycin A1, leupeptin, and chloroquine can block the fusion of autophagosomes and lysosomes, inhibit protease activity, and increase the intralysosomal pH, respectively [Citation18]. Therefore, we examined LC3B-II turnover and SQSTM1 expression in the presence or absence of these lysosomal inhibitors or rapamycin [Citation18]. Our results showed that the levels of LC3B-II and SQSTM1 were increased after exposure to HG for 24 h in ARPE-19 cells. Compared with the NG group, the levels of LC3B-II and SQSTM1 were significantly higher after the application of bafilomycin A1, leupeptin, and chloroquine. Nevertheless, the levels of LC3B-II and SQSTM1 were not further increased by the application of bafilomycin A1, leupeptin, or chloroquine in the HG group, compared with the levels in the HG group. Compared with the NG group, the NG+rapamycin group showed increased LC3B-II and decreased SQSTM1 levels. Compared with the HG group, the HG+rapamycin group showed significantly increased LC3B-II levels, and SQSTM1 levels showed a non-significant decreasing tendency (). These results suggest that LC3B-II and SQSTM1 are not degraded by lysosomes, and that autophagic activity is inhibited in HG-treated RPE cells.
Lysosome membrane permeabilization contributed to HG-triggered autophagic dysfunction in RPE cells
To investigate whether autophagic dysfunction was due to the inhibited fusion between autophagosomes and lysosomes via HG, double immunofluorescence staining was carried out for LC3B and LAMP1 (lysosomal associated membrane protein 1; a specific protein of the lysosome) [Citation5]. The results showed that LC3B dots exhibited a uniform distribution in the cellular cytoplasm, and most of the LAMP1 puncta colocalized with LC3B-positive granules in RPE cells after exposure to NG. Under HG conditions, there was a large number of LC3B-positive puncta in the cytoplasm, and most of the LC3B dots remained colocalized with LAMP1-positive granules (). These data suggest that the fusion between autophagosomes and lysosomes is not inhibited by HG.
Figure 3. Lysosome membrane permeabilization (LMP) contributed to HG-triggered autophagic dysfunction in RPE cells. (a) Immunofluorescence signals after double-staining for LC3B (red) and LAMP1 (green) in HsRPE and ARPE-19 cells after exposure to NG or HG for 24 h. Representative images from three independent experiments with biological and technical replicates are shown. Scale bars: 25 μm, n = 6. (b) Immunofluorescence signals after double-staining for LGALS3 (red) and LAMP1 (green) in HsRPE and ARPE-19 cells after exposure to NG or HG for 24 h, and Manders’ coefficients for colocalization of LGALS3 with LAMP1. Representative images from three independent experiments with biological and technical replicates are shown. Scale bars: 10 μm, n = 6. (c) After exposure to HG, HsRPE and ARPE-19 cells were subjected to western blot analysis. Cytosolic and lysosomal CTSB levels were independently analyzed with anti-CTSB, anti-ACTB, and anti-LAMP1. ACTB was used as a protein loading control in the cytosolic fraction, while LAMP1 was used as a protein loading control in the lysosomal fraction. The percentage of CTSB released from lysosomes into the cytosol was analyzed; representative images from three independent experiments with biological and technical replicates are shown, n = 6. (d) LTR staining and mean fluorescence intensity in HsRPE and ARPE-19 cells after exposure to HG for 0, 12, 24, or 48 h, as assessed by fluorescence microscopy. Representative images from three independent experiments with biological and technical replicates are shown. Scale bars: 20 μm, n = 6. (e) Proteolytic activity of CTSB and CTSL in HsRPE and ARPE-19 cells after exposure to NG or HG for 24 h, n = 6. (F) CTSB and CTSL activity in the retinas of non-diabetic and diabetic rats (all the non-diabetic and STZ-induced diabetic rats were fed with a regular diet). The bars represent the cathepsin activity expressed as RFU corrected for protein amount (μg), n = 10. (g) HsRPE and ARPE-19 cells were pretreated with complete medium containing geldanamycin (GA, 1 mM) or vehicle for 1 h and then exposed to HG for 24 h; the levels of SQSTM1 were analyzed by western blot. Representative images from three independent experiments with biological and technical replicates are shown, n = 6. #P > 0.05; **P < 0.01; *** P < 0.001.
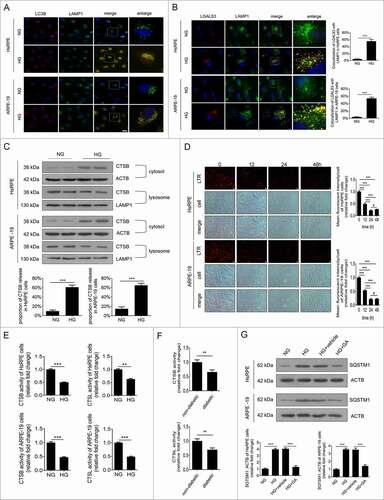
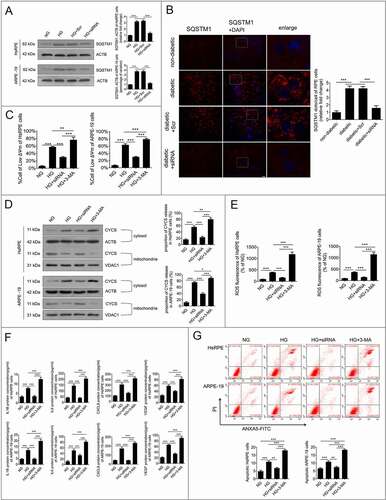
It has been reported that lysosome membrane permeabilization (LMP) can lead to the impairment of autophagy degradation [Citation19]. In cells and tissues, the best method for examining LMP is to use LGALS3 (galectin 3) and its binding to lysosomal membrane glycoproteins, which are exposed after LMP [Citation20]. Therefore, to determine whether LMP could take place in RPE cells following exposure to HG, double immunostaining was carried out using LGALS3 and LAMP1. The results showed that there was an increase in LGALS3-positive dots in the HG group compared with the NG group. Additionally, the puncta showing that LGALS3 was colocalized with LAMP1 were markedly increased after HG treatment (). Consistent with our immunofluorescence data, western blot analysis showed that compared with NG-treated cells, the CTSB (cathepsin B) levels in the lysosome were decreased, while the CTSB levels in the cytosol were increased significantly in HG-treated ARPE-19 cells (). These data indicate that LMP occur and CTSB is released from the lysosomes into the cytosol under HG conditions.
To confirm the occurrence of LMP, we investigated the lysosomal pH by detecting the acidic organelles (lysosomes) in cells using a LysoTracker Red (LTR) fluorescent probe that labels the acidic intracellular compartments in live cells and measures the activities of CTSB and CTSL (cathepsin L). The results showed that LTR fluorescence did not change at any time points under NG conditions. However, LTR fluorescence was decreased after exposure to HG, and reached the lowest level at 24 h (). Moreover, under HG conditions, but not NG conditions, there was a significant decline in the enzymatic activity of CTSB at 24 h, similar to that of CTSL (). The in vivo activities of CTSB and CTSL in STZ-induced diabetic rats were obviously decreased compared to non-diabetic rats (all the non-diabetic and STZ-induced diabetic rats were fed with a regular diet) (). Overall, these results demonstrate that LMP was triggered by HG in RPE cells. To determine whether LMP inhibited autophagic activity, RPE cells were preincubated with geldanamycin (GA), which is widely used to upregulate heat shock protein family A to protect the lysosomal membrane against permeabilization [Citation21], for 1 h before exposure to HG. The results showed that compared to NG conditions, the accumulation of SQSTM1 was significantly increased under HG conditions, while GA neutralized the effects of HG on SQSTM1 (). These data indicate that LMP contribute to the decline in degradative capacity of autophagy observed in RPE cells upon exposure to HG.
LMP is involved in HG-induced mitochondrial dysfunction, cytokine release, and apoptosis of RPE cells
Previous studies have reported that HG treatment can induce early signs of DR, including mitochondrial dysfunction, cytokine release, and apoptosis of RPE cells [Citation2,Citation3]. Further experiments were performed to evaluate whether the presence of LMP had effects on mitochondrial function, cytokine release, and apoptosis. RPE cells were preincubated with GA for 1 h before exposure to HG or incubation with rotenone (a mitochondrial complex 1 inhibitor that induces mtDNA damage [Citation22]) in NG conditions. The results showed that compared to NG-treated ARPE-19 cells, rotenone or HG treatment resulted in a significant decrease in the mitochondrial electrochemical potential (ΔΨm) () and increased CYCS release and ROS production (). However, compared to the HG group, the HG+GA group showed significantly increased ΔΨm (), decreased CYCS release, and decreased ROS production ().
Figure 4. LMP is involved in HG-induced mitochondrial dysfunction, cytokine release, and apoptosis of RPE cells. (a) ARPE-19 cells were pretreated with GA (1 mM) or rotenone (R, 0.5 μM) for 1 h and then exposed to HG for 24 h. The Δψm values were analyzed by fluorometry, n = 6. (b) HsRPE and ARPE-19 cells were processed as described in (A). Cytosolic and mitochondrial CYCS levels were independently analyzed by western blot with anti-CYCS, anti-ACTB, and anti-VDAC1. ACTB was used as a protein loading control in the cytosol, while VDAC1 was used as a protein loading control in the mitochondria. The percentage of CYCS released from mitochondria into the cytosol was analyzed. Representative images from three independent experiments with biological and technical replicates are shown, n = 6. (c) ARPE-19 cells were processed as described in (A). The intracellular ROS levels were analyzed using DCFH-DA with fluorometry, n = 6. (d) HsRPE and ARPE-19 cells were pretreated with geldanamycin (GA, 1 mM) or vehicle for 1 h and then exposed to HG for 24 h. The levels of IL1B, IL6, CXCL8, and VEGF in serum were analyzed by ELISA, n = 6. (e) HsRPE and ARPE-19 cells were pretreated with GA (1 mM) for 1 h and then exposed to HG for 24 h. The proportion of apoptotic cells was analyzed using ANXA5-FITC-PI by flow cytometry, n = 6. (f) The RPE cells were flat-mounted, and TUNEL images were taken of RPE cells in non-diabetic rats, STZ-induced diabetic rats (diabetic), and rats treated for 7 days with vehicle or GA (100 mg/kg by intraperitoneal injection). All rats were fed with a regular diet. The pictures were taken on the upper retina 100 μm away from the optic nerve. Representative images from three independent experiments with biological and technical replicates are shown. Scale bars: 20 μm, n = 10. (g) ARPE-19 cells were processed as described in (E). Representative TEM images. Magnifications of the boxed areas are presented on the right. black delineation, AP; red delineation, electron-dense APL. Note the accumulation of APL in HG conditions. Scale bars: 2 μm (left), 1 μm (right), n = 6. (h) Rats were processed as described in (F). Representative TEM images of retina sections in rats. Scale bars: 5 μm (left), 2 μm (right), n = 10. *P < 0.05; **P < 0.01; ***P < 0.001.
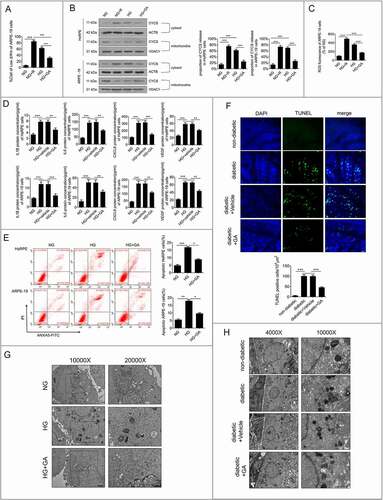
Moreover, enzyme-linked immunosorbent assay (ELISA) analysis revealed that HG increased the production of IL1B (interleukin 1 beta), IL6 (interleukin 6), CXCL8 (C-X-C motif chemokine ligand 8), and VEGF () compared to NG-treated ARPE-19 cells. In addition, flow cytometry analysis showed that HG enhanced the proportion of apoptotic RPE cells (). Compared with HG, HG+GA treatment could significantly increase the ΔΨm value (), decrease CYCS release, decrease ROS production ()), inhibit apoptosis of RPE cells (), and downregulate the expression levels of IL1B, IL6, CXCL8, and VEGF of RPE cells (). Terminal deoxynucleotidyl transferaseTdT-mediated dUTP nick end labeling (TUNEL) staining of rat RPE cells was performed to further verify the results of our in vitro experiments. The results showed that the number of TUNEL-positive cells in STZ-induced diabetic rats was significantly higher than that in non-diabetic rats (all the non-diabetic and STZ-induced diabetic rats were fed with a regular diet). Fewer TUNEL-positive cells were found in GA-treated STZ-induced diabetic rats than in STZ-induced diabetic rats (). To further investigate whether autophagy was involved in the mechanisms underlying the higher apoptosis rates, we detected the autophagic vacuoles in ARPE-19 cells and the RPE cells of STZ-induced diabetic rats with or without GA. The TEM results showed that the number of autolysosomes in ARPE-19 cells under HG conditions was significantly increased, while the number of autolysosomes was significantly decreased in GA- and HG-treated groups, compared with the HG-treated group (). Consistent with the results in vitro, the results in vivo showed that non-diabetic rats showed few autolysosomes, whereas STZ-induced diabetic rats exhibited an increased number of autolysosomes compared with non-diabetic rats. However, fewer autolysosomes were found in GA-treated STZ-induced diabetic rats than in STZ-induced diabetic rats (). These results indicate that LMP is involved in HG-induced early signs of DR.
Downregulation of HMGB1 expression rescued HG-induced LMP
HMGB1 has been reported to play crucial roles in LMP regulation and the inflammatory response [Citation23]. Therefore, the expression levels of HMGB1 were detected in RPE cells after exposure to HG, and small interfering RNA (siRNA)-HMGB1 and silencer negative control scrambled siRNA (Scr-siRNA) were applied. The data suggested that the expression level of HMGB1 was significantly increased in RPE cells after 24 h of HG exposure. After siRNA-HMGB1 was applied, the expression of HMGB1 was significantly downregulated compared with the group receiving HG treatment alone (). A further experiment with siRNA was performed to investigate whether HMGB1 regulated the dysfunction of autophagy in RPE cells exposed to HG. Double immunostaining was carried out on LGALS3 and LAMP1. The results showed that there was a decrease in LGALS3-positive dots in the HG+siRNA-HMGB1 group compared with the HG group. Additionally, the puncta showing that LGALS3 was colocalized with LAMP1 were markedly decreased after siRNA-HMGB1 treatment (). Consistent with our immunofluorescence data, western blot analysis showed that compared with HG cells, lysosomal CTSB levels were higher, while cytosolic CTSB levels were significantly lower in the HG+siRNA-HMGB1-treated RPE cells (). These data indicate that LMP occur and CTSB is released from the lysosomes into the cytosol under HG conditions, and suggest that HG-triggered LMP is remarkably decreased by siRNA-HMGB1.
Figure 5. Downregulation of HMGB1 expression rescued HG-induced LMP. (a) HsRPE and ARPE-19 cells were transfected with siRNA-HMGB1 or Scr-siRNA and then exposed to HG for 24 h. Cell samples were processed and analyzed by immunofluorescence staining with anti-HMGB1 and anti-ACTB antibodies. ACTB was used as a protein loading control. Representative images from three independent experiments with biological and technical replicates are shown, n = 6. (b) HsRPE and ARPE-19 cells were processed as described in (A). Immunofluorescence signals after double-staining for LGALS3 (red) and LAMP1 (green) in cell samples, and Manders’ coefficients for colocalization of LGALS3 with LAMP1. Representative images from three independent experiments with biological and technical replicates are shown. Scale bars: 10 μm, n = 6. (c) HsRPE and ARPE-19 cells were processed as described in (A). Cell samples were processed and analyzed by immunofluorescence staining with anti-CTSB, anti-ACTB, and anti-LAMP1. ACTB was used as a protein loading control in the cytosolic fraction, while LAMP1 was used as a protein loading control in the lysosomal fraction. The percentage of CTSB released from lysosomes into the cytosol was analyzed. Representative images from three independent experiments with biological and technical replicates are shown, n = 6. (d) LTR staining and mean fluorescence intensity in cell samples, as assessed by fluorescence microscopy, after HsRPE and ARPE-19 cells were processed as described in (A). Scale bars: 20 μm, n = 6. (e) The RPE cells of non-diabetic, STZ-induced diabetic, STZ-induced diabetic+siRNA-Hmgb1 injected (diabetic+siRNA), and STZ-induced diabetic+Scr-siRNA injected (diabetic+Scr) rats (all the rats were fed with a regular diet) were flat-mounted and stained for HMGB1. The pictures were taken on the upper retina 100 μm away from the optic nerve. Representative images from three independent experiments with biological and technical replicates are shown. Scale bars: 10 μm, n = 10. (f) The RPE cells of non-diabetic, STZ-induced diabetic, STZ-induced diabetic+siRNA-Hmgb1 injected (diabetic+siRNA), and STZ-induced diabetic+Scr-siRNA injected (diabetic+Scr) rats were flat-mounted and stained for LGALS3 (red) and LAMP1 (green). The pictures were taken on the upper retina 100 μm away from the optic nerve, and Manders’ coefficients for colocalization of LGALS3 with LAMP1 were calculated. Representative images from three independent experiments with biological and technical replicates are shown. Scale bars: 20 μm, n = 10. ***P < 0.001.
To further verify this result, we measured the lysosomal pH by LTR, and the results indicated that LTR fluorescence was decreased after exposure to HG for 24 h (). However, LTR fluorescence was significantly increased in HG-treated cells after HMGB1 was downregulated by siRNA compared to the cells treated with HG only (), which indicates that downregulation of HMGB1 expression rescued HG-induced LMP. To confirm our results in vitro, we carried out siRNA-Hmgb1 intravitreal injections. STZ-induced diabetic rats (all the rats were fed with a regular diet) were intravitreally injected with siRNA-Hmgb1 or Scr-siRNA. The in vivo immunofluorescence study clearly showed that the expression level of Hmgb1 was increased significantly in RPE cells in the retina of STZ-induced diabetic rats compared with non-diabetic rats (), and HMGB1 expression in the siRNA group was significantly decreased. The RPE cells of retina were flat-mounted and stained for detection of LGALS3 and LAMP1. The results showed that there was an increase in LGALS3-positive dots, and the puncta showing that LGALS3 was colocalized with Lamp1 were markedly increased in STZ-induced diabetic rats compared with non-diabetic rats. Also, after siRNA-Hmgb1 intravitreal injections, there was a decrease in LGALS3-positive dots in siRNA-Hmgb1-treated STZ-induced diabetic rats compared with STZ-induced diabetic rats. Additionally, the puncta showing that LGALS3 was colocalized with LAMP1 were markedly decreased after siRNA-Hmgb1 treatment (). All these results suggest that downregulation of HMGB1 expression rescues HG-induced LMP.
Downregulation of HMGB1 expression restored the degradative capacity of autophagy
To determine whether HMGB1 downregulation was related to the degradative capacity of autophagy, western blot analysis was conducted to detect the levels of SQSTM1. The results showed that the accumulation of SQSTM1 in HG-treated RPE cells was significantly reduced after HMGB1 was downregulated (). To further confirm our results in vitro, the RPE cells of retina were flat-mounted and stained for SQSTM1. The results showed that the accumulation of SQSTM1 in STZ-induced diabetic rats was significantly reduced after siRNA-Hmgb1 treatment (all the rats were fed with a regular diet) (). These results indicate that the downregulation of HMGB1 expression can restore the degradative capacity of autophagy by rescuing HG-induced LMP. Subsequently, we investigated whether HMGB1 downregulation could protect RPE cells by restoring the degradative capacity of autophagy under HG conditions. 3-Methyladenine (3-MA), an autophagic inhibitor, was used for the cell treatment. The results demonstrated that siRNA-HMGB1 treatment significantly increased ΔΨm, reduced CYCS release, reduced ROS production (), downregulated HG-induced overexpression of IL1B, IL6, CXCL8, and VEGF (), and decreased apoptosis of RPE cells () compared to HG treatment only. 3-MA reversed these protective effects of HMGB1 silencing (). Collectively, these data indicate that the protective effects of HMGB1 downregulation on RPE cells are mediated by restoration of the degradative capacity of autophagy.
Figure 6. Downregulation of HMGB1 expression restored the degradative capacity of autophagy. (a) HsRPE and ARPE-19 cells were transfected with siRNA-HMGB1 and Scr-siRNA and then exposed to HG for 24 h. Cell samples were processed and analyzed by immunofluorescence staining with anti-SQSTM1 and anti-ACTB antibodies. ACTB was used as a protein loading control. Representative images from three independent experiments with biological and technical replicates are shown, n = 6. (b) The RPE cells of non-diabetic, STZ-induced diabetic, STZ-induced diabetic+siRNA-Hmgb1 injected (diabetic+siRNA), and STZ-induced diabetic+Scr-siRNA injected (diabetic+Scr) rats (all rats were fed with a regular diet) were flat-mounted and stained for SQSTM1. The pictures were taken on the upper retina 100 μm away from the optic nerve. Representative images from three independent experiments with biological and technical replicates are shown. Scale bars: 10 μm, n = 10. (c) HsRPE and ARPE-19 cells were transfected with siRNA-HMGB1 or pretreated with 3-MA (5 mM) for 1 h and then coincubated with HG for 24 h. The Δψm values were analyzed by fluorometry, n = 6. (d) HsRPE and ARPE-19 cells were processed as described in (C). Cytosolic and mitochondrial CYCS levels were independently analyzed by western blot with anti-CYCS, anti-ACTB, and anti-VDAC1. ACTB was used as a protein loading control in the cytosol, while VDAC1 was used as a protein loading control in the mitochondria. The percentage of CYCS released from the mitochondria into the cytosol was analyzed. Representative images from three independent experiments with biological and technical replicates are shown, n = 6. (e) HsRPE and ARPE-19 cells were processed as described in (b). The intracellular ROS levels were analyzed using DCFH-DA with fluorometry, n = 6. (f) HsRPE and ARPE-19 cells were processed as described in (b). The expression of IL1B, IL6, CXCL8, and VEGF levels of serum was analyzed by ELISA, n = 6. (g) HsRPE and ARPE-19 cells were processed as described in (b). The proportion of apoptotic cells was analyzed using ANXA5-FITC-PI by flow cytometry, n = 6. *P < 0.05; ** P < 0.01; *** P < 0.001.
Downregulation of HMGB1 expression rescued HG-induced LMP via a CTSB-, but not CTSL-, dependent pathway
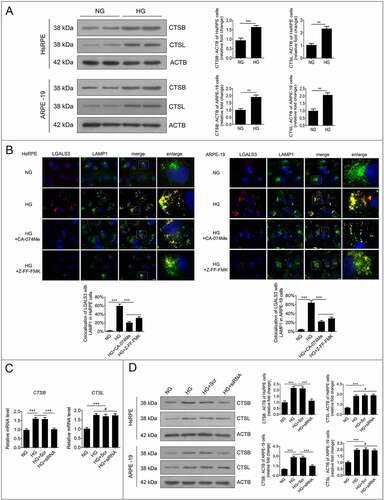
To further analyze the relationship between downregulation of HMGB1 expression and the autophagy-lysosome pathway, western blot analysis was conducted to detect the levels of CTSB and CTSL in RPE cells. The results showed that the expression levels of CTSB and CTSL were significantly increased after exposure to HG for 24 h compared to the NG group (). The overexpression of cathepsins has been reported to promote LMP, which leads to the decline of cathepsin activity [Citation24]. Therefore, in order to investigate the effects of cathepsins on HG-induced LMP and whether siRNA-HMGB1 could rescue HG-induced LMP via a cathepsin-dependent pathway, CA-074 methyl ester (CA-074Me), a CTSB inhibitor, and Z-Phe-Phe-fluoromethylketone (Z-FF-FMK), a CTSL inhibitor, were used. RPE cells were incubated with CA-074Me or Z-FF-FMK for 1 h before exposure to HG. Western blots showed that the expression levels of CTSB and CTSL were increased in RPE cells after 24 h of HG exposure compared to the NG group (). After treatment with CA-074Me or Z-FF-FMK, LAMP1 and LGALS3 were double-stained by immunofluorescence. The results demonstrated that treatment with HG+CA-074Me or Z-FF-FMK significantly decreased the number of puncta, showing that LGALS3 was colocalized with LAMP1 in RPE cells, compared to HG treatment alone (). These results revealed that both CTSB and CTSL were involved in HG-induced LMP. Additionally, we detected the mRNA levels of both CTSB and CTSL. Consistent with what we observed at the protein level, the mRNA levels of both CTSB and CTSL were significantly increased after HG treatment. However, after knockdown of HMGB1, the mRNA levels of CTSB, not CTSL, were significantly decreased (). Further western blot results showed that the expression level of CTSB, not CTSL, was significantly decreased in the HG+siRNA-HMGB1 group compared to the HG group (). Taken together, these results strongly indicate that siRNA-HMGB1 rescues HG-induced LMP through the CTSB-, but not the CTSL-, dependent pathway.
Figure 7. Downregulation of HMGB1 expression rescued HG-induced LMP via a CTSB- but not a CTSL-dependent pathway. (a) After exposure to NG or HG for 24 h, the total protein of HsRPE and ARPE-19 cells was subjected to western blot analysis using the indicated antibodies (CTSB, CTSL, and ACTB). ACTB was used as a protein loading control. Representative images from three independent experiments with biological and technical replicates are shown, n = 6. (b) HsRPE and ARPE-19 cells were pretreated with complete medium containing CA-074Me (10 ng/mL) or Z-FF-FMK (40 μM) for 1 h and then exposed to HG for 24 h. Immunofluorescence signals after double-staining for LGALS3 (red) and LAMP1 (green) in cell samples are shown, and Manders’ coefficients for colocalization of LGALS3 with LAMP1 were calculated. Representative images from three independent experiments with biological and technical replicates are shown. Scale bars: 10 μm, n = 6. (c) ARPE-19 cells were transfected with siRNA-HMGB1 and Scr-siRNA and then exposed to HG for 24 h. The mRNA expression of CTSB and CTSL in ARPE-19 cells was measured by real-time PCR, n = 6. (d) HsRPE and ARPE-19 cells were transfected with siRNA-HMGB1 and Scr-siRNA and then exposed to HG for 24 h. Cell samples were subjected to western blot analysis using the indicated antibodies (CTSB, CTSL, and ACTB). ACTB was used as a protein loading control. Representative images from three independent experiments with biological and technical replicates are shown, n = 6. #P > 0.05; **P < 0.01; ***P < 0.001.
Discussion
DR, a consequence of multiple molecular interactions, has developed various complex strategies to deal with environmental stress [Citation1]. To maintain normal cellular function, autophagy is often activated in response to multiple environmental stresses. HMGB1 plays an important role not only in autophagy, but also in DR [Citation14,Citation15]. In recent years, a growing number of studies have demonstrated that autophagy is involved in DR development [Citation25,Citation26]. However, to date, no reports have indicated whether HMGB1 is involved in the autophagy-lysosome pathway, or which part of the autophagy-lysosome pathway is dysfunctional in DR progression. Specifically, our study focused on the role of the autophagy-lysosome pathway in DR development and its molecular mechanism, which was related to HMGB1 expression.
Our study showed that RPE cells under HG conditions exhibited increased levels of autophagic markers and increased expression of SQSTM1, which indicated dysfunction in the autophagy-lysosome pathway [Citation17]. We also showed that LMP was induced in RPE cells under HG conditions, which led to massive release of cathepsins from ruptured lysosomes into the cytosol and subsequently autophagy-lysosome pathway dysfunction. The increased expression of HMGB1 in RPE cells under HG conditions could upregulate CTSB expression and induce LMP. In line with this, downregulation of HMGB1 in RPE cells under HG conditions could block CTSB overexpression and rescue LMP, thus restoring the degradative capacity of autophagy. Hence, downregulation of the overexpressed HMGB1 could significantly decrease HG-induced inflammation, expression of VEGF, and apoptosis in RPE cells. It was also verified in vivo that HMGB1 was involved in regulating the autophagy-lysosome pathway.
RPE cells have a basal level of autophagy, however, the manner in which the autophagy process changes in RPE cells under HG conditions remains unclear. Autophagy of HsRPE cells under HG conditions has not yet been reported. It is reported that human induced pluripotent stem cell (hiPSC)-derived RPE cell lines derived from type 2 diabetes patients and healthy controls, with one biological replicate, show that there is no differences in LC3B-II expression at different glucose concentrations or between control and diabetic hiPSC-RPEs. However, a clear accumulation of SQSTM1 is detected in diabetic hiPSC-RPEs compare with healthy control hiPSC-RPEs [Citation27]. It is worth noting that protein aggregates or damaged cell organelles are not detectable, and the formation pattern of autophagosomes (LC3B-II) is similar in this study, which suggests another mechanism behind the elevated SQSTM1 levels in diabetic hiPSC-RPEs under NG conditions. An evoked energy depletion, together with induced antioxidant production via the NRF-2/ARE pathway, may be responsible [Citation28,Citation29]. With respect to autophagy of ARPE-19 cells under HG conditions, increased LC3B-II expression is implicated in the activation of autophagy [Citation26], whereas decreased LC3B-II expression is indicative of inhibition of autophagy [Citation30]. It is reported that glucose at a concentration of 30 mM decrease LC3B-I and increase LC3B-II expression; in this way, autophagy may play a protective role against HG-induced injury in ARPE-19 cells [Citation31]. It also has been reported that treatment of ARPE-19 cells for 5 days with glucose at a concentration of 25 mM leads to a significant decrease in LC3B-II and SQSTM1 expression, which indicated lysosomal degradation [Citation32]. Additionally, it is also demonstrated that glucose at a concentration of 15 mM increase LC3B-II and decrease SQSTM1 expression, while glucose at a concentration of 50 mM decrease LC3B-II and increase SQSTM1 expression [Citation33], meaning that HG can induce both autophagy activation and autophagy inhibition, depending on the concentration of glucose. It has also been demonstrated that after 48 h of HG treatment in ARPE-19 cells, LC3B-II expression is increased and SQSTM1 expression is decreased, but after 14 days of HG treatment, LC3B-II expression is decreased and SQSTM1 expression is increased [Citation25], which indicates that HG activates or inhibits autophagy depending on the duration of glucose treatment. These discrepancies are most likely because these studies mainly assessed the upstream autophagic pathway, but not the downstream pathway, since the actual autophagy flux was measured by the accumulation of LC3B-II in the presence or absence of lysosomal inhibitors [Citation34], such as bafilomycin A1, leupeptin, and chloroquine. We reported for the first time that LC3B-II expression is not further increased by lysosomal inhibitors in ARPE-19 cells under HG conditions. Additionally, we reported that SQSTM1 (an autophagy substrate, which accumulates under autophagy inhibition conditions and was used as an indirect marker to assess autophagy [Citation17]) accumulated significantly during DR progression.
During the autophagic process, autophagosomes fuse with lysosomes, leading to the degradation of autophagic cargoes and cell substrates by lysosomal hydrolases. Any damage incurred throughout this process may result in impaired degradation of the autophagy-lysosome pathway [Citation5]. We observed that the fusion of autophagosomes and lysosomes was not blocked by HG; however, LMP occurred. LMP has been reported to be associated with many diseases, including cancer and neurodegenerative, metabolic, and inflammatory diseases [Citation35–38]. During the occurrence of LMP, the acidic environment where cathepsins are active and stable is destroyed, and a massive amount of cathepsins is released from lysosomes to the cytoplasm, thus leading to a decrease in cathepsin activity [Citation37]. In our study, we observed that massive amounts of CTSB were released from the lysosomes into the cytosol in RPE cells under HG conditions, accompanied by a decrease in the acidic organelles and the lysosomal enzymatic activities of CTSB and CTSL, which are extremely sensitive to acidic environments [Citation39,Citation40]. To further determine whether LMP contributes to autophagic dysfunction, GA, which is widely used to upregulate HSPA (heat shock protein family A (Hsp70)) to protect the lysosomal membrane against permeabilization [Citation21], was used. In both in vivo and in vitro experiments, we observed that GA decreased the accumulation of SQSTM1 and lysosomal vacuoles. Moreover, GA protected against HG-induced inflammation, expression of VEGF, and apoptosis. Collectively, all these data indicate that LMP occurs, and that LMP contributes to the dysfunction of the autophagy-lysosome pathway. Consistent with our findings, a previous study reported that LMP plays an important role in the development of diabetic nephropathy, as evidenced by high LMP in renal tubular epithelial cells [Citation19].
The molecular mechanisms of LMP are not completely understood. Nevertheless, previous studies indicated that LMP can be induced by an array of factors, including proapoptotic Bcl-2 family proteins [Citation41], p53 [Citation42], caspases [Citation8], cathepsins [Citation24,Citation37], ROS [Citation32,Citation43], and kinases [Citation44]. In our study, we observed that the levels of CTSB and CTSL were increased in RPE cells by HG. Furthermore, both CA-074Me (CTSB inhibitor) and Z-FF-FMK (CTSL inhibitor) were found to inhibit HG-induced LMP, suggesting that HG-induced LMP occurrence is dependent on CTSB and CTSL. Consistent with our findings, a previous study reported that in a model of hepatocyte apoptosis induced by TNF-a, in tissues lacking Ctsb, increased resistance to LMP was observed [Citation24]. However, a study about palmitic acid-induced lipotoxicity show that inhibition of CTSL, but not CTSB, could reverse palmitic acid-induced LMP in nerve growth factor-differentiated PC12 cells [Citation36]. This discrepancy between different studies may be explained by the different disease models used in the experiments. While the mechanisms by which LMP is induced by CTSB remain largely unknown, it is possible that inhibited proteolysis of a transport/import protein in lysosomes may affect the pore shape. Some researchers have suspected that bacterial proteins or proteolysis, which may lead to the release of amphipathic peptides that bind to other membrane proteins or are inserted directly in the membrane, could induce this pore formation [Citation45].
The underlying mechanisms by which lysosomal proteases promote apoptosis are also not completely understood. The present viewpoint is that when LMP takes place, a massive amount of cathepsins is released from the lysosomes into the cytoplasm. These released cathepsins not only result in caspase-dependent or -independent apoptosis with or without involvement of mitochondria [Citation32,Citation46,Citation47], but also trigger a damaging feedback loop to LMP, leading to more extensive LMP in the cytoplasm [Citation24]. Thus, LMP associated with cathepsin translocation may directly activate calpains and caspases. Additionally, LMP may initiate MMP changes via interacting with BCL2 family members, with CYCS, and with ROS release, accompanied with activation of the classical mitochondria–caspase pathway. LMP may also trigger mitochondria- and caspase-independent apoptosis [Citation48]. Additionally, lysosome destabilization under HG and mitophagic flux may also lead to inflammasome activation [Citation32]. Changes induced by diabetes in retinal lysosomes have been reported to be associated with some early signs of DR, including enhanced inflammatory cytokine production, VEGF release, and apoptosis [Citation10]. To determine the role of LMP in HG-induced early signs of DR, MMP disruption, CYCS release, ROS generation, inflammatory factors, VEGF release, and apoptosis of RPE cells were evaluated in RPE cells treated with GA. The results showed that, for lysosomes in HG conditions, GA significantly decreased HG-induced MMP disruption, CYCS release, ROS generation, and also the production of HG-induced inflammatory factors and VEGF. In addition, GA protected RPE cells against HG-induced apoptosis. Taken together, our findings indicated that LMP was involved in early signs of HG-induced DR.
HMGB1 is an important mediator of autophagy and is involved in many diseases [Citation49]. A previous study has shown that HMGB1 participates in autophagy by directly interacting with BECN1, modulating heat shock 27 kDa protein 1 expression and reacting with advanced glycosylation end product-specific receptor (AGER/RAGE) to promote autophagy [Citation50]. However, whether HMGB1 can regulate the function of lysosomes in DR remains largely unclear. Consistent with previous studies [Citation51], our data showed that HG increased the expression levels of HMGB1. Surprisingly, inhibiting the expression of HMGB1 by siRNA-HMGB1 could rescue HG-induced LMP and significantly reduce the HG-induced accumulation of SQSTM1. Therefore, we hypothesized that downregulating HMGB1 expression can restore the degradative capacity of autophagy by rescuing HG-induced LMP. Additionally, we observed that knockdown of HMGB1 significantly decreased the HG-induced CTSB, but not CTSL overexpression, which indicated that HMGB1 downregulation rescued LMP under HG conditions via a CTSB-, but not CTSL-, dependent pathway. This is the first time that HMGB1 has been demonstrated to interact with autophagy by regulating the function of lysosomes by changing CTSB expression during DR progression. Consistent with our findings in RPE cells, previous studies revealed the release of HMGB1, which acts through AGER/RAGE to initiate lung endothelial cell endocytosis of HMGB1, and then triggers a cascade of molecular events, including LMP and CTSB release from ruptured lysosomes [Citation52,Citation53]. However, Jessop et al. demonstrated that the inhibition of CTSB can decrease HMGB1 release [Citation54], a result similar to those reported by Duncan [Citation55]. Thus, we speculate that it is possible that CTSB has a feedback effect on HMGB1. Further studies are needed to verify this speculation. Additionally, only two types of cathepsins were examined in the present study. Therefore, further studies are needed to confirm whether other cathepsins are involved in HMGB1-mediated LMP during DR progression.
HMGB1 works through several receptors, such as TLR2 (toll like receptor 2), TLR4 (toll like receptor 4), and RAGE, and results in increased expression of angiogenic and proinflammatory factors in many immune and inflammatory diseases [Citation56,Citation57]. We observed that HG-induced MMP disruption, CYCS release, and ROS generation were significantly decreased by the downregulated expression of HMGB1. Moreover, the production of inflammatory mediators and VEGF was significantly decreased after HMGB1 downregulation, as was the proportion of apoptotic RPE cells. Nevertheless, inhibition of autophagy by 3-MA significantly reversed these protective effects. All these data indicated that HMGB1 downregulation rescued HG-induced LMP and protected RPE cells against DR by restoring the degradative capacity of autophagy during the early DR stage.
In summary, our results demonstrate, for the first time, that autophagy is inhibited in DR by LMP, which decrease the degradative capacity of autophagy. In addition, our data reveal that HMGB1 overexpression can lead to LMP via regulating the expression of CTSB. Knockdown of HMGB1 rescued LMP through the CTSB-dependent pathway, restored the degradative capacity of autophagy, and protected RPE cells against apoptosis during the early stage of DR. These findings open new perspectives of the relationship between HMGB1, the autophagy-lysosome pathway, and DR, which in turn provide a framework for further studies regarding the molecular mechanisms that underlie DR pathogenesis.
Materials and methods
Cell culture
ARPE-19 cells were purchased from the American Type Culture Collection (ATCC, CRL-2302), whereas HsRPE cells were obtained from human donor eyes deposited in the Chongqing Eye Bank, with the written consent of the donor or the donor’s family for use in medical research in accordance with the 2013 version of the Declaration of Helsinki. This study was approved by the Ethics Committee of the First Affiliated Hospital of Chongqing Medical University. Twelve human donors were included in this study (). The HsRPE cells were isolated as described previously [Citation12]. Both HsRPE and ARPE-19 cells were cultured in Dulbecco’s modified Eagle’s medium F-12 nutrient mixture (DMEM/F-12; Invitrogen; C11330500B) containing 10% fetal bovine serum and 1% penicillin/streptomycin. The cells were maintained in a humidified incubator with a 5% CO2 atmosphere at 37°C.
Table 1. The information about donors
Antibodies and reagents
The primary antibodies used were as follows: anti-LC3B (ab192890), anti-SQTSM1 (ab109012), anti-BECN1 (ab207612), anti-ATG5 (ab108327), anti-LAMP1 (ab25630), anti-LGALS3 (ab2785), anti-CTSB (ab125067), anti-CTSL (ab6314), and bafilomycin A1 (ab120497) were procured from Abcam. Anti-HMGB1 (10,829-1-AP), anti-CYCS (10,993-1-AP), anti-ACTB (20,536-1-AP), Alexa Fluor 594 (SA00006-4), Alexa Fluor 488 (SA00006-1), and horseradish peroxidase-conjugated secondary antibodies (SA00001-2 and SA00001-1) were procured from Proteintech Group. Rapamycin (R0395), chloroquine (C6628), leupeptin (L9783), GA (467,214–21-7), and rotenone (R8875) were procured from Sigma-Aldrich. 3-MA (S2767) and CA-074Me (S7420) were procured from Selleck. Z-FF-FMK (108,005–94-3) was procured from Santa Cruz Biotechnology.
Immunofluorescence analysis
Immunofluorescence analysis was performed on the RPE cells as described previously [Citation12,Citation58]. After fixing the cells, the cover glasses were incubated at 4°C overnight with different primary antibodies, followed by incubation with the corresponding secondary antibodies. Then, the nuclei were stained with 4′,6-diamidino-2-phenylindole (Polysciences, 09224–10) for 5 min. All images were recorded using a digital camera connected to a Leica fluorescence microscope (DMR, Deerfield, IL, USA).
Transmission electron microscopy
TEM was carried out as described previously [Citation10]. In brief, RPE cells were collected and fixed with 2% paraformaldehyde-2.5% glutaraldehyde in 0.1 M phosphate buffer (Sigma-Aldrich, G6257), pH 7.3, at 4°C overnight. After incubation, the cells were washed three times with phosphate buffer, followed by post-fixation in 1% osmium tetroxide (Structure Probe, Inc., SPI-Pontm 812) for 30 min. The samples were dehydrated, and then stained with 1% aqueous uranyl acetate (Structure Probe, Inc., SPI-02624). The structures of autophagosome-like vesicles were observed under a H-7500 transmission electron microscope (Hitachi, Tokyo, Japan) operated at 80 kV.
Western blot analysis
Western blot analysis was performed on rat retinas or human RPE cells as described previously [Citation12]. The rat retinas or human RPE cells were homogenized with a complete lysis buffer (Cell Signaling Technology, 9803). Lysates were centrifuged at 18,760 g for 10 min at 4°C. Protein concentrations were determined with the Bicinchoninic Acid Protein Assay kit (Beyotime Biotechnology, P0012S). Thirty micrograms of protein was loaded onto each lane of a gel, separated by 12% SDS-PAGE (Beyotime Biotechnology, P0012A), and then transferred to a polyvinylidene difluoride membrane (PVDF; Millipore, IPVH00010). For all cases, the protein blot was blocked for 1 h at room temperature with blocking solution (5% nonfat dried milk [Cell Signaling Technology, 9999] and Tris-buffered saline Tween 20 [TBST; Cell Signaling Technology, 9997]). The membranes were incubated at 4°C overnight with different primary antibodies, followed by incubation with the corresponding secondary antibodies. Chemiluminescent fluid (Millipore, WBKLS0500) was dropped onto the surface of the membrane evenly in the darkroom, and then the membrane was covered by an appropriate size X-sensitive film. The film was exposed in an X-ray camera obscura (Guangdong Yuehua Medical Equipment Factory, Guangdong, China). We then removed the film and soaked it in the developer for 5 s before the immunoreactive bands were visualized under the red light. Band detection was conducted within the linear range. Three independent technical replicates were performed for every blot.
RT-PCR
Total mRNA was extracted from the RPE cells by using Trizol reagent (Invitrogen, 15,596,026), and cDNA was then synthesized by in vitro reverse transcription using mRNA as the template. The target gene expression was quantified by RT-PCR using specific primers (RiboBio, Guangdong, China). RT-PCR was performed using an ABI Prism 7900 HT Sequence Detection System (Applied Biosystems, Foster City, CA, USA) with a Taqman Gene Expression Master Mix (Applied Biosystems, 4,370,074). All data are presented as fold change compared with control after normalization to ACTB.
Plasmid transfection
The tfLC3B plasmids, constructed by GenePharma (Shanghai, China), were transfected into RPE cells using Lipofectamine 2000 (Invitrogen, 11,668,019) according to the manufacturer’s instructions. After transfection, the cells were treated with NG or HG for an additional 24 h before image capturing, as described previously [Citation59].
LTR uptake test
The RPE cells exposed to HG for different periods were incubated with 50 nM LTR (Invitrogen, L-7528) in complete DMEM/F-12 for 2 h at 37°C Subsequently, the stained cells were washed with phosphate-buffered saline (PBS; Beyotime Biotechnology, C0221A) to remove excess LysoTracker dye. Finally, the images were viewed under a microscope (CKX41SF, Olympus, Japan) and recorded.
Enzymatic assays
The activities of lysosomal CTSB and CTSL were measured using a fluorescent activity assay kit (BioVision, K140–100 and K142–100), according to the manufacturer’s instructions. In brief, both assays were performed after cleavage of the synthetic substrate with either cell or retinal tissue lysate. The fluorescence was visualized by a multifunctional microplate reader (Molecular Devices, Sunnyvale, CA, USA) at excitation and emission wavelengths of 400 and 505 nm, respectively.
Transient transfection with siRNAs
The siRNA duplexes and scrambled siRNA sequences corresponding to human HMGB1 were constructed by GenePharma (Shanghai, China). Transient transfection of siRNAs for human HMGB1 (20 nM) was carried out using Lipofectamine 2000 in accordance with the manufacturer’s protocol.
ELISA
The concentrations of IL1B, IL6, CXCL8, and VEGF (R&D Systems, DY201, DY206, DY208, and DY293B) were determined using ELISA kits for humans according to the manufacturer’s instructions. A multifunctional microplate reader (Molecular Devices, Sunnyvale, CA, USA) was used to measure the absorbance of each protein at a wavelength of 450 nm.
ANXA5-FITC-PI apoptosis assay
The apoptosis assay was performed using an ANXA5/annexin V-FITC-propidium iodide (PI) apoptosis detection kit (Beyotime Biotechnology, C1062L). In brief, RPE cells were washed three times with ice-cold PBS. The cells were resuspended with 300 μL 1× binding buffer and incubated with 5 μL ANXA5-FITC for 10 min at room temperature. Subsequently, the cells were incubated with 5 μL PI at room temperature for 5 min in the dark. After incubation, apoptotic cells were detected by flow cytometry (FACSAira, Becton Dickinson, Franklin Lakes, NJ, USA) using 200 μL 1× binding buffer per tube.
MMP assay
The Δψm values of RPE cells were measured using a JC-1 mitochondria staining kit (Beyotime Biotechnology, C2006). In brief, RPE cells were incubated with JC-1 staining solution (5 μg/mL) for 20 min at 37°C. After incubation, the cells were centrifugated at 600 x g for 3 min. The Δψm values were determined using fluorometry. For JC-1 monomers and aggregates, fluorescence was measured using a multifunctional microplate reader (Molecular Devices, Sunnyvale, CA, USA).
Extraction of lysosomal fraction
After RPE cells were washed twice with PBS and collected by centrifugation at 500 x g for 3 min, the lysosomal protein fraction was extracted using a lysosomal protein extraction kit (Bestbio, BB-31,452-2) according to the manufacturer’s instructions. In brief, collected cells were resuspended with lysosome extraction reagent A and oscillated on ice for 10 min. Then the cells were homogenized 35 times in a Dounce homogenizer (Dongguan Kemao Biological Technology, KM-10-024-2) followed by centrifugation at 1,000 x g for 5 min. Supernatant fractions were centrifuged at 30,000 x g for 30 min and the supernatant was collected and labeled as the cytosolic fraction. The resulting precipitates were resuspended with lysosome extraction reagent B and further centrifuged at 30,000 x g for 30 min. The precipitates were resuspended with lysosome extraction reagent C and oscillated for 20 min followed by centrifugation at 14,000 x g for 15 min. The supernatant was taken as the lysosomal protein fraction.
Isolation of mitochondria
In order to extract mitochondrial protein from mitochondria, mitochondria were isolated from the cultured RPE cells using a homogenization method with a Dounce homogenizer (25 strokes), followed by differential centrifugation at low speed (600 x g) and high speed (11,000 x g) according to the protocol of the Mitochondria Isolation Kit (Sigma, MITOISO2).
Measurement of intracellular ROS levels
Intracellular ROS levels were measured by 2′-7′-dichlorodihydrofluorescein diacetate (DCFH-DA; Beyotime Biotechnology, S0033). In brief, RPE cells were incubated with 10 μM of DCFH-DA for 30 min at 37°C. After incubation, excess DCFH-DA was removed by washing with PBS three times. Finally, the fluorescence signals were measured using a multifunctional microplate reader.
Animal model establishment and experimental procedures
All animal experiments were carried out in accordance with the ARVO Statement for the Use of Animals in Ophthalmic and Vision Research. Male 8-week-old Sprague-Dawley rats were obtained from the Animal Care Committee of Chongqing Medical University (Chongqing, China). High dose STZ (Sigma-Aldrich, S0130MSDS; 60 mg/kg in 0.1 mM sodium citrate buffer, pH 4.5) was administered via a single intraperitoneal injection after a fasting period of 8 h. Meanwhile, the control animals received an equivalent amount of vehicle alone. Three days after the injection, blood glucose levels were measured in the tail vein to evaluate the induction of diabetes (hyperglycemia >16.7 mM) [Citation60]. During the entire experimental period, all the rats were fed with a regular diet.
Three months after intraperitoneal injection of STZ, we administered GA or siRNA-HMGB1 to rats with STZ-induced diabetes. STZ-induced diabetic rats were treated with 100 mg/kg GA by intraperitoneal injection, while rats in the control group received an equivalent amount of vehicle alone. The rats were euthanized at 7 days after the GA injection. SiRNA-Hmgb1 intravitreal injections were given to rats as described previously [Citation61,Citation62]. SiRNA-Hmgb1 was suspended in water at a concentration of 0.5 µg/µL. SiRNA-Hmgb1 (1 μL) was mixed with 1 μL Lipofectamine 2000 for 20 min before injection. SiRNA-Hmgb1 intravitreal injections were given with the aid of a surgical microscope. The needle was inserted ~1 mm behind the corneal limbus, and 2 µL of siRNA-Hmgb1-Lipofectamine 2000 mixture was quickly pushed into the vitreous. Rats in the Scr-siRNA group were injected with 2 µL of Scr-siRNA-Lipofectamine 2000 composite. The intravitreal injection was administered twice, on day 1 and day 4, and the rats were euthanized on day 7 for subsequent analysis.
Immunofluorescence staining of RPE cells in retina
Immunofluorescence staining was performed on the RPE cells of the retina as described previously [Citation63]. After enucleation, the eyes of each rat were rinsed with PBS, the anterior eye portion was removed, and the posterior eyecup was flattened by performing four incisions. The neural retina was separated, revealing the RPE, and blocked by 5% donkey serum (Abbkine, BMS0140) and 1% BSA (Solarbio, A8010). The blocked flat mounts were incubated with different primary antibodies at 4°C overnight, followed by incubation with the corresponding secondary antibodies. After incubation, the flat mounts were rinsed, cover-slipped with antifade medium containing nuclear stain, visualized, and recorded using a digital camera connected to a fluorescence microscope.
TUNEL assay
The RPE cells of rats were flat-mounted, TUNEL staining was performed according to the instructions of the manufacturer (Beyotime Biotechnology, C1098), and cells were counter-stained with 4′,6-diamidino-2-phenylindole. TUNEL-positive cells on the upper retina 100 μm away from the optic nerve were counted using ImageJ software.
Disclosure of potential conflicts of interest
No potential conflict of interest was reported by the author(s).
Statistical analysis
Experiments were conducted three times with independent biological and technical replicates. The combined data from these experiments were subjected to statistical analysis. All statistical tests were performed using SPSS 26.0. One-way analysis of variance (ANOVA) and post-hoc Bonferroni multiple comparison tests were used to analyze and compare the differences between groups. Data are expressed as the mean ± standard deviation (SD) from at least three independent experiments. A P value of less than 0.05 was considered statistically significant.
Supplemental Material
Download Zip (29 MB)Acknowledgments
We are grateful to Yike Huang for her helpful suggestions, to Yong Du for his comments on the references, to Gongpei Wang for his help regarding immunofluorescence studies, and to Dandan Li for her careful language correction. We thank the members of the Chongqing Key Lab of Ophthalmology and State Key Laboratory of Ophthalmology (Zhongshan Ophthalmic Center, Sun Yat-sen University) for their helpful comments and suggestions during the work.
Supplementary material
Supplemental data for this article can be accessed here
Additional information
Funding
Related Research Data
References
- Stitt AW, Curtis TM, Chen M, et al. The progress in understanding and treatment of diabetic retinopathy. Prog Retin Eye Res. 2016;51:156–186. doi:https://doi.org/10.1016/j.preteyeres.2015.08.001
- Rubsam A, Parikh S, Fort PE. Role of inflammation in diabetic retinopathy. Int J Mol Sci. 2018 Mar 22;19(4):4. doi:https://doi.org/10.3390/ijms19040942
- Hammes HP. Diabetic retinopathy: hyperglycaemia, oxidative stress and beyond. Diabetologia. 2018 Jan;61(1):29–38. doi:https://doi.org/10.1007/s00125-017-4435-8
- Yu C, Huang X, Xu Y, et al. Lysosome dysfunction enhances oxidative stress-induced apoptosis through ubiquitinated protein accumulation in Hela cells. Anat Rec. 2013 Jan;296(1):31–39. doi:https://doi.org/10.1002/ar.22612 .
- Vn P, Sl S, Ka R, et al. Oxidative stress and autophagy in the regulation of lysosome-dependent neuron death. Antioxid Redox Signal. 2009;11(3):481–496. doi:https://doi.org/10.1089/ars.2008.2263
- Rm P, Bn N, Nicolay BN, et al. Transcriptional control of autophagy-lysosome function drives pancreatic cancer metabolism. Nature. 2015;524(7565):361–365. doi:https://doi.org/10.1038/nature14587
- Xb M, Zp Y, C W, et al. Potential suppression of the high glucose and insulin-induced retinal neovascularization by Sirtuin 3 in the human retinal endothelial cells. Biochem Biophys Res Commun. 2017;482(2):341–345. doi:https://doi.org/10.1016/j.bbrc.2016.11.065
- Jj R, Ja C, P M, et al. Release of cytochrome c and activation of pro-caspase-9 following lysosomal photodamage involves Bid cleavage. Cell Death Differ. 2002;9(9):934–944. doi:https://doi.org/10.1038/sj.cdd.4401048
- X R, Nn W, H Q, et al. Up-regulation thioredoxin inhibits advanced glycation end products-induced neurodegeneration. Cell Physiol Biochem. 2018;50(5):1673–1686. doi:https://doi.org/10.1159/000494787
- LdF JM, Da D, C M, et al. Defective autophagy in diabetic retinopathy. Invest Ophthalmol Vis Sci. 2016;57(10):4356–4366. doi:https://doi.org/10.1167/iovs.6-19197.PMID:27564518
- O S. The retinal pigment epithelium in visual function. Physiol Rev. 2005;85(3):845–881. doi: https://doi.org/10.1152/physrev.00021.2004
- Fu X, Lin R, Qiu Y, et al. Overexpression of angiotensin-converting enzyme 2 ameliorates amyloid β-induced inflammatory response in human primary retinal pigment epithelium. Invest Ophthalmol Vis Sci. 2017;58(7):3018–3028. doi: https://doi.org/10.1167/iovs.17-21546
- Mt L, Kj T. High-mobility group box 1 protein (HMGB1): nuclear weapon in the immune arsenal. Nat Rev Immunol. 2005;5(4):331–342.doi: https://doi.org/10.1038/nri1594
- Y L, C H, J K, et al. HMGB1 binding to receptor for advanced glycation end products enhances inflammatory responses of human bronchial epithelial cells by activating p38 MAPK and ERK1/2. Mol Cell Biochem. 2015;405(1–2):63–71. doi: https://doi.org/10.1007/s11010-015-2396-0
- X S, D T. HMGB1-dependent and -independent autophagy. Autophagy. 2014;10(10):1873–1876. doi: https://doi.org/10.4161/auto.32184.
- Ae-a AM, Mm S, Mi N, et al. The proinflammatory cytokine high-mobility group box-1 mediates retinal neuropathy induced by diabetes. Mediators Inflamm. 2014;2014:746415. doi: https://doi.org/10.1155/2014/746415
- M K, Y I. Physiological significance of selective degradation of p62 by autophagy. FEBS Lett. 2010;584(7):1374–1378. doi: https://doi.org/10.1016/j.febslet.2010.02.017
- Dc R, Am C, B R, et al. In search of an “autophagomometer”. Autophagy. 2009;5(5):585–589. doi: https://doi.org/10.4161/auto.5.5.8823
- Wj L, Tt S, Rh C, et al. Autophagy-lysosome pathway in renal tubular epithelial cells is disrupted by advanced glycation end products in diabetic nephropathy. J Biol Chem. 2015;290(33):20499–20510. doi: https://doi.org/10.1074/jbc.M115.666354
- S A, J K, B L, et al. Sensitive detection of lysosomal membrane permeabilization by lysosomal galectin puncta assay. Autophagy. 2015;11(8):1408–1424. doi: https://doi.org/10.1080/15548627.2015.1063871
- Em G, Na S, L A, et al. Lysosomal membrane stability plays a major role in the cytotoxic activity of the anti-proliferative agent, di-2-pyridylketone 4,4-dimethyl-3-thiosemicarbazone (Dp44mT). Biochim Biophys Acta. 2016;1863(7):1665–1681.doi: https://doi.org/10.1016/j.bbamcr.2016.04.017
- Sy L, Js O, Jh R, et al. Retinal pigment epithelial cells undergoing mitotic catastrophe are vulnerable to autophagy inhibition. Cell Death Dis. 2014;5(6):e1303. doi: https://doi.org/10.1038/cddis.2014.266
- Y W, J Z, X Z, et al. The role of HMGB1 in the pathogenesis of type 2 diabetes. J Diabetes Res. 2016;2016:2543268.doi:https://doi.org/10.1155/2016/2543268
- Nw W, Me G, Sf B, et al. Tumor necrosis factor-alpha-associated lysosomal permeabilization is cathepsin B dependent. Am J Physiol Gastrointest Liver Physiol. 2002;283(4):G947–56. doi: https://doi.org/10.1152/ajpgi.00151.2002
- Chen Q, Tang L, Xin G, et al. Oxidative stress mediated by lipid metabolism contributes to high glucose-induced senescence in retinal pigment epithelium. Free Radical Biol Med. 2019;130:48–58.doi: https://doi.org/10.1016/j.freeradbiomed
- H S, Z Z, X W, et al. Inhibition of autophagy induces IL-1β release from ARPE-19 cells via ROS mediated NLRP3 inflammasome activation under high glucose stress. Biochem Biophys Res Commun. 2015;463(4):1071–1076.doi: https://doi.org/10.1016/j.bbrc.2015.06.060
- M K, A K, E R, et al. Compromised barrier function in human induced pluripotent stem-cell-derived retinal pigment epithelial cells from type 2 diabetic patients. Int J Mol Sci. 2019;20:15.doi: https://doi.org/10.3390/ijms20153773
- Jain A, Lamark T, Sjøttem E, et al. p62/SQSTM1 is a target gene for transcription factor NRF2 and creates a positive feedback loop by inducing antioxidant response element-driven gene transcription. The Journal of Biological Chemistry. 2010;285(29):22576–22591.doi: https://doi.org/10.1074/jbc.M110.118976
- Liu W, Ye L, Huang W, et al. p62 links the autophagy pathway and the ubiqutin-proteasome system upon ubiquitinated protein degradation. Cell Mol Biol Lett.2016;21:29.doi: https://doi.org/10.1186/s11658-016-0031-z
- S M, G-r Á, G-r M, et al. Beneficial effects of fenofibrate in retinal pigment epithelium by the modulation of stress and survival signaling under diabetic conditions. J Cell Physiol. 2012;227(6):2352–2362. doi: https://doi.org/10.1002/jcp.22970.PMID:21826649
- Huang C, Lu H, Xu J, et al. Protective roles of autophagy in retinal pigment epithelium under high glucose condition via regulating PINK1/Parkin pathway and BNIP3L. Biol Res. 2018;51(1):22. doi: https://doi.org/10.1186/s40659-018-0169-4
- Devi T, Yumnamcha T, Yao F, et al. TXNIP mediates high glucose-induced mitophagic flux and lysosome enlargement in human retinal pigment epithelial cells. Biology Open. 2019;8(4):4. doi: https://doi.org/10.1242/bio.038521
- Y Z, X X, Y M, et al. High-glucose induces retinal pigment epithelium mitochondrial pathways of apoptosis and inhibits mitophagy by regulating ROS/PINK1/Parkin signal pathway. Biomed Pharmacothe. 2019;111:1315–1325.doi: https://doi.org/10.1016/j.biopha.2019.01.034
- N M, T Y. How to interpret LC3 immunoblotting. Autophagy. 2007;3(6):542–545. doi: https://doi.org/10.4161/auto.4600
- Fp Z, Ks C, H-s M, et al. Glucagon-like peptide 1 protects pancreatic β-cells from death by increasing autophagic flux and restoring lysosomal function. Diabetes. 2017;66(5):1272–1285. doi: https://doi.org/10.2337/db16-1009
- Fg A, Jw L, Fj P, et al. Lipotoxicity-mediated cell dysfunction and death involve lysosomal membrane permeabilization and cathepsin L activity. Brain Res. 2010;1318:133–143. doi: https://doi.org/10.1016/j.brainres.2009.12.038
- P B, G K. Lysosomal membrane permeabilization in cell death. Oncogene. 2008;27(50):6434–6451. doi: https://doi.org/10.1038/onc.2008.310.
- Me G, M L, Gj G. Lysosomes in cell death. Oncogene. 2004;23(16):2881–2890. doi: https://doi.org/10.1038/sj.onc.1207512
- V T, V S, O V, et al. Cysteine cathepsins: from structure, function and regulation to new frontiers. Biochim Biophys Acta. 2012;1824(1):68–88. doi: https://doi.org/10.1016/j.bbapap.2011.10.00
- S P, A H, E-s HR, et al. Cathepsins: proteases that are vital for survival but can also be fatal. Biomed Pharmacothe. 2018;105:526–532. doi: https://doi.org/10.1016/j.biopha.2018.05.148
- Ja C, Pa M, Jj R. Sphingomyelins suppress the targeted disruption of lysosomes/endosomes by the photosensitizer NPe6 during photodynamic therapy. Biochem J. 2005;392(2):325–334. doi: https://doi.org/10.1042/BJ20050313
- D K, Y L, P M, et al. Determinants of the apoptotic response to lysosomal photodamage. Photochem Photobiol. 2000;71(2):196–200. doi: https://doi.org/10.1562/0031-8655(2000)071<0196:dotart>2.0.co;2
- Fj R, Lj W, S R, et al. TNF induces pathogenic programmed macrophage necrosis in tuberculosis through a mitochondrial-lysosomal-endoplasmic reticulum circuit. Cell. 2019;178(6):1344–1361.e11.doi: https://doi.org/10.1016/j.cell.2019.08.004
- C S, M H, S C, et al. The dual PI3K/mTOR inhibitor NVP-BEZ235 and chloroquine synergize to trigger apoptosis via mitochondrial-lysosomal cross-talk. Int J Cancer. 2013;132(11):2682–2693. doi: https://doi.org/10.1002/ijc.27935
- Fg V, J L, F P, et al. Spectroscopic study of the activation and oligomerization of the channel-forming toxin aerolysin: identification of the site of proteolytic activation. Biochemistry. 1992;31(36):8566–8570. doi: https://doi.org/10.1021/bi00151a026
- N W, Me G, Xm Y, et al. TNF-alpha-mediated lysosomal permeabilization is FAN and caspase 8/Bid dependent. Am J Physiol Gastrointest Liver Physiol. 2004;287(2):G436–43.doi: https://doi.org/10.1152/ajpgi.00019.2004
- Ae F, Nw W, A C, et al. Free fatty acids promote hepatic lipotoxicity by stimulating TNF-alpha expression via a lysosomal pathway. Hepatology. 2004;40(1):185–194. doi: https://doi.org/10.1002/hep.20283
- Y Z, Rl B, Ra C, et al. Evidence of a lysosomal pathway for apoptosis induced by the synthetic retinoid CD437 in human leukemia HL-60 cells. Cell Death Differ. 2001;8(5):477–485. doi: https://doi.org/10.1038/sj.cdd.4400843
- R K, Km L, Hj Z, et al. Metabolic regulation by HMGB1-mediated autophagy and mitophagy. Autophagy. 2011;7(10):1256–1258. doi: https://doi.org/10.4161/auto.7.10.16753
- Q Z, R K, Hj Z, et al. DAMPs and autophagy: cellular adaptation to injury and unscheduled cell death. Autophagy. 2013;9(4):451–458. doi: https://doi.org/10.4161/auto.23691
- Xl C, Xd Z, Yy L, et al. Involvement of HMGB1 mediated signalling pathway in diabetic retinopathy: evidence from type 2 diabetic rats and ARPE-19 cells under diabetic condition. Br J Ophthalmol. 2013;97(12):1598–1603.doi: https://doi.org/10.1136/bjophthalmol-2013-303736
- J Y, Y Z, P Z, et al. Hemorrhagic shock primes for lung vascular endothelial cell pyroptosis: role in pulmonary inflammation following LPS. Cell Death Dis. 2016;7(9):e2363.doi: https://doi.org/10.1038/cddis.2016.274
- J X, Y J, J W, et al. Macrophage endocytosis of high-mobility group box 1 triggers pyroptosis. Cell Death Differ. 2014;21(8):1229–1239. doi: https://doi.org/10.1038/cdd.2014.40
- Y M, K Y, S N, et al. Legionella pneumophila induces cathepsin B-dependent necrotic cell death with releasing high mobility group box1 in macrophages. Respir Res. 2010;11(1):158. doi: https://doi.org/10.1186/1465-9921-11-15
- Ja D, X G, Mt H, et al. Neisseria gonorrhoeae activates the proteinase cathepsin B to mediate the signaling activities of the NLRP3 and ASC-containing inflammasome. J Immunol. 2009;182(10):6460–6469. doi: https://doi.org/10.4049/jimmunol.0802696
- Jr V, Wa B, Aw G. Convergence and amplification of toll-like receptor (TLR) and receptor for advanced glycation end products (RAGE) signaling pathways via high mobility group B1 (HMGB1). Angiogenesis. 2008;11(1):91–99.doi: https://doi.org/10.1007/s10456-008-9093-5
- U A, Kj T. HMGB1 is a therapeutic target for sterile inflammation and infection. Annu Rev Immunol. 2011;29(1):139–162.doi: https://doi.org/10.1146/annurev-immunol-030409-101323
- Aits S. Methods to detect loss of lysosomal membrane integrity. Methods Mol Biol (Clifton, N.J.). 2019;1880:315–329. doi: https://doi.org/10.1007/978-1-4939-8873-0_21
- S K, T N, T Y. Dissection of the autophagosome maturation process by a novel reporter protein, tandem fluorescent-tagged LC3. Autophagy. 2007;3(5):452–460.doi: https://doi.org/10.4161/auto.4451.
- Furman B. Streptozotocin-induced diabetic models in mice and rats. Curr Protoc Pharmacol. 2015;70:5.47.1–5.47.20.doi: https://doi.org/10.1002/0471141755.ph0547s70.
- Jiang S, Chen X. HMGB1 siRNA can reduce damage to retinal cells induced by high glucose in vitro and in vivo. Drug Des Dev Ther. 2017;11:783–795.doi: https://doi.org/10.2147/DDDT.S129913
- Liang W, Yang H, Liu H, et al. HMGB1 upregulates NF-kB by inhibiting IKB-α and associates with diabetic retinopathy. Life Sci. 2020;241:117146. doi: https://doi.org/10.1016/j.lfs.2019.117146
- Jaadane I, Villalpando Rodriguez G, Boulenguez P, et al. Effects of white light-emitting diode (LED) exposure on retinal pigment epithelium in vivo. J Cell Mol Med. 2017;21(12):3453–3466.doi: https://doi.org/10.1111/jcmm.13255.