
ABSTRACT
Hepatitis B virus (HBV) particles are thought to be secreted from hepatocytes through multivesicular bodies (MVBs); however, the cellular trafficking mechanisms prior to this process remain elusive. It has been reported that CCDC88A/GIV expression, which is involved in multiple aspects of vesicular trafficking, changes dynamically at different phases of chronic HBV infection. In this study, we focused on the role of CCDC88A/GIV in HBV replication. In the liver tissues of chronically HBV-infected patients, HBV infection significantly enhanced CCDC88A/GIV expression, and increased endoplasmic reticulum (ER) stress and autophagosome formation without changing endosome formation. Additionally, colocalization of SHBsAg with early endosomes (~30.2%) far exceeded that with autophagosomes (~3.2%). In hepatoma cells, CCDC88A/GIV and its downstream proteins, DNM2 (dynamin 2; a CCDC88A/GIV effector), CLTC and RAB5A significantly enhanced HBV replication and endosome formation but inhibited autophagosome formation. Blocking endocytosis disrupted HBsAg trafficking to endosomes and caused its accumulation in the ER lumen, which triggered ER stress to initiate the unfolded protein response (UPR). Therefore, HBsAg trafficking into autophagosomes was increased, and the lysosomal activity and maturation, which was inhibited by HBV infection, were restored. Meanwhile, core particles were prevented from entering MVBs. CCDC88A/GIV and its other effector, GNAI3, decreased autophagic flux by enhancing the insulin-induced AKT-MTOR pathway, thereby inhibiting HBV antigens autophagic degradation. In conclusion, CCDC88A/GIV enhanced HBV replication by increasing endosomal trafficking and reducing autophagic degradation of HBV antigens, suggesting that CCDC88A/GIV-mediated endosomal trafficking plays an important role in HBV replication and progeny secretion.Abbreviations: ACTB: actin beta; AO: acridine orange; ATF6: activating transcription factor 6; CCDC88A/GIV: coiled-coil domain containing 88A; CLTC: clathrin heavy chain; CQ: chloroquine; DAPI: 4ʹ,6-diamidino-2-phenylindole; DNM2: dynamin 2; ER: endoplasmic reticulum; ERN1: endoplasmic reticulum to nucleus signaling 1; EIF2A: eukaryotic translation initiation factor 2A; FBS: fetal bovine serum; GNAI3: G protein subunit alpha i3; HBV: hepatitis B virus; HBV RIs: HBV replication intermediates; HBcAg: HBV core protein; HBsAg: HBV surface antigen; MAP1LC3B/LC3B: microtubule associated protein 1 light chain 3 beta; MVBs: multivesicular bodies; MTOR: mechanistic target of rapamycin kinase; PDI: protein disulfide isomerase; PHH: primary human hepatocyte; pSM2: a HBV replication-competent plasmid; HSPA5/BIP: heat shock protein family A (Hsp70) member 5; SQSTM1/p62: sequestosome 1; siRNA: small interfering RNA; SEM: standard error of the mean; UPR: unfolded protein response
Introduction
Hepatitis B virus (HBV) remains a global threat to public health. Patients with chronic HBV infection have high risks of cirrhosis, liver failure, and hepatocellular carcinoma (HCC). The WHO estimated that approximately 257 million individuals have chronic HBsAg seropositivity worldwide [Citation1].
HBV interacts with SLC10A1/NTCP (solute carrier family 10 member 1) and enters host cells through clathrin-mediated endocytosis [Citation2,Citation3]. DNM2 (dynamin 2), CLTC (clathrin heavy chain), or adaptor protein 2 disruption can block HBV infection [Citation3]. In addition, mature HBV particles and subviral particles (SVPs) are secreted from hepatocytes via ER-Golgi-ESCRT-dependent multivesicular bodies (MVBs) [Citation4,Citation5]. However, the exact steps in secretion and virion trafficking processes remain elusive.
Recently, accumulating evidence showed that autophagy plays a positive role in HBV replication and assembly in hepatoma cells. Some studies illustrated that initiating the early stage of autophagy can promote the replication and assembly of HBV [Citation6–11]. Silencing of ATG5, ATG12, and ATG16L1 inhibited the formation and stability of viral core/nucleocapsid and strongly diminished HBV production [Citation12]. Furthermore, Prange et al reported that the release of naked capsid depends on the functional RAB33B, which participates in the formation of autophagosomes by interacting with the ATG12–ATG5-ATG16L1 complex [Citation13]. Certain drugs, including rapamycin, cisplatin, and dexamethasone, also enhanced HBV replication by inducing cellular autophagy [Citation14–16]. Moreover, our previous study found that RAB7 and SNAP29, along with their respective receptors and other components, mediate autophagosomal-lysosomal fusion to degrade HBV virions and antigens [Citation17,Citation18]. Glucosamine or disruption of O-GlcNAcylation by OSMI-1 (a small molecule inhibitor for OGT) can inhibit autolysosomal cargo degradation and thereby promoting HBV replication [Citation19,Citation20]. However, whether autophagosomes are the main transport vesicles in virion trafficking or other components also participate needs further investigation.
CCDC88A/GIV/Girdin/APE/HkRP1 (coiled-coil domain containing 88A) is the preeminent member of a growing family of proteins, collectively known as guanine nucleotide exchange modulators, that binds Gα-subunits through an evolutionarily conserved short motif [Citation21,Citation22]. CCDC88A can be found in membrane structures of almost all mammalian tissues and various cell lines, and be involved in multiple cellular vesicular trafficking, especially in endosomes and autophagosomes [Citation23]. CCDC88A activates DNM2 and interacts with R-RAS to mediate endocytosis [Citation24,Citation25]. Moreover, GNAI3 can be activated by CCDC88A and then participate in autophagy [Citation26] and exocytosis [Citation27] via PI3K-AKT signaling pathway. In this study, we addressed the role of CCDC88A in regulating HBV replication and secretion and further investigated the underlying mechanisms.
Results
HBV regulates CCDC88A expression and the vesicular trafficking system in the liver tissues of patients with HBV infection
In patients with HBeAg-positive chronic infection (previously named the “immune-tolerant” phase (IT)) or HBeAg-negative chronic infection (previously named the “inactive carrier” (IC)), the alanine aminotransferase (ALT) levels are normal, but viral loads vary widely (7.74 log10 in the IT phase vs. 2.71 log10 in IC status) [Citation28]. The gene microarray data [Citation28] showed that the CCDC88A mRNA levels were significantly increased in patients in the IT phase compared with those with IC status (Fig. S1A). In the liver tissues of patients with chronic HBV infection, HBV-positive cells displayed higher CCDC88A expression than HBV-negative cells (), indicating that HBV infection can enhance CCDC88A expression. Consistently, HBV infection markedly increased CCDC88A expression in PHHs 4 days post infection (Fig. S1B). These data hint that CCDC88A may play a role in the process of HBV infection.
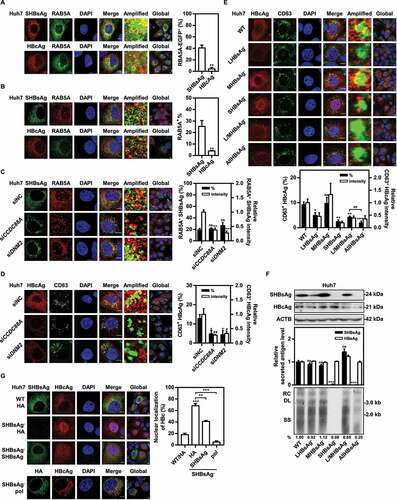
Figure 1. HBV infection regulates CCDC88A expression and the vesicular trafficking system in the liver tissues of patients with HBV infection. The liver tissues of patients with HBV infection were fixed and stained, and then the expression levels of CCDC88A (A), the distribution of SHBsAg and HBcAg (B), the fluorescence intensity of the markers of ER (PDI), early endosome (RAB5A), and autophagosome (LC3) and the colocalization of these compartments with SHBsAg (C), the fluorescence intensity of SQSTM1 and the colocalization of SQSTM1 with SHBsAg or LC3 (D), and the colocalization of HBcAg with the markers of early endosome (RAB5A), late endosome (CD63), and autophagosome (LC3) (E) were evaluated by immunofluorescence. SmCl: HBsAgmiddle HBcAglow; ShCh: HBsAghigh HBcAghigh; SlCm: HBsAglow HBcAgmiddle; SnCn: HBsAgnegative HBcAgnegative. The fluorescence intensity of target proteins, and the colocalization between target proteins or with organelle marker proteins were analyzed using ImageJ software. The results presented in the graphs were calculated from at least 5 cells. Scale bar: 10 μm. *, #p < 0.05; **, ##p < 0.01; ***, ###p < 0.001; ns, not significant.
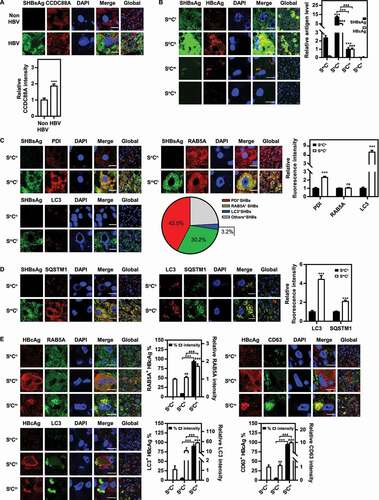
CCDC88A is reported to be involved in various aspects of vesicular trafficking, which plays a critical role in the transport of molecules between different membrane-enclosed compartments in the secretory pathway, especially endosomes and autophagosomes. Therefore, we investigated the relationship between HBV and these vesicular structures in HBV-infected liver tissues from patients. Staining of patient liver tissue samples with antibodies to SHBsAg and HBcAg, three types of HBV-positive hepatocytes were detected based on the relative fluorescence intensity of SHBsAg and HBcAg (). The majority of HBV-positive hepatocytes showed moderate SHBsAg and almost invisible HBcAg expression, termed HBsAgmiddle HBcAglow (SmCl) hepatocytes. To investigate whether HBV infection affects vesicular trafficking, thereby facilitating HBV replication, the colocalization between SHBsAg and markers of the ER (PDI), early endosomes (RAB5A), or autophagosomes (LC3) was detected by confocal microscopy in liver tissues from chronically HBV-infected patients. Compared with HBV-negative hepatocytes, SmCl hepatocytes exhibited an increased expression of PDI (~2.3-fold) and LC3 (~7.0-fold), while RAB5A expression remained unchanged (). However, the number of SQSTM1 puncta increased in SmCl hepatocytes compared with HBV-negative hepatocytes (), indicating that HBV infection decreased the autophagic degradation. This is consistent with previously reported data [Citation29], which indicated that HBV infection reduces lysosomal activity. In addition, colocalization analysis showed that SHBsAg was mainly colocalized with ER (~42.5%) and early endosomes (~30.2%). Only a small fraction was colocalized with autophagosomes (~3.2%) (), indicating that endosomes, rather than autophagosomes, are the main trafficking pathway for HBsAg. A small proportion of hepatocytes strongly expressed both SHBsAg and HBcAg (therefore termed HBsAghigh HBcAghigh (ShCh) hepatocytes), in which the colocalization of SHBsAg with ER, early endosomes and autophagosomes has a ratio similar to that in SmCl hepatocytes. The colocalization between HBcAg and RAB5A (~8.5%), LC3 (~5.0%), or CD63 (~4.7%) was rather limited (). Another part of hepatocytes with low SHBsAg and moderate HBcAg expression levels (termed HBsAglow HBcAgmiddle (SlCm) hepatocytes) only detected SHBsAg and HBcAg in the RAB5A+(~93.1%)LC3+(~89.7%)CD63+(~94.2%) compartment, which corresponds to late endosomes/MVBs. The expression levels of RAB5A (~1.7-fold), LC3 (~53.6-fold), and CD63 (~9.8-fold) were higher in those hepatocytes than in SmCl hepatocytes (), suggesting an active role of these hepatocytes in the production and release of HBV particles despite low HBV protein levels.
To further study whether HBV regulates the vesicular trafficking system in a cell culture model, Huh7 cells were transiently transfected with a HBV replication-competent plasmid pSM2 or empty vector pUC19. The HBsAg and HBcAg expression levels in pSM2-transfected cells were high, similar to those in ShCh hepatocytes in liver tissues from chronically HBV-infected patients. Consistently, immunofluorescence staining showed that pSM2-transfected Huh7 cells also exhibited increased PDI and LC3 expression, but unchanged RAB5A or CD63 expression. However, pSM2-transfected Huh7 cells displayed decreased number of LysoTracker puncta, suggesting reduced lysosomal activity (Fig. S2). In addition, colocalization analysis showed that SHBsAg was colocalized mainly with the ER (~19.1%) and early endosomes (~18.7%), and only a small fraction was colocalized with autophagosomes (~1.7%) (Fig. S2). Thus, we assumed that the formation of endosomes could play an essential role in the HBV life cycle.
CCDC88A enhances HBV replication in hepatoma cells
Next, to address whether HBV replication is regulated by CCDC88A expression, Huh7 cells were transiently transfected with pSM2 and siCCDC88A (a small interfering RNA that targets CCDC88A) for 72 h. The levels of secreted HBsAg and HBeAg, and secreted HBV virion DNA in the supernatants, the HBV replication intermediates (RIs), and the levels of intracellular HBV DNA, HBcAg and HBsAg were decreased after CCDC88A silencing (). Consistently, CCDC88A silencing reduced HBV gene expression and replication in HepG2.2.15 cells (). Similarly, immunofluorescence staining showed that CCDC88A silencing reduced HBcAg and SHBsAg expression (). In contrast, CCDC88A overexpression significantly promoted HBV replication and gene expression in pSM2-transfected Huh7 cells (). Moreover, CCDC88A knockdown (Fig. S3A) or overexpression (Fig. S3B) did not affect cell viability at any of the indicated time points. In addition, analysis of the genome-wide CRISPR screen results [Citation30] revealed that CCDC88A knockout significantly inhibited HBsAg expression (Table S1). These data demonstrate that CCDC88A positively regulates HBV replication in hepatoma cells. On the other hand, the analysis of the intracellular distribution of SHBsAg or HBcAg showed that CCDC88A knockdown led to perinuclear accumulation of SHBsAg, but did not affect HBcAg subcellular localization (, right). CCDC88A silencing did not affect HBV RNA levels in pSM2-transfected Huh7 cells or in HepG2.2.15 cells (Fig. S4A and S4B). Moreover, neither silencing nor overexpression of CCDC88A greatly affected the activities of the SP1, SP2, CP, and XP promoters (Fig. S4C and S4D), indicating that CCDC88A is unlikely to regulate HBV replication by modulating transcription.
Figure 2. CCDC88A positively regulates HBV replication in hepatoma cells. Huh7 cells transiently transfected with pSM2 were transfected with siCCDC88A or siNC (A), or with the CCDC88A expression plasmid or empty vector (B), and harvested after 72 h. (C) HepG2.2.15 cells were transfected with siCCDC88A or siNC, and harvested after 72 h. The expression of CCDC88A, SHBsAg, and HBcAg was analyzed by western blotting, and ACTB was used as the loading control. The levels of HBsAg and HBeAg in the supernatants, the encapsidated HBV RIs, the levels of intracellular HBV DNA and that in the secreted virions were measured. (D) Huh7 cells were transiently cotransfected with pSM2 and siCCDC88A or siNC. The distribution of SHBsAg and HBcAg were assessed. (E and F) Huh7 cells were transfected with siCCDC88A or siNC, and the effects of CCDC88A knockdown on early endosome (RAB5A), late endosome (CD63) (E), and autophagic flux (LC3 puncta and SQSTM1 puncta) (F) were assessed. The fluorescence intensity of RAB5A, CD63, LC3, and SQSTM1 were analyzed using ImageJ software. The intracellular distribution of SHBsAg and HBcAg was analyzed by determining their intensity profiles along the white arrows using ImageJ software. The results presented in the graphs were calculated from at least 5 cells. (G) Huh7 cells were transfected with siCCDC88A or siNC, and harvested after 48 h. The expression of LC3B and SQSTM1 were measured by western blotting. Scale bar: 10 μm. *p < 0.05; **p < 0.01; ***p < 0.001; ns, not significant.
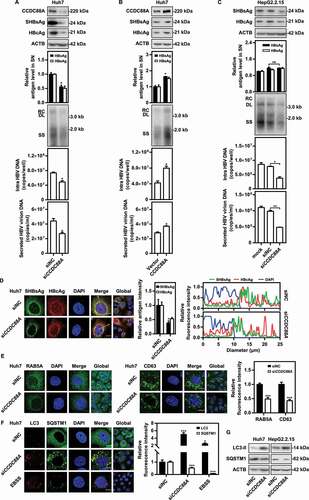
Next, to confirm the role of CCDC88A-mediated endosome and autophagosome formation in the life cycle of HBV, RAB5A, CD63, and LC3 puncta were detected after CCDC88A silencing in Huh7 cells. CCDC88A silencing reduced the numbers of RAB5A and CD63 puncta (), suggesting that CCDC88A positively regulates endosome formation. On the other hand, CCDC88A negatively regulated the autophagic flux, as the number of LC3 puncta increased and the number of SQSTM1 puncta decreased when CCDC88A was silenced (). Consistently, western blotting showed that silencing CCDC88A also increased the expression levels of LC3 but reduced that of SQSTM1 (). Our previous results indicated that increasing the number of autophagosomes can promote HBV replication [Citation10,Citation17,Citation19]. Thus, CCDC88A seems to promote HBV replication by regulating endosomes.
Silencing DNM2 and CLTC inhibits HBV replication by blocking endosome formation
In eukaryotic cells, clathrin-mediated endocytosis is the main endocytic pathway, and is regulated by DNM2 (a CCDC88A effector protein), which is also associated with the formation and maturation of the key endocytic protein CLTC [Citation31,Citation32]. Silencing CCDC88A did not affect the expression of DNM2 and CLTC (Fig. S5A). However, silencing CCDC88A may affect the activity of DNM2, an effector of CCDC88A. The activity of CLTC may be not directly affected by CCDC88A silencing. Nevertheless, CCDC88A silencing may impair CLTC-mediated endocytosis. To clarify the role of CCDC88A-mediated endosome formation in HBV replication, the effects of DNM2 and CLTC on HBV replication were examined. First, the formation of endosomes after DNM2 or CLTC silencing was examined. The microscopy results showed that DNM2 or CLTC silencing decreased the fluorescence intensity of not only RAB5A, but also CD63 (), illustrating that DNM2 or CLTC silencing negatively regulates early and late endosome formation. Furthermore, CCDC88A, DNM2 or CLTC silencing inhibited endosome formation, but did not downregulate RAB5A expression (Fig. S5A). Then, we examined the effect of DNM2 or CLTC silencing on HBV replication. The levels of secreted HBsAg and HBeAg in the supernatants as well as the levels of intracellular HBV DNA, HBcAg and SHBsAg decreased in the presence of siDNM2 or siCLTC in pSM2-transfected Huh7 cells (), and HepG2.2.15 cells (). The MTT assay showed that DNM2 or CLTC silencing did not affect Huh7 cell viability (Fig. S3C). Moreover, DNM2 or CLTC silencing markedly attenuated the positive effect of CCDC88A on HBsAg expression (). In addition, the analysis of the intracellular distribution of SHBsAg or HBcAg showed that DNM2 or CLTC silencing led to perinuclear accumulation of SHBsAg (, bottom), indicating that endosomes play a critical role in HBsAg localization. However, DNM2 or CLTC silencing did not decrease HBV RNA levels (Fig. S6), suggesting that DNM2 or CLTC silencing-mediated inhibition of HBV replication is not achieved through downregulation of HBV transcription.
Figure 3. DNM2 or CLTC silencing inhibits HBV replication by blocking endosome formation. (A) Huh7 cells were transfected with siDNM2 or siCLTC and harvested after 48 h. The expression of RAB5A and CD63 was assessed. Scale bar: 10 μm. The fluorescence intensity of RAB5A and CD63 were analyzed using ImageJ software. The results presented in the graphs were calculated from at least 5 cells. (B) Huh7 cells transiently transfected with pSM2 or (C) HepG2.2.15 cells were transfected with siDNM2 or siCLTC, and harvested after 72 h. The expression of DNM2, CLTC, SHBsAg, and HBcAg, the levels of HBsAg and HBeAg in the supernatants, the encapsidated HBV RIs, the levels of intracellular HBV DNA and that in the supernatants, and the HBV RNA levels were measured. (D) Huh7 cells were cotransfected with siDNM2 or siCLTC and pSM2, and harvested after 72 h. The distribution of SHBsAg and HBcAg was assessed. Scale bar: 10 μm. The fluorescence intensity of SHBsAg and HBcAg were analyzed using ImageJ software. The intracellular distribution of SHBsAg and HBcAg was analyzed by determining their intensity profiles along the white arrows using ImageJ software. The results presented in the graphs were calculated from at least 5 cells. (E and F) Huh7 cells transiently transfected with pSM2 were cotransfected with siDNM2 or siCLTC, and the CCDC88A expression plasmid or empty vector (E), or siRAB5A and the CCDC88A expression plasmid or empty vector (F), harvested after 72 h. The levels of HBsAg and HBeAg in the supernatants and that in the intracellular were quantified. *p < 0.05; **p < 0.01; ***p < 0.001; ns, not significant.
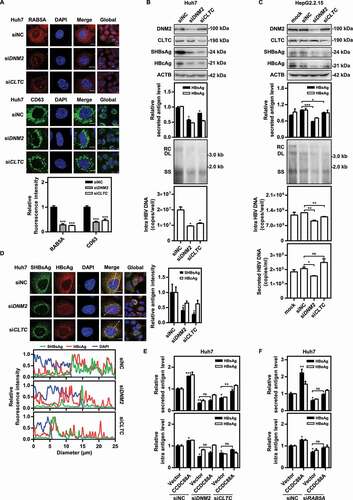
To further verify the effect of endosomes on HBV replication, the early endosome marker RAB5A (a host factor shown in a genome-wide CRISPR screen to regulate HBsAg expression [Table S1]) was silenced in hepatoma cells. RAB5A silencing decreased the HBV RIs and the expression of HBV antigens in Huh7 cells (Fig. S5B) and HepG2.2.15 cells (Fig. S5D). In contrast, RAB5A overexpression enhanced HBV gene expression and replication (Fig. S5C). Consistently, the microscopy results showed that RAB5A silencing reduced the fluorescence intensity of both SHBsAg and HBcAg (Fig. S5E). Additionally, RAB5A silencing blocked the positive effect of CCDC88A on HBV antigen expression (). Collectively, these results indicate that RAB5A silencing negatively regulates HBV production in hepatoma cell lines.
Inhibition of DNM2 by dynasore suppresses HBV replication
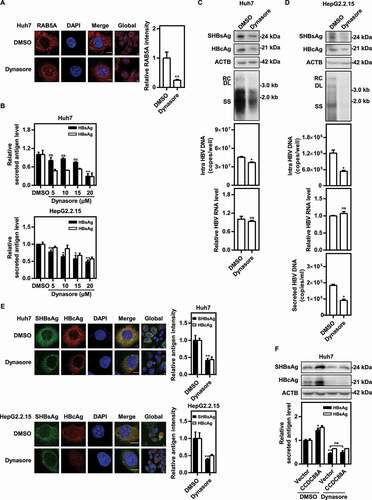
To verify the findings based on DNM2 silencing, a specific small chemical DNM2 inhibitor dynasore was used, and the effects of DNM2 inhibition on early endosome formation and HBV replication were examined in hepatoma cells. First, the MTT assay showed that dynasore had no effect on cell viability at all tested concentrations (Fig. S3D). Then, microscopy assays demonstrated a significant decrease in RAB5A+ early endosomes in Huh7 cells treated with dynasore (). The HBsAg and HBeAg levels in the supernatants were decreased in a dose-dependent manner after dynasore treatment in pSM2-transfected Huh7 cells and HepG2.2.15 cells (). In addition, dynasore treatment dramatically reduced the SHBsAg and HBcAg expression levels in Huh7 cells (). The intracellular HBV DNA levels were also reduced in pSM2-transfected Huh7 cells treated with dynasore (). Consistently, dynasore treatment markedly decreased HBV gene expression and replication in HepG2.2.15 cells (). Additionally, dynasore treatment blocked the promotive effects of CCDC88A overexpression on HBV antigen expression (). Taken together, these results suggest that inhibition of DNM2 negatively regulates HBV production in hepatoma cell lines.
Figure 4. Inhibition of DNM2 by dynasore suppresses HBV replication. (A) Huh7 cells were transfected with pSM2, and treated with dynasore (20 μM) and harvested after 48 h. RAB5A expression was evaluated. Scale bar: 10 μm. The fluorescence intensity of RAB5A was analyzed using ImageJ software. The results presented in the graphs were calculated from at least 5 cells. (B) Huh7 cells transfected with pSM2 and HepG2.2.15 cells were treated with dynasore (5, 10, 15, and 20 μM), and harvested after 72 h. The levels of HBsAg and HBeAg in the supernatants were quantified. (C) Huh7 cells transiently transfected with pSM2 or (D) HepG2.2.15 cells were treated with dynasore (20 μM) and harvested after 72 h. The expression of SHBsAg and HBcAg, the encapsidated HBV RIs, the levels of intracellular HBV DNA, and the HBV RNA levels were measured. (E) Huh7 cells transfected with pSM2 and HepG2.2.15 cells were treated with dynasore (20 μM), and harvested after 48 h. The distribution of SHBsAg and HBcAg was assessed. Scale bar: 10 μm. The fluorescence intensity of SHBsAg and HBcAg were analyzed using ImageJ software. The results presented in the graphs were calculated from at least 5 cells. (F) Huh7 cells were cotransfected with pSM2 and the CCDC88A expression plasmid or empty vector, and treated with dynasore (20 μM), and harvested after 72 h. The expression of SHBsAg and HBcAg, and the levels of HBsAg and HBeAg in the supernatants were analyzed. *p < 0.05; **p < 0.01; ***p < 0.001; ns, not significant.
Interfering with CCDC88A and DNM2 reduces the colocalization of SHBsAg with early endosomes and prevents HBV nucleocapsids from entering MVBs
As shown in , silencing CCDC88A, DNM2 or CLTC caused perinuclear accumulation of SHBsAg, while the subcellular localization of HBcAg remained unchanged. Thus, we assumed that the secretory pathways for HBsAg and HBV nucleocapsids after their synthesis in the ER differ: HBsAg is mainly transported to Golgi-early endosomes, while HBV nucleocapsids may be secreted via the alternative secretory pathway. To clarify this question, pSM2 and EGFP-RAB5A were cotransfected into Huh7 cells, and colocalization of SHBsAg or HBcAg with RAB5A was detected by immunofluorescence. The results showed that approximately 41% of SHBsAg, but only 4% of HBcAg colocalized with EGFP-RAB5A (). Consistently, colocalization of endogenous RAB5A with SHBsAg was approximately 25%, far more than the percentage colocalized with HBcAg (). Moreover, CCDC88A or DNM2 silencing decreased the fluorescence intensity of RAB5A, thereby reducing the amount of SHBsAg transported into endosomes to 38% and 27% (RAB5A+ SHBsAg intensity), respectively (). Due to the reduction in the fluorescence intensity of RAB5A after CCDC88A or DNM2 silencing, the utilization of a single early endosome increased, resulting in a slight increase in the percentage of RAB5A+ SHBsAg (RAB5A+ SHBsAg (%)). Though HBV nucleocapsids are rarely transported into early endosomes, approximately 13% of HBcAg colocalized with CD63 (a marker of late endosomes/MVBs) (), indicating that most HBV nucleocapsids does not pass through the ER-Golgi-early endosome secretion pathway. In addition, CCDC88A or DNM2 silencing reduced the fluorescence intensity of CD63, resulting in a reduction of 73% or 67% in the amount of HBV nucleocapsids delivered to late endosomes/MVBs (CD63+ HBcAg intensity), and more importantly, a reduction of 60% or 66% in the percentage of CD63+ HBcAg (CD63+ HBcAg (%)), respectively, compared with those in control cells ().
Figure 5. CCDC88A or DNM2 silencing reduces colocalization of SHBsAg with early endosomes and prevents core particles from entering MVBs. Huh7 cells were cotransfected with pSM2, with (A) or without (B) RAB5A-EGFP plasmids for 48 h. (C) Huh7 cells were cotransfected with pSM2 and siCCDC88A or siDNM2 for 48 h. The colocalization of SHBsAg with RAB5A was imaged. Scale bar: 10 μm. (D) Huh7 cells were cotransfected with pSM2 and siCCDC88A or siDNM2 for 48 h. (E) Huh7 cells were transfected with HBV deletion mutant plasmids, including LHBsAg−, MHBsAg−, SHBsAg−, L/MHBsAg− and AllHBsAg− plasmids for 48 h. The colocalization of HBcAg and CD63 was measured. Scale bar: 10 μm. The fluorescence intensity of target proteins, and the colocalization between target proteins or with organelle marker proteins were analyzed using ImageJ software. The results presented in the graphs were calculated from at least 5 cells. (F) Huh7 cells were transfected with the HBV wild-type (WT) and HBV deletion mutant plasmids, including LHBsAg−, MHBsAg−, SHBsAg−, L/MHBsAg− and AllHBsAg− plasmids, for 72 h. The HBV gene expression and replication were analyzed. (G) Huh7 cells were transfected with the HBV WT plasmid or cotransfected with the HBV deletion mutant plasmid SHBsAg−, and HA-SHBsAg, HA-pol or empty vector for 48 h. The expression of HBcAg and SHBsAg or HA was detected. Scale bar: 10 μm. *, #p < 0.05; **, ##p < 0.01; ***p < 0.001; ns, not significant.
Since HBV nucleocapsids does not utilize the ER-Golgi-early endosome secretion pathway, and inhibiting SHBsAg transport by CCDC88A or DNM2 silencing reduced the percentage of CD63+ HBcAg, we speculated that HBsAg may be required for the delivery of HBV nucleocapsids to late endosomes/MVBs. To clarify this point, Huh7 cells were transfected with pHY106-wta (containing full-length of HBV generated from pSM2 [Citation33]) or HBV mutation plasmids lacking Large HBsAg (LHBsAg), Middle HBsAg (MHBsAg), Small HBsAg (SHBsAg), Large/middle HBsAg (L/MHBsAg), or Large/middle/small HBsAg (AllHBsAg) expression, which were constructed by introducing a mutation in the start code of the corresponding HBV gene sequence in pHY106-wta. The colocalization of HBcAg with CD63 decreased from 9.1% (WT) to 5%, 2.4%, 4.2%, and 1.9% in the absence of LHBsAg, SHBsAg, L/MHBsAg, or AllHBsAg, respectively, while remaining unchanged in the absence of MHBsAg (). Surprisingly, HBcAg accumulated in the nucleus in the absence of SHBsAg. In addition, compared with other deficiency mutations that reduced the expression of HBcAg, deficiency mutations in MHBsAg and SHBsAg significantly increased the expression of HBcAg (). However, unlike MHBsAg deficiency, which slightly upregulated the levels of HBV RIs, SHBsAg deficiency nearly abolished the production of HBV RIs. Since mutating the start codon of SHBsAg changes one amino acid in pol (mutation of Methionine to Threonine), HA-SHBsAg or HA-pol expression plasmids were used to supplement SHBsAg mutations. Compared to supplementation with HA-SHBsAg, which only partially restored HBcAg localization, after supplementation with HA-pol, 95% of HBcAg was transported to the cytoplasm (), indicating that mutation in the start codon of SHBsAg led to a mutation in the pol sequence that encoded an inactive pol. This inactive pol accounted for the nuclear accumulation, reduced cytoplasmic degradation of HBcAg, and complete disappearance of HBV replication.
Silencing CCDC88A and DNM2 causes SHBsAg to accumulate on the ER, leading to increased autophagic flux and degradation of HBV antigens
Previous results indicated that CCDC88A or DNM2 silencing cause perinuclear accumulation of SHBsAg. We speculated that after CCDC88A or DNM2 silencing, HBsAg may remain in the ER after synthesis. To verify this point, we evaluated the colocalization levels of HBsAg and PDI after CCDC88A or DNM2 silencing in pSM2-transfected Huh7 cells. The levels of SHBsAg and PDI colocalization increased from ~19% to ~44% and ~37% in cells with knockdown of CCDC88A or DNM2, respectively (). Consistently, overexpression of pSM2 and DsRed-ER combined with CCDC88A or DNM2 silencing in Huh7 cells also caused SHBsAg to accumulate on the DsRed-labeled ER (), demonstrating that silencing either CCDC88A or DNM2 causes ER accumulation of HBsAg. Excessive accumulation of proteins in the ER can cause ER stress, resulting in autophagy. Next, to verify whether interfering with CCDC88A or DNM2 can trigger ER stress, the expression levels of HSPA5/BIP, ATF6, ERN1, EIF2A, and their phosphorylated forms in Huh7 cells or HepG2.2.15 cells after CCDC88A and DNM2 silencing or dynasore treatment were measured by western blotting. CCDC88A or DNM2 silencing caused significant increases in the expression levels of HSPA5/BIP, ATF6, and the phosphorylated forms of EIF2A in transiently pSM2-transfected Huh7 cells () and HepG2.2.15 cells (). In addition, dynasore treatment triggered ER stress, accompanied by increasing levels of HSPA5/BIP, ATF6, and the phosphorylated forms of EIF2A (). Furthermore, silencing either CCDC88A or DNM2 increased the colocalization of SHBsAg and LC3 (), suggesting that blocking the secretion of HBsAg by the classical secretion pathway by CCDC88A or DNM2 silencing leads to HBsAg transport into autophagosomes as an alternative secretion pathway.
Figure 6. CCDC88A or DNM2 silencing causes SHBsAg accumulation on the ER lumen, thereby triggering ER stress. Huh7 cells were cotransfected with pSM2 combined without (A) or with (B) DsRed-ER plasmid, and siCCDC88A or siDNM2 for 48 h. The colocalization of SHBsAg and ER was imaged. Scale bar: 10 μm. The colocalization between SHBsAg and ER was analyzed using ImageJ software. The results presented in the graphs were calculated from at least 5 cells. (C) Huh7 cells were cotransfected with pSM2 or empty plasmid pUC19, and siCCDC88A or siDNM2 for 48 h. HepG2.2.15 cells were transfected with siCCDC88A or siDNM2 (D) or treated with dynasore (E) for 48 h. The expression levels of HSPA5, EIF2A, p-EIF2A, ERN1, p-ERN1 and ATF6 were measured.
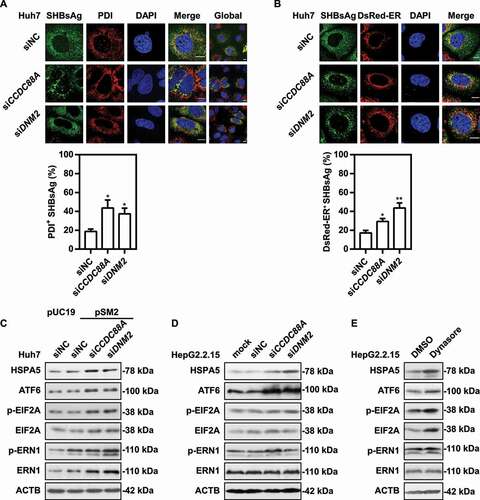
Figure 7. CCDC88A or DNM2 silencing leads to increased autophagic flux and HBV antigens degradation. (A) Huh7 cells were cotransfected with pSM2 and siCCDC88A or siDNM2 for 48 h. The colocalization of SHBsAg and LC3 was imaged. Scale bar: 10 μm. (B) HepG2.2.15 cells were transfected with siCCDC88A, and then treated with 10 μM CQ, and harvested after 72 h. The expression of SHBsAg, HBcAg, LC3 and SQSTM1 (upper) and the levels of HBsAg and HBeAg in the supernatants (below) were quantified. (C) Huh7 cells were cotransfected with pSM2 or empty plasmid pUC19 and siCCDC88A or siDNM2, and harvested after 48 h and then incubated with DQ-BSA Red for 30 min. The fluorescent signal of DQ-BSA Red produced by autolysosomal proteolysis was evaluated. Scale bar: 10 μm. (D) Huh7 cells were cotransfected with the mCherry-GFP-LC3 plasmid and siCCDC88A or siDNM2, and harvested after 48 h. The mCherry and GFP signals were examined by confocal microscopy. Scale bar: 10 μm. (E and F) Huh7 cells were cotransfected with pSM2 and siCCDC88A or siDNM2. The fluorescence intensity of LysoTracker Red (E) or AO (F) were analyzed. Scale bar: 10 μm. The fluorescence intensity of target proteins, and the colocalization between target proteins or with organelle marker proteins were analyzed using ImageJ software. The results presented in the graphs were calculated from at least 5 cells. *, #p < 0.05; **p < 0.01; ***p < 0.001; ns, not significant.
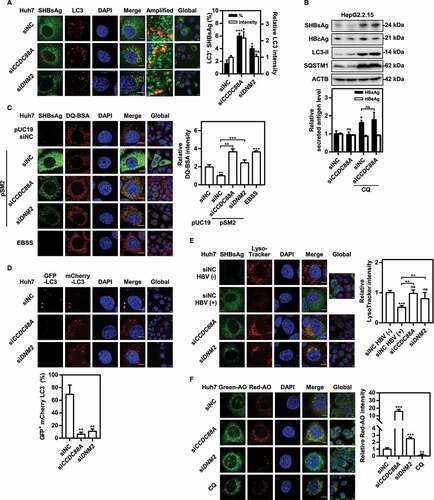
To confirm whether CCDC88A or DNM2 silencing can increase autophagic flux, western blotting analysis was used to determine the expression levels of LC3 and SQSTM1. CCDC88A silencing increased LC3 levels, but decreased SQSTM1 levels (). Using chloroquine (CQ) to block autophagic degradation not only significantly inhibited the degradation of SHBsAg and HBcAg, but also completely blocked the CCDC88A knockdown-induced reduction in SHBsAg (), indicating that CCDC88A silencing reduces HBV production by increasing autophagic degradation in HepG2.2.15 cells. However, CQ treatment significantly inhibited HBV protein expression in Huh7 cells, although it also inhibited autophagic degradation (Fig. S7A and S7B). In addition, CQ blocked the secretion of HBV antigens by CCDC88A silencing (Fig. S7A) or overexpression (Fig. S7B). CQ has been reported to destroy early endosomes and the Golgi apparatus [Citation34]. CQ increased the number of early endosomes in HepG2.2.15 cells, but did not affect early endosomes in Huh7 cells (Fig. S7C). More importantly, CQ increased the number of late endosomes in HepG2.2.15 cells, but decreased the number of late endosomes in Huh7 cells (Fig. S7D). Thus, the differential regulation of endosomes by CQ may contribute to its opposite effects on HBV production in Huh7 cells and HepG2.2.15 cells.
To further verify whether CCDC88A or DNM2 silencing promotes autophagic degradation, the DQ-BSA degradation assay was used. The fluorescent signal of DQ-BSA produced by autolysosomal proteolysis was decreased after transfected with HBV plasmid pSM2 but increased in cells in those CCDC88A or DNM2 were silenced (). Therefore, HBV infection prevents autophagic degradation, while silencing CCDC88A or DNM2 can restore it. Furthermore, the mCherry-GFP-LC3 and pSM2 plasmids were transfected into Huh7 cells combined with either siCCDC88A or siDNM2 for 48 h. As the pH decreased after entering the lysosome, the GFP signal was quenched, but the mCherry signal could still be emitted. Consistently, the confocal microscopy examination showed that silencing either CCDC88A or DNM2 led to the accumulation of LC3 puncta with only enhanced expression of mCherry, suggesting that silencing CCDC88A or DNM2 restored lysosomal activity for LC3 degradation in the autolysosome lumen (). Then, to confirm whether CCDC88A or DNM2 silencing increases lysosomal activity, lysosomal acidification was assessed by staining with LysoTracker Red or acridine orange (AO), which emits bright red fluorescence upon entry into acidic lysosomes. Confocal microscopy showed significantly decreased red fluorescence signals in Huh7 cells transfected with HBV, and markedly enhanced red fluorescence signals in siCCDC88A or siDNM2-treated cells, indicating that silencing either CCDC88A or DNM2 can restore lysosomal acidification (). Collectively, these results indicate that silencing either CCDC88A or DNM2 can restore lysosomal enzyme activity.
Silencing of either CCDC88A or its other effector GNAI3 contributes to autophagic flux, but CCDC88A silencing and GNAI3 silencing have opposite effects on HBV replication
Since silencing CCDC88A but not DNM2 significantly increased LC3 intensity (), we asked whether CCDC88A-regulated autophagosome formation occurred through another pathway. Therefore, we next focused on the role of GNAI3, another CCDC88A binding partner, that participates in cellular signaling pathways, including the insulin-induced AKT-MTOR signaling pathway [Citation35]. AKT-MTOR signaling can decrease autophagosome formation [Citation36,Citation37]. In addition, previous studies reported that the AKT-MTOR signaling pathway negatively regulates HBV replication [Citation10], while autophagy positively modulates HBV replication [Citation10,Citation19]. To evaluate the role of CCDC88A-GNAI3 signaling in modulating HBV replication and secretion, siRNA targeting GNAI3 was transfected into pSM2-transfected Huh7 cells and HepG2.2.15 cells. Western blotting analysis showed that silencing either CCDC88A or GNAI3 markedly reduced phosphorylated AKT and MTOR (), suggesting that CCDC88A or GNAI3 silencing significantly inhibits the AKT-MTOR signaling pathway. Moreover, CCDC88A or GNAI3 silencing markedly elevated the expression of LC3-II, while reducing the expression of SQSTM1 (), indicating an increase in autophagic flux. Interestingly, in contrast to CCDC88A silencing, GNAI3 silencing led to a noticeable increase in the level of intracellular HBV DNA and secreted HBV virion DNA, but exhibited no effect on the levels of secreted HBsAg and HBeAg in the supernatants of pSM2-transfected Huh7 cells (). Consistently, GNAI3 silencing also promoted HBV replication in HepG2.2.15 cells (). In addition, confocal microscopy analysis demonstrated that GNAI3 silencing led to significant increases in SHBsAg and HBcAg expression levels (). The MTT assay results showed that GNAI3 silencing did not affect cell viability (Fig. S3E). Then, the role of insulin in autophagy and HBV replication was investigated. Since fetal bovine serum (FBS) contains many growth factors that may interfere with the effects of insulin, cells were cultured with a very low amount of FBS (0.2%). Insulin supplied with increased concentrations of FBS inhibited SHBsAg expression in both Huh7 cells and HepG2.2.15 cells (Fig. S8A and S8B). In addition, insulin significantly inhibited autophagic flux and elevated the levels of phosphorylated AKT and ULK1 (S757) (Fig. S8C). Under the condition of 0.2% FBS, insulin completely inhibited autophagic flux (Fig. S8C). Moreover, insulin blocked the promotive effect of GNAI3 silencing (), indicating that GNAI3 silencing positively modulates HBV replication by regulating the insulin-induced AKT-MTOR signaling pathway.
Figure 8. Silencing either CCDC88A or its other effector GNAI3 contributes to autophagic flux, but CCDC88A silencing and GNAI3 silencing have opposite effects on HBV replication. (A) Huh7 cells transiently transfected with pSM2 or (B) HepG2.2.15 cells were transfected with siCCDC88A or siGNAI3, and harvested after 72 h. The expression levels of CCDC88A, GNAI3, AKT, p-AKT, MTOR, p-MTOR, LC3 and SQSTM1 were evaluated. (C) Huh7 cells transiently transfected with pSM2 or (D) HepG2.2.15 cells were transfected with siGNAI3 or siNC, and harvested after 72 h. The HBV gene expression and replication were measured. (E) Huh7 cells were cotransfected with pSM2 and siGNAI3 or siNC, and harvested after 72 h. The expression of SHBsAg and HBcAg was evaluated. Scale bar: 10 μm. The fluorescence intensity of SHBsAg and HBcAg were analyzed using ImageJ software. The results presented in the graphs were calculated from at least 5 cells. (F) Huh7 cells were cotransfected with pSM2 and siGNAI3; then, the cells were cultured with 0.2% FBS and treated with 10 μM insulin, and harvested after 72 h. The expression of HBsAg and HBeAg was analyzed. (G and H) Huh7 cells were transfected with the WT CCDC88A plasmid or CCDC88AF1685A plasmid (a plasmid expressing a GNAI3 binding-inactivated CCDC88A mutant) for 72 h. The expression levels of CCDC88A, AKT, p-AKT, MTOR, p-MTOR, LC3 and SQSTM1 (G) and the HBV gene expression and replication (H) were analyzed. (I) Huh7 cells were transfected with the WT CCDC88A plasmid or CCDC88AF1685A plasmid, and then cultured with 0.2% FBS and treated with 10 μM insulin for 72 h. The expression of HBsAg and HBeAg was analyzed. *p < 0.05; **p < 0.01; ***p < 0.001; ns, not significant.
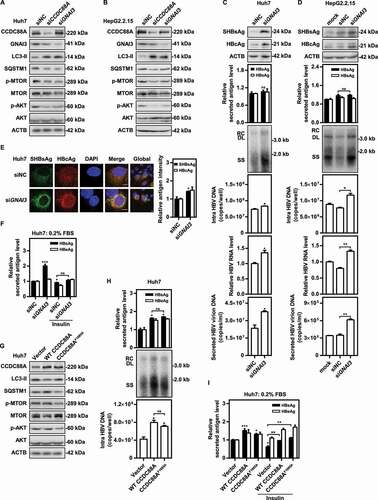
To further confirm the function of CCDC88A-mediated autophagy on HBV replication, the GEF activity-deficient F1685A (CCDC88AF1685A) mutant [Citation38] was used. The CCDC88AF1685A mutant lost its inhibitory effect on autophagy and inhibited the AKT-MTOR signaling pathway (). However, restoration of autophagosome formation by CCDC88AF1685A did not further increase HBV replication and secretion (). Moreover, insulin treatment completely inhibited autophagosome formation, but failed to block the CCDC88A overexpression-induced enhancement of HBV replication (), suggesting that CCDC88A promotes HBV replication independent of GNAI3 and autophagosome formation. Taken together, these findings indicate that CCDC88A-mediated regulation of HBV replication is a comprehensive process of promoting the formation of endosomes and inhibiting the activity of lysosomes. Moreover, an increase in endosomes to compensate for the decrease in autophagosomes also modulates the transport of HBV components.
Discussion
In this study, we demonstrate the importance of the endocytosis-related gene CCDC88A in the HBV life cycle. HBV infection promoted CCDC88A expression, leading to increased ER stress and autophagosome formation, without altering endosome formation in the liver tissues of patients with HBV infection and in HBV-transfected Huh7 cells. On the other hand, CCDC88A not only regulated HBV replication and secretion, but also dominated the transport of viral proteins and the assembly of viral particles. Silencing CCDC88A and other critical genes in endocytosis led to a decline in the levels of extracellular virions and intracellular HBV DNA, as a consequence of defects in intracellular endosome trafficking events. Moreover, inhibition of endocytosis and endosome formation led to HBsAg transportation into autophagosomes, implying that autophagosomes constitute an alternative secretion pathway. Although CCDC88A overexpression reduced the formation of autophagosomes, overexpression of the GNAI3 binding-inactive CCDC88AF1685A mutant did not further increase HBV replication and secretion, indicating that an increase in endosomes completely compensated for the dysfunction of autophagosomes for HBsAg transportation. Therefore, CCDC88A or GNAI3 silencing generated opposite effects on HBV replication, although both of them regulate autophagic flux though the insulin-mediated AKT-MTOR signaling pathway.
There are three types of HBV-positive hepatocytes in the liver tissues of HBV-infected patients. According to limited clinical data (Table S2), ShCh or SlCm hepatocytes may be a manifestation of active HBV replication and gene expression. A small proportion of individual hepatocytes displayed both strong SHBsAg and HBcAg expression, probably due to enhanced HBV production, however, the exact causes require further confirmation. ShCh hepatocytes are the commonly reported type in clinical cases with high HBV antigen expression levels. Based on our findings, the majority of hepatocytes with activated HBV replication are SlCm hepatocytes. However, SlCm hepatocytes have rarely been reported in previous clinical case reports. Due to the low HBsAg and HBcAg expression in these hepatocytes, high-resolution laser confocal microscopy is required to detect HBV antigens. It may be used as a preliminary indicator of active HBV replication.
In chronic HBV infection, the formation of autophagosomes in hepatocytes increased while the autophagic degradation decreased (). The maturation and activity of lysosomes are inhibited by HBV infection, resulting in increased HBsAg export. Generally, HBV replication during IT phase is efficient, corresponding to an elevated CCDC88A expression and endosomal trafficking (Fig. S1). However, CCDC88A expression is reduced during the IC phase, and may causally correlated with a lower level of HBV replication. This is consistent with our current knowledge that endosomal trafficking pathway is the main secretory pathway for HBV virions and a part of subviral particles. The enhanced autophagosome serves as an alternative secretory pathway. During the IC phase, endosomal trafficking may be decreased and the alternative secretory pathways may be used. Enhanced autophagic flux enables trafficking of HBV antigens to autophagosomes, which may fuse with MVBs to release its cargo, or fuse with lysosomes to degrade its cargo. Only a small part of HBV subviral particles and virions are secreted via the autophagosome-MVB axis, while the majority of HBV antigens and virions are degraded in autolysosomes.
As shown in , a part of newly synthesized HBsAg enters MVBs through the ER-Golgi-endosome secretion pathway. Inhibition of endocytosis by interfering with CCDC88A, DNM2, CLTC, or RAB5A can inhibit the formation of endosomes, leading to inhibition of HBsAg secretion. Excessive HBsAg accumulation in the ER can trigger ER stress and enter the vesicular trafficking system through entry into autophagosomes. Colocalization of SHBsAg with endosomes far exceeded that with autophagosomes, indicating that endosomes are the main pathway for HBsAg secretion, and that autophagosomes constitute an alternative pathway. This finding was consistent with the 20 genes [Citation28] with the largest difference at the IT phase compared with the IC status having no correlation with autophagy or HBV replication (R = 0.046, p = 0.76). In addition, perturbing the endosomal pathways may also affect other cellular trafficking or secretion pathways, or CCDC88A may also regulate ER-Golgi-secretory vesicle axis [Citation39], since knockdown of CCDC88A reduced the secretion of TF (transferrin). However, overexpression CCDC88A had no effect on the secretion of TF, probability because it did not affect TF production (Fig. S9).
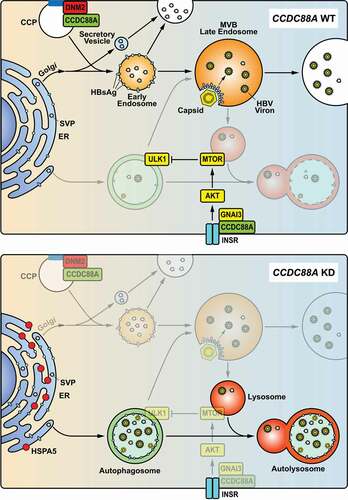
Figure 9. Model of CCDC88A-mediated regulation of HBV replication. CCDC88A overexpression (upper) promotes endosome formation to increase HBV replication and secretion. In addition, CCDC88A overexpression decreases lysosomal activity to prevent degradation of HBV antigens by upregulating AKT-MTOR signaling. In contrast, silencing CCDC88A (bottom) can prevent endosome formation and promote HBV antigen degradation by enhancing lysosomal activity and autophagic flux, thereby inhibiting HBV replication. In addition, silencing CCDC88A did not affect the fusion of autophagosome-lysosome, and restored the lysosomal activity and maturation inhibited by HBV infection, resulting in decreased HBV replication and secretion. CCP, clathrin-coated pit; INSR, insulin receptor.
A great part of HBsAg is secreted in the form of SVPs [Citation40,Citation41]. However, inhibition of endosomal trafficking and autophagy also reduces HBsAg export but in a smaller extent. Therefore, there are four potential pathways for SVPs secretion: 1. directly secreted from Golgi through secretory vesicles; 2. secreted through Golgi-early endosomes, which can fuse with plasma membrane to release its cargo or matured as late endosomes/MVBs; 3. secreted through Golgi-early endosomes-late endosomes/MVBs, which can fuse with plasma membrane to release its exosomes and cargo or fuse with lysosome to degrade the cargo; 4. under stress conditions, autophagosome formation increased, SVPs can be secreted through autophagosome-MVBs axis.
Given that about a quarter of HBsAg colocalizes with endosomes, a part of HBsAg may be transported through the endosome pathway. However, HBV nucleocapsid rarely colocalized with early endosomes, but can be uptake into late endosomes/MVBs with the help of HBsAg and enveloped with HBsAg (not SVPs). Inhibition of HBsAg transport or deletion of HBsAg may inhibit the uptake of HBV nucleocapsid into late endosomes/MVBs, resulting in accelerated lysosomal degradation of the HBV nucleocapsid (including capsid-associated relaxed circular DNA (rcDNA) in the capsid). This finding is consistent with those of previous studies showing that deletion or mutation of envelope proteins can inhibit HBV particle secretion [Citation42–44]. Therefore, after capsid assembly and DNA replication in the cytoplasm, coating of the naked capsid with the envelope to form mature HBV particles very likely occurs when the capsid is enclosed in MVBs. Although there are no data about the colocalization of LC3 with HBcAg, and HBV particles were not detected in autophagosomes in our previous studies, speculating that autophagosomes, like endosomes, may be an alternative transport vesicle for HBsAg secretion and assembly.
As an immune defense mechanism, HBsAg in either endosomes or autophagosomes is eventually transported to lysosomes for degradation. However, it has been reported that HBx can impair lysosomal activity and maturation [Citation29]. Lysosomal inactivation is a basic event leading to the accumulation of autophagosomes and autophagic cargo proteins (including LC3, SQSTM1, and virion proteins), which may lead to increased formation of MVBs and exosomes, and increased release of cargo into the extracellular environment. Previous studies have shown that blocking autophagosomal-lysosomal fusion or decreasing lysosomal activity promotes HBsAg production and inhibits the lysosomal degradation of HBV virions and HBsAg [Citation17,Citation18,Citation20]. HBsAg is secreted through the classical ER-Golgi pathway or exported through the ER-autophagosome after being synthesized. Blocking autophagic degradation can hamper the degradation of HBV DNAs, thereby increasing the level of HBV offspring DNAs. On the other hand, late endosomes/MVBs, which are late endocytic organelles containing many intraluminal vesicles (ILVs), have been reported to be used for enveloping and releasing mature HBV particles [Citation4,Citation5,Citation45]. In this study, CCDC88A overexpression promoted HBV progeny secretion by increasing late endosomes/MVBs formation and reducing autophagic degradation. In contrast, CCDC88A silencing decreased the formation of endosomes and restored lysosome activity, resulting in a reduction in HBV replication.
Protein translation takes place in the cytoplasm, where ribosomes either float freely or attach to the ER. We found that newly synthesized HBsAg partly enters endosomes, while HBV nucleocapsid rarely interacts with endosomes. Since N-glycosylation occurs in the ER-Golgi, the N-glycosylation of HBsAg indicated that the secretion of HBsAg occurs mainly through the ER-Golgi pathway. The HBcAg protein sequence contains an arginine-rich domain (ARD), which includes nuclear localization signals and nuclear output signals [Citation46], suggesting that the newly synthesized HBcAg could first enter the nucleus. However, the biological function of HBcAg entry into the nucleus is still unclear. The ATG to ACG mutation in the start codon of SHBsAg changes one amino acid in pol, leading to pol inactivation, and HBcAg accumulation in the nucleus, and abrogation of HBV replication. This result was consistent with that in a previous report indicating that deletion of pol leads to intranuclear localization of HBcAg [Citation47]. However, mutations in other HBsAg sequences, which also changed the encoding of pol protein, did not cause results similar to those of SHBsAg− mutation. Therefore, the detailed mechanism by which pol domains cause nuclear localization of HBcAg needs further investigation.
Taken together, our data suggest that CCDC88A-mediated endosomal trafficking plays an important role in HBV replication and progeny secretion, and that the autophagic process represents an alternative pathway. Further studies on endosomal trafficking or autophagy are of great significance for gaining a better understanding of the HBV life cycle and pathogenesis.
Materials and methods
Tissue collection
Liver tissue samples were collected from five patients with HBV-associated HCC hospitalized in the Department of Hepatobiliary Pancreatic Surgery of Taihe Hospital (Shiyan, China) between September 2020 and October 2020. The clinicopathological characteristics of the patients are shown in Table S2. Nontumor liver tissues were collected during hepatectomy. The tissue samples were cut into small pieces (~4 mm) on ice, and then quickly frozen with O.C.T. in liquid nitrogen. Patients provided informed written consent before tissue collection. The study was approved by the Ethics Committee of Taihe Hospital, Shiyan, China.
Cell culture and transfection
All cell lines used were cultured in a humidified atmosphere containing 5% CO2 at 37°C. The stable HBV-producing cell line HepG2.2.15 was routinely cultured in RPMI-1640 medium (Gibco, 11875093), supplemented with 10% inactivated FBS, 100 U/mL penicillin, 100 μg/mL streptomycin (Gibco, 15140122), 1% nonessential amino acids (NEAAs; Gibco, 11140050), 1% HEPES, pH 7.0–7.4, and 500 μg/mL G418 (Gibco, 10131027). The HBV transient transfection cell line Huh7 was cultured in DMEM supplemented with 10% inactivated FBS, 100 U/mL penicillin, 100 μg/mL streptomycin, 1% NEAAs, and 1% HEPES. Primary human hepatocytes (PHHs) were cultured in Williams E medium (PAN-biotech, P0429050), supplemented with 250 μl insulin, 2% DMSO (Sigma-Aldrich, D5879) and 125 μl hydrocortisone hemisuccinate (Sigma-Aldrich, 1319002). HBV infection of PHHs was performed as described previously [Citation19,Citation48]. The HBV replication-competent plasmid pSM2 has been described previously [Citation49]. Transfection of siRNAs (40 nM) or plasmids was performed with Lipofectamine 2000 transfection reagent (Invitrogen, 11668019) according to the manufacturer’s instructions.
siRNAs and plasmids
The siRNA sequences are shown in Table S3. The sequences of siCCDC88A, siCLTC, siDNM2, and siHBx were obtained from previous studies [Citation23,Citation50–52], and were synthesized by Sangon Biotech. siGNAI3 (SI00088949), and siRAB5A (SI00301588) were purchased from Qiagen. Initially, two siRNAs were selected for each target gene, and the siRNA with the best knockout efficiency was selected.
The plasmid information is shown in Table S4. The wta-LHBsAg−, wta-MHBsAg−, wta-SHBsAg−, wta-L/MHBsAg−, and wta-AllHBsAg− mutant sequences were inserted into pHY106-wta by overlap PCR using the primers of SP1mu, SP2mu, Smu to mutate the ATG start codon to ACG in LHBsAg, MHBsAg, and SHBsAg. The sequences of the primers are shown in Table S5.
Western blotting assays
The methods for preparing whole cell protein lysates and western blotting have been described previously [Citation53]. The information about the antibodies is shown in .
Table 1. List of antibodies
Detection of HBV gene expression and replication
To quantify HBV DNA in the culture supernatant, HBV DNA was extracted with a TIANamp Virus DNA/RNA Kit (Tiangen, DP315) according to the manufacturer’s instructions and quantified by real-time qPCR assay. Virions from the supernatants were immunoprecipitated with HBsAg antibody by overnight incubation at 4°C, followed by incubation with protein-G-agarose beads (Thermo scientific, 20399) for 2 h at 4°C. Beads were subjected to sedimentation by centrifugation for 1 min at 16,000 g and washed five times in PBS. Bound particles were disrupted with sodium dodecyl sulfate (SDS)-containing buffer. After centrifugation, supernatants were collected, and DNA was extracted using the TIANamp Virus DNA/RNA Kit according to the manufacturer’s instructions and quantified by real-time qPCR assay. The HBsAg and HBeAg levels in the culture supernatant were measured with a HBsAg/HBeAg ELISA Kit (Kehua Bio-engineering), and quantified according to the standard curve. To detect HBV DNA RIs, Southern blotting analysis was performed with a DIG-High Prime DNA Labeling and Detection Starter Kit II (Roche, 11585614910) according to the manufacturer’s instructions, and real-time qPCR was performed using primers specific for HBV DNA. Total RNA was extracted from cells with TRIzol reagent (Invitrogen, 15596018). HBV RNA levels were measured by real-time reverse transcription (RT)-PCR assays (Qiagen, 210215) using primers specific for HBV RNA (Table S5).
Immunofluorescence assay
For liver tissues, the frozen tissues were cut into 8 µm cryosections, fixed on coverslips with 4% formaldehyde, and then subjected to immunostaining. For cultured cell lines, cells grown on coverslips were fixed and permeabilized post transfection or post treatment. After washing and blocking, tissues or cells were incubated with the primary antibodies for 1 h, rinsed with PBS, and then incubated with the appropriate AlexaFluor-labeled secondary antibodies for 1 h. Nuclei were stained with DAPI. Following washing and mounting of the tissues or cells, microscopic analysis was performed with an Olympus FV3000RS using a 100× oil immersion objective. The fluorescence intensity of target proteins was analyzed using ImageJ software. The colocalization between target proteins or with organelle marker proteins were analyzed using ImageJ software-colocalization finder plugin. The results presented in the graphs were calculated from at least 5 cells.
Lysosomal activity detection
Lysosomal activity was detected by acridine orange (AO) staining or LysoTracker Red staining. AO staining or LysoTracker Red staining were carried out as described previously [Citation17]. In brief, transfected or treated cells were stained with 5 μM acridine orange (AO; Sigma-Aldrich, A6014) for 15 min or 50 nM LysoTracker Red (Thermo Fisher, L12492) for 30 min. Then, the fluorescent signals at 488 nm (green) or 594 nm (red) for AO or 594 nm (red) for LysoTracker Red were measured using a 100× oil immersion objective.
Dye quenched-bovine serum albumin (DQ-BSA) Red degradation assay
The DQ-BSA Red degradation assay was performed as described previously [Citation17]. 48 h post transfection, cells were incubated with DQ-BSA Red (10 μg/ml; Invitrogen, D12051) for 30 min. The fluorescent signal produced by lysosomal proteolysis of DQ-BSA Red was quantified with a 100× oil immersion objective as described above.
Cytotoxicity assay
The MTT assay kit (Beyotime, C0009S) was used for cytotoxicity assay according to the manufacturer’s instructions.
Statistical analyses
The results are expressed as the means ± SEM. Statistical analyses were performed using GraphPad Prism software version 7 (La Jolla, CA, USA). Difference of means of two groups was determined by the Student’s paired t test. Data for single factor experiments were performed by one-way ANOVA procedure. Data for two factors experiments were performed by two-way ANOVA procedure. Differences were considered statistically significant when p < 0.05. All experiments were repeated independently at least three times.
Disclosure of statement
No potential conflict of interest was reported by the author(s).
Supplemental Material
Download Zip (9.8 MB)Acknowledgments
We thank Ms. Thekla Kemper (Institute of Virology, University Hospital Essen, University of Duisburg-Essen), Ms. Qingqing Yu, Ms. Li Xu, Mr. Te Zhang (Biomedical Research Institute, Hubei University of Medicine) and Mr. Jun Lv (Institute of Infection and Immunity, Taihe Hospital, Hubei University of Medicine) for excellent technical Support.
Supplementary material
Supplemental data for this article can be accessed here
Additional information
Funding
Related Research Data
References
- European Association for the Study of the Liver. EASL 2017 clinical practice guidelines on the management of hepatitis B virus infection. J Hepatol. 2017;67(2):370–398.
- Yan H, Zhong G, Xu G, et al. Sodium taurocholate cotransporting polypeptide is a functional receptor for human hepatitis B and D virus. eLife. 2012;1:e00049.
- Herrscher C, Pastor F, Burlaud-Gaillard J, et al. Hepatitis B virus entry into HepG2-NTCP cells requires clathrin-mediated endocytosis. Cell Microbiol. 2020;22(8):e13205.
- Jiang B, Himmelsbach K, Ren H, et al. Subviral Hepatitis B virus filaments, like infectious viral particles, are released via multivesicular bodies. J Virol. 2015;90(7):3330–3341.
- Watanabe T, Sorensen EM, Naito A, et al. Involvement of host cellular multivesicular body functions in hepatitis B virus budding. Proceedings of the National Academy of Sciences of the United States of America. 2007;104(24):10205–10210.
- Tian Y, Sir D, Kuo CF, et al. Autophagy required for hepatitis B virus replication in transgenic mice. J Virol. 2011;85(24):13453–13456.
- Li J, Liu Y, Wang Z, et al. Subversion of cellular autophagy machinery by hepatitis B virus for viral envelopment. J Virol. 2011;85(13):6319–6333.
- Sir D, Tian Y, Chen WL, et al. The early autophagic pathway is activated by hepatitis B virus and required for viral DNA replication. Proceedings of the National Academy of Sciences of the United States of America. 2010;107(9):4383–4388.
- Wang J, Chen J, Liu Y, et al. Hepatitis B virus induces autophagy to promote its replication by the axis of miR-192-3p-XIAP Through NF kappa B Signaling. Hepatology. 2019;69(3):974–992.
- Wang X, Lin Y, Kemper T, et al. AMPK and Akt/mTOR signalling pathways participate in glucose-mediated regulation of hepatitis B virus replication and cellular autophagy. Cell Microbiol. 2020;22(2):e13131.
- Klionsky DJ, Abdel-Aziz AK, Abdelfatah S, et al. Guidelines for the use and interpretation of assays for monitoring autophagy (4th edition). Autophagy. 2021;17(1):1-382.
- Doring T, Zeyen L, Bartusch C, et al. B Virus Subverts the Autophagy Elongation Complex Atg5-12/16L1 and Does Not Require Atg8/LC3 Lipidation for Viral Maturation. J Virol. 2018;92(7):92.
- Doring T, Prange R. Rab33B and its autophagic Atg5/12/16L1 effector assist in hepatitis B virus naked capsid formation and release. Cell Microbiol. 2015;17(5):747–764.
- He Q, Song X, Huang Y, et al. Dexamethasone Stimulates Hepatitis B Virus (HBV) Replication Through Autophagy. Med Sci Monit. 2018;24:4617–4624.
- Huang W, Zhao F, Huang Y, et al. Rapamycin enhances HBV production by inducing cellular autophagy. Hepatitis Mon. 2014;14(10):e20719.
- Chen X, Hu Y, Zhang W, et al. Cisplatin induces autophagy to enhance hepatitis B virus replication via activation of ROS/JNK and inhibition of the Akt/mTOR pathway. Free Radic Biol Med. 2019;131:225–236.
- Lin Y, Wu C, Wang X, et al. Synaptosomal-associated protein 29 is required for the autophagic degradation of hepatitis B virus. FASEB J. 2019;33(5):6023–6034.
- Lin Y, Wu C, Wang X, et al. Hepatitis B virus is degraded by autophagosome-lysosome fusion mediated by Rab7 and related components. Protein Cell. 2019;10(1):60–66. .
- Lin Y, Wu C, Wang X, et al. Glucosamine promotes hepatitis B virus replication through its dual effects in suppressing autophagic degradation and inhibiting MTORC1 signaling. Autophagy. 2020;16(3):548-561.
- Wang X, Lin Y, Liu S, et al. O -GlcNAcylation modulates HBV replication through regulating cellular autophagy at multiple levels. FASEB J. 2020;34(11):14473–14489.
- Enomoto A, Ping J, Takahashi M. Girdin, a novel actin-binding protein, and its family of proteins possess versatile functions in the Akt and Wnt signaling pathways. Ann N Y Acad Sci. 2006;1086(1):169–184.
- Aznar N, Kalogriopoulos N, Midde KK, et al. Heterotrimeric G protein signaling via GIV/Girdin: breaking the rules of engagement, space, and time. BioEssays. 2016;38(4):379–393.
- Ghosh P, Aznar N, Swanson L, et al. Biochemical, biophysical and cellular techniques to study the guanine nucleotide exchange factor, GIV/Girdin. Curr Protoc Chem Biol. 2016;8(4):265–298.
- Weng L, Enomoto A, Miyoshi H, et al. Regulation of cargo-selective endocytosis by dynamin 2 GTP ase-activating protein girdin. EMBO J. 2014;33(18):2098–2112.
- Ichimiya H, Maeda K, Enomoto A, et al. Girdin/GIV regulates transendothelial permeability by controlling VE-cadherin trafficking through the small GTPase, R-Ras. Biochem Biophys Res Commun. 2015;461(2):260–267.
- Garcia-Marcos M, Ear J, Farquhar MG, et al. A GDI (AGS3) and a GEF (GIV) regulate autophagy by balancing G protein activity and growth factor signals. Mol Biol Cell. 2011;22(5):673–686.
- Lopez-Sanchez I, Ma GS, Pedram S, et al. GIV/girdin binds exocyst subunit-Exo70 and regulates exocytosis of GLUT4 storage vesicles. Biochem Biophys Res Commun. 2015;468(1–2):287–293.
- Liu H, Li F, Zhang X, et al. Differentially Expressed Intrahepatic Genes Contribute to Control of Hepatitis B Virus Replication in the Inactive Carrier Phase. J Infect Dis. 2018;217(7):1044–1054. .
- Liu B, Fang M, Hu Y, et al. Hepatitis B virus X protein inhibits autophagic degradation by impairing lysosomal maturation. Autophagy. 2014;10(3):416–430.
- Hyrina A, Jones C, Chen D, et al. A Genome-wide CRISPR Screen Identifies ZCCHC14 as a Host Factor Required for Hepatitis B Surface Antigen Production. Cell Rep. 2019;29(10):2970–8 e6.
- Song BD, Leonard M, Schmid SL. Dynamin GTPase domain mutants that differentially affect GTP binding, GTP hydrolysis, and clathrin-mediated endocytosis. J Biol Chem. 2004;279(39):40431–40436.
- Loerke D, Mettlen M, Yarar D, et al. Cargo and dynamin regulate clathrin-coated pit maturation. PLoS Biol. 2009;7(3):e57.
- Yang H, Westland C, Xiong S, et al. In vitro antiviral susceptibility of full-length clinical hepatitis B virus isolates cloned with a novel expression vector. Antiviral Res. 2004;61(1):27–36.
- Mauthe M, Orhon I, Rocchi C, et al. Chloroquine inhibits autophagic flux by decreasing autophagosome-lysosome fusion. Autophagy. 2018;14(8):1435–1455.
- Wang H, Misaki T, Taupin V, et al. GIV/girdin links vascular endothelial growth factor signaling to Akt survival signaling in podocytes independent of nephrin. J Am Soc Nephrol. 2015;26(2):314–327.
- Wu YT, Tan HL, Huang Q, et al. Activation of the PI3K-Akt-mTOR signaling pathway promotes necrotic cell death via suppression of autophagy. Autophagy. 2009;5(6):824–834.
- Zoncu R, Bar-Peled L, Efeyan A, et al. mTORC1 senses lysosomal amino acids through an inside-out mechanism that requires the vacuolar H(+)-ATPase. Science. 2011;334(6056):678–683.
- Garcia-Marcos M, Ghosh P, Farquhar MG. GIV is a nonreceptor GEF for G alpha i with a unique motif that regulates Akt signaling. Proceedings of the National Academy of Sciences of the United States of America. 2009;106(9):3178–3183.
- Lo IC, Gupta V, Midde KK, et al. Activation of Galphai at the Golgi by GIV/Girdin imposes finiteness in Arf1 signaling. Dev Cell. 2015;33(2):189–203.
- Blumberg BS. Australia antigen and the biology of hepatitis B. Science. 1977;197(4298):17–25.
- Prange R. Host factors involved in hepatitis B virus maturation, assembly, and egress. Med Microbiol Immunol. 2012;201(4):449–461.
- Loffler-Mary H, Dumortier J, Klentsch-Zimmer C, et al. B virus assembly is sensitive to changes in the cytosolic S loop of the envelope proteins. Virology. 2000;270(2):358–367.
- Blanchet M, Sureau C. Analysis of the Cytosolic Domains of the Hepatitis B virus envelope proteins for their function in viral particle assembly and infectivity. J Virol. 2006;80(24):11935–11945.
- Wu C, Li B, Zhang X, et al. Complementation of Wild-Type and Drug-Resistant Hepatitis B Virus Genomes to Maintain Viral Replication and Rescue Virion Production under Nucleos(t)ide Analogs. Virol Sin. 2019;34(4):377–385.
- Inoue J, Ninomiya M, Shimosegawa T, et al. Cellular Membrane Trafficking Machineries Used by the Hepatitis Viruses. Hepatology. 2018;68(2):751–762.
- Li HC, Huang EY, Su PY, et al. Nuclear export and import of human hepatitis B virus capsid protein and particles. PLoS Pathog. 2010;6(10):e1001162.
- Deroubaix A, Osseman Q, Cassany A, et al. Expression of viral polymerase and phosphorylation of core protein determine core and capsid localization of the human hepatitis B virus. J Gen Virol. 2015;96(1):183–195.
- Wan Y, Cao W, Han T, et al. Inducible Rubicon facilitates viral replication by antagonizing interferon production. Cell Mol Immunol. 2017;14(7):607–620.
- Zhang X, Zhang E, Ma Z, et al. Modulation of hepatitis B virus replication and hepatocyte differentiation by MicroRNA-1. Hepatology. 2011;53(5):1476–1485.
- Singleton PA, Salgia R, Moreno-Vinasco L, et al. CD44 regulates hepatocyte growth factor-mediated vascular integrity. Role of c-Met, Tiam1/Rac1, dynamin 2, and cortactin. J Biol Chem. 2007;282(42):30643–30657.
- Huang HC, Chen CC, Chang WC, et al. Entry of hepatitis B virus into immortalized human primary hepatocytes by clathrin-dependent endocytosis. J Virol. 2012;86(17):9443–9453.
- Wu J, Meng Z, Jiang M, et al. Hepatitis B virus suppresses toll-like receptor-mediated innate immune responses in murine parenchymal and nonparenchymal liver cells. Hepatology. 2009;49(4):1132–1140.
- Lin Y, Deng W, Pang J, et al. The microRNA-99 family modulates hepatitis B virus replication by promoting IGF-1R/PI3K/Akt/mTOR/ ULK1 signaling-induced autophagy. Cell Microbiol. 2017;19(5):e12709.