
ABSTRACT
Macroautophagy (hereafter referred to as autophagy) is a finely tuned process of programmed degradation and recycling of proteins and cellular components, which is crucial in neuronal function and synaptic integrity. Mounting evidence implicates chromatin remodeling in fine-tuning autophagy pathways. However, this epigenetic regulation is poorly understood in neurons. Here, we investigate the role in autophagy of KANSL1, a member of the nonspecific lethal complex, which acetylates histone H4 on lysine 16 (H4K16ac) to facilitate transcriptional activation. Loss-of-function of KANSL1 is strongly associated with the neurodevelopmental disorder Koolen-de Vries Syndrome (KdVS). Starting from KANSL1-deficient human induced-pluripotent stem cells, both from KdVS patients and genome-edited lines, we identified SOD1 (superoxide dismutase 1), an antioxidant enzyme, to be significantly decreased, leading to a subsequent increase in oxidative stress and autophagosome accumulation. In KANSL1-deficient neurons, autophagosome accumulation at excitatory synapses resulted in reduced synaptic density, reduced GRIA/AMPA receptor-mediated transmission and impaired neuronal network activity. Furthermore, we found that increased oxidative stress-mediated autophagosome accumulation leads to increased MTOR activation and decreased lysosome function, further preventing the clearing of autophagosomes. Finally, by pharmacologically reducing oxidative stress, we could rescue the aberrant autophagosome formation as well as synaptic and neuronal network activity in KANSL1-deficient neurons. Our findings thus point toward an important relation between oxidative stress-induced autophagy and synapse function, and demonstrate the importance of H4K16ac-mediated changes in chromatin structure to balance reactive oxygen species- and MTOR-dependent autophagy.
Abbreviations: APO: apocynin; ATG: autophagy related; BAF: bafilomycin A1; BSO: buthionine sulfoximine; CV: coefficient of variation; DIV: days in vitro; H4K16ac: histone 4 lysine 16 acetylation; iPSC: induced-pluripotent stem cell; KANSL1: KAT8 regulatory NSL complex subunit 1; KdVS: Koolen-de Vries Syndrome; LAMP1: lysosomal associated membrane protein 1; MAP1LC3/LC3: microtubule associated protein 1 light chain 3; MEA: micro-electrode array; MTOR: mechanistic target of rapamycin kinase; NSL complex: nonspecific lethal complex; 8-oxo-dG: 8-hydroxydesoxyguanosine; RAP: rapamycin; ROS: reactive oxygen species; sEPSCs: spontaneous excitatory postsynaptic currents; SOD1: superoxide dismutase 1; SQSTM1/p62: sequestosome 1; SYN: synapsin; WRT: wortmannin.
Introduction
Autophagy is a well-conserved, cellular process controlling the degradation and recycling of proteins, which is essential for cells to maintain protein homeostasis. Three major types of autophagy have been identified: chaperone-mediated autophagy, microautophagy, and, most extensively studied, macroautophagy (hereafter referred to as autophagy). There is emerging evidence for an important physiological role of autophagy in neuronal health and function [Citation1,Citation2]. In neurons, autophagy plays a pivotal role in synaptic plasticity and memory formation [Citation3]. Within the most prominent neurodegenerative disorders, including Alzheimer, Parkinson, and Huntington diseases, autophagy is protective against neurodegeneration [Citation4,Citation5]. Disrupted autophagy showed to promote neurodegeneration in those disorders [Citation6–8]. During development autophagy is required for synaptic pruning. Impaired autophagy due to over-activation of MTOR (mechanistic target of rapamycin kinase) leads to reduced synaptic pruning and subsequent increased spine density, which has been observed in patients with autism spectrum disorder [Citation9]. Further, to enable activity-dependent modifications in synaptic strength and efficacy, high protein turnover is required in which autophagy has been proposed to play a role, at the pre- and postsynapse, by controlling the number of synaptic vesicles and ionotropic GABA and glutamate receptors [Citation10–12].
In recent years, compelling evidence has revealed a crucial role for tight transcriptional regulation of ATG (autophagy related) genes. Several epigenetic mechanisms, including histone modifications, are essential for the transcriptional control of these ATG genes and thus autophagy [Citation3]. Under nutrient-rich conditions the dimethylation of histone H3 at lysine residue 9 (H3K9me2) represses ATG gene expression in HeLa and primary human T-cells [Citation13]. Similarly, H3K27me3 represses transcription of several negative regulators of MTOR, ensuring high MTOR activity in order to suppress autophagy [Citation14]. Furthermore, ATG gene expression is regulated by the acetylation of histone H4 at lysine residue 16 (H4K16ac), which is mediated by the acetyltransferase KAT8/hMOF/MYST1 [Citation15]. While H4K16ac generally ensures active ATG gene expression, autophagy induction is followed by a reduction in H4K16ac and decreased ATG gene expression [Citation15]. This negative feedback-loop prevents prolonged autophagy and subsequent cell death, indicating how essential balanced autophagy is for cell survival, but also function.
The histone acetyltransferase KAT8 works within the nonspecific lethal (NSL) complex where KANSL1 functions as a scaffold protein [Citation16]. Heterozygous loss of KANSL1 has been identified as the genetic cause for Koolen-de Vries syndrome (KdVS), formerly known as 17q21.31 micro-deletion syndrome [Citation17–19]. This multisystemic disorder encompasses mild to moderate ID, developmental delay, epilepsy, distinct facial features, congenital malformations, and friendly behavior. In HeLa cells, KANSL1 has been implicated in microtubule nucleation and stabilization during mitosis [Citation20] and, more recently, also in mitochondrial respiration [Citation21]. In mouse and Drosophila genetic manipulations of Kansl1 have implicated KANSL1-KAT8 signaling in short-term memory formation and social behavior [Citation18,Citation22]. In the KANSL1-deficient mouse model, the behavioral deficits in mice were accompanied with impaired synaptic transmission [Citation22]. Accordingly, changes in gene expression in these mice have been linked to synapse function, development, as well as neurogenesis [Citation22]. However, the molecular and cellular processes through which KANSL1 affects neuronal function, in particular in human neuronal networks, remains unaddressed. The function of KANSL1 as scaffold of the NSL complex and the essential role of H4K16ac in autophagy regulation suggest that deregulated autophagy might underlie the neuronal deficits in KdVS.
Starting from KANSL1-deficient human induced-pluripotent stem cells (iPSCs), both from KdVS patients and genome-edited lines, we identified a previously unrecognized mechanism in which loss of KANSL1 resulted in autophagosome accumulation due to increased oxidative stress. In KdVS patient-derived neurons, a disbalance between MTOR- and oxidative stress-mediated autophagy resulted in reduced synaptic function and network activity, which could be rescued by lowering the amount of reactive oxygen species (ROS). Our findings establish ROS-mediated autophagy as a contributing factor to KdVS presenting a new avenue for autophagy modulation in neurons and possible therapeutic intervention.
Results
Heterozygous loss of KANSL1 leads to accumulation of autophagosomes in iPSCs
To examine the role of KANSL1 in autophagy regulation, we generated an isogenic heterozygous KANSL1-deficient iPSC line (CRISPR1, ). We used CRISPR/Cas9 genome editing, in a healthy control iPSC line (C1, mother from KdVS individual, Figure S1B-D), to induce a heterozygous frameshift mutation in exon 2, leading to a premature stop-codon. Additionally, we reprogrammed fibroblasts from a KdVS patient with small deletions in exon 2 of KANSL1 (KdVS1), leading to a frameshift and premature stop codon. KdVS1 was generated from the daughter of C1. The shared genetic background of C1, CRISPR1 and KdVS1 allowed us to examine phenotypes caused by heterozygous loss of KANSL1. To ensure that our findings are common in KdVS patient-derived cells and not specific to the shared genetic background, we additionally compared lines with an independent genetic background (). A second KdVS patient iPSC line (KdVS2) was generated from a female patient with a mutation in Exon 2 that is similar to the mutation in KdVS1. The third KdVS iPSC line (KdVS3) was generated from a patient with a 580-kb heterozygous deletion at chromosome 17q21.31 encompassing five known protein-coding genes (CRHR1, SPPL2C, MAPT, STH, and KANSL1). Notably, there is no distinction between KdVS patients with KANSL1 mutations versus 17q21.31 deletion at the clinical level [Citation19]. Finally, we obtained a gender-matched (female) external control iPSC line (C2), which we used for comparison with the KdVS patient lines. All selected clones were positive for pluripotency markers (POU5F1/OCT4, TRA-1-81, and SSEA4) (characterization of iPSCs is illustrated in Figure S1A). As expected, western blot, immunocytochemistry and quantitative real-time PCR (qPCR) analysis showed reduced KANSL1 expression in all patient lines, as well as the CRISPR-edited line (, Figure S1E, 2A). Loss of KANSL1, as scaffold protein of the NSL complex, however, did not lead to a general reduction in H4K16ac (Figure S1F), which is in alignment with recent observations of Kansl1 knockdown in mouse embryonic stem cells [Citation23].
Figure 1. Autophagosome accumulation in KdVS patient-derived iPSCs. (A) Schematic overview of control and KdVS iPSC lines used in this study. (B) Quantification of KANSL1 protein levels relative to GAPDH and example western blots for all iPSC lines. n = 6 for C1; KdVS1; CRISPR1; n = 5 for C2; C2; KdVS2; KdVS3 (C) Example western blots and quantification for LC3-II protein levels relative to GAPDH. n = 8 for C1; KdVS1; CRISPR1; n = 5 for C2; KdVS2; and KdVS3. (D) Example western blots and quantification for SQSTM1 protein levels relative to GAPDH. n = 9 for C1; KdVS1; CRISPR1; n = 7 for C2; KdVS2; KdVS3. (E) Representative images and particle quantification for iPSC colonies stained for LC3. Scale bar: 20 µm. n = 11 for C1; KdVS1; n = 12 for CRISPR1; n = 16 for C2; n = 17 for KdVS2; n = 19 for KdVS3. Particle quantification was normalized to respective control line. (F) Representative images and particle quantification for iPSC colonies stained for SQSTM1. Scale bar: 20 µm. n = 39 for C1; n = 45 for KdVS1; n = 35 for CRISPR1; n = 16 for C2; n = 17 for KdVS2; n = 19 for KdVS3. Kruskal-Wallis and Dunn’s multiple comparison test was preformed to test for significant differences. Data presented in this figure were collected in at least 3 independent experiments. Statistically significant differences were tested through ordinary one-way ANOVA and Sidaks’s multiple comparison test, if not mentioned differently. *P < 0.05, **P < 0.01, ***P < 0.005, ****P < 0.0001.
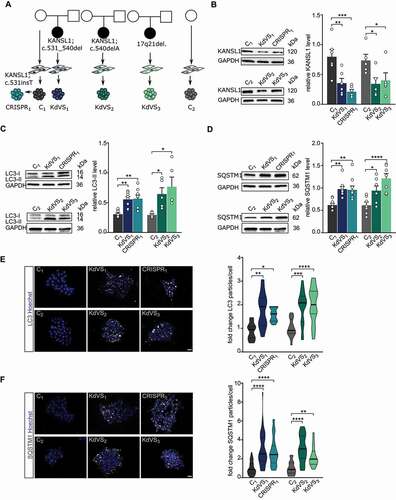
To investigate the role of KANSL1 in autophagy we measured autophagosomal marker proteins SQSTM1/p62 and LC3-I/-II in control and KANSL1-deficient iPSCs under basal conditions. Western blot analysis showed increased SQSTM1 as well as LC3-II levels () in all KANSL1-deficient iPSCs. We corroborated these results by immunocytochemistry, in which we observed increased numbers of SQSTM1 and LC3 particles in all KANSL1-deficient iPSCs, when compared to their respective controls (). LC3-II is a well-characterized marker for autophagosomes [Citation24,Citation25]. During acute activation LC3-I is lipidated to LC3-II and then locates to the double membrane of phagophores, precursors to autophagosomes [Citation26]. Next to elevated LC3-II levels, we found increased expression of WIPI2, encoding a protein that binds to the early forming autophagosomes, where it is involved in LC3 lipidation [Citation27] (Figure S2B), strongly suggesting increased autophagosome formation in KANSL1-deficient iPSCs. SQSTM1 is a receptor protein that interacts with LC3-II when bound to targets such as protein aggregates or mitochondria, to promote their selective uptake and degradation [Citation28]. Upon fusion with lysosomes, lysosomal enzymes degrade autophagosomal content, including SQSTM1, while LC3-II at the outer membrane remains stable (reviewed by Glick et al.) [Citation29]. The fact that we observed increased levels of LC3-II and SQSTM1 under basal conditions, even in the absence of inhibitors of lysosomal proteolysis, indicates that autophagosomes accumulate in KANSL1-deficient iPSCs.
Autophagosome accumulation is caused by increased oxidative stress
The MTOR pathway is a central regulator of autophagy, controlling multiple aspects including initiation, course, and termination of the autophagy process (Figure S2D). Upon activation, the MTOR complex 1 (MTORC1) represses autophagy by phosphorylating ULK1 and thereby repressing its kinase function within the early steps of autophagosome biogenesis [Citation30–32]. To test whether autophagosome accumulation in KANSL1-deficient iPSCs is caused by reduced activity of MTORC1 we measured p-MTOR, which is the phosphorylated, activated form of MTOR. Surprisingly, we found an increased p-MTOR:MTOR ratio in KANSL1-deficient iPSCs, indicating increased MTOR activity and thus reduced MTOR mediated autophagy (). Increased phosphorylation of ULK1 at serine residue-757 [Citation33] in KANSL1-deficient iPSCs further confirmed a reduction in MTOR mediated autophagy (Figure S2C). To test whether the MTOR-associated autophagy pathway is intact in KANSL1-deficient iPSCs we treated the cells with rapamycin, a compound that activates autophagy through MTOR inhibition. Rapamycin reduced p-MTOR levels, as well as SQSTM1 protein levels in KANSL1-deficient iPSCs, normalizing the levels between genotypes. This indicates that autolysosome formation and subsequent protein breakdown are functional upon rapamycin-induced autophagy (). Therefore, impaired lysosomal function in KANSL1-deficient iPSCs is unlikely to cause autophagosome accumulation. In order to confirm this, we measured autophagic flux after rapamycin treatment. iPSCs were first transfected with a tandem mCherry/GFP-LC3 fusion expression plasmid. This double tag strategy enabled us to monitor autophagosome and autolysosome formation in the transfected cells. While in autophagosomes both tags emit fluorescent light, the acidic pH after fusion with lysosomes will quench the GFP signal () [Citation34,Citation35]. In control iPSCs (C1) around one third of the autophagosomes were fused to lysosomes 2–3 h after rapamycin treatment (). When bafilomycin A1 was added, autolysosome formation was inhibited and close to 100% of the LC3-positive particles emit GFP and mCherry fluorescence (). Also, in KANSL1-deficient iPSCs (KdVS1, CRISPR1) the fraction of autophagosomes decreased after rapamycin treatment to a level that was similar to the control () indicating no difference in lysosomal fusion between the lines. Accumulation of autophagosomes was therefore neither caused by a deficit in lysosomal function, nor mediated by a decrease in MTOR signaling, which even showed to be increased.
Figure 2. Increased oxidative stress causes autophagosome accumulation. (A) Representative western blots for p-MTOR, and MTOR with and without rapamycin (RAP) treatment. RAP samples were incubated with 200 nM RAP for 10 min, followed by 2 h without RAP before cell lysis. Quantification of p-MTOR:MTOR ratio. n = 10 for C1; n = 7 for C1+ RAP; n = 9 for KdVS1; n = 6 for KdVS1 + RAP; n = 10 for CRISPR1; n = 7 for CRISPR1+ RAP. Protein levels were normalized to loading control. Treatment efficiency was assessed by means of unpaired t test between untreated and RAP treated samples of C1. (B) Representative western blots for SQSTM1 with and without RAP treatment. Quantification of SQSTM1. n = 8 for C1; KdVS1; CRISPR1; n = 5 for C1+ RAP; KdVS1+ RAP; CRISPR1+ RAP. Presented protein levels are relative to GAPDH. (C) Schematic representation of flux measurements through double-tagged mCherry-EGFP-LC3 transfection in iPSCs. (D) Example images of fluorescent LC3 detection after RAP and bafilomycin A1 (BAF; 200 nM for 10 min prior to RAP) treatment. Quantification of autophagosomes. n = 23 for C1+ RAP; n = 14 for C1+ RAP+BAF; n = 18 for KdVS1+ RAP; n = 14 for KdVS1+ RAP+BAF; n = 22 for CRISPR1+ RAP; n = 12 for CRISPR1+ RAP+BAF. (E) Representative western blots for SOD1 and SOD1 protein quantification. Protein levels were normalized to GAPDH. n = 6 for C1; KdVS1; CRISPR1. Statistical significance was tested by means of ordinary one-way ANOVA and Sidak’s multiple comparison test. (F) Schematic presentation and example western blots of SOD1 overexpression in KdVS1 and CRISPR1 iPSCs. (G) Representative images and quantification of SQSTM1 particles in iPSCs with and without SOD1 overexpression. n = 14 for C1; n = 15 for KdVS1; n = 15 for CRISPR1. (H) Representative images of iPSC colonies stained with CellROX and fluorescence quantification. iPSCs were either untreated or treated overnight with 100 µM apocynin (APO). n = 26 for C1; n = 23 for C1+ APO; n = 12 for KdVS1; n = 10 for KdVS1+ APO; n = 26 for CRISPR1; n = 28 for CRISPR1+ APO. Fluorescence levels were normalized to the untreated control. Scale bar: 20 µm. (I) Representative images of iPSC colonies stained for SQSTM1 and particle analysis. iPSCs were either untreated or treated overnight with 100 µM APO. n = 27 for C1; n = 24 for C1+ APO; n = 33 for KdVS1; n = 22 for KdVS1+ APO; n = 23 for CRISPR1; n = 23 for CRISPR1+ APO. Fluorescence levels were normalized to untreated control. Scale bar: 20 µm. Data presented in this figure were collected in at least 3 independent experiments. Statistically significant differences were determined by means of Kruskal Wallis and Dunn’s multiple comparison test, if not mentioned differently. *P < 0.05, **P < 0.01, ***P < 0.005, ****P < 0.0001.
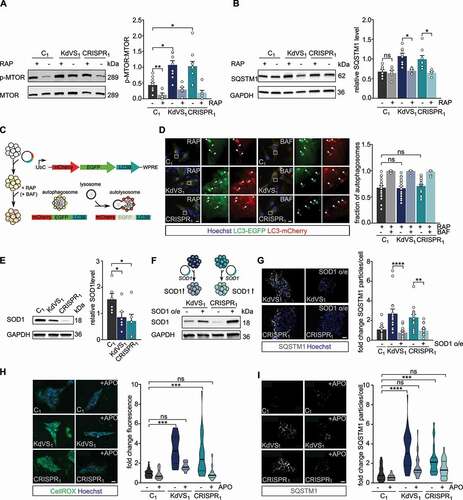
To identify MTOR-independent molecular mechanisms that can lead to increased autophagosome formation/accumulation, we considered chromatin-immunoprecipitation sequencing data on differentially activated promoters (H3K4me3) in the KdVS mouse model [Citation22]. Gene ontology analysis identified changed promoter activation of genes within oxidoreductase and mitochondria pathways [Citation22], suggesting increased oxidative stress in KdVS mice. We performed qPCRs for a set of H4K16ac regulated ATG genes [Citation15], that showed differentially activated promoters in the KdVS mouse model. We identified SOD1 (superoxide dismutase 1), an antioxidant enzyme that reduces superoxide, to be about one third lower expressed in KdVS patient derived iPSCs (Figure S2A). Western blot analysis further confirmed lowered SOD1 protein levels (). Notably, the expression of the closely related paralog SOD2, which functions in the mitochondria, was unaffected (Figure S2A). Lentiviral transduction of the KANSL1 deficient lines KdVS1 and CRISPR1 with a SOD1 overexpression vector increased SOD1 levels in these cells and at the same time significantly reduced the number of SQSTM1 particles to a level that was comparable to the number of SQSTM1 particles in control cells (, G). This indicates that reduced SOD1 levels, at least in part, underlie the observed autophagy phenotype. Reduced expression of antioxidant enzymes, like SOD1, leads to less efficient ROS neutralization and increased oxidative stress. Since increased ROS can activate autophagy in an MTOR-independent manner [Citation36], we hypothesized that oxidative stress could be causal to the elevated autophagosome formation in KANSL1-deficient cells. To test this hypothesis, we directly measured ROS in control and KANSL1-deficient iPSCs, using a fluorogenic, cell-permeable dye, that exhibits green fluorescence upon oxidation by ROS. We found higher fluorescence levels in KANSL1-deficient cells (), suggesting increased oxidative stress. Because loss-of-function of different NSL complex proteins, including KANSL1, has previously been associated with reduced mitochondrial function in non-neuronal cells [Citation21], we assessed mitochondrial respiration utilizing Seahorse assay. However, our results indicate that the oxygen consumption rate was not affected in KANSL1-deficient iPSCs (Figure S3A, B), suggesting that increased oxidative stress is not occurring due to reduced mitochondrial function.
Next, we sought to counteract the increased ROS levels by applying apocynin, a compound that prevents the formation of superoxide by suppressing NADPH oxidase. We were able to reduce ROS levels significantly in KdVS patient-derived iPSCs (). Importantly, this was accompanied with significantly lower SQSTM1 accumulation (), further suggesting that higher oxidative stress levels cause autophagosome accumulation in KANSL1-deficient iPSCs.
ROS -induced increase in autophagosomes in KANSL1-deficient neurons
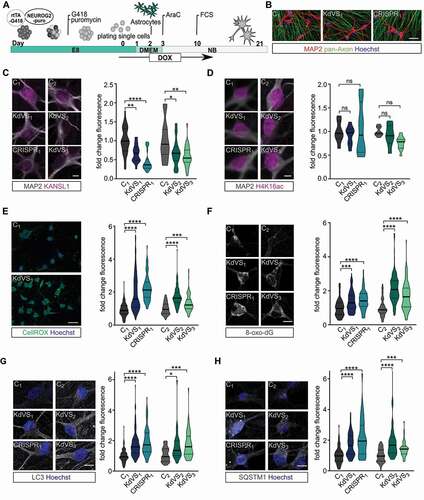
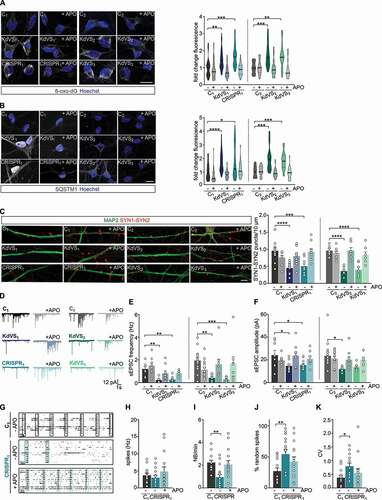
Dysregulated autophagy has been associated with neurodevelopmental disorders, including autism spectrum disorders [Citation9,Citation37–39], and neurodegenerative diseases such as Parkinson [Citation40–43] and amyotrophic lateral sclerosis [Citation44,Citation45], where familial cases are associated with mutations in SOD1 [Citation46]. Autophagy is crucial to proper axon guidance, vesicular release, dendritic spine architecture, spine pruning, and synaptic plasticity [Citation3,Citation9,Citation39,Citation47,Citation48]. Hence, we next examined whether the increase in autophagosomes observed in iPSCs is also present in KANSL1-deficient neurons, and whether a defective autophagy pathway affects specific aspects of neuronal function. To this end we differentiated iPSCs into a homogeneous population of excitatory cortical layer 2/3-like neurons (iNeurons) by forced expression of the transcription factor transgene NEUROG2/NGN2 (neurogenin 2) [Citation49,Citation50]. For all experiments, iNeurons were co-cultured with freshly isolated rodent astrocytes to facilitate maturation (). All iPSC lines were able to differentiate into MAP2-positive neurons with comparable cell densities (, Figure S5A). KANSL1 expression was lower in neurons derived from KANSL1-deficient iPSCs () compared to controls. Similar to iPSCs, KANSL1-deficiency did not lead to a general reduction in H4K16ac in iNeurons (). Twenty-one days after the start of differentiation (days in vitro, DIV), both, control and KdVS iNeurons showed a fully developed neuronal morphology, measured by reconstruction and quantitative morphometry of MAP2-labeled iNeurons (, Figure S4A). KANSL1-deficiency did not result in any significant alteration in the neuronal somatodendritic morphology, including soma size, the number of primary dendrites, dendritic length and overall complexity (Figure S4A-F). Next, we measured ROS levels in DIV 21 iNeurons and found elevated ROS levels in KANSL1-deficient iNeurons (–F). To further corroborate our results, we immunostained iNeurons for 8-oxo-dG, an antibody targeting oxidized DNA, to assess levels of oxidative stress. KANSL1-deficient iNeurons all showed 50–100% increased 8-oxo-dG immunoreactivity (). This increase in ROS was also accompanied by increased levels of SQSTM1, LC3 and WIPI2 in KANSL1-deficient iNeurons at DIV21 (, H and Figure S5B). Summarized, these results indicate that in KANSL1-deficient iNeurons ROS levels and the number of autophagosomes are increased, similar to our observations in KdVS patient-derived iPSCs.
Figure 3. Autophagy phenotype in KdVS patient derived iNeurons. (A) Schematic illustration of the protocol that was used for iPSC differentiation into neurons by means of doxycycline-inducible NEUROG2 expression. (B) Representative images of iNeuron cultures at DIV21 stained for pan-axon and MAP2. Scale bar: 50 µm. (C) Representative images of iNeurons at DIV21 stained for KANSL1 and MAP2. n = 33 for C1; n = 36 for KdVS1; n = 29 for CRISPR1; n = 26 for C2; n = 32 for KdVS2; n = 29 for KdVS3. Fluorescence quantification of nuclear KANSL1 signal was normalized to the respective control lines. Scale bar: 10 µm. (D) Representative images of iNeurons at DIV21 stained for H4K16ac and MAP2. n = 7 for C1; n = 8 for KdVS1; n = 8 for CRISPR1; n = 8 for C2; n = 8 for KdVS2; n = 11 for KdVS3. Fluorescence quantification for H4K16ac immunostainings was normalized to the respective control lines. Scale bar: 10 µm. Significance was determined by means of one-way ANOVA and Sidak’s multiple comparison test. (E) Representative images for CellROX staining for iNeurons derived of C1 and KdVS1 and fluorescence quantification for CellROX measurements at DIV21, normalized to the respective control lines. n = 125 for C1; n = 142 for KdVS1; n = 92 for CRISPR1; n = 78 for C2; n = 105 for KdVS2; n = 109 for KdVS3. Scale bar: 50 µm. (F) Representative images and fluorescence quantification for 8-oxo-dG stainings of iNeurons at DIV21 for all lines normalized to the respective control lines. n = 107 for C1; n = 102 for KdVS1; n = 80 for CRISPR1; n = 57 for C2; n = 105 for KdVS2; n = 86 for KdVS3. Scale bar: 10 µm. (G) Representative images of LC3 immunostainings and fluorescence quantification relative to the respective control lines. n = 90 for C1; n = 91 for KdVS1; n = 85 for CRISPR1; n = 39 for C2; n = 44 for KdVS2; n = 51 for KdVS3. Scale bar: 10 µm. (H) Representative images of SQSTM1 stainings and fluorescence quantification relative to the respective control line lines. n = 69 for C1; n = 60 for KdVS1; n = 85 for CRISPR1; n = 38 for C2; n = 42 for KdVS2; n = 47 for KdVS3. Scale bar: 10 µm. All data were obtained in at least 3 independent experiments. Statistically significant differences were tested through Kruskal-Wallis and Dunn’s multiple comparison test, if not mentioned differently. *P < 0.05, **P < 0.01, ***P < 0.005, ****P < 0.0001.
Decreased synaptic activity in KdVS patient derived iNeurons
Neurodevelopmental disorders have been associated with synaptic deficits. Also in the KdVS mouse model, KANSL1-deficiency has already been shown to result in impaired synaptic transmission [Citation22]. Autophagosomes have been localized at the synapse, where MTOR-induced autophagy plays a role in synaptic pruning [Citation9]. In addition, SOD1 and ROS have an essential role in synaptic function and memory [Citation51–53], but the link between ROS, autophagy and p-MTOR function remains unclear. Given our abovementioned observations we first investigated whether increased oxidative stress causes autophagosome formation at the synapse in iNeurons. To do so, we infected control iNeurons with a lentivirus to express GFP-LC3. At DIV21 we removed B27 from the medium in order to increase oxidative stress and treated the cells for 10 min with bafilomycin A1 to prevent fusion of autophagosomes with lysosomes. Then we costained for SYN1 (synapsin I)-SYN2 (synapsin II). LC3 puncta colocalized with SYN1-SYN2 (), showing autophagosome formation at the synapse upon cellular stress induction.
Figure 4. Synaptic phenotype in KdVS patient derived iNeurons. (A) Schematic presentation of the protocol to colocalize LC3 and SYN1-SYN2. Image of a dendrite of a control iNeuron at DIV21 after overnight incubation without B27 and treated with 200 nM BAF for 10 min before fixation. Scale bar: 10 µm. (B) Representative images showing dendrites stained for MAP2 and SYN1-SYN2 and SYN1-SYN2 puncta quantification at DIV21 for all lines. n = 60 for C1; n = 57 for KdVS1; n = 24 for CRISPR1; n = 15 for C2; n = 20 KdVS2; n = 34 for KdVS3. Scale bar: 20 µm. One-way ANOVA and Sidak’s multiple comparison test were used to test for statistically significant differences. (C) Representative voltage clamp recordings at Vh = −60 mV showing sEPSCs at DIV21. (D) sEPSC amplitude and (E) frequency quantification. n = 9 for C1; n = 11 for KdVS1; n = 10 for CRISPR1; n = 15 for C2; n = 8 for KdVS2 and KdVS3 (obtained in two independent experiments). (F) Schematic representation for neuronal network measurements on MEAs (3 min of recording). Representative raster plots for C1, KdVS1 and CRISPR1 derived networks that were plated at similar high densities, measured at DIV 30. (G) Quantification of the mean firing rate and (H) network burst rate, (I) percentage of random spikes, and (J) coefficient of variation (CV) calculated on the inter network burst interval. n = 15 for C1; n = 18 for KdVS1; n = 16 for CRISPR1. If not stated differently, data presented in this figure were obtained in at least 3 independent experiments and statistically significant differences were tested through Kruskal-Wallis and Dunn’s multiple comparison test. *P < 0.05, **P < 0.01, ***P < 0.005, ****P < 0.0001.
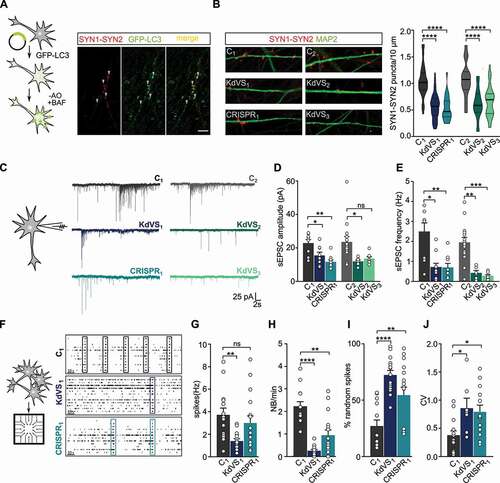
To investigate, whether KANLS1-deficiency and potential autophagosome formation at synaptic sites leads to impaired synapse formation, we stained control and KdVS iNeurons for pre- and postsynaptic markers (i.e., SYN1 and HOMER1, respectively) at DIV 21. SYN1 puncta show a high degree of colocalization with HOMER1, indicating that putative functional synapses were formed on control and KdVS iNeurons (Figure S5C). Given the reliable colocalization of SYN1 with Homer we stained iNeurons for SYN1-SYN2 at DIV21 to quantify the number putative functional synapses. We found significantly fewer SYN1-SYN2 puncta in all KANSL1-deficient iNeurons compared to controls (). To test, whether there are indeed less functional synapses we performed whole-cell voltage-clamp recordings of spontaneous excitatory postsynaptic currents (sEPSCs) for three-week old iNeurons. KANSL1-deficient neurons (KdVS1, CRISPR1 and KdVS2, KdVS3) showed a clear reduction in amplitude and frequency of sEPSCs, compared to the respective control iNeurons (C1 and C2) (–E). Changes in frequency and amplitude suggest both, a pre- and postsynaptic deficit in KdVS iNeurons.
Dysfunction in neuronal network dynamics has been observed in the brain of patients with neurodevelopmental disorders [Citation54–56]. In addition, neuronal network dysfunctions have been identified in model systems for several intellectual disabilities/autism spectrum disorder syndromes [Citation57–59]. Our single-cell electrophysiological data prompted us to examine and compare the spontaneous electrophysiological population activity of control and KANSL1-deficient neuronal networks growing on micro-electrode arrays (MEAs). Through extracellular electrodes located at spatially-separated points across the cultures MEAs allowed us to monitor neuronal network activity non-invasively and repeatedly. As shown previously [Citation49], electrical activity of control neuronal networks grown on MEAs organized into rhythmic, synchronous events (network burst), composed of numerous spikes occurring close in time and throughout all electrodes, four weeks after differentiation was induced (). This indicates that the iNeurons had self-organized into a synaptically-connected, spontaneously active network that matures over time. As expected from the reduced number of functional synapses, we observed significantly less frequent network bursts in networks composed of KdVS1-, as well as CRISPR1-derived iNeurons (, H). The global level of spiking activity was significantly lower in networks of the KdVS patient-derived iNeurons (KdVS1), but not the CRISPR1 iNeurons (). However, we found that in both, the KdVS1 and CRISPR1 iNeurons, the percentage of random spikes was significantly increased (). Together with a decrease in network burst rate, this indicates that KANSL1-lacking networks organized differently compared to controls, in line with a more immature state in which activity mainly occurs outside network bursts [Citation49,Citation57] (). This was further illustrated by a more irregular network-bursting pattern, quantified as a larger coefficient of variation (CV) () of the inter-network burst interval for KdVS1- and CRISPR1-derived networks.
Apocynin treatment rescues synaptic phenotype in KdVS derived neurons
To investigate whether increased oxidative stress is causal to the autophagosome formation and subsequent reduced synaptic activity in KdVS patient-derived iNeurons we treated iNeurons with 100 µM apocynin. First, we confirmed that prolonged apocynin treatment reduced ROS levels and autophagosome accumulation in KANSL1-deficient iNeurons of KdVS1, KdVS2, KdVS3 and CRISPR1, through 8-oxo-dG and SQSTM1 immunostainings, respectively (). In the controls line C1 and C2 apocynin treatment did not change 8-oxo-dG and SQSTM1 levels significantly. Having reduced ROS and SQSTM1 levels in KdVS iNeurons cultured with apocynin we next examined the effect on synapse density. Prolonged apocynin treatment (for 14 days) increased SYN puncta significantly in KdVS iNeurons, to a level that was comparable to control iNeurons (). Of note, apocynin treatment had little effect on control iNeurons, suggesting that ROS levels in normal circumstances are low in these cells. To get insights into effects of increased oxidative stress on synapse development, we performed SYN1-SYN2 immunostainings at different time points over the course of five weeks. For the control line (C1) we observed a continuous increase with a strong rise in SYN puncta between week two and three (Figure S5D), similar to what we reported previously [Citation49]. When oxidative stress was increased continuously during the differentiation of the control line (C1) by adding BSO, this increase in SYN puncta in week three was prevented, highly similar to what we observed for KANSL1- deficient (KdVS1, CRISPR1) iNeurons, where this dramatic increase in synaptic puncta in week 3 was also not observed. Through the time course of five weeks the number of putative functional synapses, represented by SYN1-SYN2 puncta, remained lower in cultures with increased oxidative stress (C1+ BSO, KdVS1, CRISPR1), compared to control (C1). However, when reducing oxidative stress through apocynin treatment in KANSL1-deficient iNeuronal cultures, SYN development is highly similar to what we observed for the control (C1) cultures. These findings point toward a role for oxidative stress induced autophagy during synaptogenesis, rather than synapse removal. In order to show that the increase in SYN1-SYN2 puncta correlates with an increase in synaptic activity we analyzed sEPSC frequency and amplitude for apocynin-treated iNeurons. As shown in synaptic input in KANSL1-deficient iNeurons showed to be decreased. However, when these cells are treated with apocynin for 2 weeks during differentiation, this increases the frequency to a level that is not distinguishable from the control cells anymore (). Also, the amplitude is increased in all KANSL1-deficient iNeurons (). Next, we wanted to assess whether this increase in synaptic input also leads to increased network activity in apocynin treated KANSL1-deficient networks. As described previously, neuronal network bursts occurred significantly less often in KANSL1-deficient networks. Reducing oxidative stress by means of apocynin treatment significantly increased the number of network bursts for CRISPR1 to control level ( G, I). This was further accompanied with unaltered mean firing rate (), a reduction in the percentage of random spikes () and a reduction in the CV () of the inter-network burst interval, indicating that the network pattern became more regular and mature, similar to control networks. This is also illustrated by canonical scores plots based on discriminant analyses for C1, CRISPR1 and CRISPR1 treated with apocynin (Figure S6A) and reclassification of group membership (Figure S6B).
Figure 5. Apocynin treatment rescues synaptic phenotype. (A) Representative images of 8-oxo-dG stainings and 8-oxo-dG quantification for untreated and APO treated iNeurons relative to respective untreated control cells at DIV21. n = 39 for C1; n = 46 for C1 + APO; n = 42 for KdVS1; n = 51 for KdVS1 + APO; n = 26 for CRISPR1; n = 25 for CRISPR1 + APO; n = 26 for C2; n = 25 for C2+ APO; n = 28 for KdVS2; n = 27 for KdVS2+ APO; n = 31 for KdVS3; n = 23 for KdVS3+ APO. Scale bar: 20 µm. (B) Representative images of SQSTM1 stainings of iNeurons at DIV21 and fluorescence quantification in untreated and APO treated iNeurons relative to untreated control cells at DIV21. n = 43 for C1; n = 34 for C1+ APO; n = 34 for KdVS1; n = 38 for KdVS1+ APO; n = 40 for CRISPR1; n = 39 for CRISPR1+ APO; n = 16 for C2; n = 19 for C2+ APO; n = 25 for KdVS2; n = 27 for KdVS2+ APO; n = 34 for KdVS3; n = 24 for KdVS3+ APO. Scale bar: 20 µm. (C) Representative images of dendrites stained for MAP2 and SYN1-SYN2 for C1, KdVS1 and CRISPR1 at DIV21 either untreated or APO treated and SYN1-SYN2 quantification. n = 11 for C1; n = 9 for C1+ APO; n = 12 for KdVS1; KdVS1+ APO; n = 10 for CRISPR1; CRISPR1+ APO; n = 7 for C2; C2+ APO; KdVS2; KdVS2+ APO; KdVS3, KdVS3+ APO. Scale bar: 20 µm. Two-way ANOVA was used to determine statistically significant changes. (D) Representative voltage clamp recordings at Vh = −60 mV showing sEPSCs at DIV21 with and without APO treatment during differentiation. (E) sEPSC frequency and (F) amplitude quantifications. n = 8 for C1; C1+ APO; n = 9 for KdVS1; KdVS1+ APO; n = 11 for CRISPR1; n = 8 for CRISPR1+ APO; n = 15 for C2; n = 14 for C2+ APO; n = 8 for KdVS2; n = 9 for KdVS2+ APO; n = 8 for KdVS3; KdVS3+ APO. (G) Representative raster plots for untreated C1 network and untreated and APO treated CRISPR1 network at DIV30 (3 min. of recording). Quantification of (H) mean firing rate, (I) network burst frequency, (J) percentage of random spikes, and (K) CV of inter-network burst interval. n = 15 for C1; n = 17 for C1 + APO; n = 16 for CRISPR1; n = 15 for CRISPR1 + APO. All data presented in this figure were generated in at least 2 independent experiments and statistically significant differences were tested through Kruskal-Wallis and Dunn’s multiple comparison test, if not mentioned differently. All samples were always compared to the respective untreated control; only significant differences were indicated. *P < 0.05, **P < 0.01, ***P < 0.005, ****P < 0.0001.
Impaired feedback-loop and decreased lysosomal activity in KdVS cells
Having established that KANSL1-deficiency results in increased oxidative stress causing elevated autophagosome formation and reduced synaptic activity, we wondered what causes the autophagosome accumulation in KANSL1-deficient cells. Increased autophagic flux is known to induce a regulatory feedback-loop in which induction of autophagy is coupled to a reduction in H4K16ac through downregulation of hMOF in MEF cells [Citation15]. However, we did not find a reduction in H4K16ac in KANSL1-deficient cells at the basal level. This led to the question, whether an impaired feedback-loop activation via the NSL complex is underlying the observed autophagosome accumulation.
To answer this question, we first examined at which step during autophagy signaling the negative feedback-loop is activated. After activation there are three main stages of autophagy: (i) the formation of initiation complexes, (ii) autophagosome formation and (iii) fusion with lysosomes. We pharmacologically inhibited the different stages within the autophagy pathway to identify which stage triggers the feedback-loop activation in control line C2. Blocking autophagosome formation with wortmannin, a PI3-kinase inhibitor, did not result in reduced H4K16ac after rapamycin treatment (). However, blocking lysosome fusion with bafilomycin A1 resulted in activation of the negative feedback-loop (), indicated by reduced levels of H4K16ac. This suggests that the formation of autophagosomes is the signal for the feedback-loop activation. In contrast to wild type cells, autophagosome accumulation in KANSL1-deficient cells did not result in reduced H4K16ac, pointing toward changes in NSL complex-mediated feedback-loop activation (). Although we did not observe reduced H4K16ac, we found increased MTOR phosphorylation () in KANSL1-deficient iPSCs, which might be part of a negative feedback-loop that is activated independently from KANSL1 and the NSL complex to prevent prolonged autophagy activation. These findings point toward a tightly controlled, balanced interaction between the different autophagy regulating mechanisms. Autophagosome formation induces independent signaling cascades to negatively regulate autophagy through, on the one hand, increased MTOR activity, and, on the other hand, reduced H4K16ac levels to repress ATG gene expression. In KANSL1-deficient cells autophagy regulation is out of balance; H4K16ac is not reduced, enabling prolonged ROS activated autophagy.
Figure 6. Feedback loop activation and reduced lysosomal activity. (A) Representative images of iPSCs treated with RAP and/or wortmannin (WRT) or bafilomycin A1 (BAF) stained for H4K16ac. Fluorescence was always normalized to untreated control samples. n = 29 for RAP/WRT treatments; n = 25 for RAP/BAF treatments. Two-way ANOVA and Tukey’s multiple comparison test were used to test for statistically significant differences. Scale bar: 50 µm. (B) Representative images of iPSC colonies of C1 and CRISPR1 untreated or treated with RAP for 10 min. 2 h after the treatment cells were fixed and stained for H4K16ac. n = 12 for C1; n = 15 for C1 + RAP; n = 10 for CRISPR1; n = 14 for CRISPR1 + RAP. Two-way ANOVA and Sidak’s multiple comparison test were used to determine statistically significant reductions. Scale bar: 50 µm. (C) Representative western blot for LAMP1 and LC3 after autophagy induction for 10 min by either RAP or BSO in control iPSCs. (D) LAMP1 protein level quantification and (E) LC3-II quantification relative to GAPDH. n = 6 for all conditions. Ordinary one-way ANOVA and Holm-Sidak’s multiple comparison test were used to test for statistically significant differences. (F) Representative images of LAMP1 stainings in control iPSCs treated with RAP or BSO for 10 min before fixation and particle analysis for LAMP1. n = 11 for all conditions. Scale bar: 50 µm. One-way ANOVA and Dunnett’s multiple comparison test were used to determine statistically significant differences. (G) Schematic representation of autophagy regulation showing the two different autophagy inducing pathways discussed (MTOR and ROS). NSL complex mediated feedback-loop is induced by autophagosome formation. At the same time MTOR phosphorylation is increased, which subsequently reduces lysosomal activity. (H) Representative images of iNeurons either untreated or RAP treated, stained for LC3 and H4K16ac. (I) H4K16ac fluorescence quantification. n = 16 for C1; n = 21 for C1+ RAP; n = 16 for KdVS1; n = 26 for KdVS1+ RAP; n = 12 for CRISPR1; n = 19 for CRISPR1+ RAP. (J) LC3 quantification. n = 13 for C1; n = 22 for C1+ RAP; n = 20 for KdVS1; n = 29 for KdVS1+ RAP; n = 12 for CRISPR1; n = 19 for CRISPR1+ RAP. Statistically significant changes were determined by means of two-way ANOVA and Sidak´s multiple comparison. (K) Representative images of three-week old neurons from C1, KdVS1 and CRISPR1 stained for MAP2 and LAMP1 and LAMP1 particle quantification. n = 43 for C1; n = 29 for KdVS1; n = 36 for CRISPR1. Results were normalized to control. Scale bar: 10 µm. One-way ANOVA and Dunnett’s multiple comparison test were used to determine significant differences for the number of particles. Differences in particle size were tested through Kruskal Wallis and Dunn’s multiple comparison test. Data presented in this figure were obtained in at least 2 independent experiments. *P < 0.05, **P < 0.01, ***P < 0.005, ****P < 0.0001.
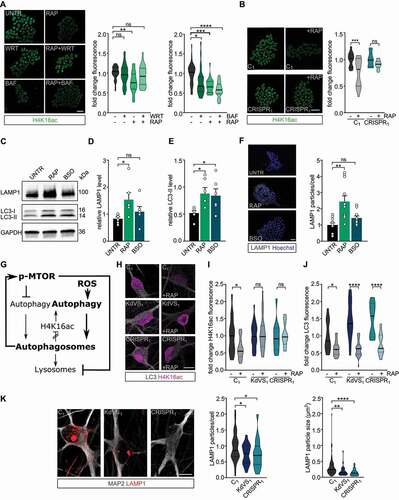
Since active MTOR signaling is known to decrease lysosomal activity [Citation60–62], we tested whether lysosomal activity might be affected by the imbalanced autophagy regulation in KANSL1-deficient cells. First, we quantified LAMP1, a lysosomal marker, in rapamycin-treated iPSCs by means of immunocytochemistry and western blot. We confirmed that MTOR-dependent autophagy activation increases autophagosome formation (, E) as well as lysosomal activity (–D, F) in control cells. BSO treatment, to activate ROS-induced autophagy, increased LC3-II levels comparable to rapamycin treatment (, E), whereas LAMP1 levels remained low (–D, F). Additionally, decreased ROS levels through apocynin treatment showed to reduce the p-MTOR:MTOR ratio and also increased LAMP1 levels in KANSL1 deficient iPSCs (Figure S7B-D). Together, our data thus suggest that increased ROS levels activate autophagy. Subsequently, autophagosome formation induces MTOR phosphorylation leading to reduced lysosomal activity which reinforces autophagosome accumulation in KANSL1-deficient cells (, ). To demonstrate the relevance of these findings also for iNeurons, we activated autophagy through rapamycin treatment in control and KANSL1-deficient three-week old iNeurons and measured H4K16ac levels and LC3 accumulation by means of ICC. Like in iPSCs, rapamycin treatment reduced LC3 levels in KANSL1-deficient iNeurons (, J). However, while this treatment significantly reduced H4K16ac levels in control cells, H4K16ac remained stable in KANSL1-deficient iNeurons (, I), pointing toward deregulated feedback-loop activation, also in KdVS iNeurons. Notably, the reduction in H4K16ac was independent of the autophagy induction protocol, since a similar decrease in H4K16ac was observed when iNeurons were stimulated with BSO in order to activate ROS-mediated autophagy [Citation63] (Figure S7A). Our results in iPSCs also point toward decreased lysosome activation, and, indeed, quantifying LAMP1 particles in KANSL1-deficient iNeurons indicated significantly lower lysosomal activity in these cells when compared to control iNeurons (). Taken together, our findings indicate imbalanced autophagy regulation in KdVS cells, independently from the cell type, which in KdVS iNeurons also results in impaired synaptic function.
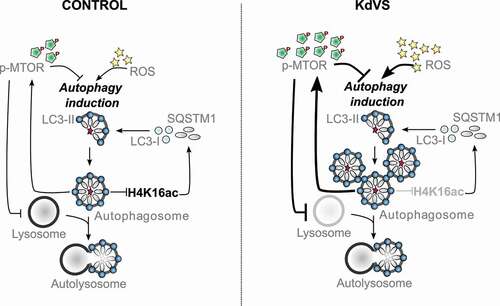
Figure 7. Autophagy regulation in control and KdVS cells. Schematic representation of autophagy regulating mechanisms. In control cells both, dephosphorylation of MTOR and increased ROS levels, induce autophagosome formation. Upon completion, autophagosomes induce negative feedback-loops. ATG gene expression is reduced through decreased H4K16ac levels, on the one hand. On the other hand, MTOR phosphorylation increases upon autophagosome accumulation to inhibit MTOR regulated autophagy, and subsequently reduces lysosomes. In KdVS cells prolonged oxidative stress induces autophagy, primarily MTOR independent. While H4K16ac is not reduced, enabling expression of ATG genes and continuous autophagosome formation, the accumulation of autophagosomes induces a reduction in MTOR activity, reducing lysosomal activity, and preventing autophagosomal clean-up. Aberrant feedback-loop activation in KdVS cells therefore causes an imbalance in oxidative stress versus MTOR activated autophagy reinforcing elevated autophagosome accumulation.
Discussion
In this study we used a human in vitro model for KdVS to examine the role for KANSL1 in autophagy regulation and to gain insight into how deregulated autophagy affects neuronal function. We found that KANSL1-deficiency leads to increased oxidative stress and autophagosome formation in iPSCs and iNeurons (). In neurons increased ROS activated autophagy showed to reduce neuronal synaptic connectivity and activity, revealed on single cell, as well as on network level. The observed neuronal phenotype could be rescued by treatment with apocynin, an antioxidant that reduced oxidative stress and autophagosome accumulation.
Imbalanced MTOR- and ROS-mediated autophagy in KdVS cells
Heterozygous loss of KANSL1 lead to imbalanced autophagy regulation in KANSL1-deficient iPSCs and neurons. On the one hand, we found increased ROS-mediated autophagy, and, on the other hand, we found reduced MTOR-mediated autophagy. Previous studies in neurons have mostly associated deregulated autophagy to increased or decreased activity of MTOR-regulated autophagy [Citation9,Citation38,Citation64]. Here, we show that the interplay between both autophagy pathways is essential for balanced autophagy regulation. Little is known about the interaction between the different autophagy pathways and how exactly the feedback-loop is controlled. It has been reported that upon autophagy induction, H4K16ac is downregulated in order to reduce ATG gene expression and prevent prolonged autophagy [Citation15]. Here, we provide more insight in this feedback-loop activation by showing that in control iPSCs acute autophagosome formation induces H4K16ac reduction within a couple of hours. In contrast, acute activation of autophagy in KANSL1-deficient cells did not result in a significant H4K16ac reduction. This is in line with our observation that ROS-mediated accumulation of autophagosomes in KANSL1-deficient cells (iPSCs and iNeurons) did not affect H4K16ac levels when compared to control cells. According to what is known about the role of H4K16ac in autophagy regulation, and especially in negative feedback-loop activation, this should eventually lead to cell death [Citation15]. However, we cultured KANSL1-deficient iNeurons for three weeks and longer without observing increased cell death. This indicates that there might be an additional feedback mechanism active that is inhibiting aspects of prolonged autophagy that would otherwise lead to cell death, independent from the NSL complex mediated feedback [Citation65]. We observed increased MTOR activity in KANSL1-deficient iPSCs, which we interpreted as possible feedback reaction to counteract hyperactive ROS-induced autophagy. Upon starvation induced autophagy, MTOR is first deactivated, but reactivated shortly after autophagic degradation, even during prolonged starvation. MTOR activation is known to inhibit the expression of lysosomal genes by phosphorylating the transcription factor TFEB and preventing its’ nuclear translocation [Citation61,Citation66,Citation67]. In a model for Gaucher’s disease, MTOR hyperactivity was shown to cause lysosomal dysfunction in neurons [Citation68]. Similarly, we found increased levels of active MTOR (p-MTOR) and reduced levels of the lysosomal marker LAMP1 in KANSL1-deficient iNeurons. This indicates that hyperactive ROS-mediated autophagosome formation potentially initiates a feedback-loop that increases MTOR activity which subsequently blocks lysosomal gene expression in KANSL1-deficient cells. Interestingly, valproic acid treatment, a histone deacetylase inhibitor, not only prevents H4K16ac downregulation after autophagy induction, but also increases autolysosome formation and causes cell death [Citation15]. Combining these findings with our observation that we did not observe increased cell death; we suggest that activation of MTOR in KANSL1-deficient cells is required to avoid prolonged lysosomal degradation and subsequent cell death. While our results show that rapamycin treatment can efficiently induce autophagosome clearance within a few hours, the interplay between oxidative stress- and MTOR-mediated autophagy indicate that long-term rapamycin treatment as a therapeutic strategy is questionable. Continuous over-activation of even two autophagy activating pathways in combination with lacking negative feedback, would probably lead to cell death in KANSL1 deficient cells. In contrast, we find that preventing ROS production with apocynin was sufficient to rescue the autophagy phenotypes. More importantly, apocynin was sufficient to rescue normal neuronal functioning, suggesting that increased ROS is causal to the autophagy phenotypes and at the core of KdVS pathophysiology.
Here, we mainly focused on oxidative stress as an MTOR independent autophagy activator, however, ROS has been shown to play a role in autophagy regulation via multiple signaling cascades [Citation69]. Amongst these, there are direct links between MTOR signaling and ROS [Citation70]. While some results point toward ROS activating MTOR signaling [Citation71,Citation72], others indicate that oxidative stress inhibits MTOR activity [Citation73,Citation74]. Furthermore, there is also a direct link between ROS and lysosomal activity [Citation75]. We show here that increased oxidative stress in BSO treated control cells significantly increases LC3-II levels within 10 min, while LAMP1 levels remain unaffected (–E). These results suggest that it is mainly ROS activated autophagy which drives the autophagy phenotype observed in KdVS. However, how exactly ROS regulate different aspects of autophagy and in how far this is relevant for the autophagy phenotype observed in our KdVS cellular model requires further investigation in the future.
Loss of function mutations in KANSL1 have unequivocally been associated with KdVS. More recently, two single nucleotide polymorphism in KANSL1 (Ile1085Thr and Ser718Pro) have been identified as risk factors for PD in a genome-wide association study [Citation76]. This is of interest since it is well established that both, oxidative stress and autophagy (and mitophagy) deficits, are strongly associated with Parkinson’s disease and other neurodegenerative disorders [Citation77–79]. Furthermore, it is widely accepted that ROS activate autophagy to restore cellular homeostasis as a cytoprotective feedback mechanism. Evidence from aging and neurodegenerative models indicate impaired neuronal function and ultimate neuronal cell death when this regulatory link is disturbed by either reduced autophagic flux, or elevated ROS formation exceeding capacity for cytoprotection [Citation80]. Our results provide additional evidence for the crucial link between ROS and autophagy for regulation of neuronal cell homeostasis and function, not only during neurodegeneration but also in the context of a neurodevelopmental disorder. Since the SNPs in KANSL1 identified in Parkinson’s disease genome-wide association studies are unlikely to lead to loss-of-function it will be of particular interest to investigate the functional consequences of these single nucleotide polymorphisms in autophagy.
ROS-induced autophagy regulates synaptic function
Whereas autophagy has been extensively studied in the context of neurodegenerative disorders, its’ role during neuronal development has remained understudied. Especially how MTOR-independent autophagy affects synaptic development and function is largely unknown. This is of relevance since we observe reduced synapse formation in neuronal cultures with increased oxidative stress levels (Figure S5D). Furthermore, it is known that levels of ROS, or more specifically superoxide, at the synapse play a crucial role in synaptic plasticity [Citation81]. On the one hand, local increase in superoxide levels upon neuronal stimulation showed to be essential to induce hippocampal long-term potentiation (LTP) [Citation82–84]. On the other hand, increased levels of superoxide contribute to age-related impairments in hippocampal LTP and memory [Citation85]. Our single-cell electrophysiology data showed reduced synaptic input, i.e., reduced sEPSC frequency. In addition, we observed a significantly reduced sEPSC amplitude pointing toward a reduction in functional AMPA receptors at the synapse. This indicates that chronic, ROS-induced autophagy might affect receptor distribution at the post-synaptic site. It is already known that chemical induction of long-term depression induces NMDAR-dependent autophagy through MTOR inhibition, resulting in AMPAR break down [Citation11]. These results further support the evidence that ROS-mediated autophagy is contributing to the regulation of synaptic plasticity. ROS-mediated changes during synaptic plasticity might occur through the activation of autophagy to induce synapse-specific break-down of synaptic proteins. More detailed investigation is, however, needed to understand how synaptic input- and target-specificity (e.g., AMPAR subunits) is achieved during autophagy at synapses in light of synaptic plasticity.
Taken together our findings establish a previously unrecognized link between H4K16ac, ROS-mediated autophagy, and synaptic dysfunction in KdVS. Future research should further examine the role of autophagy in neurodevelopment, focusing on the interplay between the different autophagy induction pathways and its fine-tuned regulation through epigenetic mechanisms. Finally, the application of antioxidants to re-balance autophagy and subsequently recover neuronal function provides an excellent starting point to develop more targeted therapeutic approaches for KdVS and potentially other neurodevelopmental disorders and even neurodegenerative disorders, like Parkinson disease.
Materials and methods
Patient information and iPSC line generation
In this study we used two control and three KdVS patient-derived iPSC lines (). All patients that were included in this study present the full spectrum of KdVS associated symptoms. KdVS1 [Citation19] and KdVS2 [Citation17,Citation86] originate from two individual, female KdVS patients with mutations in KANSL1, while the iPSC line KdVS3 originates from a female patient with a 17q microdeletion [Citation19,Citation87]. We used one independent female control lines (C2). Next to this control line we also used a parent control line for patient line KdVS1 (C1). C1 was also used for CRIPSR-Cas9 genomic engineering in order to create a KANSL1 mutated line with the same genetic background (CRISPR1). A 1-bp insertion in exon 2 resulted in a premature stop codon and heterozygous loss of KANSL1, highly similar to the patient lines KdVS1 and KdVS2.
All iPSCs used in this study were obtained from reprogrammed fibroblasts. KdVs1 and C1 were generated by making use of the SimpliconTM reprogramming kit (Millipore). Overexpression of the four factors POU5F1/OCT4, KLF4, SOX2, and GLIS1 was introduced by a non-integrative, non-viral one step transfection. KdVS2 was reprogrammed by lentiviral mediated overexpression of POU5F1, SOX2, KLF4, and MYC/cMyc. For KdVS3 episomal reprogramming was performed with the same reprogramming factors. C2 was generated from fibroblasts of a 36-year-old female control obtained from the Riken BRC – Cell engineering division (HPS0076:409B2). iPSC clones used in this study were validated through a battery of quality control tests including morphological assessment and karyotyping to confirm genetic integrity. All clones expressed the stem cell markers POU5F1, SOX2 NANOG, SSEA-4, and TRA-1-81 (see Figure S1A).
Genome editing by CRISPR-Cas9
We performed CRISPR-Cas9 genome editing on C1 following the protocol from Ran et al. [Citation88]. First sgRNA targeting exon 2 of KANSL1 was cloned into the targeting vector (pX459v2; Addgene, 62988; deposited by Feng Zhang). Successful cloning was validated by PCR. Single iPSCs were then nucleofected with the pX459v2 plasmid coding for the Cas9 protein and the sgRNA using P3 primary Cell 4D nucleofector kit (Lonza, V4XP-302). After nucleofection cells were plated on a 6-well plate in E8 flex medium (Gibco, A2858501) supplemented with RevitaCell (Gibco, A2644501).24 h after nucleofection medium was refreshed and supplemented with puromycin (1 µg/ml), RevitaCell was removed. After overnight incubation medium was refreshed with E8 flex to remove dead cells and stop the selection. The culture was maintained until colonies were large enough to be picked. By means of Sanger sequencing we checked for heterozygous loss-of-function mutations. Positive colonies were re-plated as single cells to ensure clonal expansion of iPSCs positive for the selected mutation. KANSL1 sgRNA oligos:
5ʹ- CACCGGAGCCCGTTTTCCCCCATTG-3ʹ;
3ʹ-CCTCGGGCAAAAGGGGGTAACCAAA-5ʹ
Generation of rtTA-NEUROG2-positive iPSCs
For the generation of rtTA-NEUROG2-positive iPSCs, lentiviral vectors were used to stably integrate transgenes into the genome of the iPSCs. The vector used for the rtTA lentivirus is pLVX-EF1α-(Tet-On-Advanced)-IRES-G418(R) (obtained from J. Ladewig), which encodes a Tet-On Advanced transactivator under control of a constitutive EEF1A/EF1α promoter and confers resistance to the antibiotic G418. The lentiviral vector for murine Neurog2 was pLVX-(TRE-tight)-(MOUSE)Ngn2-PGK-Puromycin(R) (obtained from J. Ladewig), encoding Neurog2 under control of a Tet-controlled promoter and the puromycin resistance gene under control of a constitutive PGK promoter. Both vectors were packaged into lentiviral particles using the packaging vectors psPAX2 lentiviral packaging vector (Addgene, 12260; deposited by Didier Trono) and pMD2.G lentiviral packaging vector (Addgene, 12259; deposited by Didier Trono). We infected our iPSC lines with both lentiviruses in order to ensure NEUROG2 expression when the medium was supplemented with doxycycline (Sigma-Aldrich, D9891). To select for iPSCs that were transduced with both vectors we started G418 (0.5 µg/ml; Sigma-Aldrich, 4727878001) and puromycin (0.1 ug/ml; Invivogen, ANT-PR-1) selection 48 h after infection. The antibiotics concentration was doubled at day two and three of the selection process. iPSCs surviving the selection process were cultured at general iPSC culture conditions (see below).
iPSC culture and drug treatment
iPSCs were always cultured on Matrigel (Corning, 356237) in E8 flex supplemented with primocin (0.1 µg/ml; Invivogen, ANT-PM-05) and low puromycin and G418 concentrations (0.5 µg/ml) at 37°C, 5% CO2. Medium was refreshed every 2–3 days and cells were passaged 1–2 times per week using an enzyme-free reagent (ReLeSR; Stem Cell Technologies, 05872). For autophagy induction cells were treated with 200 nM rapamycin (Santa Cruz Biotechnology, sc-3504) for 10 min, before medium was refreshed. To block autophagosome formation or lysosome fusion cells were treated with 200 nM wortmannin (Invivogen, tlrl-wtm) or bafilomycin A1 (Millipore, 19–148), respectively prior to rapamycin treatment. If not mentioned differently, cells were lysed/fixated after 2 h of incubation. For apocynin (Santa Cruz Biotechnology, sc-20332) rescue experiments iPSCs were plated as single cells. The day after plating the cells were treated for 24 h with 200 µM apocynin before cells were fixed. To stimulate ROS production cells were treated for 10 min with 100 µM BSO (Sigma-Aldrich, B2515). After medium was refreshed, cells were incubated for 2 h before lysate preparation or fixation.
Neuronal differentiation
iPSCs were directly derived into upper-layer, excitatory cortical neurons by doxycycline induced overexpression of Neurog2 according to an already published protocol (49). To start neuronal differentiation Accutase (Sigma-Aldrich, A6964) was applied to generate single cells. iPSCs were then plated onto MEAs (600 cells/mm2) or glass, nitric-acid treated coverslips (100 cells/mm2) in E8 basal medium (Gibco, A1517001) supplemented with primocin, RevitaCell, and doxycycline (4 µg/ml). MEA plates, as well as coverslips, were pre-coated with poly-L-ornithine (50 µg/mL; Sigma-Aldrich, P4957) for 3 h at 37°C and 20 µg/mL human LAM/laminin (Biolamina, L521,) overnight at 4°C. The day after plating medium was changed to DMEM-F12 (Gibco, 11320074) supplemented with N2 (Gibco, 17502048), NT3 (Promokine, D-66425), BDNF (Promokine, C-66212), MEM non-essential amino acid solution NEAA (Sigma-Aldrich, M7145), doxycycline (4 µg/ml), and primocin (0.1 µg/ml). To support neuronal maturation, freshly prepared rat astrocytes were added to the culture in a 1:1 ratio two days after plating. At DIV 3 the medium was changed to Neurobasal medium (Gibco, 21103049) supplemented with B-27 (Gibco, 17504044), glutaMAX (Gibco, 35050038), primocin (0.1 µg/ml), NT3, BDNF, and doxycycline (4 µg/ml). Cytosine β-D-arabinofuranoside (Ara-C) (2 µM; Sigma-Aldrich, C1768) was added once to remove proliferating cells from the culture. From DIV 6 onwards half of the medium was refreshed three times a week. Addition of doxycycline was stopped after two weeks to reduce stress. The medium was additionally supplemented with 2.5% FBS (Sigma-Aldrich, F2442) to support astrocyte viability from DIV10 onwards. Neuronal cultures were kept through the whole differentiation process at 37°C, 5%CO2. For rescue experiments cells were treated with 100 µM apocynin every other day when medium was not refreshed from DIV6 onwards.
Immunocytochemistry
Cells were fixed with 4% paraformaldehyde, 4% sucrose (v:v) and permeabilized with 0.2% Triton X-100 (Sigma-Aldrich, T8787) in PBS (Sigma-Aldrich, P5493) for 10 min. Aspecific binding sites were blocked by incubation in blocking buffer (PBS, 5% normal goat serum [Invitrogen, 10000 C], 5% normal horse serum [Gibco, 26050088], 5% normal donkey serum [Jackson Immuno Research, 017–000-121], 1% bovine serum albumin (Sigma-Aldrich, A7906), 1% glycine (Sigma-Aldrich, G5417), 0.2% Triton X-100 for 1 h at room temperature (RT). Primary antibodies were diluted in blocking buffer for overnight incubation at 4°C. Secondary antibodies, conjugated to Alexa Fluor-fluorochromes, were also diluted in blocking buffer and applied for 1 h at RT. Hoechst was used to stain the nucleus before cells were mounted using DAKO (DAKO, S3023) fluorescent mounting medium and stored at 4°C. Used primary antibodies were: rabbit anti-KANSL1 (1:500; Sigma-Aldrich, HPA006874); mouse anti-MAP2 (1:1000; Sigma-Aldrich, M4403); guinea pig anti-MAP2 (1:1000; Synaptic Systems, 188004); guinea pig anti-SYN1-SYN2 (1:1000; Synaptic Systems, 106004); rabbit anti-SYN1 (1:500; BioConnect, AB1543P); mouse anti-HOMER1 (1:500; Synaptic Systems, 160,011); rabbit anti-DLG4/PSD95 (1:50; Cell Signaling Technology, D27E11); mouse anti-pan axon (1:1000; Covance, SMI-312 R); rabbit anti-SQSTM1 (1:500; Sigma-Aldrich, P0067); mouse anti-LC3 (1:500; NanoTools, 0231–100/LC3-5 F10); rabbit anti-LAMP1 (1:200; Sigma-Aldrich, L1418-200ul); mouse anti-8-oxo-dG (1:100; R&D Systems, 4354-MC-050), rabbit anti-H4K16ac (1:400; Abcam, ab109463), rabbit anti-NANOG (1:100; Abcam, ab21624), mouse anti-SSEA4 (1:50; Abcam, ab16287), rabbit anti-POU5F1(1:250; Abcam, ab19857), mouse anti-TRA1-81 (1:100; Millipore, MAB4381) . Secondary antibodies that were used are: goat anti-guinea pig Alexa Fluor 647 (1:2000; Invitrogen, A-21450); goat anti-rabbit Alexa Fluor 488 (1:2000; Invitrogen, A-11034); goat anti-rabbit Alexa Fluor 568 (1:2000; Invitrogen, A-11036); goat anti-mouse Alexa Fluor 488 (1:2000; Invitrogen, A-11029); goat anti-mouse Alexa Fluor 568 (1:2000; Invitrogen, A-11031). Cells were imaged with the Zeiss Axio Imager 2 equipped with apotome. All conditions within a batch were acquired with the same settings in order to compare signal intensities between different experimental conditions. Signals were quantified using FIJI software. The number of synaptic puncta was quantified per individual cell via manual counting and divided by the dendritic length of the neuron. For SQSTM1 and LC3 puncta quantification the Particle Analyzer tool was used.
Oxidative stress quantification
To quantify oxidative stress/ROS we used either 8-oxo-dG stainings or CellROX® assays (Thermo Fisher Scientific, C10444). 8-oxo-dG is an oxidized derivative of deoxyguanosine, one of the major products of DNA oxidation. Quantifying 8-oxo-dG can therefore be used to measure oxidative stress levels. CellROX® Green Reagent is fluorogenic, cell-permeant dye which is weakly fluorescent in a reduced state and exhibits bright green photostable fluorescence upon oxidation by ROS. Quantifying fluorescence therefore is an indication for oxidative stress. For both assays, cells were prepared according to previously mentioned protocols. For 8-oxo-dG we performed ICC on PFA fixed cells with a specific antibody (R&D System, 4354-MC-050) to quantify DNA oxidation. For CellROX measurements we added the probe (5 µM) to living cells and incubated for 30 min before fixation. After fixation the cells were mounted with DAKO and imaged after overnight incubation within 24 h with the Zeiss Axio Imager 2 w/o apotome. Fluorescence was quantified using FIJI image software.
Seahorse mito stress test
Oxygen consumption rates (OCR) were measured using the Seahorse XFe96 Extracellular Flux analyzer (Seahorse Bioscience). iPSCs were seeded at a concentration of 10,000 per well in E8 basal medium supplemented with primocin, 10 µg/mL RevitaCell, and allowed to adhere at 37°C and 5% CO2. The day after plating RevitaCell was removed from the medium. One hour before measurement, culture medium was removed and replaced by Agilent Seahorse XF Base Medium (Agilent; 103334–100) supplemented with 10 mM glucose (Agilent, 103577–100), 1 mM sodium pyruvate (Gibco, 11360070), and 200 mM L-glutamine (Agilent, 103579–100) and incubated at 37°C without CO2. Basal oxygen consumption was measured six times followed by three measurements after each addition of 1 µM of oligomycin A (Sigma-Aldrich, 75351) 2 µM carbonyl cyanide 4-(trifluoromethoxy) phenylhydrazone FCCP (Sigma-Aldrich; C2920), and 0.5 µM of rotenone (Sigma-Aldrich, R8875) and 0.5 µM of antimycin A (Sigma-Aldrich, A8674). One measuring cycle consisted of 3 min of mixing, 3 min of waiting and 3 min of measuring. The OCR was normalized to citrate synthase activity, to correct for the mitochondrial content of the samples [Citation89]. The citrate synthase activity was measured according to the protocol described by Srere et al. [Citation90], modified for Seahorse 96 wells plates, as previously reported [Citation91]. In short, after completion of OCR measurements the Seahorse medium was replaced by 0.33% Triton X-100, 10 mM Tris-HCl, pH 7.6, after which the plates were stored at −80°C. Before measurements, the plates were thawed and 3 mM acetyl-CoA, 1 mM DTNB (Thermo Fisher Scientific, A8674), and 10% Triton X-100 was added. The background conversion of DTNB was measured spectrophotometrically at 412 nm and 37°C for 10 min at 1-min intervals, using a Tecan Spark spectrophotometer. Subsequently, the reaction was started by adding 10 mM of the citrate synthase substrate oxaloacetate, after which the ΔA412 nm was measured again for 10 min at 1-min intervals. The citrate synthase activity was calculated from the rate of DTNB conversion in the presence of oxaloacetate, subtracted by the background DTNB conversion rate, using an extinction coefficient of 0.0136 µmol-1. cm-1.
Neuronal morphology analysis
To examine dendritic morphology of neurons, cells on coverslips were stained for MAP2 after three weeks of differentiation. Neurons were imaged using an Axio Imager Z1 with 568 nm laser light and an Axiocam 506 mono and digitally reconstructed using Neurolucida 360 software (MBF–Bioscience, Williston, ND, USA). When cells were too large for one image, multiple images of these neurons were taken and subsequently stitched together using the stitching plugin of FIJI 2017 software. Only cells that had at least two dendritic branches had been selected for analysis. If the diameter of an extension of the soma was less than 50% of the diameter of the soma, it was an individual primary dendrite. If larger, the extension was evaluated to be made of two different primary dendrites. Axons were not considered in this analysis. For detailed morphological analysis different parameters were chosen to be considered: Branched structure analysis, soma size, number of nodes (dendritic branching points), number of dendrites, dendritic length and the mean length of all cells was conducted. Additionally, convex hull 3D analysis was performed, measuring the area of the dendritic field of a neuron. A net connecting the most distant parts of the neurons dendrites is formed, measuring the volume of the area. Since the pictures obtained were 2D, the convex hull parameter was divided by 2 for all tracings, resulting in a measurement of the surface area and not the full volume. Furthermore, Sholl analysis was performed to investigate dendritic complexity [Citation92]. Concentric circles are placed in certain, coherently large radii centered at the soma. The distance between two concentric circles forms a shell. The interval chosen for these shells was 10 µm. Within each shell, the number of intersections (the number of dendrites that cross each concentric circle), number of nodes and total dendritic length was calculated.
Western blot
For western blot cell lysates were made from iPSC cultures that were 80–90% confluent on a 6-well plate. Medium was always refreshed the day before. Drug treatments were applied as described earlier. To lyse the cells medium was removed and the well was washed with 2 ml ice cold PBS before 100 µl lysis buffer was applied (RIPA buffer [pH 7.5; 50 mM Tris-HCl (Invitrogen, 15567027), 150 mM NaCl (Sigma-Aldrich, S5886), 1 mM EDTA (Sigma-Aldrich, 03690), 1% Triton X-100], supplemented with PhosSTOP [Roche, 4906837001] and protease inhibitors [cOmplete Mini; Roche, 11,836,153,001]). Before blotting, the protein concentration was determined by means of a PierceTM BCA protein assay (Thermo Fisher Scientific, 23,227). For each sample the same amount of protein between 5–7.5 µg was loaded and separated by SDS-PAGE. Depending on the primary antibody separated proteins were transferred to nitrocellulose (Bio-Rad, 1704158) or, for LC3 probing (1:200; NanoTools, 0231–100/LC3-5F10), PVDF membrane (Bio-Rad, 1704156). Other primary antibodies that were used are: KANSL1 (1:500; Sigma-Aldrich, HPA006874), SQSTM1 (1:200; Sigma-Aldrich, p0067), SOD1 (1:1000; Abcam, ab13498), MTOR (1:1000; Cell Signaling Technology, 2972), p-MTOR (1:1000; Cell Signaling Technology, 2971), GAPDH (1:1000; Cell Signaling Technology, 2118), ULK1 (1:1000; Cell Signaling Technology, 8054), p-ULK1 (Ser757, 1:1000; Cell Signaling Technology, 14202), and LAMP1 (1:200; Sigma-Aldrich, L1418-200ul). For visualization horseradish peroxidase-conjugated secondary antibodies were used: Goat anti-mouse (1:20,000; Jackson ImmunoResearch Laboratories, 115–035-062), and goat anti-rabbit (1:20,000; Invitrogen, G21234).
Quantitative polymerase chain reaction
RNA samples were isolated from iPSCs using the NucleoSpin RNA isolation kit (Machery Nagel, 740955) according to the manufactures’ instructions. cDNAs were synthesized by iScript cDNA synthesis kit (Bio-Rad, 1708890) and cleaned up using the Nucleospin Gel and PCR clean-up kit (Machery Nagel, 740609). Human specific primers were designed with help of the Primer3plus tool (http://www.bioinformatics.nl/cgi-bin/primer3plus/primer3plus.cgi) (see Table S1). PCR reactions were performed in the 7500 Fast Real Time PCR System apparatus (Applied Biosystems) by using GoTaq qPCR master mix 2x with SYBR Green (Promega, A6002) according to the manufacturer’s protocol. All samples were analyzed in triple in the same run and placed in adjacent wells. Reverse transcriptase-negative controls and no template-controls were included in all runs. The arithmetic mean of the Ct values of the technical replicates was used for calculations. Relative mRNA expression levels for all genes of interest were calculated using the 2^-ΔΔCt method with standardization to PPIA (Peptidylprolyl Isomerase A) expression level. All expression analyses were done for three different biological replicates in three independent experiments.
Micro-electrode array recordings and analysis
Recordings of the spontaneous activity of iPSCs-derived neuronal networks were performed at DIV 30 using the 24-well MEA system (Multichannel Systems, MCS GmbH, Reutlingen, Germany). Each well embedded with 12 electrodes, 80 µm in diameter and spaced 300 µm apart). Spontaneous electrophysiological activity of iPSC-derived neuronal network was recorded for 10 min. During the recording, the temperature was maintained constant at 37°C, and the evaporation and pH changes of the medium was prevented by inflating a constant, slow flow of humidified gas (5% CO2, 20% O2, 75% N2) onto the MEA. The signal was sampled at 10 kHz, filtered with a high-pass filter (i.e. butterworth, 100 Hz cutoff frequency). The noise threshold was set at ±4.5 standard deviations. Data analysis was performed off-line by using Multiwell Analyzer, software from the Multiwell MEA system that allows the extraction of the spike trains and parameters describing the network activity. The mean firing rate (MFR) of the network was calculated by computing the firing rate of each channel averaged among all the active electrodes of the MEA (MFR>0.1 Hz). Burst detection. The algorithm defines bursts with a maximum of 50 ms inter spike interval (ISI) to start a burst, and a maximum of 50 ms ISI to end a burst, with a minimum of 100 ms interburst interval (IBI). The percentage of random spikes (PRS) was defined by calculating the percentage of spikes not belonging to a burst for each channel and averaging among all the active electrodes of the MEA. For Network burst detection we were looking for sequences of closely-spaced single-channels bursts. A network burst was identified if it involved at least the 80% of the network active channels. Irregularity was estimated by computing the CV of the network burst interburst interval, which is the standard deviation divided by the mean of the network burst interburst interval. Discriminant function analysis with canonical discriminant functions based on parameters describing neuronal network activity were performed in SPSS.
Single cell electrophysiology recordings and analysis
For recording spontaneous action potential-evoked postsynaptic currents (sEPSC) we used neurons derived from C1, KdVS1 and CRISPR1 after three weeks of differentiation. Experiments were performed in a recording chamber on the stage of an Olympus BX51WI upright microscope (Olympus Life Science, PA, USA) equipped with infrared differential interference contrast optics, an Olympus LUMPlanFL N 60x water-immersion objective (Olympus Life Science, PA, USA) and kappa MXC 200 camera system (Kappa optronics GmbH, Gleichen, Germany) for visualization. We performed the recordings of neurons cultured on cover slips under continuous perfusion with oxygenated (95% O2, 5% CO2) artificial cerebrospinal fluid (ACSF; 124 mM NaCl, 1.25 mM NaH2PO4 (Sigma-Aldrich, S9638), 3 mM KCl (Merck, 104936), 26 mM NaHCO3 (Merck, 106329), 11 mM glucose, 2 mM CaCl2 (Sigma-Aldrich, 223506), 1 mM MgCl2 (Sigma-Aldrich, M9272); pH 7.4) at 30°C. Patch pipettes (6–8 MΩ) were pulled from borosilicate glass with filament and fire-polished ends (Science Products GmbH, GB150F-8P) using the PMP-102 micropipette puller (MicroData Instrument, NJ, USA). SEPSCs recordings were performed in voltage clamp mode, pipettes were filled with a cesium-based solution containing 115 mM CsMeSO3 (Sigma-Aldrich, C1426), 20 mM CsCl (Sigma-Aldrich, C3139), 10 mM HEPES (Sigma-Aldrich, H4034) 2.5 mM MgCl2, 4 mM Na2-ATP (Sigma-Aldrich, A2383), 0.4 mM Na3-GTP (Sigma-Aldrich, G8877), 10 mM Na-phospho-creatine (Sigma-Aldrich, P7936), 0.6 EGTA (adjusted to pH 7.2 and osmolarity 304 mOsmol). Spontaneous action potential-evoked postsynaptic currents (sEPSC) were recorded in ACSF without additional drugs at a holding potential of −60 mV. All recordings were acquired using a Digidata 1140A digitizer and a Multiclamp 700B amplifier (Molecular Devices, Wokingham, United Kingdom), with a sampling rate set at 20 kHz and a lowpass 1 kHz filter during recording. Recordings were not analyzed if series resistance was above 20 MΩ or when the recording reached below a 10:0 ratio of membrane resistance to series resistance. SEPSCs were analyzed using MiniAnalysis (Synaptosoft Inc). For the traces that contained strongly accumulated sEPSCs mediated by presynaptic synchronized bursts of action potentials, these bursts of sEPSCs were counted by visual inspection.
Statistics
The statistical analysis of the data was performed using GraphPad Prism 8 (GraphPad Software, Inc., CA, USA). We first determined whether data were normally distributed. We tested statistical significance for different experimental conditions by one-way ANOVA or two-way ANOVA when different cell-lines and drug-treated samples were included. Individual samples were compared using Sidak’s or Dunnett’s multiple comparisons test. When only two conditions were compared, we used unpaired t test. When data were not normally distributed, we applied Kruskal-Wallis test combined with Dunn’s or Sidak’s multiple comparison test. Results with P values lower than 0.05 were considered as significantly different (*), P < 0.01 (**), P < 0.001 (***), P < 0.0001 (****). Data is shown in violin plots or as mean and standard error of the mean (SE) in bar diagrams. Details about statistics are reported in the Supplementary Data File S1.
Supplemental Material
Download Zip (71.8 MB)Disclosure statement
No potential conflict of interest was reported by the author(s).
Supplementary material
Supplemental data for this article can be accessed here
Additional information
Funding
Related Research Data
References
- Liang Y. Emerging concepts and functions of autophagy as a regulator of synaptic components and plasticity. Cells. 2019 Jan 9;8(1):34.
- Vijayan V, Verstreken P. Autophagy in the presynaptic compartment in health and disease. J Cell Biol. 2017;216(7):1895–1906.
- Hwang JY, Yan J, Zukin RS. Autophagy and synaptic plasticity: epigenetic regulation. Curr Opin Neurobiol. 2019 Dec;59:207–212.
- Menzies FM, Fleming A, Rubinsztein DC. Compromised autophagy and neurodegenerative diseases. Nat Rev Neurosci. 2015 Jun;16(6):345–357.
- Guo F, Liu X, Cai H, et al. Autophagy in neurodegenerative diseases: pathogenesis and therapy. Brain Pathol. 2018 Jan;28(1):3–13. .
- Wong YC, Holzbaur ELF. Autophagosome dynamics in neurodegeneration at a glance. J Cell Sci. 2015 Apr 1;128(7):1259LP– 1267.
- Malik BR, Maddison DC, Smith GA, et al. Autophagic and endo-lysosomal dysfunction in neurodegenerative disease. Mol Brain. 2019;12(1):100.
- Stamatakou E, Wróbel L, Hill SM, et al. Mendelian neurodegenerative disease genes involved in autophagy. Cell Discov. 2020;6(1):24. .
- Tang G, Gudsnuk K, Kuo SH, et al. Loss of mTOR-dependent macroautophagy causes autistic-like synaptic pruning deficits. Neuron. 2014 Sep 3;83(5):1131–1143.
- Reimer RJ, Schneider K, Leal-Ortiz S, et al. Bassoon controls presynaptic autophagy through Atg5. Neuron. 2017 Feb 22;93(4):897–913.e7.
- Shehata M, Matsumura H, Okubo-Suzuki R, et al. Neuronal stimulation induces autophagy in hippocampal neurons that is involved in AMPA receptor degradation after chemical long-term depression. J Neurosci. 2012 Jul 25;32(30):10413–10422.
- Rowland AM, Richmond JE, Olsen JG, et al. Presynaptic terminals independently regulate synaptic clustering and autophagy of GABAA receptors in Caenorhabditis elegans. J Neurosci. 2006 Feb 8;26(6):1711–1720.
- Artal-martinez De Narvajas A, Gomez TS, Zhang J-S, et al. Epigenetic regulation of autophagy by the methyltransferase G9a. Mol Cell Biol. 2013 Oct;33(20):3983–3993. .
- Wei FZ, Cao Z, Wang X, et al. Epigenetic regulation of autophagy by the methyltransferase EZH2 through an MTOR-dependent pathway. Autophagy. 2015;11(12):2309–2322.
- Füllgrabe J, Lynch-Day MA, Heldring N, et al. The histone H4 lysine 16 acetyltransferase hMOF regulates the outcome of autophagy. Nature. 2013 Aug 22;500(7463):468–471.
- Dias J, Van Nguyen N, Georgiev P, et al. Structural analysis of the KANSL1/WDR5/KANSL2 complex reveals that WDR5 is required for efficient assembly and chromatin targeting of the NSL complex. Genes Dev. 2014 May 1;28(9):929–942.
- Zollino M, Orteschi D, Murdolo M, et al. Mutations in KANSL1 cause the 17q21.31 microdeletion syndrome phenotype. Nat Genet. 2012;44(6):636–638.
- Koolen DA, Kramer JM, Neveling K, et al. Mutations in the chromatin modifier gene KANSL1 cause the 17q21.31 microdeletion syndrome. Nat Genet. 2012;44(6):639–641.
- Koolen DA, Pfundt R, Linda K, et al. The Koolen-de Vries syndrome: a phenotypic comparison of patients with a 17q21.31 microdeletion versus a KANSL1 sequence variant. Eur J Hum Genet. 2016;24(5):652–659.
- Meunier S, Shvedunova M, Van Nguyen N, et al. An epigenetic regulator emerges as microtubule minus-end binding and stabilizing factor in mitosis. Nat Commun. 2015;6(1):7889.
- Chatterjee A, Seyfferth J, Lucci J, et al. MOF acetyl transferase regulates transcription and respiration in mitochondria. Cell. 2016 Oct 20;167(3):722–738.e23.
- Arbogast T, Iacono G, Chevalier C, et al. Mouse models of 17q21.31 microdeletion and microduplication syndromes highlight the importance of Kansl1 for cognition. PLoS Genet. 2017;13:7.
- Ravens S, Fournier M, Ye T, et al. Mof-associated complexes have overlapping and unique roles in regulating pluripotency in embryonic stem cells and during differentiation. Elife. 2014 Jun;4(3):e02104.
- Rubinsztein DC, Cuervo AM, Ravikumar B, et al. In search of an “autophagomometer”. Autophagy. 2009.5(5):585–589.
- Klionsky DJ, Abdalla FC, Abeliovich H, et al. Guidelines for the use and interpretation of assays for monitoring autophagy. Autophagy. 2012 Apr;8(4):445–544.
- Kabeya Y, Mizushima N, Ueno T, et al. LC3, a mammalian homologue of yeast Apg8p, is localized in autophagosome membranes after processing. EMBO J. 2000 Nov;19(21):5720–5728.
- Dooley HC, Razi M, Polson HEJ, et al. WIPI2 links LC3 conjugation with PI3P, autophagosome formation, and pathogen clearance by recruiting Atg12. Mol Cell. 2014 Jul 17;55(2):238–252.
- Lippai M, Lőw P. The role of the selective adaptor p62 and ubiquitin-like proteins in autophagy. Biomed Res Int. 2014 06 12;2014:832704.
- Glick D, Barth S, Macleod KF. Autophagy: cellular and molecular mechanisms. J Pathol. 2010 May;221(1):3–12.
- Klionsky DJ, Schulman BA. Dynamic regulation of macroautophagy by distinctive ubiquitin-like proteins. Nat Struct Mol Biol. 2014 Apr;21(4):336–345.
- Rabanal-Ruiz Y, Otten EG, Korolchuk VI. mTORC1 as the main gateway to autophagy. Essays Biochem. 2017 Dec 12;61(6):565–584.
- Jung CH, Jun CB, Ro S-H, et al. ULK-Atg13-FIP200 complexes mediate mTOR signaling to the autophagy machinery. Mol Biol Cell. 2009 Apr;20(7):1992–2003.
- Kim J, Kundu M, Viollet B, et al. AMPK and mTOR regulate autophagy through direct phosphorylation of Ulk1. Nat Cell Biol. 2011 Feb;13(2):132–141.
- Kimura S, Noda T, Yoshimori T. Dissection of the autophagosome maturation process by a novel reporter protein, tandem fluorescent-tagged LC3. Autophagy. 2007 Sep 20;3(5):452–460.
- Leeman DS, Hebestreit K, Ruetz T, et al. Lysosome activation clears aggregates and enhances quiescent neural stem cell activation during aging. Science. 2018 Mar 16;359(6381):1277LP– 1283.
- Lipinski MM, Zheng B, Lu T, et al. Genome-wide analysis reveals mechanisms modulating autophagy in normal brain aging and in Alzheimer’s disease. Proc Natl Acad Sci U S A. 2010 Aug 10;107(32):14164–14169.
- Lee K-M, Hwang S-K, Lee J-A. Neuronal autophagy and neurodevelopmental disorders. Exp Neurobiol. 2013 09 30;22(3):133–142.
- Wataya-Kaneda M. Mammalian target of rapamycin and tuberous sclerosis complex. J Dermatol Sci. 2015 Aug;79(2):93–100.
- Kim HJ, Cho MH, Shim WH, et al. Deficient autophagy in microglia impairs synaptic pruning and causes social behavioral defects. Mol Psychiatry. 2017 Nov;22(11):1576–1584.
- Giordano S, Darley-Usmar V, Zhang J. Autophagy as an essential cellular antioxidant pathway in neurodegenerative disease. Redox Biol. 2013 Dec;25(2):82–90.
- Fujikake N, Shin M, Shimizu S. Association between autophagy and neurodegenerative diseases. Front Neurosci. 2018 May;22(12):255.
- Nixon RA. The role of autophagy in neurodegenerative disease. Nat Med. 2013 Aug;19(8):983–997.
- Zhu Z, Yang C, Iyaswamy A, et al. Balancing mTOR signaling and autophagy in the treatment of Parkinson’s disease. Int J Mol Sci. 2019 Feb 8;20(3):728.
- Valenzuela V, Nassif M, Hetz C. Unraveling the role of motoneuron autophagy in ALS. Autophagy. 2018;14(4):733–737.
- Ramesh N, Pandey UB. Autophagy dysregulation in ALS: when protein aggregates get out of hand. Front Mol Neurosci. 2017 Aug;22(10):263.
- Kaur SJ, McKeown SR, Rashid S. Mutant SOD1 mediated pathogenesis of amyotrophic lateral sclerosis. Gene. 2016;577(2):109–118.
- Lieberman OJ, Sulzer D. The synaptic autophagy cycle. J Mol Biol. 2020;432(8):2589–2604.
- Ban B-K, Jun M-H, Ryu -H-H, et al. Autophagy negatively regulates early axon growth in cortical neurons. Mol Cell Biol. 2013 08 05;33(19):3907–3919.
- Frega M, van Gestel SHC, Linda K, et al. Rapid neuronal differentiation of induced pluripotent stem cells for measuring network activity on micro-electrode arrays. J Vis Exp. 2017:119. DOI:https://doi.org/10.3791/54900
- Zhang Y, Pak CH, Han Y, et al. Rapid single-step induction of functional neurons from human pluripotent stem cells. Neuron. 2013;78(5):785–798.
- Massaad CA, Klann E. Reactive oxygen species in the regulation of synaptic plasticity and memory. Antioxid Redox Signal. 2011 May 15;14(10):2013–2054.
- Quarta E, Bravi R, Scambi I, et al. Increased anxiety-like behavior and selective learning impairments are concomitant to loss of hippocampal interneurons in the presymptomatic SOD1(G93A) ALS mouse model. J Comp Neurol. 2015 Aug 1;523(11):1622–1638.
- Fogarty MJ, Klenowski PM, Lee JD, et al. Cortical synaptic and dendritic spine abnormalities in a presymptomatic TDP-43 model of amyotrophic lateral sclerosis. Sci Rep. 2016 Nov 29;6:37968.
- Fishman I, Keown CL, Lincoln AJ, et al. Atypical cross talk between mentalizing and mirror neuron networks in autism spectrum disorder. JAMA Psychiatry. 2014 Jul;71(7):751–760.
- Hernandez LM, Rudie JD, Green SA, et al. Neural signatures of autism spectrum disorders: insights into brain network dynamics. Neuropsychopharmacology. 2015 Jan [cited 2014 Jul 11];40(1):171–189.
- Watanabe T, Rees G. Brain network dynamics in high-functioning individuals with autism. Nat Commun. 2017;8(1):16048.
- Frega M, Linda K, Keller JM, et al. Neuronal network dysfunction in a model for Kleefstra syndrome mediated by enhanced NMDAR signaling. Nat Commun. 2019 Oct 30;10(1):4928.
- Frega M, Selten M, Mossink B, et al. Distinct pathogenic genes causing intellectual disability and autism exhibit a common neuronal network hyperactivity phenotype. Cell Rep. 2020;30(1):173–186.e6.
- Lanillos P, Oliva D, Philippsen A, et al. A review on neural network models of schizophrenia and autism spectrum disorder. Neural Networks. 2020;122:338–363.
- Roczniak-Ferguson A, Petit CS, Froehlich F, et al. The transcription factor TFEB links mTORC1 signaling to transcriptional control of lysosome homeostasis. Sci Signal. 2012 Jun 12;5(228):ra42.
- Settembre C, Zoncu R, Medina DL, et al. A lysosome-to-nucleus signalling mechanism senses and regulates the lysosome via mTOR and TFEB. EMBO J. 2012 Mar 7;31(5):1095–1108.
- Civiletto G, Dogan SA, Cerutti R, et al. Rapamycin rescues mitochondrial myopathy via coordinated activation of autophagy and lysosomal biogenesis. EMBO Mol Med. 2018 Nov;10(11):e8799.
- Sun Y, Zheng Y, Wang C, et al. Glutathione depletion induces ferroptosis, autophagy, and premature cell senescence in retinal pigment epithelial cells. Cell Death Dis. 2018 Jul 9;9(7):753.
- Crino PB. The mTOR signalling cascade: paving new roads to cure neurological disease. Nat Rev Neurol. 2016 Jul;12(7):379–392.
- Yu L, McPhee CK, Zheng L, et al. Termination of autophagy and reformation of lysosomes regulated by mTOR. Nature. 2010 Jun 17;465(7300):942–946.
- Settembre C, Di MC, Polito VA, et al. TFEB links autophagy to lysosomal biogenesis. Science. 2011 Jun 17;332(6036):1429–1433.
- Napolitano G, Esposito A, Choi H, et al. mTOR-dependent phosphorylation controls TFEB nuclear export. Nat Commun. 2018 Aug 17;9(1):3312.
- Brown RA, Voit A, Srikanth MP, et al. MTOR hyperactivity mediates lysosomal dysfunction in Gaucher’s disease iPSC-neuronal cells. Dis Model Mech. 2019 Oct 16;12(10):dmm038596.
- Li L, Tan J, Miao Y, et al. ROS and autophagy: interactions and molecular regulatory mechanisms. Cell Mol Neurobiol. 2015;35(5):615–621.
- Li M, Zhao L, Liu J, et al. Multi-mechanisms are involved in reactive oxygen species regulation of mTORC1 signaling. Cell Signal. 2010 Oct;22(10):1469–1476.
- Yalcin S, Marinkovic D, Mungamuri SK, et al. ROS-mediated amplification of AKT/mTOR signalling pathway leads to myeloproliferative syndrome in Foxo3−/− mice. EMBO J. 2010 Dec 15;29(24):4118–4131.
- Kim J-H, Choi TG, Park S, et al. Mitochondrial ROS-derived PTEN oxidation activates PI3K pathway for mTOR-induced myogenic autophagy. Cell Death Differ. 2018 Nov;25(11):1921–1937.
- Zhang J, Kim J, Alexander A, et al. A tuberous sclerosis complex signalling node at the peroxisome regulates mTORC1 and autophagy in response to ROS. Nat Cell Biol. 2013;15(10):1186–1196.
- Wang X, Fu Y-F, Liu X, et al. ROS promote Ox-LDL-induced platelet activation by up-regulating autophagy through the inhibition of the PI3K/AKT/mTOR pathway. Cell Physiol Biochem Int J Exp Cell Physiol Biochem Pharmacol. 2018;50(5):1779–1793.
- Zhang X, Cheng X, Yu L, et al. MCOLN1 is a ROS sensor in lysosomes that regulates autophagy. Nat Commun. 2016 Jun;7:12109.
- Chang D, Nalls MA, Hallgrímsdóttir IB, et al. A meta-analysis of genome-wide association studies identifies 17 new Parkinson’s disease risk loci. Nat Genet. 2017 Oct;49(10):1511–1516.
- Beal MF. Mitochondrial dysfunction and oxidative damage in Alzheimer’s and Parkinson’s diseases and coenzyme Q 10 as a potential treatment. J Bioenerg Biomembr. 2004 Aug;36(4):381–386.
- Dias V, Junn E, Mouradian MM. The role of oxidative stress in parkinson’s disease. J Parkinsons Dis. 2013;3(4):461–491.
- Wei Z, Li X, Li X, et al. Oxidative stress in Parkinson’s disease: a systematic review and meta-analysis. Front Mol Neurosci. 2018 Jul;5(11):236.
- Sedlackova L, Kelly G, Korolchuk VI. The pROS of autophagy in neuronal health. J Mol Biol. 2020 Apr 3;432(8):2546–2559.
- Beckhauser TF, Francis-Oliveira J, De Pasquale R. Reactive oxygen species: physiological and physiopathological effects on synaptic plasticity. J Exp Neurosci. 2016 Sep 4;10(Suppl 1):23–48.
- Klann E. Cell-permeable scavengers of superoxide prevent long-term potentiation in hippocampal area CA1. J Neurophysiol. 1998 Jul;80(1):452–457.
- Thiels E, Urban NN, Gonzalez-Burgos GR, et al. Impairment of long-term potentiation and associative memory in mice that overexpress extracellular superoxide dismutase. J Neurosci. 2000 Oct 15;20(20):7631–7639.
- Knapp LT, Klann E. Potentiation of hippocampal synaptic transmission by superoxide requires the oxidative activation of protein kinase C. J Neurosci. 2002 Feb 1;22(3):674–683.
- Hu D, Serrano F, Oury TD, et al. Aging-dependent alterations in synaptic pl7asticity and memory in mice that overexpress extracellular superoxide dismutase. J Neurosci. 2006 Apr 12;26(15):3933–3941.
- Keen C, Samango-Sprouse C, Dubbs H, et al. 10-year-old female with intragenic KANSL1 mutation, no KANSL1-related intellectual disability, and preserved verbal intelligence. Am J Med Genet A. 2017 Mar;173(3):762–765. .
- Maley AM, Spraker MK, De Vries BBA, et al. Vitiligo in the Koolen-de Vries or 17q21.31 microdeletion syndrome. Clin Dysmorphol. 2015 Apr;24(2):86–87. .
- Ran FA, Hsu PD, Wright J, et al. Genome engineering using the CRISPR-Cas9 system. Nat Protoc. 2013;8(11):2281–2308. .
- Rodenburg RJT. Biochemical diagnosis of mitochondrial disorders. J Inherit Metab Dis. 2011 Apr;34(2):283–292.
- Srere PABT-M. Citrate synthase: [EC 4.1.3.7. Citrate oxaloacetate-lyase (CoA-acetylating)]. Methods in enzymology 1969;. 3:3–11.
- Klein Gunnewiek TM, Van Hugte EJH, Frega M, et al. m.3243A > G-induced mitochondrial dysfunction impairs human neuronal development and reduces neuronal network activity and synchronicity. Cell Rep. 2020;31(3):107538.
- Da SHOLL. Dendritic organization in the neurons of the visual and motor cortices of the cat. J Anat. 1953 Oct;87(4):387–406.