
ABSTRACT
Organelle-specific autophagy directs degradation of eukaryotic organelles under certain conditions. Like other organelles, peroxisomes are subject to autophagic turnover at lysosomes. However, peroxisome autophagy (pexophagy) has yet to be analyzed in a live-animal system, limiting knowledge on its regulation during an animal’s life. Here, we generated a tandem-fluorophore reporter that enabled real-time tracking of pexophagy in live Caenorhabditis elegans. We observed that pexophagy occurred at a population of non-canonical, tubular lysosomes specifically during starvation and aging. Remarkably, in these contexts, tubular lysosomes were the predominant type of lysosome in the intestine, transforming from vesicles. Though we found that peroxisomes were largely eliminated in early adulthood, they appeared restored in new generations. We identified peroxisomal genes that regulated age-dependent peroxisome loss and demonstrated that modifying this process altered animal lifespan. These findings reveal new facets of peroxisome homeostasis relevant to aging and challenge the prevailing perception of lysosome homogeneity in autophagy.
Abbreviations: GFP: green fluorescent protein; SKL: serine-lysine-leucine peroxisome signal sequence; spin: spinster; TLs: tubular lysosomes
Introduction
Eukaryotic cells contain a number of membrane-bound organelles that carry out specialized functions. The peroxisome, as its name implies, oversees hydrogen-peroxide metabolism. It generates hydrogen peroxide as a by-product of its oxidative reactions, but its resident enzyme, catalase, breaks down hydrogen peroxide to prevent toxicity [Citation1,Citation2]. In addition to this role in cellular detoxification, peroxisomes act as cellular hubs for lipid oxidation [Citation3]. These important functions make the peroxisome a key determinant of animal health and disease; in humans, peroxisome dysfunction often leads to severe metabolic disorders [Citation2,4]. Understanding how peroxisomes are regulated during the course of an animal’s life may therefore provide insight into the mechanisms by which this organelle ultimately determines the health of an individual.
Peroxisome homeostasis entails a fine balance between peroxisome biogenesis and destruction. It is well-accepted that peroxisomes can form de novo [Citation2,Citation5]. However, the other side of this balance is more mysterious: how does peroxisome degradation occur, and under what conditions? Similar to other organelles, peroxisomes can be destroyed at lysosomes via macroautophagy/autophagy [Citation6]. Yet, the regulation of peroxisome autophagy (pexophagy) has only been studied in yeasts, plants, and cell culture [Citation7,Citation8], and never in a live, intact animal. This has prevented analysis of the dynamics of this process in a complex animal system, particularly across the lifespan of an individual.
Researchers can utilize tandem red-green fluorophores to track autophagy inside of living cells [Citation9]. This is because red (mCherry) and green (green fluorescent protein; GFP) fluorophores respond differently to changes in pH. Both mCherry and GFP fluoresce normally in the neutral cytosol, but GFP fluorescence is specifically quenched inside the lysosome [Citation9], which is acidic [Citation10]. Consequently, cargo tagged with this tandem reporter will fluoresce both red and green in the cytosol but will fluoresce only red upon entering the lysosomal lumen (). Corresponding shifts in fluorescence are commonly observed in situations where autophagy is induced, such as during starvation [Citation9]. Previously, a tandem-fluorophore approach was applied to track the autophagic turnover of mitochondria in live C. elegans [Citation11]. Interestingly, it was reported that mitophagy naturally decreases as C. elegans age [Citation11], contributing to a buildup of dysfunctional mitochondria in older animals [Citation6,Citation12]. How autophagy of other organelles, including the peroxisome, is affected by the aging process in animals is largely unknown. A logical expectation is that many organelles may accumulate with age, due to an age-dependent decrease in lysosome function [Citation13,Citation14]. But, if distinct forms of organelle-specific autophagy were to be triggered in early aging, before lysosomes become dysfunctional, the opposite could instead be true. Altering rates of organelle-specific autophagy during aging could provide one mechanism to extend or shorten animal lifespan [Citation6].
Figure 1. mCherry-GFP-SKL localizes to catalase-positive intestinal peroxisomes, which are turned over during starvation at tubular structures. (A) Schematic of the mCherry-GFP-SKL sensor. Green, but not red, fluorescence is quenched inside acidic lysosomes during pexophagy. (B) Colocalization of green and red fluorescent puncta in mCherry-gfp-skl embryos. Embryonic intestines are outlined by dotted white lines. Colocalization of green and red puncta was visually verified for n = 171 embryos. (C) Manders’ overlap coefficient for the red channel relative to the green channel in mCherry-gfp-skl embryos (n = 25), fed L1 animals (n = 25), and starved L1 animals (n = 25). Mean ± SD. ****, p < 0.0001, one-way ANOVA. (D) Localization of tagBFP2::CTL-2 at fluorescent puncta marked by mCherry-GFP-SKL. (E and F) Green and red fluorescence in fed and starved mCherry-gfp-skl L1 larval animals. (G) Red fluorescence in fed and starved mCherry-gfp-skl L1 larval animals, with corresponding skeleton images. (H) Quantification of average red-fluorescent object length in fed (n = 25) and starved (n = 25) mCherry-gfp-skl L1 larval animals. Mean ± SD. ****, p < 0.0001, unpaired t-test. (I) Cumulative frequency plot of red-fluorescent object lengths in fed and starved mCherry-gfp-skl L1 larval animals. (J) Quantification of junctions per object for red-fluorescent objects in fed (n = 25) and starved (n = 25) mCherry-gfp-skl L1 larval animals. Mean ± SD. ****, p < 0.0001, unpaired t-test. (K) Time-lapse of a dually labeled red/green peroxisome (arrow) docking at a red-labeled tubule immediately before the green peroxisomal signal disappears (asterisk). Time is in seconds. (L) Time-lapse of dually labeled red/green peroxisomes (arrows) that show a clear redistribution of red signal into previously unmarked tubular formations just as green peroxisomal signal disappears (asterisks). Time is in seconds. Bars: 5 µm.

As the common endpoint to the many different types of autophagy, lysosomes serve as essential modulators of cellular quality control and homeostasis [Citation10]. Emerging evidence suggests that lysosomes are functionally complex and may also possess a morphological versatility that is unique among organelles. Canonically, lysosomes are viewed as discrete vesicles [Citation10]. However, lysosomes have been reported to form tubular structures in some contexts [Citation15–21]. Lysosome tubules have historically been thought to function in non-degradative activities, such as antigen presentation [Citation17] and lysosome reformation [Citation21], and some have postulated that these tubules may represent lysosomes that have lost degradative capacity [Citation18]. However, recent studies in Drosophila muscle have uncovered an extensive network of dynamic, degradative tubular lysosomes (TLs), which serve as preferential sites of autophagy and are key determinants of cellular health in this organism [Citation22,Citation23]. The conservation of autophagic TL networks in other tissues and species is unclear, as is their relationship to vesicular lysosomes.
In this study, we applied a peroxisome-targeted tandem fluorophore to visualize pexophagy in the intestine of live C. elegans (). We found that this pexophagy reporter accurately labeled C. elegans intestinal peroxisomes and sensed their turnover at large, interconnected networks of autophagic TLs. Thus, this unique population of degradative lysosomes is conserved beyond Drosophila and appears to be deployed to effectively turn over peroxisomes upon stimulation. We observed that pexophagy was activated during starvation and, unexpectedly, during early aging. During starvation, pexophagy induction occurred as lysosomes in the C. elegans intestine transformed from vesicles into highly autophagic TLs. Thus, autophagic lysosomes can shift morphology dependent on metabolic stimuli, and TLs represent the predominant lysosomal form in starved animals. We found that active TLs also appeared in early aging, and we detected significant levels of pexophagy at TLs within the first few days of adulthood, hinting that the peroxisome landscape fundamentally shifts as the aging process initiates. Side-by-side comparison of the pexophagy reporter in young-adult mothers and their embryos provided a real-time picture of peroxisome health being restored across generations. Furthermore, we determined that age-induced pexophagy may regulate animal longevity; gene knockdowns that opposed the loss of peroxisomes in young adults extended C. elegans lifespan, whereas a gene knockdown that accelerated this process hastened mortality. Taken together, these findings identify new elements of peroxisome and lysosome biology that are likely to have broad implications for cellular and organismal physiology.
Results
Development of a tandem red-green fluorophore that labels C. elegans intestinal peroxisomes and tracks their turnover in live animals
Peroxisome-targeted tandem fluorophores have been used in the past to track pexophagy in cell culture [Citation24,Citation25] but have yet to be applied to a live animal. To generate a fluorescent reporter that could be used to monitor pexophagy in live C. elegans, we molecularly cloned an mCherry-GFP coding sequence with artificial introns [Citation26] and modified the end of the gene to encode a peroxisomal targeting sequence (the residues serine-lysine-leucine, or SKL [Citation27]) ( and Figure S1A-C). We refer to this transgenic construct as mCherry-gfp-skl (Figure S1C). Because peroxisomes are abundant in the C. elegans intestine [Citation28], we placed this transgene downstream of the ges-1 promoter (Figure S1A,B) in order to express the reporter in all intestinal cells of the worm [Citation29]. At the end of the transgenic construct, we included the unc-54 3ʹ UTR (Figure S1A,B), which is permissive to C. elegans somatic expression [Citation30].
Transgenic animals expressing the mCherry-GFP-SKL protein in the intestine showed normal developmental and reproductive dynamics (Figure S1D,E) and displayed distinct fluorescent puncta specific to the intestinal tissue. Red and green signals overlapped extensively at labeled puncta during embryogenesis (). These puncta were separate from lysosomes (Figure S1F) but colocalized with tagBFP2::CTL-2 (), the C. elegans peroxisomal catalase [Citation28]. Thus, we concluded that the red/green puncta marked by mCherry-GFP-SKL faithfully labeled bona fide, catalase-positive peroxisomes that had yet to undergo pexophagy.
Starvation elicits autophagy in various experimental organisms [Citation31,Citation32]. To test whether the mCherry-GFP-SKL reporter could sense pexophagy due to starvation, we compared the localization of green and red signals in fed and starved animals. Well-fed L1 larval animals, like embryos, showed extensive overlap of red and green fluorescence (). However, upon starvation, a large proportion of red signal was detected separately from the green signal (), consistent with a progressive loss of green signal from the starved animals (Figure S1G). Because red, but not green, fluorescence persists inside of acidic lysosomes [Citation9], we reasoned that the separation of red signal from green signal was due to some peroxisomes undergoing autophagic turnover in starved animals, and that the reporter was accurately sensing pexophagy.
Using high magnification, we noticed a remarkable characteristic change of the red fluorescence in starved animals. Though some dually marked red/green fluorescent puncta were still present in starved L1 animals, much of the red signal shifted to long, branched, tubular structures (). These tubule structures were never observed in the green channel ( and Figure S2A-D), suggesting that these structures may be pexophagic. Starvation of adult animals on the first day of reproductive maturity (“day 1 adults”) caused a similar change to the mCherry-GFP-SKL reporter; structures in the red, but not green, channel showed an interconnected, tubular architecture after 24 h of adult starvation (Figure S2E-M).
To investigate whether peroxisomes are directly targeted to the tubular structures for turnover, we used time-lapse imaging to track individual peroxisomes as their green signal disappeared. We made two striking observations indicating that green signal was lost as peroxisomes targeted to the tubular structures. First, we observed some dually labeled red/green peroxisomes docking at red-labeled tubules immediately prior to loss of green peroxisomal signal at these sites (). Second, we also observed instances where the green peroxisomal signal was lost at the precise moment when the red signal clearly redistributed into tubular structures (), apparently labeling tubules that had been devoid of fluorescent cargo until this point. Thus, the tubules labeled by red signal appear to be active sites of pexophagy, to which peroxisomes are targeted for turnover. These observations indicate that the mCherry-GFP-SKL reporter provides a live readout of pexophagy in C. elegans, and that starvation stimulates the turnover of peroxisomes at tubular structures at multiple time-points in life.
Peroxisome-degrading TLs form from vesicular lysosomes upon starvation
Because only the red signal was detected at tubular structures in starved animals, we surmised that these tubules may be acidic lysosomes that were functioning in pexophagy under starvation conditions. We and others have demonstrated that lysosomes can form extensive tubular networks in certain biological contexts [Citation19,Citation20,Citation22,Citation23]. Interestingly, when we co-imaged the mCherry-GFP-SKL reporter with LysoTracker Deep Red in fed and starved L1 animals, we found that the acidic lysosomes appeared to change form during starvation; LysoTracker-marked lysosomes were vesicular and distinct from dually labeled red/green peroxisomes in fed L1 animals, but they appeared more elongated and overlapped with red-labeled tubules in starved L1 animals ().
Figure 2. Starvation stimulates the formation of pexophagic, dynamic TLs from vesicular lysosomes. (A) Localization of LysoTracker Deep Red signal relative to green and red fluorescence in fed and starved mCherry-gfp-skl L1 animals. (B) Fluorescence in fed and starved spin-1::mCherry and spin-2::mCherry L1 larval animals, with corresponding skeleton images. (C) Quantification of average fluorescent object length in fed (n = 25) and starved (n = 25) spin-1::mCherry and spin-2::mCherry L1 larval animals. Mean ± SD. ****, p < 0.0001, unpaired t-test. (D) Cumulative frequency plots of fluorescent object lengths in fed and starved spin-1::mCherry and spin-2::mCherry L1 larval animals. (E) Quantification of junctions per object for fluorescent objects in fed (n = 25) and starved (n = 25) spin-1::mCherry and spin-2::mCherry L1 larval animals. Mean ± SD. ****, p < 0.0001, unpaired t-test. (F) Localization of SPIN-2::tagBFP2 at tubules (arrow) marked by the red, but not green, fluorophore of mCherry-GFP-SKL in starved L1 larval animals. (G) Time-lapse of green and red fluorescence in starved mCherry-gfp-skl animals at day 1 of adulthood. Time is in seconds. >, tubule formation; X, tubule breakage. Bars: 5 µm.
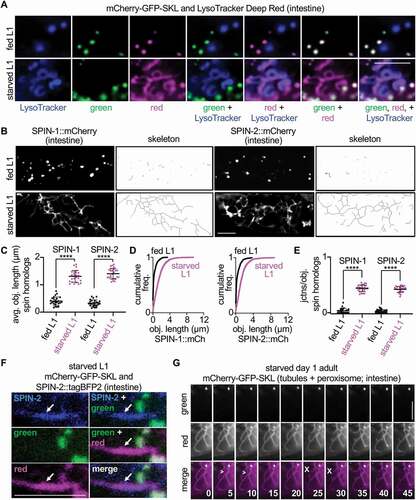
Thus, we sought to analyze in more detail changes to lysosome morphology in live animals during starvation. The autophagic TLs previously described in Drosophila muscle are labeled robustly by the lysosomal protein spin (spinster) [Citation22]. In our experience, spin is brighter and more consistent in live-animal imaging approaches compared to LysoTracker or other lysosome-associated proteins. The C. elegans genome contains four genes that encode spin homologs (spin-1 through spin-4). When we expressed either SPIN-1::mCherry or SPIN-2::mCherry in the worm intestine, we observed that both proteins localized to expansive tubular networks in starved L1 animals (). We confirmed that the tubules marked by C. elegans SPIN were the same as those labeled less robustly by LysoTracker Deep Red (Figure S2N). Remarkably, we did not observe the same tubular architecture in L1 animals that were well-fed; in these cases, SPIN-1::mCherry and SPIN-2::mCherry instead appeared predominantly vesicular (). Accordingly, we concluded that vesicular lysosomes marked by C. elegans SPIN proteins transition into TLs in starved L1 animals. Using SPIN-1::mCherry, we confirmed that a shift from vesicular to tubular form also occurred during starvation of day 1 adults (Figure S2O-R). Thus, TLs appear to be the predominant lysosomal form in both larval and adult animals upon starvation.
If SPIN-marked TLs were the site of pexophagy during starvation, we expected to see colocalization of a C. elegans SPIN protein with the red fluorophore of the pexophagy reporter under starvation conditions. Indeed, this was the case; in starved L1 animals, tubules marked by SPIN-2::tagBFP2 were observed to be the same as the tubules marked by the red fluorophore of mCherry-GFP-SKL (). Of note, while we observed that lysosomes had undergone the transformation into the TL state by 24 h of starvation (), the green:red ratio of the mCherry-GFP-SKL reporter continued to decrease after this point (Figure S1G), further highlighting the ability of TLs to serve as active sites of sustained peroxisome turnover (). Thus, these tubule structures are acidic, pexophagic, and induced by starvation. Similar to our previous observations of spin in Drosophila [Citation22], we found that the TLs marked by the red fluorophore of mCherry-GFP-SKL in starved animals were extremely dynamic, forming and breaking connections within the network in just a matter of seconds (). Collectively, our data reveal that autophagic TLs are not only conserved in the C. elegans intestine but are also context dependent. In the case of starvation, TL formation is stimulated in starved animals, and pexophagy occurs at these cellular sites in response to this metabolic cue.
Pexophagy occurs at TLs during early aging and may regulate animal lifespan
We next asked whether the mCherry-GFP-SKL reporter could provide information on pexophagy during adulthood and aging in well-fed animals. Though both red and green fluorescence were strong at intestinal peroxisomes in well-fed day 1 adults ( and Figure S2M), the green signal was significantly reduced by day 5 of adulthood (). This age-dependent decrease in fluorescence was specific to the green fluorophore, as red fluorescence was strongly maintained (). As in starved young animals ( and Figure S2A-M), the red, but not green, signal was observed in long, branched, tubular networks in well-fed day 5 adults ( and Figure S3A-D). In line with this finding, SPIN-1::mCherry localization indicated an age-dependent increase in TLs (Figure S3E-H), suggesting that aging also induces a transition to a more tubular lysosomal state. This is consistent with a previous report [Citation18], but our observation that these tubules are pexophagic challenges the conclusion that TLs in adult animals are inactive. We found that age-induced pexophagy occurred at TLs in other tissues as well. Animals expressing the pexophagy reporter in the hypodermis using the dpy-7 promoter [Citation33] similarly showed a marked decrease in the green:red ratio at day 5 of adulthood relative to day 1 (Figure S3I,J), and much of the red signal that was distinct from the green puncta in the hypodermis of day 5 adults appeared clearly as tubules (Figure S3K). It is interesting to note that day 5 adults are not geriatric per se; the normal lifespan of wild-type C. elegans is two-to-three weeks [Citation34]. This implies that peroxisome turnover is an early event during C. elegans aging, which occurs even in non-elderly animals, and which may be coordinated with a biological clock across various tissues.
Figure 3. Age-induced pexophagy occurs at TLs in young adulthood and may affect longevity. (A) Whole-animal DIC, green, and red images of fed mCherry-gfp-skl animals at day 1 and day 5 of adulthood. Asterisks mark day 5 adults. (B) Quantification of the green:red fluorescence ratio in fed mCherry-gfp-skl animals at day 1 (n = 30) and day 5 (n = 25) of adulthood. Mean ± SD. ****, p < 0.0001, unpaired t-test. (C) Green and red fluorescence in fed mCherry-gfp-skl animals at day 1 and day 5 of adulthood. (D) Red fluorescence in fed mCherry-gfp-skl animals at day 1 and day 5 of adulthood, with corresponding skeleton images. (E) Quantification of average red-fluorescent object length in fed mCherry-gfp-skl animals at day 1 (n = 25) and day 5 (n = 25) of adulthood. Mean ± SD. ****, p < 0.0001, unpaired t-test. (F) Cumulative frequency plot of red-fluorescent object lengths in fed mCherry-gfp-skl animals at day 1 and day 5 of adulthood. (G) Quantification of junctions per object for red-fluorescent objects in fed mCherry-gfp-skl animals at day 1 (n = 25) and day 5 (n = 25) of adulthood. Mean ± SD. ****, p < 0.0001, unpaired t-test. (H) Whole-animal DIC, green, and red images of a day 5 adult animal with fluorescent embryos inside of the uterus (bracketed). (I) Quantification of green fluorescence in fed day 5 adults relative to green fluorescence in embryos inside the uterus. Green fluorescence intensities were normalized to red fluorescence before ratios were calculated. n = 21. (J) Whole-animal merged green/red images of fed mCherry-gfp-skl animals at day 5 of adulthood following control or lgg-1 RNAi. Asterisks mark animals treated with lgg-1 RNAi. (K) Quantification of the green:red fluorescence ratio in fed mCherry-gfp-skl animals at day 1 (n = 26) and day 5 (n = 21) of adulthood, as well as at day 5 of adulthood following control (n = 20), lgg-1 (n = 20), prx-11 (n = 18), dhs-28 (n = 27), or hmgr-1(n = 27) RNAi. Mean ± SD. ****, p < 0.0001; ns, not significant, one-way ANOVA. (L) Images of green-fluorescent peroxisomes in fed mCherry-gfp-skl animals at day 1 of adulthood, as well as at day 5 of adulthood following control, lgg-1, prx-11, dhs-28, or hmgr-1 RNAi. (M) Quantification of the green-fluorescent peroxisome area in fed mCherry-gfp-skl animals at day 1 of adulthood, as well as at day 5 of adulthood following control, lgg-1, prx-11, dhs-28, or hmgr-1 RNAi. n > 500 peroxisomes for each condition. Mean ± SD. ****, p < 0.0001; ns, not significant, one-way ANOVA. (N) Adult lifespans following control, prx-11, dhs-28, or hmgr-1 RNAi. Significance was assessed by log-rank test. Control v. prx-11 RNAi: χ2 = 41, p < 0.0001. Control v. dhs-28 RNAi: χ2 = 26, p < 0.0001. Control v. hmgr-1 RNAi: χ2 = 143, p < 0.0001. Bars: 10 µm.
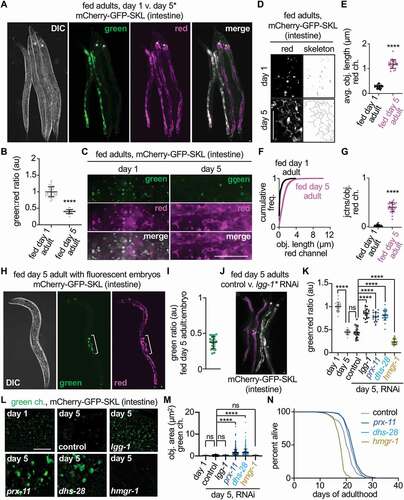
Adult C. elegans hold fertilized eggs within their uterus before laying them to the outside at a later embryonic stage [Citation35]. Since we previously observed dually labeled red/green peroxisomes in isolated embryos (), we asked whether we could image fluorescent embryos within fluorescent day 5 mothers and observe a transgenerational renewal of healthy peroxisomes. Indeed, this was the case. Inside day 5 mothers, mCherry-GFP-SKL-expressing embryos showed strong red and green signals (). This was in contrast to the transgenic mothers, which showed a clear reduction in green signal relative to their embryos (). This observation is again consistent with an increase in pexophagy in the adult soma during early aging. It also provides a snapshot of cellular function being reestablished across generations, as healthy peroxisome numbers appear restored in the new generation.
We next sought to identify genes and pathways that regulate the age-dependent change in fluorescence of the pexophagy reporter in the adult soma. If the change in the green:red ratio was indeed due to enhanced pexophagy in older animals, one would expect that inhibiting the autophagy machinery starting at day 1 of adulthood would significantly impede loss of the green signal and allow for maintenance of a high green:red ratio in older adults. As expected, knocking down lgg-1, which encodes the C. elegans homolog of macroautophagy protein LC3 [Citation11], significantly opposed the age-related decrease in the green:red ratio (). Notably, lgg-1 RNAi animals still showed TLs at day 5 of adulthood (Figure S3L); thus, this knockdown appeared to interfere with the delivery of peroxisome cargo to the degradative sites, but not the formation of TLs. Our previous observations in flies similarly suggest that TL formation does not require autophagosome assembly or fusion [Citation22]. To test whether a lack of peroxisome biogenesis might also contribute to peroxisome loss in older animals, we scored peroxisome numbers with age in animals treated with control or lgg-1 RNAi. Whereas peroxisomes, marked by the green channel of the mCherry-GFP-SKL protein, significantly decreased in number at days 4 and 5 of adulthood in control animals (Figure S3M), peroxisome numbers gradually increased during aging when autophagy was inhibited (Figure S3M). Thus, these data indicate that peroxisome biogenesis occurs during early adulthood but is eventually outpaced by the rate of pexophagy. These data also verify that elevated pexophagy drives the shift in fluorescence of the mCherry-GFP-SKL reporter during aging.
In an attempt to identify peroxisomal genes that regulate this process, we first screened the 11 C. elegans peroxins, which govern peroxisome assembly and maintenance [Citation2,Citation28]. Of these, genetic knockdown of three (prx-5, prx-13, and prx-19) appeared to indirectly oppose the age-related decrease in green signal relative to red (Figure S3N) by causing an increase in diffuse cytosolic and nuclear GFP signal (Figure S3O), most likely due to impaired peroxisomal import or complete collapse of import-competent peroxisomes. Among the remaining peroxin genes, we identified one (prx-11) which when knocked down caused a significant increase in the green:red ratio in day 5 animals without interfering with import of the fluorescent pexophagy reporter into peroxisomes ( and Figure S3P). Homologs of PRX-11 in other species have been proposed to direct peroxisome fission [Citation36], an event required for efficient pexophagy [Citation37]. Interestingly, we found that peroxisomes became significantly larger upon prx-11 knockdown (), suggesting that this may also be the case in C. elegans and that PRX-11 may actively facilitate age-induced pexophagy.
We were curious whether other peroxisomal genes besides prx-11 would control changes to the pexophagy reporter in aging C. elegans. We therefore screened 33 additional factors annotated by Gene Ontology to localize to the peroxisome. Of these, we identified two genes that affected the rate of this change: dhs-28 (DeHydrogenase, Short chain) and hmgr-1 (HMG-CoA Reductase). As upon genetic knockdown of prx-11, genetic knockdown of dhs-28 slowed the age-related decrease in the green:red ratio ( and Figure S3P). In contrast, genetic knockdown of hmgr-1 accelerated this decline ( and Figure S3P). Interestingly, loss of dhs-28 function resulted in large peroxisomes, whereas loss of hmgr-1 function did not (). Thus, regulation of peroxisome size may be a critical determinant of peroxisome turnover in aging C. elegans, with larger peroxisomes obstructing this process.
Because we had identified genetic interventions that had opposite effects on the pexophagy reporter during aging, we next investigated their potential relationship to animal lifespan. Genetic knockdown of prx-11 was previously reported to extend animal lifespan [Citation38], yet this was attributed to a potential absence of peroxisomes, which our data contradict. We found that genetic knockdown of prx-11 indeed lengthened lifespan, as did genetic knockdown of dhs-28 (); thus, both knockdowns that impeded age-related peroxisome turnover enhanced lifespan. However, genetic knockdown of hmgr-1, which accelerated age-related peroxisome loss, shortened C. elegans lifespan (). Accordingly, peroxisome turnover may be integrated with lifespan regulation, and animals can retain peroxisomes late in life and still live long, perhaps even longer than normal in some circumstances.
Discussion
In this study, we have described a fluorescent reporter that can be used to track pexophagy in a live animal, C. elegans. By studying pexophagy during animal starvation, we have uncovered a novel principle of lysosome biology: upon starvation, lysosomal vesicles transform into tubules with high autophagic activity, which receive and digest peroxisomes and perhaps other cargo. In addition, we have observed that large-scale peroxisome turnover occurs in the intestine over the first few days of adulthood, highlighting an age-dependent change that occurs in relatively young adults and which can be tweaked to alter animal longevity. These findings not only provide new details on pexophagy, a poorly studied area in autophagy research, but they also help to reshape how we view the landscape of the cell and its potential relevance to the biology of aging.
Our description of autophagic TLs in C. elegans fits with growing evidence that lysosomes are morphologically and functionally more complex than previously thought [Citation10,Citation19,Citation20,Citation22,Citation23]. Notably, traditional lysosomal markers and dyes poorly label this type of lysosomal architecture. One possible explanation is that TLs are molecularly distinct from vesicular lysosomes, even though TLs appear to form from these vesicles. Understanding the unique molecular components that support TL assembly will be important for clarifying the regulation and activity of this special class of lysosomes. Another likely explanation is that live imaging is required to preserve tubular lysosomal networks [Citation22]. In Drosophila muscle, spin-labeled tubular structures in fact break down when samples are fixed [Citation39].
Our data moreover highlight that TL formation is highly context dependent, and that TL stimulation upon starvation and aging makes them a predominant form of lysosome in the C. elegans intestine under these conditions. Remarkably, we have captured individual peroxisomes at the moment of their turnover at TLs, providing direct visual evidence that TLs are active participants in peroxisome degradation. The fact that TL induction in the intestine correlated with large-scale peroxisome turnover in multiple conditions suggests that lysosomal transformation into tubules could be a prerequisite for the regulated bulk destruction of peroxisomes. This may also be the case for other contexts in which large-scale autophagic degradation is needed. In fact, there is recent evidence that lysosome tubulation occurs during molting in C. elegans [Citation20] and during metamorphosis in Drosophila [Citation19]. Lysosome tubules have also been reported to support the reformation of autophagic lysosomes in cultured mammalian cells under high autophagic demand [Citation21]; however, in this process, the tubular proto-lysosomes are nonacidic, fail to take up autolysosomal contents or substrates, and must fission and re-acidify to become functional vesicular lysosomes [Citation21]. In contrast, the tubules we observed in the C. elegans intestine were acidic and internalized autophagic cargo, including peroxisomes, suggesting the tubules we have identified play a more direct role in autophagic degradation and are not functioning simply in the reformation of active lysosomes. Notably, unlike in the worm intestine, autophagic TLs are present constitutively in Drosophila larval muscle and do not require a stimulus [Citation22]. Thus, autophagic TLs appear to be regulated by distinct mechanisms in different tissues. It will be interesting to determine whether TLs are induced in any other physiological or metabolic states, as they may be deployed to handle particular autophagic responses.
Previous proteomic evidence indicated that factors involved in peroxisomal import decrease with age [Citation40]. In principle, this could be linked to an age-related turnover of peroxisomes, but this had yet to be tested before our study. Our data support the conclusion that pexophagy is elevated in early aging and leads to a decrease in peroxisome number, even though new peroxisomes can apparently still be made. It is notable that we observed an increase in peroxisome clearance with age in young adults, whereas other forms of autophagy, including mitophagy [Citation11], show an age-related decrease in activity. This may be because pexophagy is stimulated at an earlier stage of the aging process, before lysosome dysfunction occurs. Our data furthermore hint that pexophagy may be part of a larger biological clock that scales with age. Surprisingly, we found that peroxisome-gene knockdowns that inhibited peroxisome loss in aging also promoted long lifespan. This runs counter to the idea that peroxisome over-abundance would lead to enhanced oxidative stress, which could be physiologically detrimental [Citation38]. One possibility is that mutants retaining peroxisomes later in life may show altered regulation of fat; dhs-28 and hmgr-1 gene knockdowns, for instance, have opposing effects on fat storage [Citation41,Citation42], like their opposing effects on lifespan and peroxisome loss during aging. Given our data, it is exciting to speculate that pexophagy may provide a predictive biomarker of aging and longevity in young animals, which could potentially be used as a tool to rapidly screen for genetic, chemical, or environmental interventions that extend healthy lifespan [Citation43].
How age is naturally reset across generations remains an unanswered question in biology. It is likely that several cellular mechanisms contribute to transgenerational rejuvenation in animals. Some of these mechanisms may function in erasing age-related cellular damage [Citation44,Citation45], while others may help to rebuild cellular machinery. Our observations suggest that embryos with functional peroxisomes can be born from mothers that lack a healthy number of this essential organelle, at least in some somatic tissues. Unlike other organelles, such as mitochondria [Citation46], peroxisomes can be made de novo; they do not absolutely require preexisting peroxisomes in order to form [Citation2,Citation5]. Thus, it is possible that de novo peroxisome biogenesis may occur across generations, helping to restore peroxisome homeostasis in progeny. In future studies, it will be important to address how this transgenerational renewal in peroxisome function occurs, because children born without functioning peroxisomes show severe developmental abnormalities and early age mortality [Citation4].
Materials and methods
Molecular biology
The ges-1 promoter was PCR-amplified from C. elegans genomic DNA using the following primers: Forward, 5ʹ-GGGGACAACTTTGTATAGAAAAGTTGACTCCGAACTATGATGACGAAAAAATG-3ʹ; Reverse, 5ʹ-GGGGACTGCTTTTTTGTACAAACTTGCTGAATTCAAAGATAAGATATGTAATAG-3ʹ. The dpy-7 promoter was PCR-amplified from C. elegans genomic DNA using the following primers: Forward, 5ʹ-GGGGACAACTTTGTATAGAAAAGTTGAAGCTTCGTTGTGAGATGAGTTTCATAG-3ʹ; Reverse, 5ʹ-GGGGACTGCTTTTTTGTACAAACTTGTTATCTGGAACAAAATGTAAGAATATTC-3ʹ. Pges-1 and Pdpy-7 were cloned into the pDONR P4-P1R Gateway entry vector (Invitrogen, 25–0541) using BP clonase (ThermoFisher Scientific, 11789020), and the inserts were verified by DNA sequencing. pDONR P2R-P3 unc-54 3ʹ UTR is a lab stock. These clones were used in the creation of the following worm-expression plasmids:
Pges-1::mCherry-gfp-skl::unc-54 UTR
A GFP coding sequence was PCR-amplified with a KpnI site and a short glycine linker at its 5ʹ end and codons for serine-lysine-leucine inserted just before the stop codon using the following primers: Forward, 5ʹ-GGGGACAAGTTTGTACAAAAAAGCAGGCTGGTACCGGAGGAATGAGTAAAGGAGAAGAAC-3ʹ; Reverse, 5ʹ-GGGGACCACTTTGTACAAGAAAGCTGGGTCTATAATTTGGATAGTTCATCCATGCC-3ʹ. This gfp-skl sequence was then cloned into the pDONR221 Gateway entry vector (Invitrogen, 25–0541) using BP clonase, and the insert was verified by DNA sequencing. A n mCherry coding sequence was PCR-amplified with 5ʹ and 3ʹ KpnI sites but no stop codon using the following primers: Forward, 5ʹ-CCCGGTACCATGGTCTCAAAGGGTGAAGAAGATAAC-3ʹ; Reverse,
5ʹ-CCCGGTACCCTTATACAATTCATCCATGCCACCTG-3ʹ. This mCherry coding sequence was then inserted into pDONR221 gfp-skl using standard restriction-enzyme cloning at the KpnI site, and pDONR221 mCherry-gfp-skl was sequence-verified. pDONR P4-P1r Pges-1, pDONR221 mCherry-gfp-skl, and pDONR P2R-P3 unc-54 3ʹ UTR were then combined in the pDEST R4-R3 Gateway destination vector (Invitrogen, 25–0541) using LR clonase (ThermoFisher Scientific, 12538120).
Pges-1::tagbfp2::ctl-2::unc-54 UTR
ctl-2 was PCR-amplified from C. elegans genomic DNA with 5ʹ EcoRI and PstI sites using the following primers: Forward, 5ʹ-GGGGACAAGTTTGTACAAAAAAGCAGGCTGAATTCCTGCAGATGCCAAACGATCCATCGG-3ʹ; Reverse, 5ʹ-GGGGACCACTTTGTACAAGAAAGCTGGGTTTAGATATGAGAGCGAGCCTGTTTC-3ʹ. This ctl-2 sequence was then cloned into the pDONR221 Gateway entry vector using BP clonase, and the insert was verified by DNA sequencing. A tagBFP2 coding sequence was PCR-amplified from Peft-3::tagbfp2::unc-54 UTR (Caenorhabditis Genetics Center, ARM6) with 5ʹ EcoRI and 3ʹ PstI sites but no stop codon using the following primers: Forward, 5ʹ-GGGAATTCATGGTCTCCAAGGGAGAGG−3ʹ; Reverse, 5ʹ-GGCTGCAGGTTGAGCTTGTGTCCGAGC-3ʹ. This tagBFP2 coding sequence was then inserted into pDONR221 ctl-2 using standard restriction-enzyme cloning at the EcoRI and PstI sites, and pDONR221 tagbfp2::ctl-2 was sequence-verified. pDONR P4-P1r Pges-1, pDONR221 tagbfp2::ctl-2, and pDONR P2R-P3 unc-54 3ʹ UTR were then combined in the pDEST R4-R3 Gateway destination vector using LR clonase.
Pges-1:: spin-1::mCherry::unc-54 UTR
spin-1 was PCR-amplified from C. elegans genomic DNA with no stop codon and a 3ʹ KpnI site using the following primers: Forward, 5ʹ-GGGGACAAGTTTGTACAAAAAAGCAGGCTATGGTGAGAAACAAAGTGGCACCAG-3ʹ; Reverse, 5ʹ-GGGGACCACTTTGTACAAGAAAGCTGGGTGGTACCCATATGTTGAACTTCGGAACCAG-3ʹ. This spin-1 sequence was then cloned into the pDONR221 Gateway entry vector using BP clonase, and the insert was verified by DNA sequencing. An mCherry coding sequence was PCR-amplified with a stop codon and 5ʹ and 3ʹ KpnI sites using the following primers: Forward, 5ʹ-GGCGGTACCATGGTCTCAAAGGGTGAAGAAG-3ʹ; Reverse, 5ʹ-GGCGGTACCTTACTTATACAATTCATCCATGCCACC-3ʹ. This mCherry coding sequence was then inserted into pDONR221 spin-1 using standard restriction-enzyme cloning at the KpnI site, and pDONR221 spin-1::mCherry was sequence-verified. pDONR P4-P1r Pges-1, pDONR221 spin-1::mCherry, and pDONR P2R-P3 unc-54 3ʹ UTR were then combined in the pDEST R4-R3 Gateway destination vector using LR clonase.
Pges-1:: spin-2::mCherry::unc-54 UTR
spin-2 was PCR-amplified from C. elegans genomic DNA with no stop codon and a 3ʹ KpnI site using the following primers: Forward, 5ʹ-GGGGACAAGTTTGTACAAAAAAGCAGGCTATGGTAAACTCTCAACAGGACTACATCAGTG-3ʹ; Reverse, 5ʹ-GGGGACCACTTTGTACAAGAAAGCTGGGTGGTACCAAGTCGGGACGACGCAACGTCGTCG-3ʹ. This spin-2 sequence was then cloned into the pDONR221 Gateway entry vector using BP clonase, and the insert was verified by DNA sequencing. An mCherry coding sequence was PCR-amplified with a stop codon and 5ʹ and 3ʹ KpnI sites using the following primers: Forward, 5ʹ-GGCGGTACCATGGTCTCAAAGGGTGAAGAAG-3ʹ; Reverse, 5ʹ-GGCGGTACCTTACTTATACAATTCATCCATGCCACC-3ʹ. This mCherry coding sequence was then inserted into pDONR221 spin-2 using standard restriction-enzyme cloning at the KpnI site, and pDONR221 spin-2::mCherry was sequence-verified. pDONR P4-P1r Pges-1, pDONR221 spin-2::mCherry, and pDONR P2R-P3 unc-54 3ʹ UTR were then combined in the pDEST R4-R3 Gateway destination vector using LR clonase.
Pges-1:: spin-2::tagbfp2::unc-54 UTR
A tagBFP2 coding sequence was PCR-amplified with a stop codon and 5ʹ and 3ʹ KpnI sites using the following primers: Forward, 5ʹ-CGCGGGGTACCATGGTCTCCAAGGGAGAGGAG-3ʹ; Reverse, 5ʹ- CGCGGGGTACCTTAGTTGAGCTTGTGTCCGAGC-3ʹ. This tagBFP2 coding sequence was then inserted into pDONR221 spin-2 using standard restriction-enzyme cloning at the KpnI site, and pDONR221 spin-2::tagbfp2 was sequence-verified. pDONR P4-P1r Pges-1, pDONR221 spin-2::tagbfp2, and pDONR P2R-P3 unc-54 3ʹ UTR were then combined in the pDEST R4-R3 Gateway destination vector using LR clonase.
Pdpy-7::mCherry-gfp-skl::unc-54 UTR
pDONR P4-P1r Pdpy-7, pDONR221 mCherry-gfp-skl (described above), and pDONR P2R-P3 unc-54 3ʹ UTR were combined in the pDEST R4-R3 Gateway destination vector using LR clonase.
In all cases, complete plasmids were confirmed by standard restriction-enzyme digests and sequencing. Plasmid maps were generated using SnapGene software.
Strain generation
Microinjection was performed using standard protocol [Citation47]. Constructs were injected individually or in combination into the gonad of adult N2 hermaphrodites, each at a concentration of 25 ng/µl. Integration of transgenes was achieved using UV irradiation [Citation47], followed by >5 generations of outcrossing. The following strains were generated: KAB30, louEx28[Pges-1::mCherry-gfp-skl::unc-54 UTR + Pges-1::tagbfp2::ctl-2::unc-54 UTR]; KAB31, louEx29[Pges-1::spin-2::mCherry::unc-54 UTR]; KAB32, louEx30[Pges-1::mCherry-gfp-skl::unc-54 UTR + Pges-1::spin-2::tagbfp2::unc-54 UTR]; KAB34, louIs2[Pges-1::mCherry-gfp-skl::unc-54 UTR]; KAB37, louIs4[Pges-1::spin-1::mCherry::unc-54 UTR]; KAB77, louEx77[Pdpy-7::mCherry-gfp-skl::unc-54 UTR].
Animal maintenance, starvation, and aging
Worms were raised at 20°C on NGM agar (51.3 mM NaCl, 0.25% peptone, 1.7% agar, 1 mM CaCl2, 1 mM MgSO4, 25 mM KPO4, 12.9 µM cholesterol, pH 6.0). Fed worms were maintained on NGM agar plates that had been seeded with E. coli OP50 bacteria (lab stock). Embryos were isolated by picking eggs that had been laid on plates or by bleaching young-adult hermaphrodites. Briefly, adult hermaphrodites were vortexed in 5 mL bleaching solution (0.5 M NaOH, 20% bleach) for 5 min to isolate eggs, and eggs were then washed three times in 5 mL M9 buffer (22 mM KH2PO4, 42 mM Na2HPO4, 85.5 mM NaCl, 1 mM MgSO4, pH 7.0).
Starvation was performed on larval and adult animals for 18–24 h, except where otherwise noted. To obtain starved L1 animals for skeleton analysis, bleached eggs were spotted on NGM agar that lacked OP50 bacteria, and plates were maintained at 20°C for 18–24 h before imaging. To obtain starved young adults for skeleton analysis, late L4 larval animals were rinsed off of OP50-seeded NGM plates using M9 buffer. Animals were washed three times in 5 ml M9 buffer before being transferred to NGM plates that lacked OP50 bacteria. Plates with starved adults were maintained at 20°C for 18–24 h before imaging.
For aging experiments, synchronous populations of animals were established by bleaching adult hermaphrodites or by synchronous egg-laying. During aging, adult worms were picked onto fresh OP50-seeded NGM plates every 1–2 d to maintain adults separate from progeny.
For RNAi experiments, synchronous populations of animals were grown on OP50-seeded NGM plates until late L4 or day 1 of adulthood, at which time they were transferred to RNAi plates (NGM plus 100 ng/µl carbenicillin [ThermoFisher Scientific, BP26481] and 1 mM IPTG [ThermoFisher Scientific, 34060]) that had been seeded with bacteria expressing the relevant RNAi clone. RNAi clones were obtained from the Julie Ahringer lab collection [Citation48], and an empty L4440 vector (lab stock) was used as a negative control. All clones were verified by DNA sequencing.
Analysis of developmental and reproductive dynamics
To assay developmental dynamics, adult animals were bleached, and eggs were placed on NGM plates seeded with OP50. The percentage of animals reaching adulthood by 72 h later was determined using stereomicroscopy. To assay reproductive dynamics, synchronous populations of adult animals were transferred to fresh OP50-seeded NGM plates every day of adulthood, and viable progeny were scored using stereomicroscopy.
Lifespan analysis
Synchronous populations of N2 animals were transferred as late L4s to RNAi plates seeded with control, prx-11, dhs-28, or hmgr-1 RNAi bacteria. The RNAi plates had been previously spotted with 5 mM FUdR (Acros Organics, 227605000) to prevent progeny production. >250 animals were analyzed per condition. Animals that exploded, bagged, or crawled off plates were censored during analysis. Lifespans were analyzed using OASIS 2 software [Citation49], and statistical significance was assessed using a log-rank test.
Microscopy and image analysis
Four percent agarose (ThermoFisher Scientific, BP164) pads were dried on a Kimwipe and then placed on top of a Gold SealTM glass microscope slide (ThermoFisher Scientific, 48300). A small volume of 2 mM levamisole (Acros Organics, AC18787) was spotted on the agarose pad. Worms were transferred to the levamisole spot, and a glass cover slip (ThermoFisher Scientific, 12–540-B) was placed on top to complete the mounting.
Live-animal fluorescence microscopy was performed using one of the following systems: (1) a Leica DMi8 THUNDER imager, equipped with 10X (NA 0.32), 40X (NA 1.30), and 100X (NA 1.40) objectives and GFP and Texas Red filter sets; or (2) a Leica TCS SP8 confocal microscope, equipped with 40X (NA 1.30) and 63X (NA 1.40) objectives, a white-light laser (470 nm – 670 nm), and an argon-blue laser. Images were processed using LAS X software (Leica) and Fiji/ImageJ.
Skeleton images were obtained using the Skeleton plug-in on Fiji/ImageJ. The Analyze Skeleton 2D/3D tool was applied to get data on individual object lengths and number of junctions. 25 animals were scored for each condition for skeleton analysis. GraphPad Prism software was used to generate a cumulative frequency plot for object lengths among the individuals in each group, and to plot average object lengths and average junctions per object for each animal. Data on average object length and average junctions per object were statistically analyzed using unpaired t-tests.
Green and red fluorescence was scored in larval animals, adult animals, and embryos by tracing intestinal or hypodermal tissues and measuring fluorescence intensities using Fiji/ImageJ. Data on fluorescence ratios were statistically analyzed using unpaired t-tests or one-way ANOVA with Tukey’s multiple comparisons. To compare green fluorescence in day 5 adults and embryos, green fluorescence was first normalized to red fluorescence before ratios were calculated.
Individual peroxisome areas were calculated by freehand tracing peroxisomes in Fiji/ImageJ and using the Analyze>Measure function. Peroxisome areas in different conditions were statistically analyzed using one-way ANOVA with Tukey’s multiple comparisons.
To score peroxisome numbers during aging, green-labeled peroxisomes in mCherry-gfp-skl animals were manually counted in acquired regions of the intestine and normalized to an area of 100 µm2 for each animal.
Manders’ overlap coefficient for red fluorescence relative to green fluorescence was quantified by selecting a region of interest in Fiji/ImageJ and using the Coloc 2 plug-in with a point-spread function of 3.0.
LysoTracker staining
Fed animals were stained with LysoTracker Deep Red (ThermoFisher Scientific, L12492) by applying a fluorescent-dye feeding strategy [Citation50]. Briefly, NGM plates containing 2 µM LysoTracker Deep Red were spotted with OP50 that had also been mixed with 2 µM LysoTracker Deep Red. Adult N2 animals were transferred to these plates, and embryos and fed L1 animals born from these animals were imaged 1–2 d later. To stain starved L1 animals, bleached eggs were cultured in 10 mL M9 buffer overnight in the presence of 2 µM LysoTracker Deep Red. Arrested L1 animals were imaged the next day.
Statistical analysis
Data were statistically analyzed using GraphPad Prism software. For two-sample comparisons, an unpaired t-test was used to determine significance (α = 0.05). For three or more samples, a one-way ANOVA with Tukey’s multiple comparisons was used to determine significance (α = 0.05). Statistical significance of lifespan data was determined using a log-rank test.
Supplemental Material
Download Zip (35.1 KB)Acknowledgments
The authors thank all members of the Bohnert and Johnson labs for helpful discussions on this project.
Disclosure statement
No potential conflict of interest was reported by the author(s).
Supplementary material
Supplemental data for this article can be accessed here
Additional information
Funding
Related Research Data
References
- De Duve C, Baudhuin P. Peroxisomes (microbodies and related particles). Physiol Rev. 1966;46(2):323–357.
- Smith JJ, Aitchison JD. Peroxisomes take shape. Nat Rev Mol Cell Biol. 2013;14(12):803–817.
- Lodhi IJ, Semenkovich CF. Peroxisomes: a nexus for lipid metabolism and cellular signaling. Cell Metab. 2014;19(3):380–392.
- Argyriou C, D’Agostino MD, Braverman N. Peroxisome biogenesis disorders. Trans Sci Rare Dis. 2017;1(2):111–144.
- Sugiura A, Mattie S, Prudent J, et al. Newly born peroxisomes are a hybrid of mitochondrial and ER-derived pre-peroxisomes. Nature. 2017;542(7640):251–254.
- Butsch TJ, Ghosh B, Bohnert KA. Organelle-specific autophagy in cellular aging and rejuvenation. Adv Geriatr Med Res. 2021;3(2):e210010.
- Eberhart T, Kovacs WJ. Pexophagy in yeast and mammals: an update on mysteries. Histochem Cell Biol. 2018;150(5):473–488.
- Lee HN, Kim J, Chung T. Degradation of plant peroxisomes by autophagy. Front Plant Sci. 2014;5:139.
- Kimura S, Noda T, Yoshimori T. Dissection of the autophagosome maturation process by a novel reporter protein, tandem fluorescent-tagged LC3. Autophagy. 2007;3(5):452–460.
- Settembre C, Fraldi A, Medina DL, et al. Signals from the lysosome: a control centre for cellular clearance and energy metabolism. Nat Rev Mol Cell Biol. 2013;14(5):283–296.
- Palikaras K, Lionaki E, Tavernarakis N. Coordination of mitophagy and mitochondrial biogenesis during ageing in C. elegans. Nature. 2015;521(7553):525–528.
- Sun N, Youle RJ, Finkel T. The mitochondrial basis of aging. Mol Cell. 2016;61(5):654–666.
- Hughes AL, Gottschling DE. A n early age increase in vacuolar pH limits mitochondrial function and lifespan in yeast. Nature. 2012;492(7428):261–265.
- Baxi K, Ghavidel A, Waddell B, et al. Regulation of lysosomal function by the DAF-16 forkhead transcription factor couples reproduction to aging in Caenorhabditis elegans. Genetics.2017;207(1):83–101.
- Robinson JM, Okada R, Castellot JJ, et al. Unusual lysosomes in aortic smooth muscle cells: presence in living and rapidly frozen cells. J Cell Biol. 1986;102(5):1615–1622.
- Barois N, De Saint-Vis B, Lebecque S, et al. MHC class II compartments in human dendritic cells undergo profound structural changes upon activation. Traffic. 2002;3(12):894–905.
- Swanson J, Bushnell A, Silverstein SC. Tubular lysosome morphology and distribution within macrophages depend on the integrity of cytoplasmic microtubules. Proc Natl Acad Sci USA. 1987;84(7):1921–1925.
- Sun Y, Li M, Zhao D, et al. Lysosome activity is modulated by multiple longevity pathways and is important for lifespan extension in C. elegans. Elife. 2020;9:e55745.
- Murakawa T, Kiger AA, Sakamaki Y, et al. An autophagy-dependent tubular lysosomal network synchronizes degradative activity required for muscle remodeling. J Cell Sci. 2020;133(21):jcs248336.
- Miao R, Li M, Zhang Q, et al. An ECM-to-nucleus signaling pathway activates lysosomes for C. elegans larval development. Dev Cell. 2020;52(1):21–37.e5.
- Yu L, McPhee CK, Zheng L, et al. Termination of autophagy and reformation of lysosomes regulated by mTOR. Nature. 2010;465(7300):942–946.
- Johnson AE, Shu H, Hauswirth AG, et al. VCP-dependent muscle degeneration is linked to defects in a dynamic tubular lysosomal network in vivo. Elife. 2015;4:e07366.
- Johnson AE, Orr BO, Fetter RD, et al. SVIP is a molecular determinant of lysosomal dynamic stability, neurodegeneration and lifespan. Nat Commun. 2021;12(1):513.
- Nazarko TY, Ozeki K, Till A, et al. Peroxisomal Atg37 binds Atg30 or palmitoyl-CoA to regulate phagophore formation during pexophagy. J Cell Biol. 2014;204:541–557.
- Zhang J, Tripathi DN, Jing J, et al. ATM functions at the peroxisome to induce pexophagy in response to ROS. Nat Cell Biol. 2015;17:1259–1269.
- Okkema PG, Harrison SW, Plunger V, et al. Sequence requirements for myosin gene expression and regulation in Caenorhabditis elegans. Genetics. 1993;135(2):385–404.
- Gould SJ, Keller GA, Hosken N, et al. A conserved tripeptide sorts proteins to peroxisomes. J Cell Biol. 1989;108(5):1657–1664.
- Thieringer H, Moellers B, Dodt G, et al. Modeling human peroxisome biogenesis disorders in the nematode Caenorhabditis elegans. J Cell Sci. 2003;116(Pt 9):1797–1804.
- Edgar LG, McGhee JD. Embryonic expression of a gut-specific esterase in Caenorhabditis elegans. Dev Biol. 1986;114(1):109–118.
- Merritt C, Gallo CM, Rasoloson D, et al. Transgenic solutions for the germline. WormBook; 2010. p. 1–21. http://www.wormbook.org. doi:https://doi.org/10.1895/wormbook.1.148.1.
- Hansen M, Chandra A, Mitic LL, et al. A role for autophagy in the extension of lifespan by dietary restriction in C. elegans. PLoS Genet. 2008;4(2):e24.
- Takeshige K, Baba M, Tsuboi S, et al. Autophagy in yeast demonstrated with proteinase-deficient mutants and conditions for its induction. J Cell Biol. 1992;119(2):301–311.
- Gilleard JS, Barry JD, Johnstone IL. cis regulatory requirements for hypodermal cell-specific expression of the Caenorhabditis elegans cuticle collagen gene dpy-7. Mol Cell Biol. 1997;17(4):2301–2311.
- Tissenbaum HA. Using C. elegans for aging research. Invertebr Reprod Dev. 2015;59(sup1):59–63.
- Schafer WR. Egg-laying. WormBook; 2005. p. 1–7. http://www.wormbook.org. doi:https://doi.org/10.1895/wormbook.1.38.1.
- Opaliński Ł, Kiel JAKW, Williams C, et al. Membrane curvature during peroxisome fission requires Pex11. EMBO J. 2011;30:5–16.
- Mao K, Liu X, Feng Y, et al. The progression of peroxisomal degradation through autophagy requires peroxisomal division. Autophagy. 2014;10:652–661.
- Zhou B, Yang L, Li S, et al. Midlife gene expressions identify modulators of aging through dietary interventions. Proc Natl Acad Sci USA. 2012;109(19):E1201–E1209.
- Sweeney ST, Davis GW. Unrestricted synaptic growth in spinster - A late endosomal protein implicated in TGF-β-mediated synaptic growth regulation. Neuron. 2002;36(3):403–416.
- Narayan V, Ly T, Pourkarimi E, et al. Deep proteome analysis identifies age-related processes in C. elegans. Cell Syst. 2016;3(2):144–159.
- Zhang SO, Box AC, Xu N, et al. Genetic and dietary regulation of lipid droplet expansion in Caenorhabditis elegans. Proc Natl Acad Sci USA. 2010;107(10):4640–4645.
- Ashrafi K, Chang FY, Watts JL, et al. Genome-wide RNAi analysis of Caenorhabditis elegans fat regulatory genes. Nature. 2003;421(6920):268–272.
- Son HG, Altintas O, Kim EJE, et al. Age-dependent changes and biomarkers of aging in Caenorhabditis elegans. Aging Cell. 2019;18(2):e12853.
- Bohnert KA, Kenyon C. A lysosomal switch triggers proteostasis renewal in the immortal C. elegans germ lineage. Nature. 2017;551(7682):629–633.
- Goudeau J, Aguilaniu H. Carbonylated proteins are eliminated during reproduction in C. elegans. Aging Cell. 2010;9(6):991–1003.
- Jornayvaz FR, Shulman GI. Regulation of mitochondrial biogenesis. Essays Biochem. 2010;47:69–84.
- Evans T. Transformation and microinjection. WormBook; 2006. p. 1–15. http://www.wormbook.org. doi:https://doi.org/10.1895/wormbook.1.108.1.
- Kamath RS, Fraser AG, Dong Y, et al. Systematic functional analysis of the Caenorhabditis elegans genome using RNAi. Nature. 2003;421(6920):231–237.
- Han SK, Lee D, Lee H, et al. OASIS 2: online application for survival analysis 2 with features for the analysis of maximal lifespan and healthspan in aging research. Oncotarget. 2016;7(35):56147–56152.
- Bohnert KA. Staining the germline in live Caenorhabditis elegans: overcoming challenges by applying a fluorescent-dye feeding strategy. BIO-PROTOCOL. 2018;8(21):e3077.