
ABSTRACT
PINK1 accumulation at the outer mitochondrial membrane (OMM) is a key event required to signal depolarized mitochondria to the autophagy machinery. How this early step is, in turn, modulated by autophagy proteins remains less characterized. Here, we show that, upon mitochondrial depolarization, the proautophagic protein AMBRA1 is recruited to the OMM and interacts with PINK1 and ATAD3A, a transmembrane protein that mediates mitochondrial import and degradation of PINK1. Downregulation of AMBRA1 expression results in reduced levels of PINK1 due to its enhanced degradation by the mitochondrial protease LONP1, which leads to a decrease in PINK1-mediated ubiquitin phosphorylation and mitochondrial PRKN/PARKIN recruitment. Notably, ATAD3A silencing rescues defective PINK1 accumulation in AMBRA1-deficient cells upon mitochondrial damage. Overall, our findings underline an upstream contribution of AMBRA1 in the control of PINK1-PRKN mitophagy by interacting with ATAD3A and promoting PINK1 stability. This novel regulatory element may account for changes of PINK1 levels in neuropathological conditions.
Abbreviations: ACTB/β-actin: actin beta; AMBRA1: autophagy and beclin 1 regulator 1; ATAD3A: ATPase family AAA domain containing 3A; BCL2L1/BCL-xL: BCL2 like 1; CCCP: carbonyl cyanide m-chlorophenyl hydrazone; MAP1LC3/LC3: microtubule associated protein 1 light chain 3; OMA1: OMA1 zinc metallopeptidase; OMM: outer mitochondrial membrane; PARL: presenilin associated rhomboid like; PARP: poly(ADP-ribose) polymerase; PD: Parkinson disease; PINK1: PTEN induced kinase 1; PRKN/PARKIN: parkin RBR E3 ubiquitin protein ligase; SDHA: succinate dehydrogenase complex flavoprotein subunit A; TOMM70: translocase of outer mitochondrial membrane 70.
Introduction
Mitophagy is a selective form of autophagy that targets damaged or unnecessary mitochondria for lysosomal degradation, which is essential for survival, development and homeostasis [Citation1,Citation2]. To ensure mitochondria degradation, a series of events has to be coordinated: i) isolation of the target organelle from the mitochondrial network; ii) formation of autophagosomes in close proximity; iii) selective interaction of target mitochondria with autophagosomes membrane for engulfment [Citation3,Citation4].
Selective degradation is ensured by a series of cargo receptors that mediate the interaction of the outer mitochondria membrane (OMM) with autophagosome proteins of the mammalian Atg8 family, which differ depending on the type of stress stimuli [Citation5]. In hypoxic conditions, mitophagy receptors, such as the transmembrane proteins FUNDC1, BNIP3 and BNIP3L/NIX, accumulate on the OMM upon transcriptional upregulation [Citation6–8]. Similarly, BNIP3L expression is induced during erythrocyte maturation for mitochondrial clearance [Citation9,Citation10]. On the other hand, upon mitochondrial membrane depolarization or accumulation of misfolded proteins, the cytosolic cargo receptors OPTN (optineurin), SQSTM1/p62 and CALCOCO2/NDP52 are recruited to damaged mitochondria following an extensive ubiquitination of OMM proteins [Citation11]. An important role in this process is played by PINK1 and PRKN/PARKIN, two genes frequently mutated in familiar early onset forms of Parkinson disease (PD) [Citation2,Citation12,Citation13]. The protein kinase PINK1 rapidly accumulates on the OMM and mediates the recruitment and activation of the E3-ubiquitin ligase PRKN through phosphorylation of both ubiquitin chains and PRKN itself within its ubiquitin-like domain [Citation14–16]. Polyubiquitin chains newly synthesized by PRKN are then phosphorylated by PINK1 to recruit additional PRKN molecules and enhance mitochondrial ubiquitination in a feedforward mechanism [Citation17]. PRKN is also required for the exposure of mitochondrial proteins of internal compartments, such as PHB2 [Citation18], NIPSNAP1 and NIPSNAP2 [Citation19], which may also act as mitophagy receptors. Of note, ubiquitination of OMM proteins does not exclusively rely on PRKN, as other E3-ubiquitin ligases, such as MUL1, ARIH1, SIAH1, SMURF1 and AMFR/Gp78, cooperate with, or act alternatively to PRKN downstream of PINK1 [Citation3]. The function of the PINK1-PRKN axis is not limited to prime mitochondria for autophagosome engulfment but it also regulates mitochondrial fission and autophagy induction, by targeting mitofusins for proteasomal degradation [Citation20] and recruiting ULK1 and BECN1 (beclin 1) complexes, respectively [Citation11,Citation21].
The rapid accumulation of PINK1 on damaged mitochondria depends on the regulation of its stability [Citation22]. In healthy state, PINK1 is imported into mitochondria through the translocases located in the outer and inner membranes (TOMM and TIMM, respectively); here PINK1 is subsequently cleaved by the MPP and PARL proteases and then retro-translocated to the cytosol for proteasomal degradation [Citation23,Citation24]. Other factors involved in PINK1 import are SAMM50, a channel-forming protein of the sorting and assembly machinery complex, and ATAD3A, an OMM-IMM transmembrane AAA+ ATPase, whose depletion results in OMM accumulation of PINK1 even in the absence of mitochondrial depolarization [Citation25,Citation26]. Mitochondrial depolarization prevents PINK1 cleavage and rapidly stabilizes the protein on the TOMM complex, which facilitates intermolecular phosphorylation by assisting the assembly of PINK1 dimers [Citation27,Citation28]. Interestingly, when the interaction with the TOMM complex is perturbed, as in the case of TOMM7 downregulation, PINK1 is internalized and degraded by a different mitochondrial protease, named OMA1 [Citation29]. Other factors required for PINK1 stability in the OMM are IMMT/Mic60/Mitofilin, a core component of the mitochondrial contact site and cristae organizing system [Citation30], and PHB2, an IMM-resident membrane scaffold protein required to negatively regulate PARL activity [Citation31]. In addition to mitochondria depolarization, PINK1-PRKN-dependent mitophagy is induced during the mitochondrial unfolded protein response [Citation32]. In this context, PINK1 stabilization has been shown to be counteracted by the mitochondrial matrix protease LONP1.
AMBRA1, a positive regulator of ULK1- and BECN1-dependent autophagy [Citation33], has been reported to regulate both PINK1-PRKN-dependent and independent mitophagy [Citation34,Citation35]. AMBRA1 interacts with PRKN to induce mitophagy and promote cell survival in cellular models of dopaminergic cell death [Citation34,Citation36]. AMBRA1 also acts as mitophagy receptor by binding to MAP1LC3 following phosphorylation by CHUK/IKKα (component of inhibitor of nuclear factor kappa B kinase complex) [Citation37]. In addition, AMBRA1 mediates the proteasomal degradation of the anti-autophagic protein MCL1 and MFN2, by recruiting the E3-ubiquitin ligase HUWE1 to damaged mitochondria [Citation37,Citation38].
In keeping with its key role in mitophagy, recent evidence points to a potential involvement of AMBRA1 in PD pathogenesis. AMBRA1 associates with SNCA/α-synuclein and accumulates in Lewy bodies of PD human patients [Citation39]. AMBRA1 expression is reduced in the brain of both PD patients and a PD mouse model carrying a heterozygous mutation in the glucosylceramidase beta gene, a genetic risk factor for PD [Citation40]. AMBRA1 expression is inhibited by MIR103A-3p, a miRNA upregulated in a PD mouse model and in PD patients [Citation41].
These findings prompted us to investigate whether AMBRA1 may play a direct role in the regulation of PINK1- PRKN activity upon mitochondrial depolarization. Here, we show that AMBRA1 is required for PINK1-mediated phosphorylation of polyubiquitin chains by ensuring an efficient accumulation of PINK1 on damaged mitochondria. We also report that AMBRA1 physically interacts with PINK1 at the OMM, together with TOMM70 and with ATAD3A, a mitochondrial transmembrane protein that mediates PINK1 mitochondrial import and degradation. In absence of AMBRA1, PINK1 is not efficiently retained at OMM and becomes substrate of the mitochondrial protease LONP1.
Results
AMBRA1 is required for an efficient activation of PINK1-PRKN signaling upon mitochondrial depolarization
To investigate if AMBRA1 takes part in the early events of the PINK1-PRKN signaling pathway, we tested the levels of ubiquitin phosphorylation at Ser65 upon CCCP treatment, a PINK1-mediated post-translational modification essential for mitochondrial recruitment and activation of PRKN [Citation16]. SH-SY5Y and HeLa cells were transduced with control and Ambra1 short-harpin RNA (shRNA) lentiviruses and treated with CCCP for 2 h. Immunoblotting analysis showed that the increase of phospho-Ser65 ubiquitin levels is reduced when AMBRA1 expression is downregulated (). Moreover, we observed that this defect is associated to: i) a decrease of PRKN translocation to damaged mitochondria (), ii) a reduced autophagy flux, evaluated by analyzing both lipidated LC3 and SQSTM1/p62 levels in cells treated, or not, with a lysosomal inhibitor (), iii) an impaired mitochondrial degradation, monitored by analyzing VDAC and TOMM20 levels (Figure S1A).
Figure 1. AMBRA1 is required for an efficient activation of PINK1-PRKN signaling upon mitochondrial damage by CCCP. (A) Control shRNA, shAMBRA1a and shAMBRA1b SH-SY5Y cells (left panels) and control shRNA, shAMBRA1a and shAMBRA1b HeLa cells (right panels) were treated with CCCP for 2 h or left untreated. Phospho-UBIQUITIN (Ser65), UBIQUITIN and AMBRA1 levels were analyzed by immunoblotting. HSP90 was included as a loading control. (B) Mitochondrial fractions from control shRNA and shAMBRA1 SH-SY5Y cells were isolated as described in Methods and lysed in RIPA buffer. PRKN and AMBRA1 levels were analyzed by immunoblotting. OXPHOS-II SDHA and ACTB levels were included as markers of mitochondrial (M) and cytosol (C) fractions, respectively (upper). The graph (lower) reports means ± SD of PRKN:OXPHOS-II SDHA values of mitochondrial fractions from three independent experiments; *P < 0.05. A.U.: Arbitrary Units. (C) Control shRNA and shAMBRA1 SH-SY5Y cells were treated with CCCP for 2 h or left untreated. One hour before lysis, cells were incubated with the lysosome inhibitors bafilomycin A1, as indicated. LC3 levels were analyzed by immunoblotting (left). HSP90 was included as a loading control. The graph (right) reports means ± SD of LC3-II:HSP90 values from three independent experiments; *P < 0.05. A.U.: Arbitrary Units. (D) Control shRNA and shAMBRA1 SH-SY5Y cells were treated with CCCP for 16 h or left untreated. PARP and AMBRA1 levels were analyzed by immunoblotting. F.L.: Full Length. ACTB was included as a loading control (upper). The graph (lower) reports means ± SD of PARP CLEAVED:ACTB values from three independent experiments; ** P < 0.01. A.U.: Arbitrary Units.
Defective PINK1 activity was not restricted to ubiquitin, since we also observed a significant decrease of PINK1-mediated phosphorylation of BCL2L1/BCL-xL in SH-SY5Y and HeLa (Figure S1B and C), which is a key event for protecting BCL2L1 from caspase cleavage [Citation42]. Similar results were also obtained in PRKN-overexpressing HeLa cells, which were analyzed to assess if results were influenced by the lack of PRKN expression in this cell line (Figure S1D). Then, we evaluated how AMBRA1 deficiency affects the susceptibility to cell death following mitochondria damage. SH-SY5Y and HeLa cells were silenced for AMBRA1 expression, treated with CCCP for 16 and 24 h and apoptosis monitored by analyzing CASP (caspase)-mediated PARP cleavage. As shown in and S1E, cleaved PARP levels were greatly increased when AMBRA1 expression was downregulated confirming that the pro-survival autophagic response to mitochondria damage is impaired in the absence of AMBRA1.
Impaired stabilization of PINK1 protein upon mitochondrial depolarization in AMBRA1-deficient cells
To elucidate how inhibition of AMBRA1 expression affects ubiquitin phosphorylation at Ser65, we analyzed PINK1 levels in three cell lines, SH-SY5Y, HeLa and PRKN-overexpressing HeLa, stably silenced for AMBRA1 expression using specific shRNA lentiviruses. Notably, we observed that AMBRA1 downregulation results in a reduced stabilization of PINK1 following CCCP treatment (–C). These results were also confirmed in SH-SY5Y cells in which AMBRA1 expression was inhibited by transient transfection of specific RNA interference oligonucleotides (Figure S2A). Importantly, the impact of AMBRA1 silencing on the early steps of mitophagy was confirmed by analyzing PINK1 and phospho-Ser65 ubiquitin levels upon subcellular fractionation (). To verify if AMBRA1 regulates PINK1 stabilization at transcriptional or post-translational level, we assessed the impact of AMBRA1 downregulation in HeLa cells in which PINK1 was ectopically expressed by lentiviral infection. As shown in , overexpressed PINK1 showed a reduced accumulation when AMBRA1 expression is inhibited. Accordingly, PINK1 RNA levels were not significantly modulated in AMBRA1 silenced cells upon CCCP treatment (Figure S2B), suggesting that AMBRA1 controls PINK1 accumulation mainly at post-transcriptional levels.
Figure 2. Impaired stabilization of PINK1 protein in AMBRA1-downregulated cells. (A-C) SH-SY5Y (A), HeLa (B) and PRKN-overexpressing HeLa (C) cells were transduced with control shRNA or shAMBRA1 and treated with CCCP as indicated (h: hours), or left untreated. PINK1 and AMBRA1 levels were analyzed by immunoblotting. ACTB or HSP90 were included as loading controls. The accompanying graphs report means ± SD of normalized PINK1 values from three independent experiments; *P < 0.05, **P < 0.01. A.U.: Arbitrary Units. Densitometric analysis of AMBRA1 levels is reported below the corresponding panels. (D) Mitochondrial fractions from control shRNA and shAMBRA1 SH-SY5Y cells were isolated as described in methods and lysed in RIPA buffer. PINK1, phospho-UBIQUITIN (Ser65) and AMBRA1 levels were analyzed by immunoblotting. OXPHOS-II SDHA and ACTB levels were included as markers of mitochondrial (M) and cytosol (C) fractions, respectively (left). The graph (right) reports means ± SD of PRKN: SDHA values of mitochondrial fractions from three independent experiments; *P < 0.05. A.U.: Arbitrary Units. (E) HeLa cells were transduced with a lentivirus encoding for PINK1-HA and overexpression monitored by immunoblotting (upper panel). PINK1-HA overexpressing HeLa cells were transduced with control shRNA or shAMBRA1 and treated with CCCP for 2 h or left untreated. PINK1 and AMBRA1 levels were analyzed by immunoblotting (middle panel). HSP90 was included as a loading control. The accompanying graph reports means ± SD of PINK1:HSP90 values from three independent experiments; ** P < 0.01, *** P < 0.001 (lower panel). A.U.: Arbitrary Units. Densitometric analysis of AMBRA1 levels is reported below the corresponding panels. (F) Control shRNA and shAMBRA1a HeLa cells were transiently transfected with LONP1a, LONP1b siRNA or a scramble control siRNA, as indicated. 48 hours after transfection, cells were treated with CCCP for 2 h. PINK1 and AMBRA1 levels were analyzed by immunoblotting. ACTB was included as a loading control (left). The graph (right) reports means ± SD of PINK1:ACTB values from three independent experiments; *P < 0.05. A.U.: Arbitrary Units. Densitometric analysis of AMBRA1 levels is reported below the corresponding panels.
Deregulated degradation of PINK1 by LONP1 in AMBRA1-downregulated cells
In order to elucidate how PINK1 protein is degraded in AMBRA1-silenced cells, we assessed the effect of proteasomal and lysosomal inhibitors on PINK1 levels. As shown in Figure S2C and D, inhibition of proteasomal and lysosomal activity fails to prevent PINK1 degradation in AMBRA1-deficient HeLa cells. Interestingly, AMBRA1 inhibition reduced the levels of both full-length 63kD and PARL cleaved 52kD PINK1 isoforms, suggesting that PINK1 is degraded by a route alternative to that occurring in undamaged mitochondria. We confirmed this observation by analyzing PINK1 levels in shAMBRA1 HeLa cells upon PARL downregulation, which is not effective in preventing PINK1 degradation (Figure S2E). We then evaluated if PINK1 degradation is promoted by OMA1 and LONP1, two mitochondrial proteases reported to target PINK1 in addition to PARL [Citation23,Citation32]. shCTR and shAMBRA1 HeLa cells were transfected with LONP1 or OMA1 siRNAs and PINK1 levels analyzed by immunoblotting upon CCCP treatment. Notably, while OMA1 downregulation is not effective in rescuing PINK1 levels in AMBRA1 deficient cells (Figure S2F), PINK1 degradation is largely prevented when LONP1 expression is inhibited in CCCP-treated shAMBRA1 HeLa cells ().
AMBRA1 is associated to the ATAD3A-TOMM-PINK1 complex at the outer mitochondrial membrane
To elucidate how AMBRA1 can influence PINK1 stability in a LONP1-dependent manner, we analyzed if the two proteins interact with each other. SH-SY5Y cells were treated with CCCP for 2 h, lysed and protein extracts were subjected to immunoprecipitation with an anti-PINK1 antibody. Immunoblotting analysis of PINK1-copurified proteins revealed that AMBRA1 interacts with PINK1 ().
Figure 3. AMBRA1 associates to PINK1 and TOMM70 at the outer mitochondrial membrane upon mitochondria depolarization. (A) SH-SY5Y were treated with CCCP for 2 h and subjected to immunoprecipitation using an anti-PINK1 antibody. Immunopurified complexes were analyzed by immunoblotting using anti-AMBRA1 and anti-PINK1 antibodies. (B) SH-SY5Y cells were treated with CCCP for 2 h. Mitochondrial fractions, obtained as described in Methods, were subjected to a Proteinase K protection assay and AMBRA1 levels were analyzed by immunoblotting. TOMM20 and SDHA levels were included as markers of inner and outer mitochondrial proteins respectively. (C) SH-SY5Y cells were treated with CCCP for 1 or 2 h (h: hours) or left untreated. Mitochondrial fractions were purified and subjected to SDS-PAGE (upper) or Blue-Native assay (middle), respectively. PINK1 and AMBRA1 levels were analyzed by immunoblotting. SDHA and ACTB levels were included in the upper panel as markers of mitochondrial and cytosol fractions, respectively. The graph (lower) reports means ± SD of AMBRA1 levels in the Blue-Native assay from three independent experiments; *P < 0.05. A.U.: Arbitrary Units. (D) SH-SY5Y cells were treated with CCCP for 2 h or left untreated, lysed and subjected to immunoprecipitation using an anti-TOMM70 antibody. Immunopurified complexes were analyzed by immunoblotting using anti-AMBRA1 and anti-TOMM70 antibodies (left). The graph (right) reports means ± SD of AMBRA1 levels bound to TOMM70 from three independent experiments; *P < 0.05. A.U.: Arbitrary Units. (E) SH-SY5Y cells were treated with CCCP for 2 h or left untreated, lysed and subjected to immunoprecipitation using an anti-ATAD3A antibody. Immunopurified complexes were analyzed by immunoblotting using anti-AMBRA1 and anti-ATAD3A antibodies (left). The graph (right) reports means ± SD of AMBRA1 levels bound to TOMM70 from three independent experiments; *P < 0.05. A.U.: Arbitrary Units. (F) Control shRNA and shAMBRA1a HeLa cells were transiently transfected with ATAD3Aa, ATAD3Ab siRNA or a scramble control siRNA, as indicated. 48 h after transfection, cells were treated with CCCP for 2 h. PINK1 and AMBRA1 levels were analyzed by immunoblotting. ACTB was included as a loading control (left). The graph (right) reports means ± SD of PINK1:ACTB values from three independent experiments; *P < 0.05. Densitometric analysis of AMBRA1 levels is reported below the corresponding panel. A.U.: Arbitrary Units. (G) Scheme of the proposed role of AMBRA1 in PINK1 stabilization upon mitochondria damaged by CCCP (see the discussion section for details).
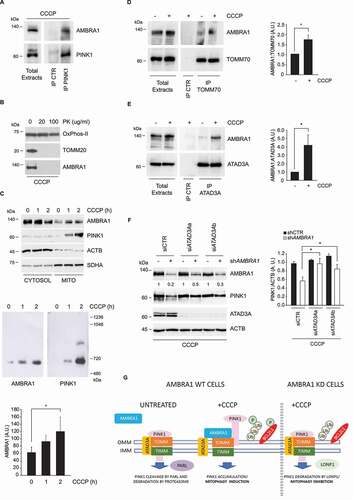
We then ruled out the possibility that AMBRA1 association could directly prevent PINK1 degradation by translocating inside the mitochondria where LONP1 is localized. As shown in , A protease protection assay showed that AMBRA1 only localizes on the outer membrane and it is not present inside the mitochondria.
PINK1 forms a 700-kDa complex with the translocase of the outer mitochondrial membrane selectively on depolarized mitochondria [Citation27]. We then asked whether AMBRA1 is also present in the PINK1-TOMM complex on mitochondrial membrane. To this aim, mitochondria were purified from untreated and CCCP-treated SH-SY5Y cells and membrane-associated protein complexes were separated by Blue Native Polyacrylamide Gel Electrophoresis and analyzed by immunoblotting analysis using AMBRA1 and PINK1 antibodies. Notably, upon CCCP treatment, AMBRA1 is rapidly recruited to a protein complex with an apparent molecular weight similar to that containing PINK1 (). To verify that AMBRA1 also associates with the TOMM complex, TOMM70 was immunoprecipitated in CCCP-treated SH SY5Y cells and the presence of AMBRA1 was detected by immunoblotting (). The recruitment of AMBRA1 to damaged mitochondria was further confirmed by confocal microscopy by analyzing both AMBRA1-PINK1 and AMBRA1-TOMM20 colocalization (Figure S3A and B).
Then, we attempted to elucidate the molecular mechanism by which AMBRA1 contributes to PINK1 stability by performing a mass spectrometry-based analysis of endogenous AMBRA1 interactome in HeLa cells upon mitochondria depolarization using stringent detergent condition. Neither PINK1 nor TOMM70 were identified as AMBRA1 interactors in this assay, suggesting that AMBRA1 indirectly associates with these proteins (Table S1). Among mitochondrial proteins, we observed that AMBRA1 stably associates with ATAD3A (Table S1), a mitochondrial transmembrane protein that favors PINK1 import and degradation in healthy mitochondria [Citation26]. AMBRA1-ATAD3A binding was confirmed in SH-SY5Y by coimmunoprecipitation, which also showed that their interaction is strongly increased upon mitochondria depolarization (). This finding suggests that AMBRA1 could regulate PINK1 import and degradation by binding and inhibiting ATAD3A function. To test this hypothesis, we assessed if ATAD3A down-regulation is sufficient to prevent PINK1 degradation in AMBRA1-deficient cells. Notably, we observed that PINK1 protein levels are rescued in CCCP-treated AMBRA1-silenced HeLa cells when ATAD3A expression is inhibited using two independent siRNAs (). Moreover, we found that PINK1 protein that accumulates in AMBRA1 ATAD3A double-silenced cells is functionally active, since we also detected that phospho-ubiquitin levels were largely rescued upon CCCP treatment (Figure S3C). Rescue of PINK1 levels in AMBRA1 ATAD3A double-silenced cells was also confirmed when the protein was analyzed following mitochondrial fractionation (Figure S3D).
Discussion
Initial evidence of a role of AMBRA1 in PINK1- PRKN regulated mitophagy was provided by Van Humbeeck and colleagues, who characterized the physical interaction of AMBRA1 with PRKN and its requirement for autophagosome formation upon mitochondrial damage [Citation34]. The potential role of AMBRA1 in the early steps of PINK1-PRKN-mediated mitophagy has remained less characterized. Here we show that, upon mitochondrial depolarization, AMBRA1 is rapidly recruited to OMM and interacts with an ATAD3A-TOMM-PINK1 complex to promote PINK1 protein accumulation (). Inhibition of AMBRA1 expression results in reduced PINK1 stability, which is associated to a decreased phosphorylation of both mitochondria-associated ubiquitin and BCL2L1, and consequent reduction of mitophagy induction and increase of apoptosis levels (). By inhibiting the expression of a series of proteases, we found that the decrease of PINK1 levels was due to an increased rate of degradation by the protease LONP1 ().
LONP1 is an AAA+ mitochondrial protease responsible for the protein quality control of the mitochondrial matrix, by degrading misfolded proteins and preventing their accumulation with harmful consequences for mitochondrial physiology [Citation43,Citation44]. In this context, it has been reported that the expression of unfolded proteins in the matrix causes the accumulation of PINK1, the mitochondrial translocation of PRKN and mitophagy induction [Citation32]. A more general role emerged in Drosophila melanogaster, where Lon (the LONP1 homolog) inactivation results in PINK1 accumulation in both OMM and matrix, suggesting that Lon protease promotes the import and degradation of PINK1 in unstressed conditions [Citation45]. Importantly, the inhibition of Lon expression does not decrease mitochondrial membrane potential or induce the activation of the mitochondrial unfolded protein stress response, indicating that PINK1 accumulation in Lon-deficient flies is not a secondary event to major mitochondrial alterations. Accordingly, our results suggest that LONP1 may contribute to PINK1 degradation when AMBRA1 is not recruited to OMM in depolarized mitochondria.
PINK1 stabilization on OMM upon membrane depolarization is emerging as a finely regulated event that relies on its interaction with the TOMM complex [Citation22]. How the mitochondrial import of PINK1 is inhibited upon membrane depolarization remains partially characterized. Recently, ATAD3A, a protein that controls mitochondrial dynamics at the interface of the inner and outer membranes [Citation46], was reported to contribute to PINK1 import and degradation by mediating the interaction between the TOMM and the TIMM23 complexes [Citation26]. How ATAD3A activity is modulated upon mitochondrial depolarization has not been investigated so far. Based on our results, we propose that AMBRA1 is rapidly recruited to damaged mitochondria to potentiate PINK1 stabilization by interacting with ATAD3A and inhibiting PINK1 translocation through the TOMM-TIMM complexes.
Interestingly, PRKN has also been reported to favor AMBRA1 translocation to damaged mitochondria [Citation34]. Defective PINK1 accumulation was also observed in AMBRA1-silenced HeLa cells, suggesting that PRKN is not required for promoting AMBRA1-mediated PINK1 accumulation. However, PRKN may contribute to potentiate this process by increasing the amount of mitochondrial AMBRA1, which, in turn, favors PINK1-mediated phosphorylation of ubiquitin required for PRKN activation, thus establishing a feed-forward loop to enforce mitophagy activation.
Taken together, our findings highlight a role of the proautophagic protein AMBRA1 in the regulation of PINK1 stability and provide novel insights in the molecular mechanisms that control mitophagy. Based on these results, it might be relevant to evaluate if alterations of AMBRA1 levels can contribute to the development of PD by contributing to PINK1 dysregulation.
Materials and methods
Cell culture
SH-SY5Y (ATCC, CRL-2266) and HeLa (ATCC, CRM-CCL-2) cells were cultured in Dulbecco’s modified Eagle’s medium (DMEM; Sigma-Aldrich, D6546), supplemented with 10% fetal bovine serum (Gibco, 10,270), 2 mM l-glutamine, and 1% penicillin-streptomycin solution (Sigma-Aldrich, G7513/P0781) at 37°C under 5% CO2. No cell lines used in this study were found in the database of commonly misidentified cell lines maintained by the International Cell Line Authentication Committee and National Center for Biotechnology Information biosample. Cells were screened for mycoplasma contamination by PCR (ABMgood, G238). To evaluate mitophagy, cells were treated with 20 μM Carbonyl cyanide m-chlorophenylhydrazone (CCCP; Sigma-Aldrich, C2759), in the presence or absence of 5 nM bafilomycin A1 (Sigma-Aldrich, B1793) or MG132 (Calbiochem, 474,790) for the indicated time.
Transfection and viral transduction
For retroviral production, confluent 293 gp/bsr (gag-pol/blasticidin S-resistant gene) packaging cells in a 10-cm dish were cotransfected with 15 μg of retroviral vectors and 5 μg of pCMV-VSV-G using the calcium phosphate method. For lentiviral production, confluent 293 T cells in a 10-cm dish were cotransfected with 10 μg of lentiviral vectors, 2.5 μg of pCMV-VSV-G (Addgene, 8454; deposited by Bob Weinberg) and 7.5 μg of psPAX2 (Addgene, 12,260; deposited by Didier Trono) plasmids by using the calcium phosphate method as previously described [Citation21]. After 48 h, the supernatant containing the retroviral or lentiviral particles was recovered, ultracentrifuged at 33,000 x g on an SW28 rotor for 2 h, and resuspended in 500 μl phosphate-buffered saline (Sigma-Aldrich, D8537-500ML) for 20 ml of supernatant. Cells were transduced with 600 μl of viral suspension in a medium supplemented with polybrene (4 μg/ml; Sigma-Aldrich, H9268-5 G) for 8 h. Two consecutive rounds of infections were performed to improve efficiency. For siRNA experiments, HeLa cells were transiently transfected with specific RNA oligonucleotides (Invitrogen) and Lipofectamine RNAimax (Invitrogen, 13,778,150), as indicated by the supplier. The sequences of siRNA used were as follows:
- OMA1a (Life Technologies, OMA1HSS174400)
- OMA1b (Life Technologies, OMA1HSS132977)
- LONP1a (Life Technologies, LONP1HSS190241)
- LONP1b (Life Technologies, LONP1HSS113888)
- PARLa (Life Technologies, PARLHSS124504)
- PARLb (Life Technologies, PARLHSS183079)
- AMBRA1a (Carlo Erba, CTM-14384 Ambra1-1)
- AMBRA1b (Carlo Erba, CTM-14385 Ambra1-2)
- ATAD3Aa (Life Technologies, ATAD3AHSS124129)
- ATAD3Ab (Life Technologies, ATAD3AHSS124130)
Plasmids
pLPCX plasmid encoding FLAG-AMBRA1 was previously described [Citation47]. pLPCX plasmid encoding PARKIN/PRKN was obtained by PCR amplification of PRKN ORF from pRK5-HA-Parkin (ADDGENE, 17,613; deposited by Ted Dawson) and cloning it in pLPCX. pBOB HA PINK1 has been described previously [Citation48]. For stable human AMBRA1 RNA interference, two lentiviral AMBRA1 shRNA–targeting pLKO.1 plasmids were used (Sigma-Aldrich, TRCN0000168652 and TRCN0000425683). A pLKO.1 containing a non-target shRNA was used as a negative control (Sigma-Aldrich, SHC016-1EA).
Antibodies
The primary antibodies used in this study were rabbit anti-LC3 (Cell Signaling Technology, 27755), mouse anti SQSTM1/p62 (Santa Cruz Biotechnology, sc-28359; D-3), rabbit anti-AMBRA1 (Millipore, ABC131), mouse anti–multi-ubiquitin (MBL International, ST1200), rabbit anti-phospho Ser65 ubiquitin (Cell Signaling Technology, 62802), mouse anti-HSP90 (Santa Cruz Biotechnology, sc-13119; F-8), mouse anti-GAPDH/glyceraldehyde-3-phosphate dehydrogenase (Millipore, CB1001), mouse anti-ACTB/β-actin (C4; Santa Cruz Biotechnology, sc-47778), rabbit anti-PINK1 (Cell Signaling Technology, 6946), mouse-anti PINK1 (8E10.1D6; Novus Biologicals NBP2-36488), rabbit anti-LONP1 (Novus, NBP-1-81734), rabbit anti-TOMM20 (Santa Cruz Biotechnology, sc-11415), mouse anti-TOMM20 (F10; Santa Cruz Biotechnology, sc-17764), mouse anti-TOMM70 (Santa Cruz Biotechnology, sc-39054), mouse anti-Ox-PhosII SDHA (Invitrogen, 459200), rabbit anti-ATAD3 (Abnova, H00055210-D01), mouse anti-ATAD3 (Santa Cruz Biotechnology, sc-376185), anti-VDAC/PORIN (MBL, JM-3594-100), mouse anti-BCL2L1/BCL-xL (Santa Cruz Biotechnology, sc-8392; H-5), rabbit anti-phospho Ser62 BCL2L1/BCL-xL (Origene, AP01538PU-N), rabbit anti-PARP (Cell Signaling Technology, 9542), mouse anti-PRKN/PARKIN (Cell Signaling Technology, 4211)
Immunoprecipitation and immunoblotting assays
Coimmunoprecipitation/immunoblotting experiments were performed by lysing cells in Tris buffer: 10 mM tris, pH 8.0, (Santa Cruz Biotechnology, sc-3715A), 150 mM NaCl (Sigma-Aldrich, S7653), 10% glycerol (Sigma-Aldrich, G7757), 0.5% NP-40 (Sigma-Aldrich, 56741). In the case of MS assay cells were lysed in RIPA buffer: 150 mM NaCl (Sigma-Aldrich, S7653), 1% NP-40 (Sigma-Aldrich, 56741), 0.5% deoxycholic acid (MP Biomedicals, 101496), 0.1% SDS (Sigma-Aldrich, L3771), 50 mM tris (pH 8.0) (Santa Cruz Biotechnology, sc-3715A), and 2 mM MgCl2 (Sigma-Aldrich, M8266). RIPA buffer was also used to lyse cells for immunoblotting assays. Lysis buffers were complemented with protease and phosphatase inhibitors: Protease Inhibitor Cocktail plus (Sigma-Aldrich, P8340), 5 mM sodium fluoride (Sigma-Aldrich, S-7920), 0.5 mM sodium orthovanadate (Sigma-Aldrich, S6508), 1 mM sodium molybdate (Sigma-Aldrich, S-6646), 50 mM 2-chloroacetamide (Sigma-Aldrich, C0267), 2 mM 1,10-phenanthroline monohydrate (Sigma-Aldrich, 320056), and 0.5 mM phenylmethylsulfonyl fluoride (Sigma-Aldrich, P7626). Coimmunoprecipitation was performed with 2 mg of protein extracts or 10 mg for MS assay. Protein extracts were incubated overnight with 2 μg of antibody, and immunocomplexes were recovered using 25 μl of protein G Sepharose (GE Healthcare, GE 17–1279-01). Immunocomplexes and protein total extracts were separated on SDS PAGE gels and electroblotted onto nitrocellulose (Whatman Amersham, 10600041) or PVDF (Millipore, IPVH20200) membranes. Blots were incubated with primary antibodies in 5% nonfat dry milk (Biosigma, 711160) or Bovine Serum Albumin (BSA) (Sigma-Aldrich, A9647) in PBS (Thermo Fisher Scientific, 18912–0149) plus 0.1% Tween-20 (Sigma-Aldrich, P1379) overnight at 4°C. Detection was achieved using horseradish peroxidase–conjugated secondary antibodies (anti-goat 705–036-147, anti-rabbit 711–036-152, and anti-mouse 715–036-150, Jackson ImmunoResearch Laboratories) and enhanced chemiluminescence (ECL, Immobilon Classico WBLUC0500 and Immobilon Crescendo Western HRP substrate WBLUR0500, Millipore). Signals were acquired using Amersham Hyperfilm ECL (GE Healthcare, 28–9068-37) or a ChemiDoc imaging system.
Immunoprecipitation and LC-MS/MS analysis
AMBRA1 interactome analyses were performed in HeLa, a cell type that allows to obtain protein extracts with a high yield of protein concentration. Immunocomplexes, purified in RIPA buffer as described above, were eluted twice with 0.5 M NH4OH (Sigma-Aldrich, 338818), 0.5 mM EDTA (443885 J, BDH). The first and second elutions of each immunoprecipitation were pooled, dried, resuspended in NH4HCO3, boiled at 95°C. Disulfide bonds were reduced and alkylated, respectively with 10 mM dithiothreitol at 56°C, and 55 mM iodoacetamide at RT. After precipitation with ethanol 100%, the samples were resuspended in ammonium bicarbonate 50 mM, 2 M urea and were digested by trypsin (0.2 μg/sample) at 37°C overnight. Then peptides were purified through the filter of a Zip-Tip (C-18 Resin, ZTC18S096, Millipore), eluted with 80% acetonitrile and 0.1% TFA, dried and resuspended in 2.5% acetonitrile, 0.1% TFA, 0.1% formic acid. The peptide mixture were analyzed by ultra-high performance liquid chromatography coupled with high resolution mass spectrometry using Thermo Scientific Q Exactive Plus Orbitrap; in particular, the peptides were separated by nano liquid chromatography (UltiMate 3000 RSLC nano-LC system, Thermo Fisher Scientific), loaded onto a 75-μm C18 column (Thermo Fisher Scientific, ES800), using a 100 min multistep gradient elution (from 4 to 90% eluent B with a constant flow of 0.3 μL/min), and were analyzed by Exactive Q plus mass spectrometer (Thermo Fisher Scientific). The raw data from the mass spectrometric analysis were processed using the MaxQuant software v.1.5.5.1. The proteomic analysis of AMBRA1 interactome was performed twice without carrying out technical replicates. Data were analyzed with the Perseus software v.1.6.12 to select proteins that were reproducibly identified to be associated with AMBRA1 upon CCCP treatment, as previously described [Citation49]. Analysis of biological processes associated to the identified interacting proteins and their subcellular localization was carried out with the GOTermMapper software (http://go.princeton.edu/cgi-bin/GOTermFinder). Network analysis of the identified interacting proteins was carried out with the STRING software [Citation50].
Mitochondria isolation, blue native and proteinase K assay
SH-SY5Y cells were scraped, resuspended in a fractionation buffer (0.25 M Saccarose, 10 mM HEPES, 1 mM EDTA) complemented with protease Protease Inhibitor Cocktail plus (Sigma-Aldrich, P8340) and 0.5 mM phenylmethylsulfonyl fluoride (Sigma-Aldrich, P7626) and homogenized with 100 strokes on ice using Teflon-glass Potter. Homogenized cells were centrifuged at 600 g for 10 min to isolate nucleus and at 11000 g for 30 min to isolate mitochondria. The mitochondria pellet obtained were lysed in RIPA buffer or TRIS buffer for immunoprecipitation. Mitochondria samples for blue native assay were prepared using NativePAGE Sample Prep Kit (Life Technologies, BN2008), according to the manufacturer’s recommendations, and loaded into NativePAGE Novex Bis-Tris Gels using NativePAGE Running Buffer (Life Technologies, BN2001), NativePAGE Cathode Additive (Life Technologies, BN2002) and NativeMark Protein Std (Life Technologies, P/N 57030). For proteinase K digestion assays, isolated mitochondria were incubated on ice for 10 min with 20 or 100 μg/ml Proteinase K (Sigma-Aldrich, P6556), followed by the addition of 1 mM PMSF for a further 10 min on ice.
Confocal microscopy
Cells were fixed with 4% paraformaldehyde (CARLO ERBA Reagents, 387507) in PBS followed by permeabilization with 0.2% Triton X-100 (Sigma-Aldrich, T9284) in PBS. Cells were then labeled with the primary antibody for 1 h at room temperature and visualized by means of Cy3 (jg715-156-150, Jackson ImmunoResearch) or Alexa Fluor 488 (A21206, Life Technologies) conjugated secondary antibodies. Coverslips were mounted in Prolong Gold antifade (P36935, Life Technologies) and examined under a confocal microscope (Leica TCS SP2). Digital images were acquired with the Leica software and the image adjustments and merging were performed by using the appropriated tools of ImageJ software. Quantification of colocalization, expressed in terms of Mander’s overlap coefficient, was calculated using the JacoP plugin of ImageJ software. A minimum of 20 cells per sample experimental condition were counted for triplicate samples per condition in each experiment.
Real-time PCR
Briefly, RNA was extracted by using a TRIzol reagent (Invitrogen, 15596–018). cDNA synthesis was generated using a reverse transcription kit (Promega, A3500), according to the manufacturer’s recommendations. qPCR reactions were performed with the Rotor-Gene 6000 (Corbett Research Ltd.) thermocycler. The Maxima SYBR Green/ROX qPCR Master Mix (Thermo Fisher Scientific, K0253) was used to produce fluorescently labeled PCR products during repetitive cycling of the amplification reaction, and the melting curve protocol was used to check for probe specificity, as described previously (30). The following primer sets for all amplicons were designed using the IDT PrimerQuest Tool:
- OMA1 Forward: TGGAGGATTACCAGCAAATG
- OMA1 Reverse: GGGCTTAGAGGATGCAATAC
- PARL Forward: GACAAGTGGTGAAGCATACA
- PARL Reverse: GCCTGTAAACCCAACAGTAA
- PINK1 Forward: CAAGAGGCTCAGCTACCTGCAC
- PINK1 Reverse: TGTCTCACGTCTGGAGGCACT
- L34 Forward: 5ʹ-GTCCCGAACCCCTGGTAATAG-3ʹ
- L34 Reverse: 5ʹ-GGCCCTGCTGACATGTTTCTT-3ʹ
Statistical analysis
Statistical analysis of immunoblotting and PCR data were performed using unpaired, two-tailed Student’s t test (Excel software). Values are shown as means ± SD of at least three independent experiments. P values <0.05 were marked by an asterisk. Densitometric analysis of immunoblots was performed using the Adobe Photoshop software. The control ratio was arbitrarily defined as 1.00. Normal distribution was assumed on the basis of the appearance of the data, since n < 5.
Supplemental Material
Download Zip (3.7 MB)Acknowledgments
This work was partially supported by grants from the Italian Ministry of University and Research (Ateneo Progetti di Ricerca Grandi, Sapienza RG120172B73EDDC5 and PRIN 2015 20152CB22L to GMF), Fondazione Fibrosi Cistica (Progetto FFC#8/2018 to MP), Regione Lazio (progetto “Gruppi di Ricerca” 2018 to MP), AIRC (IG2015 n. 17404 to GMF, and IG2018 no. 21880 to MP), the Russian Government Program for the Recruitment of the leading scientists into the Russian Institutions of Higher Education (14. W03.31.0029 to MP), Italian Ministry of Health - Ricerca Corrente to GMF, MP (IRCCS INMI L. Spallanzani) and EMV (IRCCS Mondino Foundation), CARIPLO Foundation (grant 2017-0575 to EMV) and Fonds National de Recherche de Luxembourg (FNR, MiRisk-PD, C17/BM/11676395 to GA).
Disclosure statement
The authors declare no competing interests.
Supplementary material
Supplemental data for this article can be accessed here
Additional information
Funding
Related Research Data
References
- Killackey SA, Philpott DJ, Girardin SE. Mitophagy pathways in health and disease. J Cell Biol. 2020;219. DOI:https://doi.org/10.1083/jcb.202004029
- Pickrell AM, Youle RJ. The roles of PINK1, parkin, and mitochondrial fidelity in Parkinson’s disease. Neuron. 2015;85:257–273.
- Palikaras K, Lionaki E, Tavernarakis N. Mechanisms of mitophagy in cellular homeostasis, physiology and pathology. Nat Cell Biol. 2018;20:1013–1022.
- Pickles S, Vigie P, Youle RJ. Mitophagy and quality control mechanisms in mitochondrial maintenance. Curr Biol. 2018;28:R170–R185.
- Gatica D, Lahiri V, Klionsky DJ. Cargo recognition and degradation by selective autophagy. Nat Cell Biol. 2018;20:233–242.
- Liu L, Feng D, Chen G, et al. Mitochondrial outer-membrane protein FUNDC1 mediates hypoxia-induced mitophagy in mammalian cells. Nat Cell Biol. 2012;14:177–185.
- Ney PA. Mitochondrial autophagy: origins, significance, and role of BNIP3 and NIX. Biochim Biophys Acta. 2015;1853:2775–2783.
- Novak I, Kirkin V, McEwan DG, et al. Nix is a selective autophagy receptor for mitochondrial clearance. EMBO Rep. 2010;11:45–51.
- Sandoval H, Thiagarajan P, Dasgupta SK, et al. Essential role for nix in autophagic maturation of erythroid cells. Nature. 2008;454:232–235.
- Schweers RL, Zhang J, Randall MS, et al. NIX is required for programmed mitochondrial clearance during reticulocyte maturation. Proc Natl Acad Sci U S A. 2007;104:19500–19505.
- Lazarou M, Sliter DA, Kane LA, et al. The ubiquitin kinase PINK1 recruits autophagy receptors to induce mitophagy. Nature. 2015;524:309–314.
- Narendra D, Tanaka A, Suen DF, et al. Parkin is recruited selectively to impaired mitochondria and promotes their autophagy. J Cell Biol. 2008;183:795–803.
- Narendra DP, Jin SM, Tanaka A, et al. PINK1 is selectively stabilized on impaired mitochondria to activate parkin. PLoS Biol. 2010;8:e1000298.
- Kane LA, Lazarou M, Fogel AI, et al. PINK1 phosphorylates ubiquitin to activate parkin E3 ubiquitin ligase activity. J Cell Biol. 2014;205:143–153.
- Kazlauskaite A, Kondapalli C, Gourlay R, et al. Parkin is activated by PINK1-dependent phosphorylation of ubiquitin at Ser65. Biochem J. 2014;460:127–139.
- Koyano F, Okatsu K, Kosako H, et al. Ubiquitin is phosphorylated by PINK1 to activate parkin. Nature. 2014;510:162–166.
- Ordureau A, Sarraf SA, Duda DM, et al. Quantitative proteomics reveal a feedforward mechanism for mitochondrial PARKIN translocation and ubiquitin chain synthesis. Mol Cell. 2014;56:360–375.
- Wei Y, Chiang WC, Sumpter R Jr, et al. Prohibitin 2 is an inner mitochondrial membrane mitophagy receptor. Cell. 2017;168:224–238.e10.
- Princely Abudu Y, Pankiv S, Mathai BJ, et al. NIPSNAP1 and NIPSNAP2 act as “eat me” signals for mitophagy. Dev Cell. 2019;49:509–525.e12.
- Tanaka A, Cleland MM, Xu S, et al. Proteasome and p97 mediate mitophagy and degradation of mitofusins induced by parkin. J Cell Biol. 2010;191:1367–1380.
- Gelmetti V, De Rosa P, Torosantucci L, et al. PINK1 and BECN1 relocalize at mitochondria-associated membranes during mitophagy and promote ER-mitochondria tethering and autophagosome formation. Autophagy. 2017;13:654–669.
- Sekine S, Youle RJ. PINK1 import regulation; a fine system to convey mitochondrial stress to the cytosol. BMC Biol. 2018;16:2–017-0470-7.
- Jin SM, Lazarou M, Wang C, et al. Mitochondrial membrane potential regulates PINK1 import and proteolytic destabilization by PARL. J Cell Biol. 2010;191:933–942.
- Greene AW, Grenier K, Aguileta MA, et al. Mitochondrial processing peptidase regulates PINK1 processing, import and parkin recruitment. EMBO Rep. 2012;13:378–385.
- Jian F, Chen D, Chen L, et al. Sam50 regulates PINK1-parkin-mediated mitophagy by controlling PINK1 stability and mitochondrial morphology. Cell Rep. 2018;23:2989–3005.
- Jin G, Xu C, Zhang X, et al. Atad3a suppresses Pink1-dependent mitophagy to maintain homeostasis of hematopoietic progenitor cells. Nat Immunol. 2018;19:29–40.
- Lazarou M, Jin SM, Kane LA, et al. Role of PINK1 binding to the TOM complex and alternate intracellular membranes in recruitment and activation of the E3 ligase parkin. Dev Cell. 2012;22:320–333.
- Okatsu K, Uno M, Koyano F, et al. A dimeric PINK1-containing complex on depolarized mitochondria stimulates parkin recruitment. J Biol Chem. 2013;288:36372–36384.
- Sekine S, Wang C, Sideris DP, et al. Reciprocal roles of Tom7 and OMA1 during mitochondrial import and activation of PINK1. Mol Cell. 2019;73:1028–1043.e5.
- Akabane S, Uno M, Tani N, et al. PKA regulates PINK1 stability and parkin recruitment to damaged mitochondria through phosphorylation of MIC60. Mol Cell. 2016;62:371–384.
- Yan C, Gong L, Chen L, et al. PHB2 (prohibitin 2) promotes PINK1-PRKN/Parkin-dependent mitophagy by the PARL-PGAM5-PINK1 axis. Autophagy. 2020;16:419–434.
- Jin SM, Youle RJ. The accumulation of misfolded proteins in the mitochondrial matrix is sensed by PINK1 to induce PARK2/Parkin-mediated mitophagy of polarized mitochondria. Autophagy. 2013;9:1750–1757.
- Antonioli M, Di Rienzo M, Piacentini M, et al. Emerging mechanisms in initiating and terminating autophagy. Trends Biochem Sci. 2017;42:28–41.
- Van Humbeeck C, Cornelissen T, Hofkens H, et al. Parkin interacts with Ambra1 to induce mitophagy. J Neurosci. 2011;31:10249–10261.
- Strappazzon F, Nazio F, Corrado M, et al. AMBRA1 is able to induce mitophagy via LC3 binding, regardless of PARKIN and p62/SQSTM1. Cell Death Differ. 2015;22:419–432.
- Di Rita A, D’Acunzo P, Simula L, et al. AMBRA1-mediated mitophagy counteracts oxidative stress and apoptosis induced by neurotoxicity in human neuroblastoma SH-SY5Y cells. Front Cell Neurosci. 2018;12:92.
- Di Rita A, Peschiaroli AD, Acunzo P, et al. HUWE1 E3 ligase promotes PINK1/PARKIN-independent mitophagy by regulating AMBRA1 activation via IKKalpha. Nat Commun. 2018;9: 3755-018-05722-3.
- Strappazzon F, Di Rita A, Peschiaroli A, et al. HUWE1 controls MCL1 stability to unleash AMBRA1-induced mitophagy. Cell Death Differ. 2020;27:1155–1168.
- Miki Y, Tanji K, Mori F, et al. Alteration of upstream autophagy-related proteins (ULK1, ULK2, Beclin1, VPS34 and AMBRA1) in Lewy body disease. Brain Pathol. 2016;26:359–370.
- Li H, Ham A, Ma TC, et al. Mitochondrial dysfunction and mitophagy defect triggered by heterozygous GBA mutations. Autophagy. 2019;15:113–130.
- Zhou J, Zhao Y, Li Z, et al. miR-103a-3p regulates mitophagy in Parkinson’s disease through Parkin/Ambra1 signaling. Pharmacol Res. 2020;160:105197.
- Arena G, Gelmetti V, Torosantucci L, et al. PINK1 protects against cell death induced by mitochondrial depolarization, by phosphorylating bcl-xL and impairing its pro-apoptotic cleavage. Cell Death Differ. 2013;20:920–930.
- Gibellini L, De Gaetano A, Mandrioli M, et al. The biology of Lonp1: more than a mitochondrial protease. Int Rev Cell Mol Biol. 2020;354:1–61.
- Quiros PM, Langer T, Lopez-Otin C. New roles for mitochondrial proteases in health, ageing and disease. Nat Rev Mol Cell Biol. 2015;16:345–359.
- Thomas RE, Andrews LA, Burman JL, et al. PINK1-parkin pathway activity is regulated by degradation of PINK1 in the mitochondrial matrix. PLoS Genet. 2014;10:e1004279.
- Gilquin B, Taillebourg E, Cherradi N, et al. The AAA+ ATPase ATAD3A controls mitochondrial dynamics at the interface of the inner and outer membranes. Mol Cell Biol. 2010;30:1984–1996.
- Di Rienzo M, Antonioli M, Fusco C, et al. Autophagy induction in atrophic muscle cells requires ULK1 activation by TRIM32 through unanchored K63-linked polyubiquitin chains. Sci Adv. 2019;5:eaau8857.
- Silvestri L, Caputo V, Bellacchio E, et al. Mitochondrial import and enzymatic activity of PINK1 mutants associated to recessive parkinsonism. Hum Mol Genet. 2005;14:3477–3492.
- Tyanova S, Temu T, Sinitcyn P, et al. The perseus computational platform for comprehensive analysis of (prote)omics data. Nat Methods. 2016;13:731–740.
- Szklarczyk D, Gable AL, Lyon D, et al. STRING v11: protein-protein association networks with increased coverage, supporting functional discovery in genome-wide experimental datasets. Nucleic Acids Res. 2019;47:D607–D613.