
ABSTRACT
Compelling evidence has demonstrated that macroautophagy/autophagy plays an important role in regulating multiple steps of metastatic cascades; however, the precise role of autophagy in metastasis remains unclear. This study demonstrates that autophagy inhibition induced by MCOLN1/TRPML1 suppresses cancer metastasis by evoking the ROS-mediated TP53/p53 pathway. First, we found that MCOLN1-mediated autophagy inhibition not only profoundly inhibits both migration and invasion in malignant melanoma and glioma cell lines in vitro, but also suppresses melanoma metastasis in vivo. Second, our study reveals that autophagy inhibition induced by MCOLN1 leads to damaged mitochondria accumulation followed by large quantities of ROS release. Third, we demonstrate that the elevated ROS resulting from autophagy inhibition subsequently triggers TP53 activity, which in turn modulates expression of its downstream targets that are involved in a broad spectrum of the metastatic cascade to suppress metastasis including MMP members and TWIST. In summary, our findings have established a mechanism by which autophagy inhibition suppresses metastasis via the ROS-TP53 signaling pathway. More importantly, our study demonstrates that autophagy inhibition through stimulation of MCOLN1 could evidently be one of the therapeutic potentials for combating cancer metastasis.
Abbreviations: 3-MA: 3-methyladenine; AA: amino acid; ATG5: autophagy related 5; ATG12: autophagy-related 12; Baf-A1: bafilomycin A1; CCCP: carbonyl cyanide m-chlorophenylhydrazone; CQ: chloroquine; DMEM: Dulbecco’s Modified Eagle Medium; EMT: epithelial–mesenchymal transition; FBS: fetal bovine serum; GAPDH: glyceraldehyde-3-phosphate dehydrogenase; HEK: human embryonic kidney; LAMP1: lysosomal-associated membrane protein 1; MAP1LC3/LC3: microtubule-associated protein 1 light chain 3; MCOLN1/TRPML1: mucolipin TRP cation channel 1; MMP: matrix metallopeptidase; NC: negative control; NRK: normal rat kidney; PBS: phosphate-buffered saline; shRNA: short hairpin RNA; siRNA: short interfering RNA; SQSTM1/p62: sequestosome 1; ULK1: unc-51 like autophagy-activating kinase 1.
Introduction
Although cancer metastasis is the primary cause of mortality in cancer patients, effective therapeutic strategies targeting the prevention of metastasis remain limited [Citation1]. Macroautophagy/autophagy, a conserved catabolic process, plays a critical role in each step of the metastatic cascade [Citation2–4] including local invasion [Citation5–7], intravasation [Citation8,Citation9], vasculation [Citation10,Citation11], extravasation [Citation12], and colonization [Citation13]. However, the precise outcome of autophagy on metastasis is still unclear as autophagy has been reported to have both pro- and anti-metastasis properties depending on the circumstances [Citation3]. It is possible that the long-time controversy could be partly due to the lack of specific autophagy manipulators. Although there are several commonly used autophagy manipulators including chloroquine (CQ), hydroxychloroquine (HCQ), and bafilomycin A1 (Baf-A1), the specific targets for these modulators and effects on regulating autophagy are not fully understood. Furthermore, some of these autophagy manipulators’ effects on tumorigenesis result from the modulation of pathways other than modifying autophagy per se [Citation14,Citation15]. Thus, it is essential that we study the relationship between autophagy and metastasis using specific autophagy manipulators.
MCOLN1/TRPML1 is a nonselective cation channel localized in the lysosome [Citation16]. It maintains lysosomal functions and cellular homeostasis by participating in a wide spectrum of cellular responses including autophagy [Citation17]. In particular, the activation of MCOLN1 specifically inhibits autophagy by disrupting fusion between autophagosomes and lysosomes and significantly suppresses growth of pancreatic xenograft tumors in mice [Citation18]. We have taken advantage of specific agonists and antagonists of MCOLN1 to precisely manipulate autophagy, thus enabling us to define the role of autophagy in regulating cancer metastasis.
In this study, we have systematically determined outcome as well as machinery of autophagy inhibition in regulating metastasis by modifying MCOLN1 activity. We found that autophagy inhibition induced by MCOLN1 markedly suppresses the metastasis process of malignant melanoma and glioma both in vitro and in vivo. More importantly, we discovered a novel machinery that integrates autophagy inhibition and its downstream effector, TP53/p53, whose activity in turn transactivates the expressions of downstream targets involved in multiple steps of the metastatic cascade. Autophagy inhibition induced by MCOLN1 results in damaged mitochondria accumulation and resultant reactive oxygen species (ROS) elevation by disrupting mitochondria turnover. The elevated ROS levels subsequently drive TP53 activity to modulate its downstream effectors that are fully involved in metastatic progression including factors related to epithelial–mesenchymal transition (EMT) and matrix metallopeptidase (MMP) proteins, presumably also factors related to other steps in the cascade beyond the scope of this study such as motility, anoikis, and cancer cell stemness. These results have broadened our knowledge and understanding of the roles of autophagy not only in cancer metastasis, but also in other physiological and pathological functions in which TP53 has been implicated in. MCOLN1, a lysosomal ion channel, exhibits great potentials in inhibiting cancer progression and could be targeted when developing the next generation of medications used to treat cancer.
Results
Activation of MCOLN1 inhibits autophagy in malignant melanoma and glioma cells.
Our previous study has demonstrated that the activation of MCOLN1 channels inhibits autophagy in several cell lines such as HeLa, HEK 293T, HAP1, normal rat kidney (NRK), pancreatic cancer, breast cancer, and gastric cancer cells [Citation18]. To investigate the potential contribution of MCOLN1 on the cancer metastasis process, two invasive cancer cell lines commonly used in metastatic studies, A-375 (a human malignant melanoma cell line bearing wild-type TP53 [Citation19]) and U-87 MG (a wild-type TP53-expressing human glioblastoma cell line [Citation20]), were used [Citation21,Citation22]. First, to identify the inhibitory effect of MCOLN1 on autophagy in these two cell lines, we monitored the changes in MAP1LC3/LC3 and SQSTM1/p62 proteins, which are two important parameters of autophagy [Citation23]. Following 4 h of treatments with ML-SA5 (5 µM), a specific MCOLN1 agonist [Citation18,Citation24], LC3-II protein levels were significantly increased in A-375 and U-87 MG cells (). In contrast to the reduction in SQSTM1 protein levels induced by treatment with the activator of autophagy, rapamycin (50 µM) [Citation25], ML-SA5 treatment (5 µM) significantly increased SQSTM1 levels in A-375 and U-87 MG cells (). Furthermore, the increase in LC3-II and SQSTM1 following ML-SA5 treatment was completely inhibited by the co-application of ML-SI3 (20 µM; ), a specific antagonist of MCOLN1 [Citation18,Citation26]. These results observed in A-375 and U-87 MG cells suggest that activation of MCOLN1 also inhibits autophagy in a similar fashion in these two cell lines compared to the aforementioned cell lines [Citation18].
Figure 1. Activation of MCOLN1 inhibits autophagy in A-375 and U-87 MG cells. (A) Both LC3-II and SQSTM1 protein levels were significantly increased by ML-SA5 treatment (5 µM; 4 h) and the increase in LC3-II and SQSTM1 was abolished by the co-application of ML-SI3 (20 µM) in A-375 and U-87 MG cells. Rapamycin (50 µM) served as a positive control for assessing autophagic flux. LC3-II and SQSTM1 levels under the conditions indicated were normalized to GAPDH. n = 3–4. (B) Representative confocal images showing that ML-SA5 application (5 µM for 4 h; middle panels) induced overt LC3 puncta structures in transiently GFP-LC3-expressing A-375 or U-87 MG cells, while LC3 displayed diffused pattern under control conditions (upper panels). Co-application of ML-SI3 (20 µM) significantly inhibited LC3 puncta structures induced by ML-SA5 treatment (bottom panels). Scale bar: 10 µm. Statistical analysis of LC3 puncta in A-375 and U-87 MG cells, under the conditions indicated, were quantified in 5–12 cells from at least three independent experiments. (C) Abundance of LC3 puncta as reflected by GFP and RFP fluorescence in transiently expressed tandem GFP-RFP-LC3 A-375 cells under the control, ML-SA5 (5 µM), ML-SA5 (5 µM) + ML-SI3 (20 µM), starvation (FBS and AA free), and ML-SI3 (20 µM). The arrows indicate red puncta only. All treatments were for 4 h. Scale bar: 10 µm. Starvation was used as a positive control for inducing autophagy. (D) The numbers of total (autophagosomes) and red only puncta (autolysosomes) and ratio of autolysosomes to autophagosomes were quantified from 5–8 experiments (typically n = 51–58 cells) under the conditions indicated in C. (E) Representative confocal images showing that in comparison to rapamycin treatment (50 µM, bottom panels), most green puncta induced by ML-SA5 (5 µM) in GFP-LC3-expressing A-375 cells were adjacent to, but not fused to lysosomes stained by LysoTracker (arrows; middle panels). Co-application of ML-SI3 (20 µM) abolished abundance of LC3 puncta resulted from ML-SA5 treatment in transiently expressed GFP-LC3 A-375 cells. Scale bar: 10 µm. Means ± SEMs are shown in panels A, B, and D. Significant differences were evaluated using one-way ANOVA followed by Tukey’s test. *P < 0.05; **P < 0.01; ***P < 0.001.
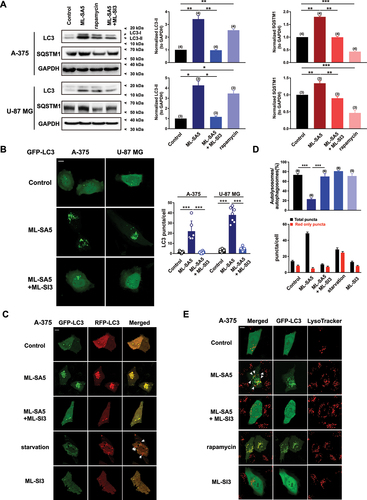
Consistent with the changes in LC3-II protein levels, GFP-LC3 puncta structures, which indicate the accumulation of autophagosomes, were significantly induced by ML-SA5 treatment (5 µM for 4 h) in GFP-LC3 transiently expressed A-375 cells or U-87 MG cells (middle panels in ), and the abundance of LC3 puncta structures following ML-SA5 treatment were significantly reduced with the co-application of ML-SI3 (20 µM; bottom panels in ), while GFP-LC3 exhibited diffused pattern under the control conditions in both cell lines (upper panels in ).
To dynamically track the autophagic flux regulated by ML-SA5 treatment, we introduced a tandem GFP-RFP-LC3 plasmid into A-375 cells. Under the starvation condition [amino acid (AA) and fetal bovine serum (FBS) free for 4 h], a greater number of red puncta (RFP-LC3) than green puncta (GFP-LC3) were induced in GFP-RFP-LC3 transiently expressed A-375 cells (,D), suggesting that autophagic flux is activated following starvation (GFP-LC3 puncta were quenched by acidic lysosomes during effective fusion between autophagosomes and lysosomes). This validates the assay for accurately monitoring autophagic flux. In this assay, application of ML-SA5 (5 µM for 4 h) counteracted the effect of starvation and resulted in an equal number of red and green puncta (). Moreover, co-application of ML-SI3 (20 µM) significantly inhibited the abundance of LC3 puncta structures in these GFP-RFP-LC3 transiently expressed A-375 cells, while ML-SI3 application alone did not induce overt LC3 puncta structures (, D). These results confirmed that the effects of ML-SA5 treatment on regulating autophagy in melanoma cells are delivered by its mediation on MCOLN1. Supporting our western blot data presented in , these imaging data demonstrate that autophagic flux is blocked by the activation of MCOLN1 in A-375 and U-87 MG cells, as reported previously in HeLa, Patu 8988t (a human pancreatic cancer cell line), MCF-7 (a human breast cancer cell line) cells, etc. [Citation18].
To further determine whether the activation of MCOLN1 blocks autophagic flux by interrupting the fusion between autophagosomes and lysosome in A-375 cells as in the aforementioned cell types [Citation18], we assessed the co-localization of GFP-LC3 puncta and lysosomes in the presence of ML-SA5 treatment in transiently GFP-LC3-expressing A-375 cells. As expected, unlike the rapamycin treatment (50 µM for 4 h; ) in which fusion between autophagosomes and lysosome was not blocked [Citation27,Citation28], most of the LC3 puncta were adjacent to (arrows), but not fused to lysosomes stained by LysoTracker (). This is indicative of disrupted fusion between autophagosomes and lysosomes by the ML-SA5 treatment. Furthermore, co-application of ML-SI3 (20 µM) inhibited the abundance of LC3 puncta structures caused by ML-SA5 treatment in GFP-LC3 transiently expressed A-375 cells (). In addition to this, ML-SA5 treatment was prone to increase lysosomal digestive capability at higher concentration (5 µM), while having little effects on the capability at lower concentrations (1 µM) in A-375 cells, as evaluated using a DQ-BSA assay [Citation26] (Figure S1). Thus, the DQ-BSA results excluded the possibility that the activation of MCOLN1 inhibits autophagy by affecting lysosomal functions.
Collectively, these results indicate that activation of MCOLN1 inhibits autophagy in malignant melanoma and glioblastoma cells by disrupting fusion between autophagosomes and lysosomes as in other types of cancer cells [Citation18].
Autophagy inhibition induced by MCOLN1 triggers cell death in malignant melanoma and glioma by evoking apoptosis, cell cycle arrest, and ROS elevation
Our previous study has identified that MCOLN1-mediated autophagy inhibition triggers cell death by inducing apoptosis in several cancer cell lines of pancreatic cancer, gastric cancer, and breast cancer cells [Citation18]. To explore the role of MCOLN1-mediated autophagy inhibition in cell death of malignant melanoma and glioma cells, we examined cell viability of A-375 and U-87 MG cells in response to the ML-SA5 application. Following ML-SA5 application (5 µM) for 48 h and longer periods, overt cell death was triggered in A-375 and U-87 MG cells (Figures S2A,B and S3A,B). These results demonstrate that autophagy inhibition induced by MCOLN1 is lethal to melanoma and glioma cells as to other types of cancer cells, even though both A-375 and U-87 MG cells were less sensitive to ML-SA5 than Patu 8988t cells (a human pancreatic cancer cell line) [Citation18].
Next, we used two approaches of blocking autophagy initiation either with 3-MA or by the genetic knockdown of ATG5 to further investigate if the suppressive effects on cell death in cancer cells by ML-SA5 treatment were delivered through autophagy process. Blocking autophagy initiation by pretreating cells with 3-methyladenine (3-MA; 10 mM for 2 h) [Citation18] attenuated the lethal effects of ML-SA5 on these two cell lines (Figures S2F and 3F). Likewise, disrupting autophagy initiation by knocking down of ATG5 genes [Citation29] (Figures S2G and 3G) abolished the cell death in A-375 cells or U-87 MG cells triggered by the treatment of ML-SA5 (5 µM for 48 h; Figures S2H and 3H). This set of experiments indicates that the primary cause of cell death in A-375 and U-87 MG cells triggered by the treatment of ML-SA5 is through the autophagy process. Furthermore, following the inhibition of autophagy by MCOLN1, the subsequent induction of both apoptosis (Figures S2C and 3C) and cell cycle arrest (Figures S2D and 3D) directly led to the cell death in A-375 and U-87 MG cells (Figures S2F and 3F), which is consistent with our findings observed in other cancer cell types [Citation18]. Interestingly, in addition to induction of both apoptosis and cell cycle arrest, ROS levels were significantly elevated following ML-SA5 treatment (5 µM for 48 h) in A-375 and U-87 MG cells (Figures S2E and 3E), as assessed by flow cytometry assay. Moreover, co-application of the antioxidant reagent, N-acetyl-L-cysteine (NAC; 5 mM), rescued the cell death triggered by ML-SA5 treatment in these cells (Figures S2F and 3F).
Overall, we confirmed the lethal effects of MCOLN1-mediated autophagy inhibition on malignant melanoma and glioma cell lines, and that the mechanism through which MCOLN1 stimulation triggers cell death is similar in the different cancer cell lines we examined.
MCOLN1-mediated autophagy inhibition suppresses migration and invasion of malignant melanoma and glioma cells in vitro
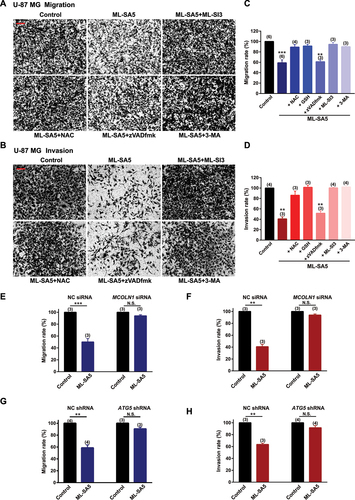
After we confirmed the MCOLN1-mediated autophagic inhibitory effects on growth of malignant melanoma and glioma cells, we systematically explored the effects of autophagy inhibition mediated by MCOLN1 on the cancerous cell metastasis. Strikingly, ML-SA5 treatments (5 µM) significantly reduced both the migration and invasion of A-375 cells (–D) or U-87 MG cells (–D), as assessed using transwell assay (see methods for details) and wound healing assay (Figure S4A,B). Application of a lower concentration of ML-SA5 at 1 µM also significantly suppressed the migration and invasion in both A-375 (Figure S4C) and U-87 MG (Figure S4D) cells. To further confirm that autophagy inhibition represents a general approach for suppressing cancer metastasis, we induced autophagy inhibition by using two common autophagy inhibitors including CQ and Baf-A1 or by overexpression of Rab7-T22N, a dominant-negative mutant of Rab7 [Citation30,Citation31]. Treatment with either CQ (10 µM) or Baf-A1 (1 µM) or overexpression of Rab7-T22N resulted in significant suppression on migration and invasion in A-375 and U-87 MG cells (Figure S4C–E). Taken together, these results suggest there is a great potential that targeting autophagy inhibition is a general therapeutic approach to suppress cancer metastasis.
Figure 2. Autophagy inhibition by MCOLN1 profoundly suppresses migration and invasion of A-375 cells. (A, B) Representative images showing that migrated (A) or invaded (B) A-375 cells stained with 0.5% crystal violet solution, under the control, ML-SA5 (5 µM), ML-SA5 + ML-SI3 (20 µM), ML-SA5 + NAC (5 mM), ML-SA5 + zVADfmK (20 µM), and ML-SA5 + pretreatment of 3-MA (10 mM for 2 h), as evaluated using transwell assays. All treatments were for 16–24 h. Scale bar: 1 cm. (C, D) Migration rate (OD600x is normalized to OD600control) (C) and invasion rate (D) of A-375 cells were summarized under different conditions indicated. n = 3–7. (E, F) Comparison of migration rate (E) or invasion rate (F) of A-375 cells between the control and ML-SA5 treatment (5 µM) in groups transfected with negative control (NC) siRNA or MCOLN1 siRNA. n = 3–4. (G, H) Knockdown of ATG5 strongly abolished the effects of ML-SA5 (5 µM) on suppressing migration (G) and invasion (H) of A-375 cells. n = 3–4. Means ± SEMs are shown in panels C–H. Significant differences were evaluated using one-way ANOVA followed by Tukey’s test. **P < 0.01; ***P < 0.001.
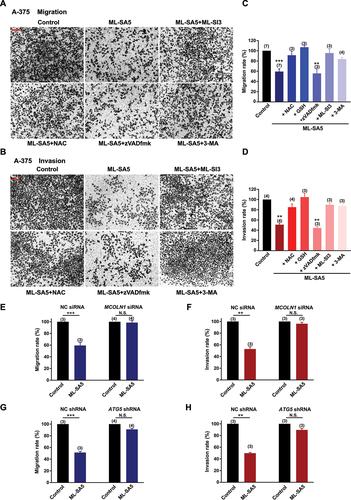
Figure 3. Autophagy inhibition by MCOLN1 profoundly suppresses migration and invasion of U-87 MG cell. (A, B) Representative images showing that migrated (A) or invaded (B) U-87 MG cells stained with 0.5% crystal violet solution, under the control, ML-SA5 (5 µM), ML-SA5 + ML-SI3 (20 µM), ML-SA5 + NAC (5 mM), ML-SA5 + zVADfmK (20 µM), and ML-SA5 + 3-MA (pretreatment; 10 mM for 2 h) in transwell assays. All treatments were for 16–24 h. Scale bar: 1 cm. (C, D) Migration rate (OD600x is normalized to OD600control) (C) and invasion rate (D) of U-87 MG cells were summarized under different conditions indicated. n = 3–6. (E, F) Comparison of migration rate (E) or invasion rate (F) of U-87 MG cells under ML-SA5 treatment (5 µM) between groups transfected with NC siRNA or MCOLN1 siRNA. n = 3. (G, H) Knockdown of ATG5 strongly abolished the effects of ML-SA5 (5 µM) on suppressing migration (G) and invasion (H) of U-87 MG cells. n = 3–4. Means ± SEMs are shown in panels C–H. Significant differences were evaluated using one-way ANOVA followed by Tukey’s test. *P < 0.05; **P < 0.01; ***P < 0.001.
In addition to melanoma and glioma cells, application of ML-SA5 (5 µM) also significantly suppressed the migration and invasion of pancreatic cancer cells (Patu 8988t; Figure S4F,G) and breast cancer cells (MCF-7; Figure S4F,G).
Next, we used either an antagonist (ML-SI3) or genetic knockdown using siRNA of MCOLN1 to further investigate if the suppressive effect on the migration and invasion in cancer cells by the ML-SA5 treatment were delivered through modulating MCOLN1 channel activity. Co-application of ML-SI3 (20 µM) or efficiently knocking down MCOLN1 by a MCOLN1 siRNA [Citation32] (Figure S4H) completely inhibited the effects of ML-SA5 on suppressing metastasis in A-375 and U-87 MG cells (–F and ). This confirms that the activation of MCOLN1 specifically suppresses the migration and invasion in cancer cell lines.
Moreover, we used the following approaches to confirm that the effect of MCOLN1 activation on migration and invasion is mediated through modulating the dynamic autophagy process. Disrupting the initiation of autophagy by pretreating cells with 3-MA (10 mM for 2 h) significantly rescued the suppression of metastasis by ML-SA5 treatment in A-375 and U-87 MG cells (–D and 3A–D). Similarly, knockdown of ATG5 strongly abolished the effects of ML-SA5 on suppressing metastasis of A-375 cells () or U-87 MG cells (,). These results indicate that activation of MCOLN1 suppresses metastasis of cancer cells by inhibiting autophagy.
Notably, our transwell and wound healing assays excluded the possibility that autophagy inhibition mediated by MCOLN1 suppresses metastasis of melanoma and glioma through decreasing viable numbers of the cancer cells. As the transwell and wound healing assays (see Methods) for monitoring the effect of MCOLN1 on cell migration and invasion were completed within 24 h of ML-SA5 treatment, during which the cell viability of both A-375 and U-87 MG cells remained unaltered (Figures S2B and 3B).
Consistent with this, the co-application of zVADfmk (20 µM), an apoptosis inhibitor, significantly attenuated the cell death of A-375 or U-87 MG cells triggered by ML-SA5 treatment (Figures S2F and 3 F). However, the same inhibitor did not rescue the suppression on metastasis by ML-SA5 treatment (5 µM) in A-375 and U-87 MG ( a nd 3A-–D). Surprisingly, NAC treatment (5 mM), an antioxidant reagent, profoundly rescued the ML-SA5-mediated suppression on metastasis in A-375 and U-87 MG cells (–). This suggests that ROS plays a pivotal role in metastasis regulated by MCOLN1-mediated autophagy inhibition. By employing another antioxidant agent, glutathione (GSH), we further confirmed the involvement of ROS in suppressing metastasis by MCOLN1-mediated autophagy inhibition. Co-application with GSH (5 mM) completely attenuated ML-SA5-mediated suppression of metastasis in the cancer cells (). In fact, each one of the pharmacological agents applied in combination with ML-SA5 alone did not affect migration or invasion of the cancer cells (Figure S4I,J). These results demonstrate that ROS, the downstream effector of MCOLN1-mediated autophagy inhibition (Figures S2E and 3E), plays a pivotal role in suppressing cancer metastasis.
When taken together, these results indicate that MCOLN1-mediated autophagy inhibition suppresses metastasis in several types of cancer cell lines, and that the inhibitory effects on metastasis delivered by MCOLN1-mediated autophagy inhibition appear to be executed by its downstream effector, ROS.
Targeting MCOLN1 efficiently inhibits metastasis of malignant melanoma in vivo
As stimulation of MCOLN1 yielded strong suppressive effects on the migration and invasion in several cancerous cell lines such as malignant melanoma, glioma, pancreatic cancer, and breast cancer cell lines, we wanted to investigate the effects of ML-SA5 on metastasis in vivo. We used a melanoma lung-metastatic mouse model as our tool to evaluate the in vivo effects of ML-SA5 on metastasis. Before starting the animal experiments, the toxicity of ML-SA5 (intraperitoneal injection, i.p.) was evaluated in mice. Administration of ML-SA5 (i.p.) at 6 mg/kg did not yield toxicity to mice (data not shown) [Citation33].
Next, the melanoma mouse models were established by injecting A-375 cells through tail vein followed by ML-SA5 injection i.p. daily starting on the third day for a period of 3 weeks. At the end of week 3, the effects of ML-SA5 administration at different doses of 0.06, 0.3, 1, 2, and 6 mg/kg were examined on mice metastasis. Doses greater than 2 mg/kg yielded significant suppressive effects on melanoma metastasis (data not shown). Compared to the Vehicle (PBS) group, the incidence of melanoma in lungs was profoundly reduced by ML-SA5 administration (2 mg/kg), as assessed using H&E staining (). Furthermore, the co-injection of ML-SI3 (16 mg/kg) reversed the effects of ML-SA5 on suppressing incidence of melanoma in lungs. This further supports the specific effects of MCOLN1 on metastasis. Alternatively, we confirmed the in vivo effects of ML-SA5 on suppressing metastasis of melanoma (A-375-luc) using Bioluminescence imaging. The representative Bioluminescence images displayed that ML-SA5 administration (2 mg/kg) significantly suppresses the lung metastases, and the suppressive effects of ML-SA5 administration were markedly rescued by the co-administration of ML-SI3 ().
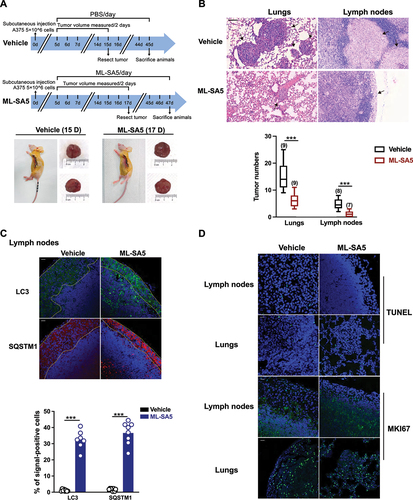
Figure 4. Administration of ML-SA5 suppresses melanoma metastasis in vivo. (A) Representative H&E-stained sections of lungs of mice injected with A-375 cells collected from Vehicle and ML-SA5 groups. PBS or ML-SA5 (2 mg/kg) was daily i.p. administrated for 3 weeks. Arrows denoted lung metastases. Scale bar: 1 mm. (B) Mean numbers of lung metastases at 3 weeks in mice with parental tumors that daily received PBS, ML-SA5 (2 mg/kg) i.p., and ML-SA5 (2 mg/kg) + ML-SI3 (16 mg/kg) following tumor implantation (P = 0.0000015679). n = 8–13. (C) Representative bioluminescent images of mice bearing metastases (A-375-luc) under i.p. injection of PBS, ML-SA5 (2 mg/kg), and ML-SA5 (2 mg/kg) + ML-SI3 (16 mg/kg) at 7 and 21 days. (D) The bioluminescence intensity in the animals depicted in C was quantified. Total flux of bioluminescence is used as a surrogate for xenograft size. n = 5–6. (E) Representative images displaying tumor tissue sections from Vehicle and ML-SA5 groups stained for LC3 and SQSTM1. Quantification of percentage of cells positive for LC3 and SQSTM1 per field of tissue sections from tumors of Vehicle and ML-SA5 groups, respectively. n = 8–9 sections from at least six animals from each group. Scale bar: 20 µm. Means ± SEM are shown in panels B, D, and E. Significant differences were evaluated using one-way ANOVA followed by Tukey’s test. *P < 0.05; **P < 0.01; ***P < 0.001.
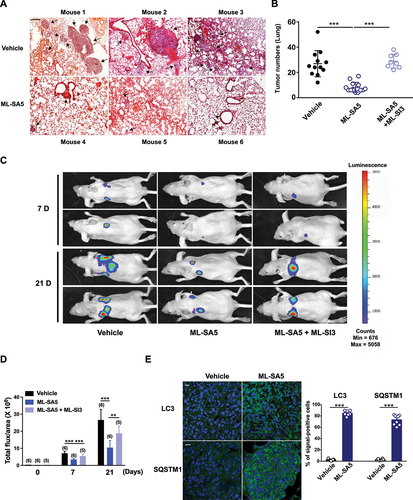
Furthermore, the strongly induced autophagy inhibition was observed in tumor tissues from the ML-SA5 administration group, as manifested by the increases in LC3 and SQSTM1 puncta structures (). These results indicate that the suppressive effects on metastasis regulated by ML-SA5 administration are delivered by MCOLN1-mediated autophagy inhibition.
To further confirm that MCOLN1-mediated autophagy inhibition suppresses the cancer metastatic cascade per se, we used a subcutaneous xenografts metastatic mice model [Citation34] to assess the effects of ML-SA5 administration on melanoma metastasis post development of primary tumors. Melanomas that were induced after subcutaneous injections were resected before they reached 2000 mm3, and mice were monitored regularly for signs of metastatic outgrowth and distress (). The effects of ML-SA5 administration were then evaluated on the metastatic spread of the melanoma. We found that ML-SA5 administration (2 mg/kg) significantly suppressed the primary melanoma spread to both locoregional axillary lymph nodes and distant lungs () and intestines (data not shown), as assessed by H&E staining. Moreover, the autophagic flux was significantly inhibited in the metastases in lymph nodes and distal lungs in the ML-SA5 administration group, manifested by the increases in abundance of LC3 and SQSTM1 puncta structures (). By contrast, extents of apoptosis and proliferation in the metastases were comparable between Vehicle and ML-SA5 group, as assessed by immunofluorescence staining with TUNEL and MKI67/ki67 ().
Figure 5. Administration of ML-SA5 suppresses melanoma metastasis to locoregional axillary lymph nodes and distant lungs in vivo. (A) An experimental design illustrating the generation of subcutaneous melanoma metastatic mice post development of primary tumors (see Materials and methods). (B) Representative H&E-stained sections of lungs and lymph nodes of mice collected from Vehicle and ML-SA5 groups. Arrows denoted metastases. Scale bar: 50 µm. Mean numbers of metastases in lungs and lymph nodes after 30 days in mice post parental tumors were removed in Vehicle and ML-SA5 (2 mg/kg) group. n = 7–9 sections from each animal and at least six animals per group. (C) Representative images displaying tumor tissue sections from Vehicle and ML-SA5 groups stained for LC3 and SQSTM1. Dotted lines outlined metastases in lymph nodes. Scale bar: 20 µm. Percentage of positive cells for LC3 and SQSTM1 per field of tissue sections from tumors of Vehicle and ML-SA5 groups, respectively. n = 8–9 sections from each animal and at least six animals per group. (D) Representative images displaying tumor tissue sections from Vehicle and ML-SA5 groups stained for TUNEL and MKI67. Scale bar: 20 µm. Means ± SEM are shown in panels B and C. Significant differences were evaluated using one-way ANOVA followed by Tukey’s test. *P < 0.05; **P < 0.01; ***P < 0.001.
Together, these results demonstrate that ML-SA5 administration significantly prevents metastasis of melanoma in vivo through inducing autophagy inhibition.
Autophagy inhibition mediated by MCOLN1 results in damaged mitochondria accumulation and resultant ROS elevation
Given that ROS may be the determining factor responsible for suppressing metastasis of the cancer cells by MCOLN1-mediated autophagy inhibition (), we sought to investigate if ROS elevation occurs following autophagy inhibition induced by MCOLN1. As expected, the ROS levels were significantly elevated following ML-SA5 treatment (1 or 5 µM for 48 h) in A-375 and U-87 MG cells, as measured using flow cytometry assay with a H2DCFDA probe ( and S5A). Application of NAC (5 mM) efficiently prevented ROS elevation resulting from ML-SA5 treatment (1 and 5 µM), thereby validating the specificity of the assay to accurately measure ROS levels ( and S5A). Using this assay, we found that ROS elevation induced by ML-SA5 treatment (1 and 5 µM) in A-375 or U-87 MG cells was significantly abolished either by combining ML-SI3 (20 µM) or pretreatment with 3-MA (10 mM for 2 h; and S5A), while the application of either ML-SI3 or 3-MA alone did not affect ROS levels in A-375 and U-87 MG cells (Figure S5B). These results indicate that ROS is a downstream regulator of MCOLN1-mediated autophagy inhibition. In addition, autophagy inhibition induced by other well-known autophagy inhibitors such as CQ (10 µM) and Baf-A1 (1 µM) or by overexpression of Rab7-T22N [Citation30,Citation31] also led to elevation in ROS levels (Figure S5C,D). Moreover, majority of the elevated ROS by MCOLN1-mediated autophagy inhibition likely stemmed from the mitochondria (mito-ROS) in A-375 cells, as assessed by the Mito-ROS staining [Citation35] ().
Figure 6. Autophagy inhibition mediated by MCOLN1 leads to damaged mitochondria accumulation and resultant ROS elevation. (A) ROS levels under the control, ML-SA5 (5 µM), ML-SA5 + ML-SI3 (20 µM), ML-SA5 + NAC (5 mM) and ML-SA5 + 3-MA (10 mM pretreated for 2 h) conditions in A-375 and U-87 MG cells, measured by flow cytometry stained by H2DCFDA. ROS relative values are labeled as red numbers inside each panel. All treatments were for 48 h. (B) Representative images and statistical analysis displaying relative fluorescence intensity of MitoTracker Red CM-H2ros (Mito-ROS; red) of A-375 cells under the control, ML-SA5 (5 µM), ML-SA5 + ML-SI3 (20 µM), and ML-SA5 + NAC (5 mM) conditions. Nuclei were stained with Hoechst 33342. Scale bar: 10 µm. Typically 160–500 cells from four independent experiments were counted for quantification. (C) Analysis of flow cytometry stained with JC-1 probe showing damaged mitochondria rates (monomers/monomers plus aggregates) under the control, ML-SA5 (5 µM), ML-SA5 + ML-SI3 (20 µM), and ML-SA5 with pretreatment of 3-MA (10 mM for 2 h) in A-375 or U-87 MG cells. Percentages of damaged mitochondria are labeled as red numbers inside each panel accordingly. All treatments were for 48 h. (D) Seahorse cell Mito stress test was performed to measure OCR of A-375 cells under the indicated conditions, following a sequential addition of oligomycin, Carbonyl cyanide 4-(trifluoromethoxy)phenylhydrazone (FCCP), and antimycin A. ML-SA5 at 5 µM and ML-SI3 at 20 µM were used in the OCR assay. All treatments were for 16 h. (E) PINK1 levels in the mitochondrial fraction were examined by western blot under the treatments indicated, and then normalized to the VDAC levels (mitochondrial fraction loading controls). CCCP (10 µM) was used as a positive control for recruiting PINK1 to the mitochondria. Treatment periods differed and are labeled within the panel. (F) Representative flow cytometry data of mito-Keima-expressing A-375 or U-87 MG cells treated with CCCP (20 µM), CCCP (20 µM) + NAC (5 mM), ML-SA5 (5 µM), starvation, or starvation + ML-SA5 (5 µM). All treatments were for 24 h. Under control condition, mito-Keima emitted predominantly green fluorescence, whereas the portion of mito-Keima emitting red fluorescence was significantly increased after treatment with CCCP or starvation in A-375 and U-87 MG cells. In the presence of ML-SA5, mito-Keima emitted predominantly green fluorescence. Moreover, co-application of ML-SA5 abolished the mitophagic flux to lysosomes under starvation condition. Means ± SEM are shown in panels B and E. Significant differences were evaluated using one-way ANOVA followed by Tukey’s test. *P < 0.05; **P < 0.01; ***P < 0.001.
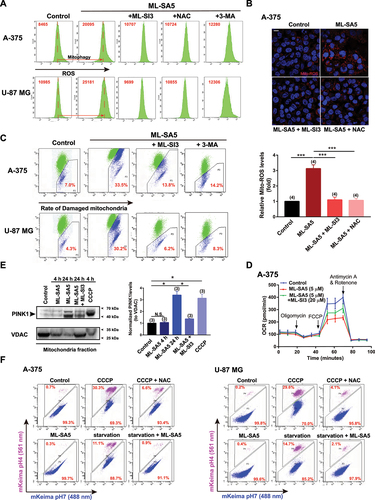
It is commonly accepted that autophagy is the most efficient way for mitochondria turnover [Citation36]. Therefore, it is conceivable that autophagy inhibition mediated by MCOLN1 impairs mitochondria turnover, which in turn will lead to accumulation of damaged mitochondria and subsequent elevation in ROS. To test this possibility, we examined the quality of mitochondria in response to ML-SA5 treatment (5 µM for 48 h) in A-375 and U-87 MG cells using flow cytometry analysis with a JC-1 probe [Citation37]. JC-1 forms aggregates when exposed to healthy mitochondria (labeled green), whereas monomers are present when exposed to damaged mitochondria (labeled blue). The percentage labeled in is the ratio of monomers to monomers plus aggregates as a measure of the abundance of damaged mitochondria. Our results demonstrate that unlike the control, the abundance of damaged mitochondria increased following ML-SA5 treatment (5 µM) in both A-375 and U-87 MG cells (). Moreover, this increase in the number of damaged mitochondria resulting from ML-SA5 treatment was significantly reduced by co-application of ML-SI3 (20 µM) or pretreatment with 3-MA (10 mM for 2 h) in A-375 or U-87 MG cells ( and S5E). This demonstrates that MCOLN1-mediated autophagy inhibition leads to damaged mitochondria accumulation, thereby resulting in release of large quantities of mito-ROS.
In agreement with the results of JC-1 probe, morphologically, ML-SA5 application (5 µM for 48 h) resulted in overt mitochondria fragmentation compared to the control in A-375 cells, as assessed by MitoTracker staining (Figure S5F). This suggests that mitochondria are subjected to excessive oxidative stress in the presence of ML-SA5 in A-375 cells. In line with the changes in ROS levels, either disrupting autophagy initiation using 3-MA (10 mM for 2 h) or downregulating MCOLN1 using ML-SI3 (20 µM) significantly reduced the accumulation of fragmentated mitochondria resulting from ML-SA5 treatment (Figure S5F). Metabolically, significant reductions in basal oxygen consumption rate (OCR), maximal OCR, ATP production, and spare capacity in A-375 were induced by the application of ML-SA5 (5 µM for 12 h; and S5G). Co-application of ML-SI3 (20 µM) largely abolished the ML-SA5-induced reductions in basal OCR, maximal OCR, ATP production, and spare capacity ( and S5G). These results further confirm the observations that MCOLN1-mediated autophagy inhibition leads to severe mitochondria damage.
Next, we evaluated the quality of mitochondria using an alternative approach by monitoring amounts of PINK1 in mitochondria fraction, as PINK1 is recruited to mitochondria membrane upon damage [Citation36]. ML-SA5 treatment for 24 h (5 µM) significantly increased amounts of PINK1 recruited to mitochondria than the control (). Levels were comparable following ML-SA5 treatment and treatment with carbonyl cyanide m-chlorophenyl hydrazone (CCCP; 10 µM), a potent mitochondrial oxidative phosphorylation uncoupler that reduces the mitochondrial membrane potential. These results support the notion that autophagy inhibition, induced by MCOLN1, leads to damaged mitochondria accumulation.
We went on investigating how MCOLN1-mediated autophagy inhibition results in damaged mitochondria accumulation. One of the possible explanations is that mitophagy shares the common steps of phagosome-lysosome fusion with autophagy. Hence, mitophagic flux to lysosomes would also be disrupted by the activation of MCOLN1 in A-375 and U-87 MG cells. To test this hypothesis, we used mito-Keima [Citation38] expressed A-375 or U-87 MG cells to monitor the fusion between mitochondria engulfed autophagosomes and lysosomes in the presence of ML-SA5, as assessed by flow cytometry assay. A chemical inhibitor of oxidative phosphorylation, CCCP, which depolarizes mitochondrial membrane and activates mitophagy, was selected as a positive control. As shown in , without CCCP treatment, mito-Keima emitted predominantly green fluorescence, suggesting mitochondrial localization in A-375 and U-87 MG cells. By contrast, treatment with CCCP (20 µM for 24 h) significantly increased the portion of mito-Keima emitting red fluorescence, a phenomenon of which also observed under starvation condition (). These results indicate the active mitophagic flux to lysosomes under CCCP or starvation condition in A-375 and U-87 MG cells (). In comparison, mito-Keima emitted predominantly green fluorescence in the presence of ML-SA5 (5 µM). Moreover, co-application of ML-SA5 abolished the mitophagic flux to lysosomes under starvation condition (), which demonstrated the blockade of mitophagic flux to lysosomes by ML-SA5 treatment in A-375 and U-87 MG cells. In concert with the western blot results of PINK1 (), these results prove our conclusion that MCOLN1-mediated autophagy inhibition disrupts mitochondrial turnover by blocking the fusion between mitochondria engulfed autophagosomes and lysosomes.
Collectively, we have uncovered that MCOLN1-mediated autophagy inhibition leads to damaged mitochondria accumulation and resultant ROS release by disrupting mitochondrial turnover.
The ROS elevation resulted from the MCOLN1-mediated autophagy inhibition triggers TP53 transcriptional activity
In line with the studies suggesting that ROS is implicated in suppressing the metastatic progression of cancer [Citation39–41], our findings demonstrate that ROS resulting from the autophagy inhibition induced by MCOLN1 plays a key role in suppressing cancer metastasis. We next sought to investigate the mechanism through which elevated ROS induced by MCOLN1-mediated autophagy inhibition modulates metastasis. It has been well acknowledged that there is a complex, but tight, relationship existing between ROS and TP53, and that TP53 is a master regulator involved in a wide spectrum of tumorigenesis [Citation42]. Furthermore, RNA-seq analysis revealed that the hallmark TP53 pathway gene set was significantly enriched within the upregulated genes in the ML-SA5-treated A-375 cells using a Gene Set Enrichment Analysis (GSEA) (FDR = 0.059) (Figure S6A). Additionally, a heatmap representation of 26 key downstream targets of TP53 showed that genes of PERP, IGFBP3, and CASP9, which involve in apoptosis, and a cell cycle regulation gene of CCNB1, were significantly modified (data not shown). The patterns of CDKN1A/p21, BBC3/PUMA, and SERPINE1/PAI expression were changed obviously, although not statistically significant based on high-throughput RNA-seq analysis (Figure S6A). More accurate measurement using qPCR experiments confirmed that the expressions of CDKN1A, BBC3, and SERPINE1 were significantly upregulated following ML-SA5 treatment (5 µM) in both A-375 cells and U-87 MG cells (Figure S6B). Moreover, co-application of either ML-SI3 (20 µM), or NAC (5 mM), or pretreatment with 3-MA (10 mM for 2 h) significantly abolished the increases in mRNA levels of CDKN1A, BBC3, and SERPINE1 resulting from ML-SA5 treatment (Figure S6B). These results further confirmed that the TP53 signaling pathway, including a series of common TP53 target genes, is regulated following ML-SA5 treatment. Conversely, the transcripts of core autophagy genes including BECN1/Beclin-1, ATG5, and ULK1 were not altered following ML-SA5 treatment (Figure S6C). All results indicate that transactivation of TP53 from MCOLN1-mediated autophagy inhibition modulates its downstream targets that are involved in regulating apoptosis and metastasis, but does not affect core autophagy genes [Citation43] to form possible feedback for regulating autophagy.
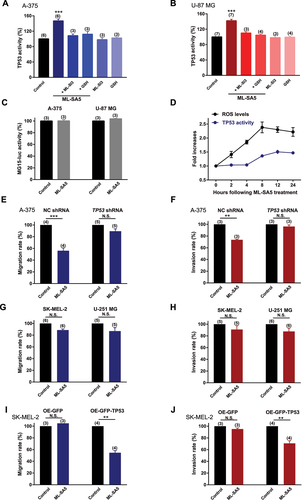
Based on this bioinformatic approach, we therefore examined the changes in TP53 transcriptional activity and protein expression levels following ML-SA5 treatment. Total TP53 protein levels remained relatively unaltered by ML-SA5 treatment [Citation44] (Figure S6D), while nuclear translocation of TP53 has been detected in the presence of ML-SA5 (5 µM), as assessed by western blot and immunostaining assays (Figure S6D,E). In addition to the nuclear translocation of TP53, transcriptional activity of TP53 was markedly elicited by ML-SA5 treatment (1 and 5 µM) in both A-375 and U-87 MG cells, as examined by a luciferase reporter PG13-luc containing wild type (WT) TP53 binding sites ( and S6F; see Methods) [Citation45]. When exposing to MG15-luc, a luciferase reporter with mutated TP53 binding sites [Citation45], the ML-SA5 application failed to increase luciferase signal intensity in A-375 and U-87 MG cells (), confirming the specific effects of MCOLN1 on inducing TP53 transcriptional activity. In addition to this, the increase in TP53 activity elicited by ML-SA5 treatment was significantly abolished by the co-application of ML-SI3 (20 µM) in A-375 and U-87 MG cells ( and S6F). Again, this has further confirmed that the activation of MCOLN1 specifically elicits TP53 activity.
Figure 7. ROS elevation induced by MCOLN1-mediated autophagy inhibition elicits TP53 activity. (A, B) TP53 activity in A-375 (A) or U-87 MG (B) cells was evaluated by monitoring the fluorescence intensity of PG13-luc that is a luciferase reporter containing WT TP53 binding sites, under the control, ML-SA5 (5 µM), ML-SA5 + ML-SI3 (20 µM), ML-SA5 + GSH (5 mM), ML-SI3 (20 µM), and GSH (5 mM). All treatments were for 24 h. n = 3–7. (C) ML-SA5 treatment (5 µM) did not alter the activity of MG15-luc, which is a luciferase reporter containing mutant TP53 binding sites, in A-375 and U-87 MG cells. n = 3. (D) Time course of the elevation in ROS levels and TP53 activity following ML-SA5 treatment (5 µM) in A-375 cells. n = 3. (E, F) Migration rate (E) (OD600ML-SA5 is normalized to OD600control) and invasion rate (F) of A-375 cells were compared between the control and ML-SA5 treatment (5 µM) in negative control (NC) shRNA or TP53 shRNA transfected groups. n = 3–5. (G, H) Migration rate (G) or invasion rate (H) of SK-MEL-2 and U-251MG cells were compared between control and ML-SA5 treatment (5 µM). Treatment with ML-SA5 was for 16 h-24 h. n = 5–6. (I, J) Migration rate (I) (OD600ML-SA5 is normalized to OD600control) and invasion rate (J) of SK-MEL-2 cells were compared between groups (control vs. ML-SA5 treatment (5 µM)) in overexpressing (OE) GFP or GFP-TP53 groups. n = 3–4. Means ± SEMs are shown in panels A–J. Significant differences were evaluated using one-way ANOVA followed by Tukey’s test. **P < 0.01; ***P < 0.001.
Moreover, treatment of either CQ or Baf-A1 or overexpression of Rab7-T22N also significantly elicited TP53 activity in A-375 cells and U-87 cells, as assessed by luciferase assay (Figure S6F,G). In concert (Figures S4C–E and S5A,C,D), these results indicate that there is a great potential that targeting autophagy inhibition is a general therapeutic approach to suppress cancer metastasis, and this suppressive effect is mediated by transactivating the TP53 signaling pathway.
To determine if TP53 activity is triggered by the ROS elevation induced by MCOLN1, GSH (NAC is not appropriate for the luciferase assay due to its acidic property) was applied to reduce ROS levels in the assay. Application of GSH (5 mM) completely abrogated the increase in TP53 activity triggered by ML-SA5 treatment ( and S6F), suggesting that ROS is indeed the upstream of TP53 transcriptional activity in the MCOLN1-mediated autophagy inhibition pathway. Furthermore, we monitored the time courses of ROS elevation and the increase in TP53 activity. Following ML-SA5 application (5 µM), ROS levels rapidly increased and reached a peak at 8 h, while TP53 activity increased 4 h after ROS elevation (). This indicates that TP53 activation occurs following the ROS elevation. Overall, these results demonstrate that ROS elevation induced by the MCOLN1-mediated autophagy inhibition is the upstream of TP53 transcriptional activity.
Given that TP53 is the potential determinant responsible for regulating metastasis in the MCOLN1-mediated autophagy inhibition/ROS pathway, we have introduced conditions where the TP53 function is restricted to further investigate whether activation of MCOLN1 is still able to suppress cancer metastasis under these particular conditions (restricted TP53 function). We found that when TP53 protein was efficiently knocked down (Figure S6H), the effects of ML-SA5 on suppressing metastasis of A-375 cells were significantly compromised ( and S7A,B). In addition to this, we measured the effects of ML-SA5 (5 µM) on the metastasis of SK-MEL-2 (a human melanoma cell line expressing mutant TP53 [Citation46]) and U-251 MG (a human glioma cell line with mutant TP53 [Citation47]) cells. Not surprisingly, the ML-SA5 application had little effects on the metastasis of these two mutant TP53 bearing cancer cells (, and S7C,D), although the ROS levels were profoundly elevated in both SK-MEL-2 and U-251 MG cells (Figure S7E,F). Moreover, the overexpression of TP53 in SK-MEL-2 cells (Figure S7G) enabled ML-SA5 to suppress metastasis of this cell line ( and S7H,I). These results indicate that TP53 is the downstream effector of ROS causing the metastatic progression in the MCOLN1-mediated autophagy inhibition pathway. Consistent with the in vitro results (), ML-SA5 administration did not yield suppressive effects on SK-MEL-2 metastasis in lungs in vivo (Figure S7J).
Together, we provide direct evidences showing that ROS integrates MCOLN1-mediated autophagy inhibition and TP53 establishing a “MCOLN1-mediated autophagy inhibition-ROS-TP53” axis for suppressing cancer metastasis.
The activation of TP53 subsequently transactivates expressions of its downstream targets to suppress metastasis
It has been well known that many downstream targets of TP53 have been implicated in the cancer metastatic cascade [Citation3,Citation4,Citation48]. Among those, MMP family members have been shown to play a critical role in metastatic progression by breaking down extracellular matrix (ECM) [Citation48,Citation49] on the one hand, while being tightly modulated by autophagy status on the other hand [Citation3,Citation4]. Therefore, to investigate whether MMP members are the downstream targets of the “MCOLN1-mediated autophagy inhibition-ROS-TP53” axis, we measured the changes in transcriptions of MMP members [Citation50] following ML-SA5 treatment (5 µM) including MMP2/gelatinase A and MMP9/gelatinase B, MMP7/matrilysin, MMP10/ stromelysin 2, MMP12/metalloelastase, and MMP13/collagenase 3 in A-375 and U-87 MG cells. Except for MMP10, all other MMP members exhibited a reduction in transcriptional levels following ML-SA5 application (5 µM) in the cells ( and S8A,B), presumably regulated by TP53 activity triggered by MCOLN1 directly, or indirectly through NF-κB [Citation51] or AP-1 [Citation52] pathways (Figure S8C,D).
Figure 8. MMPs are modulated by the “MCOLN1-mediated autophagy inhibition-ROS-TP53” cascade to suppress metastasis. (A, B) MMP2 (A) and MMP9 (B) mRNA levels were measured by q-PCR under the control, ML-SA5 (5 µM), ML-SA5 + ML-SI3 (20 µM), ML-SA5 + NAC (5 mM), and ML-SA5 + PFT-κ (30 µM) in both A-375 and U-87 MG cells. n = 3–4. (C, D) MMP2 and MMP9 protein levels were evaluated by western blot experiments under the control, ML-SA5 (5 µM), ML-SA5+ ML-SI3 (20 µM), and ML-SA5 + NAC (5 mM) in both A-375 (C) and U-87 MG (D) cells. (E, F) Normalized protein levels of MMP2 (E) and MMP9 (F) in A-375 and U-87 MG cells under various conditions indicated in C and D were summarized from three independent experiments. (G, H) MMP2 and MMP9 activity under the conditions indicated were evaluated by employing Gelatin Zymography in A-375 cells (G) and U-87 MG (H) cells. The weaker band intensity under ML-SA5 treatment (5 µM) represented lower activity of MMP2 or MMP9. (J, K) Migration rate (J) and invasion rate (K) of A-375 cells between the control and ML-SA5 treatment (5 µM) in non-transfection (NT), overexpressing (OE)-MMP2, OE-MMP9 groups were quantified. n = 3–4. Means ± SEMs are shown in panels A, B, E, F, G, H, J, and K. Significant differences were evaluated using one-way ANOVA followed by Tukey’s test. *P < 0.05; **P < 0.01; ***P < 0.001.
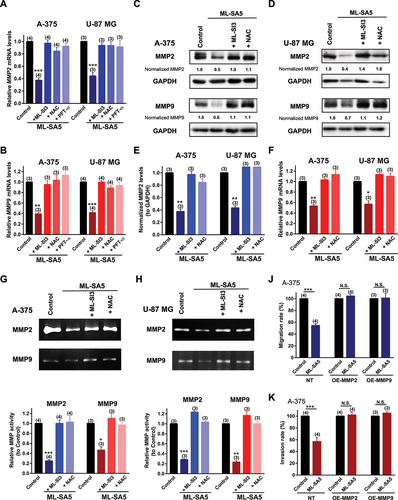
Several studies have demonstrated that MMP2 and MMP9 are involved in the metastasis of melanoma or glioma [Citation53], we therefore closely monitored the changes in these two gelatinases regulated by the “MCOLN1-mediated autophagy inhibition-ROS-TP53” axis. mRNA levels of MMP2 and MMP9 were strongly repressed by the application of ML-SA5 (5 µM) in A-375 and U-87 MG cells (). Co-application of either ML-SI3 (20 µM), NAC (5 mM), or pifithrin-α (PFT-κ; 30 µM) that is a TP53 inhibitor [Citation54], significantly abolished the repressions on transcriptions of MMP2 and MMP9 by ML-SA5 treatment in the cells (). When taken together, these results indicate that MMP2 and MMP9 are targets specifically modulated by the “MCOLN1-mediated autophagy inhibition-ROS-TP53” axis in malignant melanoma and glioma. Additionally, protein levels of MMP2 and MMP9 were consistently reduced by ML-SA5 application (5 µM) and the reductions by ML-SA5 were significantly inhibited by the application of ML-SI3 or NAC in both A-375 and U-87 MG cells (–). Moreover, we examined the functional degradative capability of MMP2 and MMP9 by utilizing Gelatin zymography, of which intensity represents ability of a given gelatinase on digesting gelatin. Following ML-SA5 treatment (5 µM), the intensity of MMP2 or MMP9 in gelatin gels was significantly reduced in A-375 and U-87 MG cells (), indicative of functional significance of MMP2 or MMP9 regulated by MCOLN1. Conversely, when attenuating the reduced protein levels of MMP2 or MMP9 regulated by ML-SA5, by overexpressing these two proteins (Figure S8E), the effects of ML-SA5 on suppressing metastasis were completely reduced ( and S8F,G). These results demonstrate that MMP2 and MMP9 execute metastatic progression following the activation of TP53, which is triggered by the ROS elevation induced by the MCOLN1-mediated autophagy inhibition.
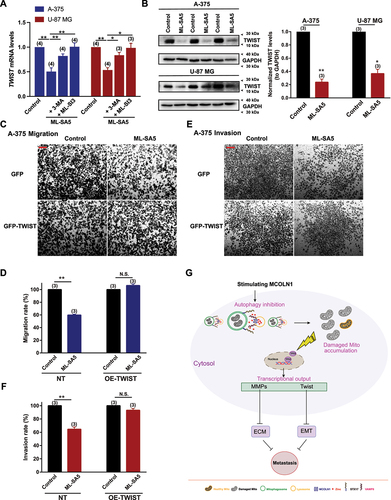
Other than MMP family members, TWIST/TWIST is another factor that is capable of inducing EMT in epithelial cells and also a downstream target of TP53 closely regulated by autophagy [Citation48,Citation55–57]. To investigate whether TWIST is manipulated by the “MCOLN1-mediated autophagy inhibition-ROS-TP53” axis to suppress metastasis, we measured the changes in mRNA and protein levels of TWIST following ML-SA5 treatment in A-375 and U-87 MG cells. We found that both mRNA and proteins levels of TWIST in the cells were significantly reduced by the ML-SA5 application (5 µM) (, B), and the reduction in TWIST by ML-SA5 was significantly inhibited by the co-application of either ML-SI3 (20 µM) or pretreatment with 3-MA (). Furthermore, after restoring TWIST protein levels by overexpressing TWIST in A-375 cells (Figure S8H), suppressed migration and invasion by ML-SA5 were rescued (–).
Figure 9. TWIST is modulated by the MCOLN1-mediated autophagy inhibition-ROS-TP53 pathway to suppress metastasis. (A-C) mRNA levels (A) and protein levels (B) of TWIST were examined in response to ML-SA5 application (5 µM) in A-375 and U-87 MG cells. TWIST protein levels were normalized to GAPDH. n = 3. (C, E) Representative images showing migrated (C) and invaded cells (E) under the control and ML-SA5 treatment (5 µM) in GFP or GFP-TWIST overexpressed A-375 cells. (D, F) Migration rate (OD600ML-SA5 is normalized to OD600control) (D) and invasion rate (F) of A-375 cells were quantified from three independent experiments. (G) Our working model illustrates the mechanism by which “MCOLN1-mediated autophagy inhibition-ROS-TP53” axis suppresses cancer metastasis. Means ± SEMs are shown in panels A, B, D, and E. Significant differences were evaluated using one-way ANOVA followed by Tukey’s test. *P < 0.05; **P < 0.01; ***P < 0.001.
Interestingly, overexpression of MMPs or TWIST alone completely reversed the effect of ML-SA5 on migration and invasion in A-375 and U-87 MG cells. MMPs and TWIST interplays closely [Citation58,Citation59]. It has been reported that overexpression of TWIST could potentially increase MMP1, MMP2, and MMP9 expression levels [Citation60–62] so it is conceivable that restoration of TWIST alone reversed the suppressive effect of ML-SA5 on migration/invasion in the cells. Vice versa, it has been demonstrated that overexpression of MMP2/9 may also upregulate the expression levels of TWIST as MMP3 or MMP13 does [Citation63]. Taken together, it is understandable that restoration of either one of them could completely reverse the suppressive effects of ML-SA5 on cancer metastasis since MMPs and TWIST mutually affect each other.
Collectively, these results indicate that TWIST is one of the downstream factors of the “MCOLN1-mediatied autophagy inhibition-ROS-TP53” axis responsible for suppressing metastasis, likely through manipulating the process of EMT [Citation64] (Figure S8I).
Furthermore, we used a model of MMP9 or TWIST stably expressed A-375 cells to confirm that MMPs and TWIST are the downstream effectors responsible for suppressing melanoma metastasis in vivo. We injected naïve A-375 cells, MMP9- or TWIST-overexpressing A-375 cells into mice through tail vein, respectively. ML-SA5 was injected i.p. daily starting from the third day for a period of 3 weeks. At the end of week 3, the effects of ML-SA5 administration (2 mg/kg) on melanoma metastasis were examined. ML-SA5 administration resulted in significant reduction in the incidence of naïve melanoma in lungs (Figure S9A,B), which is consistent with the in vivo results shown in . In a sharp contrast, the incidence of either MMP9 or TWIST overexpressed melanoma in lungs was not significantly altered by ML-SA5 administration (2 mg/kg), as assessed using H&E staining (Figure S9A,B), which were in concert with the in vitro results shown in .
Discussion
Although the precise outcome of autophagy on metastasis is still under debate, our study has provided direct experimental evidence that proves that autophagy inhibition induced by MCOLN1 suppresses cancer metastasis both in vitro and in vivo. Furthermore, we uncovered the mechanism underling that the MCOLN1-mediated autophagy inhibition suppresses metastasis. The MCOLN1-mediated autophagy inhibition induces ROS elevation by impairing mitochondria turnover, which subsequently triggers TP53 activity. In turn, the TP53 activation aids in stress adaptation (referred to autophagy inhibition) by modifying transcriptional inputs of genes involved in a spectrum of metastasis including MMPs and TWIST to suppress metastasis (). More importantly, the potent suppression of cancer growth and metastasis by the stimulation of MCOLN1 proposes the great potential of MCOLN1 as a pharmaceutical target to combat cancer.
Activation of MCOLN1 inhibits autophagy by disrupting the fusion between autophagosomes and lysosomes [Citation18]. Interestingly, it has been noted that inhibiting nonselective autophagy, induced by stimulating MCOLN1, also causes deficient mitophagy, showing as an accumulation of damaged mitochondria (). One possible interpretation is that nonselective autophagy and mitophagy share the same machinery as the late step of “autophagy” process, which refers to the fusion between autophagosomes and lysosomes and the cargo degradation by lysosomal hydrolysases. Interruption on the fusion process by activating MCOLN1 thereby restrains the mitochondria turnover and subsequently results in accumulation of damaged mitochondria. If this is the case, it should be noted that approaches that inhibit autophagy by suppressing autophagosomes formations (initiation step) might not be effective in preventing cancer metastasis. This could be because the initiation step of the machinery of mitophagy, which involves PINK1-PRKN and BNIP3-BNIP3L/NIX pathways [Citation65], is different from nonselective autophagy. Moreover, the effects of MCOLN1 on damaging mitochondria occurred later than the effect of CCCP (), suggesting that MCOLN1-mediated autophagy inhibition is an accumulative process resulting in damaged mitochondria accumulation.
It was accepted that autophagy and TP53 are closely interrelated. TP53 activity regulates autophagy through its transcriptional and post-transcriptional regulation [Citation66,Citation67]. However, how autophagy regulates TP53 remains unclear. Our study experimentally demonstrates that the MCOLN1-mediated autophagy inhibition triggers TP53 activity, which indeed is in line with the hypothesis that autophagy suppresses TP53 activation that was comprehensively discussed by Dr. White [Citation68]. We believe that the MCOLN1-mediated TP53 transactivity may also apply to the physiological and pathological functions in neurons and cardiomyocytes, as augmented TP53 activity underlies the pathogenesis of neurological dysfunction [Citation69] and myocardial infarct [Citation70]. As such, it will be interesting to determine if MCOLN1-mediated TP53 activation participates in the pathogenesis of these diseases in future studies.
Furthermore, our findings indicate that oxidative stress (ROS) integrates autophagy inhibition and TP53 activity to suppress the metastasis in cancer cells. ROS is a potent endogenous activator of MCOLN1 [Citation71]. Any pathological condition in a disease such as Parkinson disease (PD) and myocardial ischemia reperfusion injury, in which ROS levels are largely elevated, may lead to the activation of MCOLN1. The activation of MCOLN1 will in turn arrest autophagy and severely harm mitochondria turnover. Subsequently, the accumulation of damaged mitochondria will lead to more ROS release, and theoretically will stimulate MCOLN1 channels to exacerbate the mitochondria damage. Therefore, in this case, MCOLN1 becomes a key factor that connects ROS and autophagic flux regulation to form a vicious circle of these two biological processes and thereby participating, in part, in the pathogenesis of diseases. It would be important to determine whether MCOLN1 is involved in pathogenesis of these diseases.
In this study, some questions pertaining to the regulation on metastasis by the “MCOLN1-mediated autophagy inhibition-ROS-TP53” axis still remain unknown. For instance, we have not investigated whether the TP53 transactivation triggered by MCOLN1-mediated autophagy inhibition is also involved in other aspects of the metastatic cascade such as anoikis, cancer cell stemness, and cancer microenvironment or not. Considering their tight relationship with TP53 [Citation48], it is likely that autophagy inhibition systematically regulates each of these molecular pathways in the metastatic cascade attributed to the regulation of TP53. Moreover, it is also conceivable that TP53 plays a pivotal role in inducing apoptosis and cell cycle arrest following MCOLN1-mediated autophagy inhibition in the cancer cells (Figures S2 and S3) [Citation18]. Therefore, MCOLN1 possesses a broad spectrum of anti-neoplastic functions to combat cancer including triggering cancer cell death, arresting cancer cell cycle, and preventing cancer metastasis. Notably, only certain cancer cells that possess normal TP53 functions would be sensitive to the effects of MCOLN1.
Another remaining question is how ROS elevation following MCOLN1-mediated autophagy inhibition triggers TP53 activation. Many studies have demonstrated that ROS elevation renders extended stress on DNA, which ultimately results in TP53 activation [Citation42]. We speculate that this mechanism applies to the “MCOLN1-mediated autophagy inhibition-ROS-TP53” axis as well, in which the ROS-triggered DNA damage could activate TP53. Furthermore, our results provided some interesting information showing that a certain threshold of ROS might be required to trigger TP53 activity in the “MCOLN1-mediated autophagy inhibition-ROS cascade,” as TP53 activity was elevated 4 h later than the ROS elevation (). Nevertheless, we hope all these questions will be addressed in the near future.
In summary, we have identified a regulatory network underlying a mechanism by which MCOLN1-mediated autophagy inhibition suppresses cancer metastasis via regulating ROS-driven TP53 pathway. The regulation of TP53 transcriptional activity will largely exploit physiological and pathological significance of the lysosomal cationic channel, MCOLN1. MCOLN1 exhibits potent anti-neoplastic functions and could be a potential target for cancer therapeutics.
Materials and methods
Mammalian cell culture and transfection
A-375, SK-MEL-2, U-87 MG, U-251MG, MCF7, and SGC7901 cells were obtained from KeyGEN BioTECH (KG148, KG417, KG050, KG218, KG031, and KG520). Patu 8988t cells were purchased from Shanghai Gefan Biotechnology. Co., Ltd (GE102). A-375-luc cells were constructed by Applied Biological Materials Inc. All cells were grown at 37°C in a 1:1 mixture of Dulbecco’s modified Eagle’s medium (DMEM; Gibco, 11965175) supplemented with 10% FBS (Gibco, 10091155) in a humidified 5% CO2 incubator. Unless indicated otherwise, cell viability measurements were performed with the following timeline: cells (~20 × 104/ml) were plated in medium with 10% FBS. After 24 h, cells were changed to 2% FBS with or without drugs. Treatments were applied for 24–72 h periods as indicated. For transfection, cells were transfected with Lipofectamine 2000 (Invitrogen, 11668027). Culture media were refreshed 18–24 h post-transfection, and cells were imaged 48 h post-transfection to allow sufficient recovery from transfection stress.
Plasmids and siRNAs
GFP-LC3 (21073), GFP-RFP-LC3 (84573), GFP-TP53 (12091), PG13-luc (16442), MG15-luc (16443), and mito-Keima (72342) were obtained from Addgene (deposited by Drs. Tamotsu Yoshimori, Noburu Mizushima, Tyler Jacks, Bert Vogelstein, and Richard Youle, respectively). pNF-κB-luc and pAP-1-luc were purchased from Beyotime Biotechnology (D2206 and D2108). MMP2, MMP9, and TWIST cDNAs were obtained from Shanghai Genechem Co., Ltd. Negative control and MCOLN1 siRNAs [Citation32,Citation72] were synthesized from GenePharma company.
Western blotting
Standard western blotting procedures were used. Antibodies used for western blots include anti-LC3 (Sigma-Aldrich, L8918), anti-TUBB/beta Tubulin (Cell Signaling Technology, 2146), anti-SQSTM1 (Cell Signaling Technology, 5144), anti-TWIST (Santa Cruz, sc-81,417), anti-PINK1 (Novus, BC100-494), anti-GAPDH (Cell Signaling Technology, 2118), anti-TP53 (Cell Signaling Technology, 9282), anti-MMP2 (Cell Signaling Technology, 3852), and anti-MMP9 (Cell Signaling Technology, 13132).
Transwell migration assay.
Cells were harvested and resuspended at 2 × 10⁴ cells/well in serum-free DMEM medium. A total of 200 µl of the suspension was added into upper compartment of the transwell insert (Corning, 3422), while a total of 600 µl of complete DMEM medium containing 10% FBS was put into the lower compartment. After 16–24 h with or without drug treatments, migrated cells through microporous membrane of the insert were then fixed and stained by 0.5% crystal violet solution. Migrated cells were visualized under Olympus microscope for imaging, and then eluted by 20% acetic acid for measuring OD600.
Transwell invasion assay
Matrigel (BD Biosciences, 356234) was diluted in serum-free DMEM medium at 1:7. A total of 50 µl of the mixture was then used to coat transwell insert for 1–2 h at 37°C. Cells were harvested and resuspended at 5 × 10⁴ cells/well in serum-free DMEM medium. A total of 200 µl of the cell suspension was added into the upper compartment of the transwell, while a total of 600 µl of complete DMEM medium containing 10% FBS was put into the lower compartment. After 16–24 h, invaded cells through the coated microporous membrane were then fixed and stained by 0.5% crystal violet solution (noninvasive cells removed from the top of the membrane with a cotton swab). Invaded cells were visualized under a microscope for imaging, and then eluted by 20% acetic acid for measuring OD600.
Wound healing assay
Cells were cultured to full confluence in 6-well plates. Then, a scratch wound was made with a 20-µl micropipette tip. Cells were further cultured in DMEM medium containing 10% FBS. Pictures were taken at 0, 12, and 24 h after scratching. The width of wound healing was quantified and compared with baseline values (time 0).
Trypan blue assay
Freshly detached cells were diluted with the same volume of trypan blue solution. Also, 10 µl of sample was loaded into a hemacytometer and examined immediately under a microscope at low magnification. The number of blue staining cells and the number of total cells were counted. Cell viability was determined as (1.00 – [Number of blue cells/Number of total cells]).
Luciferase assay
The luciferase reporter gene assay was measured as described previously [Citation73]. Briefly, A-375 and U-87 MG cells were seeded in a 35-mm dish to reach 80–90% confluence for overnight. Reporter plasmid PG13-luc (with WT TP53 binding sites), MG15-luc (with mutant TP53 binding sites), pNF-κB-luc, and pAP-1-luc were transfected into the cells with the aid of Lipofectamine 2000, respectively. All cells were co-transfected with pGL4.75 (Renilla-luc) for normalization. After 6 h post-transfection, cells were seeded in a 12-well plate and grown for another 16 h with DMEM containing 10% FBS. Then the cells were treated with different drugs as indicated. Luciferase and Renilla activities were determined using a Dual-luciferase Reporter Assay kit (Promega, E1910). The results were averaged from at least three independent experiments.
qPCR analysis
Total RNA from A3-75 and U-87 MG cells was isolated using RNAiso Trizol reagent (Sangon Biotech, B511311), and reverse-transcribed with PrimeScript™ RT Master Mix (Takara, RR036A) according to the manufacturer’s instructions. Then a TB Green™ Premix EX Taq™ II (Takara, RR420A) in a LightCycler 480 qPCR instrument (Roche) was used for qRT-PCR. qRT-PCR was performed in triplicate, and the results were normalized against GAPDH. Relative fold expressions were calculated with the comparative threshold cycle (2-ΔΔCt) method. The sequences of all primers for qRT-PCR are listed below:
hGAPDH-F: 5-AGCCACATCGCTCAGACAC-3
hGAPDH-R: 5-GCCCAATACGACCAAATCC-3
hMCOLN1-F: 5-TCTTCCAGCACGGAGACAAC-3
hMCOLN1-R: 5-GCCACATGAACCCCACAAAC-3
hMMP2-F: 5-CAAGTTCCCCGGCGATGTC-3
hMMP2-R: 5-TTCTGGTCAAGGTCACCTGTC-3
hMMP9-F: 5-TGTACCGCTATGGTTACACTCG-3
hMMP9-R: 5-GGCAGGGACAGTTGCTTCT-3
hTWIST-F: 5-GGAGTCCGCAGTCTTACGAG-3
hTWIST-R: 5-TCTGGAGGACCTGGTAGAGG-3
hMMP13-F: 5-CCCAACCCTAAACATCCAA-3
hMMP13-R: 5-AAACAGCTCCGCATCAACC-3
hMMP12-F: 5-AATCTCGTGAACAGCAGTGAG-3
hMMP12-R: 5-CCTGGATCTGGCATTGGAG-3
hMMP10-F: 5-GCCAGTCCATGGAGCAAGGCT-3
hMMP10-R: 5-TCGCCTAGCAATGTAACCAGCTGT-3
hMMP7-F: 5-TGTATGGGGAACTGCTGACA-3
hMMP7-R: 5-GCGTTCATCCTCATCGAAGT-3
hULK1-F: 5-AACAAGAAGAACCTCGCCAAGTCTC-3
hULK1-R: 5-CCACCGTTGCAGTACTCCATAACC-3
hBeclin-1-F: 5-ACATCTGGCACAGTGGACAGTTTG-3
hBeclin-1-R:5-AGCATGGAGCAGCAACACAGTC-3
hATG5-F: 5-GGACAGTTGCACACACTAGGAGATC-3
hATG5-R: 5-CTCAGATGTTCACTCAGCCACTGC-3
hPAI-F: 5-GTGCTGGTGAATGCCCTCTACTTC-3
hPAI-R: 5-TGCTGCCGTCTGATTTGTGGAAG-3
hPUMA-F: 5-GACGACCTCAACGCACAGTACG-3
hPUMA-R: 5-GGCAGGAGTCCCATGATGAGATTG-3
hp21-F: 5-GGAAGACCATGTGGACCTGT-3
hp21-R: 5-GGCGTTTGGAGTGGTAGAAA-3
KDTP53: CTACATGTGTAACAGTTCC [Citation74]
Flow cytometry
For flow cytometry analyses, cells were treated with different drugs as indicated. Cells were collected, washed with PBS (Thermo Fisher Scientific, 10010049) twice, and stained using the Annexin V/7-AAD (Sigma-Aldrich, HR8285) for apoptosis assay, H2DCFDA (Thermo Fisher Scientific, D399) for ROS measurement, propidium iodide (PI; Thermo Fisher Scientific, P1304) for cell cycle assay, JC-1 (Thermo Fisher Scientific, T3168) for assessing mitochondria quality, and mito-Keima for evaluating mitophagic flux, according to the manufacturer’s instruction. Stained cells were analyzed with a BD FACSAria III flow cytometer, and data was processed using FlowJo software. For reading of JC-1 staining, JC-1 forms aggregates when exposed to healthy mitochondria (labeled green), while exhibiting monomers when mitochondria are damaged (labeled blue). Percentage labeled represented the ratio of monomers to monomers plus aggregates as the rate of damaged mitochondria.
Mitochondria isolation
All procedures are carried out at 4°C. A total of 2 × 10⁷ cells were pelleted for mitochondrial isolation according to the manufacturer’s protocol included in the mitochondria isolation kit for mammalian cells (Thermo Fisher Scientific, 89874). Cells were homogenized using a glass Dounce tissue grinder in isolation reagent supplemented with proteinase inhibitor on ice. After centrifugation, the supernatant was discarded, and the pellet was designated as crude mitochondria.
Zymography
A-375 and U-87 MG cells were seeded and grown in a 6-well plate. When confluent, cells were treated with the indicated chemicals in serum-free medium. After 24-h incubation, media were collected as samples. The samples were then prepared in non-denaturing conditions in 4× Laemmli buffer (Bio-Rad, 1610747) without DTT (Thermo Fisher Scientific, R0861) and loaded on a 10% SDS-polyacrylamide gel containing 1 mg/ml gelatin. The gels were rinsed three times in 2.5% Triton X-100 (Sigma-Aldrich, X100) to remove SDS and then washed three times in the developing buffer (50 mM Tris-HCl [Sigma-Aldrich, 15506017], 0.2 M NaCl [Sigma-Aldrich, S9988], 5 mM CaCl2 [Sigma-Aldrich, C4901], 0.02% Brij 35 [Thermo Fisher Scientific, 85118], pH 7.5). Subsequently, the gel was incubated in the developing buffer at 37°C for 48 h. Gels were stained with 0.5% Coomassie Brilliant Blue and destained with 25% methanol and 10% acetic acid; the clear zones within the blue background indicate activities of a given gelatinase.
Melanoma lung-metastasis animal model
Experiments on mice were performed in accordance with Xuzhou Medical University Animal Facility and Use Committee-approved protocols. 0.5–1 × 10⁶ of A-375 or A-375-luc cells were resuspended to a final volume of 200 µl and then injected slowly into tails of ~6-week-old BALB/c nude mice. From the third day, PBS or ML-SA5 (~6 mg/kg) was intraperitoneally injected daily for 3 weeks. Twenty-one days after inoculation of melanoma cells, mice were sacrificed, perfusion-fixed, and the lungs isolated. Lungs then were embedded in paraffin blocks and sectioned at 5-mm thickness. The sections on glass slides were dried, then were deparaffinized and stained with hematoxylin and eosin (H&E). Lung metastases were counted in five H&E-stained step sections with 50-µm spacing; metastases occurring in the same position of sequential sections were only counted once. All analyses were performed blinded.
Subcutaneous xenografts metastatic mice model
All BALB/c nude mice were injected subcutaneously with A-375 cells (5 × 10⁶/100 μl) on day 0. When tumors reached volumes of 100–150 mm3 on day 5, mice were treated with ML-SA5 (2 mg/kg) or PBS via i.p. injection every day, and tumor volumes were measured every 2 days. Tumors were resected on different days to allow operating on equal-sized tumors by volumes of about 2000 mm3. For Vehicle group, tumors were resected on day 15, and ML-SA5 group on day 17. A comparison of tumor volumes showed no significant differences between two groups. Thirty days after tumor resection, mice were sacrificed, perfusion-fixed, and their axillary lymph nodes, lungs, and intestines were isolated. Tumor metastases were then counted through H&E staining slices [Citation34].
Small animal imaging
Mice bearing A-375-luc were firstly anesthetized. 0.2 ml of D-luciferin (30 mg/ml; Promega, P1041) was then injected intraperitoneally into mice 10 min before imaging. Bioluminescence was monitored by Xenogen IVIS imaging Spectrum optical imaging device weekly (Caliper, USA). Mice were then sacrificed and lungs were collected for H&E staining. The bioluminescence intensity was quantified by defining the bioluminescence region of interest (ROI) for metastases. Data were reported as photons/s as instructed [Citation75].
Confocal imaging.
Cells were grown on glass coverslips, fixed with 4% PFA. After three washes with PBS, the coverslips were mounted with Fluoromount-G (Southern Biotech, 010001) and were processed for imaging using an Olympus confocal microscope.
DQ-BSA proteolytic assay
DQ-red-BSA (Thermo Fisher Scientific, D12051) was used as an artificial substrate to evaluate lysosomal proteolytic degradation [Citation76,Citation77]. Briefly, cells were treated with DQ-red-BSA (10 µg/ml) for 2 h at 37°C. After removal of extracellular DQ-red-BSA, cells were starved (amino acid free and serum withdrawal) to trigger autophagic degradation. Upon cleavage, DQ-red-BSA exhibited red fluorescence, as detected by confocal imaging.
RNA-seq analysis
Total RNA was extracted from untreated and ML-SA5 treated A-375 cells from three independent biological replicates. Sample libraries were prepared from purified mRNA. Then, paired-end sequencing of the constructed library was carried out at Sangon Biotech. Co. Ltd. (Shanghai, China) on an Illumina HiSeq 2500 system. The quality of raw reads was evaluated and controlled using FastQC and Trimmomatic. Reads were aligned to the human reference genome GRCh37 using HISAT2 (version 1.12.4). Differentially expressed genes were identified using the DESeq2 package with standard settings. Subsequently, reads per transcripts per million (TPM) were applied to perform differential gene expression analysis with DESeq2 package.
Gene set enrichment analysis (GSEA)
According to GSEA User Guider for RNA-seq data, DESeq2 was applied to perform the differential gene expression analysis. Parameters of log fold change value and P adj value were selected to build pre-ranked list following the ranking method guide provided by Dr. Veronique Voisin (http://www.baderlab.org/CancerStemCellProject/VeroniqueVoisin/AdditionalResources/GSEA. The Hallmark (v7.3) gene set collections were obtained from the Molecular Signatures Database v7.3 download page (https://www.gsea-msigdb.org/gsea/downloads.jsp). GSEA was performed based on the downloaded gene set collections using GSEA software (v4.1.3, https://www.gsea-msigdb.org/). Significance of the enrichment was calculated based on 1000 cycles of permutations.
Reagents and chemicals
All reagents were dissolved and stored in DMSO (Sigma-Aldrich, D2650) or water. Baf-A1 (HY-100558), rapamycin (HY-10219), and zVADfmk (HY-16658B) were obtained from Med Chem Express. DQ-BSA-red (D12051), JC-1 (T3168), LysoTracker Red DND-99 (L7528), MitoTracker Red CM-H2Xros (M7513), PI (P1304), and H2DCFDA (D399) were from Thermo Fisher Scientific. Annexin/7AAD (HR8285), CQ (C6628), 3-MA (M9281), PFT (63208), GSH (70188), and NAC (616911) were purchased from Sigma. Trypan blue was from VWR. ML-SA5 and ML-SI3 were kindly provided by Dr. Haoxing Xu (University of Michigan).
Statistical analysis
Data are presented as the means ± standard errors of the mean (SEMs). Statistical significance of differences was evaluated using ANOVA followed by Tukey’s test. P values < 0.05 were considered statistically significant. For RNA-seq analysis, genes with a false discovery rate q value <0.05 and an absolute fold change value > 2 were considered as differentially expressed. For GSEA analysis, gene sets with | NES |> 1, NOM P < 0.05, and FDR q < 0.25 were considered significant.
Supplemental Material
Download Zip (10.4 MB)Acknowledgments
This work was supported by National Natural Science Foundation of China (NSFC) grants [81772559 to W.W; 82101314 to Y.X; 81971212 to F.G; 81600967 to C.L], NSF grants of the Jiangsu Province [BK20170262 to W.W], Key University Science Research Project of Jiangsu Province [20KJA310001 to W.W], Jiangsu Specially Appointed Professor award to W.W (2017), and Jiangsu Province Innovative and Entrepreneurial Talent program to W.W (2018) and Jiangsu Province Innovative and Entrepreneurial Team program to W.W (2020). Natural Science Foundation of Liaoning Province (2021-MS-161 to M.M.W). We appreciate the encouragement and helpful comments from other members of the Wang laboratory.
Disclosure statement
No potential conflict of interest was reported by the author(s).
Supplementary material
Supplemental data for this article can be accessed here.
Additional information
Funding
References
- Steeg PS. Targeting metastasis. Nat Rev Cancer. 2016;16:201–218.
- Kenific CM, Thorburn A, Debnath J. Autophagy and metastasis: another double-edged sword. Curr Opin Cell Biol. 2010;22:241–245.
- Dower CM, Wills CA, Frisch SM, et al. Mechanisms and context underlying the role of autophagy in cancer metastasis. Autophagy. 2018;14:1110–1128.
- Mowers EE, Sharifi MN, Macleod KF. Autophagy in cancer metastasis. Oncogene. 2017;36(12):1619–1630.
- Lock R, Kenific CM, Leidal AM, et al. Autophagy-dependent production of secreted factors facilitates oncogenic RAS-driven invasion. Cancer Discov. 2014;4(4):1045–1047.
- Kenific CM, Stehbens SJ, Goldsmith J, et al. NBR1 enables autophagy-dependent focal adhesion turnover. J Cell Biol. 2016;212(5):577–590. DOI:https://doi.org/10.1083/jcb.201503075.
- Qiang L, Zhao B, Ming M, et al. Regulation of cell proliferation and migration by p62 through stabilization of Twist1. Proc Natl Acad Sci U S A. 2014;111:9241–9246.
- Sahai E, Marshall CJ. Differing modes of tumour cell invasion have distinct requirements for Rho/ROCK signalling and extracellular proteolysis. Nat Cell Biol. 2003;5(8):711–719.
- Caswell PT, Vadrevu S, Norman JC. Integrins: masters and slaves of endocytic transport. Nat Rev Mol Cell Biol. 2009;10(12):843–853.
- Carmeliet P, Jain RK. Principles and mechanisms of vessel normalization for cancer and other angiogenic diseases. Nat Rev Drug Discov. 2011;10:417–427.
- Guo W, Giancotti FG. Integrin signalling during tumour progression. Nat Rev Mol Cell Biol. 2004;5:816–826.
- Fu D, Yu JY, Yang S, et al. Survival or death: a dual role for autophagy in stress-induced pericyte loss in diabetic retinopathy. Diabetologia. 2016;59:2251–2261.
- Yf P, Yh S, Zb D, et al. Autophagy inhibition suppresses pulmonary metastasis of HCC in mice via impairing anoikis resistance and colonization of HCC cells. Autophagy. 2013;9:2056–2068.
- Maes H, Kuchnio A, Peric A, et al. Tumor vessel normalization by chloroquine independent of autophagy. Cancer Cell. 2014;26:190–206.
- Maycotte P, Aryal S, Cummings CT, et al. Chloroquine sensitizes breast cancer cells to chemotherapy independent of autophagy. Autophagy. 2012;8:200–212.
- Dong X-P, Cheng X, Mills E, et al. The type IV mucolipidosis-associated protein TRPML1 is an endolysosomal iron release channel. Nature. 2008;455(7215):992–996. DOI:https://doi.org/10.1038/nature07311.
- Wang W, Zhang X, Gao Q, et al. TRPML1: an ion channel in the lysosome. Handb Exp Pharmacol. 2014;222:631–645.
- Qi J, Xing Y, Liu Y, et al. MCOLN1/TRPML1 finely controls oncogenic autophagy in cancer by mediating zinc influx. Autophagy. 2021; 1–22. https://doi.org/10.1080/15548627.2021.1917132
- Min FL, Zhang H, Li WJ, et al. Effect of exogenous wild-type p53 on melanoma cell death pathways induced by irradiation at different linear energy transfer. Vitro Cell Dev Biol Anim. 2005;41:284–288.
- Cerrato JA, Yung WK, Liu TJ. Introduction of mutant p53 into a wild-type p53-expressing glioma cell line confers sensitivity to Ad-p53-induced apoptosis. Neuro Oncol. 2001;3:113–122.
- Plebanek MP, Angeloni NL, Vinokour E, et al. Pre-metastatic cancer exosomes induce immune surveillance by patrolling monocytes at the metastatic niche. Nat Commun. 2017;8:1319.
- Choudhury Y, Tay FC, Lam DH, et al. Attenuated adenosine-to-inosine editing of microRNA-376a* promotes invasiveness of glioblastoma cells. J Clin Invest. 2012;122(11):4059–4076. DOI:https://doi.org/10.1172/JCI62925.
- Klionsky DJ, Abdel-Aziz AK, Abdelfatah S, et al. Guidelines for the use and interpretation of assays for monitoring autophagy. Autophagy. 2021;17:1–382. (4th edition)(1).
- Sahoo N, Gu M, Zhang X, et al. Gastric acid secretion from parietal cells is mediated by a Ca(2+) efflux channel in the tubulovesicle. Dev Cell. 2017;41:262–73 e6.
- Ravikumar B, Vacher C, Berger Z, et al. Inhibition of mTOR induces autophagy and reduces toxicity of polyglutamine expansions in fly and mouse models of huntington disease. Nat Genet. 2004;36:585–595.
- Wang W, Gao Q, Yang M, et al. Up-regulation of lysosomal TRPML1 channels is essential for lysosomal adaptation to nutrient starvation. Proc Natl Acad Sci U S A. 2015;112:E1373–81.
- Maclean KH, Dorsey FC, Cleveland JL, et al. Targeting lysosomal degradation induces p53-dependent cell death and prevents cancer in mouse models of lymphomagenesis. J Clin Invest. 2008;118:79–88.
- Zhou C, Zhong W, Zhou J, et al. Monitoring autophagic flux by an improved tandem fluorescent-tagged LC3 (mTagRFP-mWasabi-LC3) reveals that high-dose rapamycin impairs autophagic flux in cancer cells. Autophagy. 2012;8:1215–1226.
- Codogno P, Meijer AJ. Atg5: more than an autophagy factor. Nat Cell Biol. 2006;8:1045–1047.
- Gutierrez MG, Munafo DB, Beron W, et al. Rab7 is required for the normal progression of the autophagic pathway in mammalian cells. J Cell Sci. 2004;117:2687–2697.
- Kimura S, Noda T, Yoshimori T. Dissection of the autophagosome maturation process by a novel reporter protein, tandem fluorescent-tagged LC3. Autophagy. 2007;3:452–460.
- Miedel MT, Rbaibi Y, Guerriero CJ, et al. Membrane traffic and turnover in TRP-ML1–deficient cells: a revised model for mucolipidosis type IV pathogenesis. J Exp Med. 2008;205(6):1477–1490. DOI:https://doi.org/10.1084/jem.20072194.
- Yu L, Zhang X, Yang Y, et al. Small-molecule activation of lysosomal TRP channels ameliorates Duchenne muscular dystrophy in mouse models. Sci Adv. 2020;6:eaaz2736.
- Zilli F, Marques Ramos P, Auf der Maur P, et al. The NFIB-ERO1A axis promotes breast cancer metastatic colonization of disseminated tumour cells. EMBO Mol Med. 2021;13:e13162.
- Li X, Yang W, Jiang LH. Alteration in intracellular Zn(2+) homeostasis as a result of TRPM2 channel activation contributes to ROS-induced hippocampal neuronal death. Front Mol Neurosci. 2017;10:414.
- Narendra DP, Jin SM, Tanaka A, et al. PINK1 is selectively stabilized on impaired mitochondria to activate Parkin. PLoS Biol. 2010;8:e1000298.
- Yeap SK, Abu N, Akthar N, et al. Gene expression analysis reveals the concurrent activation of proapoptotic and antioxidant-defensive mechanisms in flavokawain B-treated cervical cancer hela cells. Integr Cancer Ther. 2017;16:373–384.
- Lazarou M, Sliter DA, Kane LA, et al. The ubiquitin kinase PINK1 recruits autophagy receptors to induce mitophagy. Nature. 2015;524:309–314.
- Piskounova E, Agathocleous M, Murphy MM, et al. Oxidative stress inhibits distant metastasis by human melanoma cells. Nature. 2015;527(7577):186–191. DOI:https://doi.org/10.1038/nature15726.
- Le Gal K, Ibrahim MX, Wiel C, et al. Antioxidants can increase melanoma metastasis in mice. Sci Transl Med. 2015;7(308):308re8. DOI:https://doi.org/10.1126/scitranslmed.aad3740.
- Wiel C, Le Gal K, Ibrahim MX, et al. BACH1 stabilization by antioxidants stimulates lung cancer metastasis. Cell. 2019;178(2):330–345.e22. DOI:https://doi.org/10.1016/j.cell.2019.06.005.
- Bensaad K, Vousden KH. Savior and slayer: the two faces of p53. Nat Med. 2005;11(12):1278–1279.
- Kenzelmann Broz D, Spano Mello S, Bieging KT, et al. Global genomic profiling reveals an extensive p53-regulated autophagy program contributing to key p53 responses. Genes Dev. 2013;27(9):1016–1031. DOI:https://doi.org/10.1101/gad.212282.112.
- Zhao K, Yang Y, Zhang G, et al. Regulation of the Mdm2-p53 pathway by the ubiquitin E3 ligase MARCH7. EMBO Rep. 2018;19:305–319.
- Tian L, Peng G, Parant JM, et al. Essential roles of Jab1 in cell survival, spontaneous DNA damage and DNA repair. Oncogene. 2010;29:6125–6137.
- Kim JS, Joo EJ, Chun J, et al. Induction of apoptosis by ginsenoside Rk1 in SK-MEL-2-human melanoma. Arch Pharm Res. 2012;35:717–722.
- Gomez-Manzano C, Fueyo J, Kyritsis AP, et al. Characterization of p53 and p21 functional interactions in glioma cells en route to apoptosis. J Natl Cancer Inst. 1997;89:1036–1044.
- Powell E, Piwnica-Worms D, Piwnica-Worms H. Contribution of p53 to metastasis. Cancer Discov. 2014;4(4):405–414.
- Lambert AW, Pattabiraman DR, Weinberg RA. Emerging Biological Principles of Metastasis. Cell. 2017;168(4):670–691.
- Nagase H, Woessner JF Jr. Matrix metalloproteinases. J Biol Chem. 1999;274:21491–21494.
- Cheng CY, Hsieh HL, Hsiao LD, et al. PI3-K/Akt/JNK/NF-kappaB is essential for MMP-9 expression and outgrowth in human limbal epithelial cells on intact amniotic membrane. Stem Cell Res. 2012;9:9–23.
- Perlman H, Bradley K, Liu H, et al. IL-6 and matrix metalloproteinase-1 are regulated by the cyclin-dependent kinase inhibitor p21 in synovial fibroblasts. J Immunol. 2003;170(2):838–845. DOI:https://doi.org/10.4049/jimmunol.170.2.838.
- Rotte A, Martinka M, Li G. MMP2 expression is a prognostic marker for primary melanoma patients. Cell Oncol (Dordr). 2012;35:207–216.
- Komarov PG, Komarova EA, Kondratov RV, et al. A chemical inhibitor of p53 that protects mice from the side effects of cancer therapy. Science. 1999;285:1733–1737.
- Kogan-Sakin I, Tabach Y, Buganim Y, et al. Mutant p53(R175H) upregulates Twist1 expression and promotes epithelial-mesenchymal transition in immortalized prostate cells. Cell Death Differ. 2011;18:271–281.
- Yang J, Mani SA, Donaher JL, et al. Twist, a master regulator of morphogenesis, plays an essential role in tumor metastasis. Cell. 2004;117:927–939.
- Mani SA, Guo W, Liao MJ, et al. The epithelial-mesenchymal transition generates cells with properties of stem cells. Cell. 2008;133:704–715.
- Radisky ES, Radisky DC. Matrix metalloproteinase-induced epithelial-mesenchymal transition in breast cancer. J Mammary Gland Biol Neoplasia. 2010;15(2):201–212.
- Margetts PJ. Twist: a new player in the epithelial-mesenchymal transition of the peritoneal mesothelial cells. Nephrol Dial Transplant. 2012;27(11):3978–3981.
- Lu K, Dong JL, Fan WJ. Twist1/2 activates MMP2 expression via binding to its promoter in colorectal cancer. Eur Rev Med Pharmacol Sci. 2018;22:8210–8219.
- Li C, Ren Y, Jia X, et al. Twist overexpression promoted epithelial-to-mesenchymal transition of human peritoneal mesothelial cells under high glucose. Nephrol Dial Transplant. 2012;27:4119–4124.
- Weiss MB, Abel EV, Mayberry MM, et al. TWIST1 is an ERK1/2 effector that promotes invasion and regulates MMP-1 expression in human melanoma cells. Cancer Res. 2012;72:6382–6392.
- Gonzalez-Avila G, Sommer B, Mendoza-Posada DA, et al. Matrix metalloproteinases participation in the metastatic process and their diagnostic and therapeutic applications in cancer. Crit Rev Oncol Hematol. 2019;137:57–83.
- Wang Y, Liu J, Ying X, et al. Twist-mediated epithelial-mesenchymal transition promotes breast tumor cell invasion via inhibition of hippo pathway. Sci Rep. 2016;6(1):24606.
- Vasquez-Trincado C, Garcia-Carvajal I, Pennanen C, et al. Mitochondrial dynamics, mitophagy and cardiovascular disease. J Physiol. 2016;594(3):509–525. DOI:https://doi.org/10.1113/JP271301.
- Itahana Y, Han R, Barbier S, et al. The uric acid transporter SLC2A9 is a direct target gene of the tumor suppressor p53 contributing to antioxidant defense. Oncogene. 2015;34(14):1799–1810.
- Levine B, Abrams J. p53: the Janus of autophagy? Nat Cell Biol. 2008;10(6):637–639.
- White E. Autophagy and p53. Cold Spring Harb Perspect Med. 2016;6(4):a026120.
- Trimmer PA, Smith TS, Jung AB, et al. Dopamine neurons from transgenic mice with a knockout of the p53 gene resist MPTP neurotoxicity. Neurodegeneration. 1996;5(3):233–239.
- Matsusaka H, Ide T, Matsushima S, et al. Targeted deletion of p53 prevents cardiac rupture after myocardial infarction in mice. Cardiovasc Res. 2006;70(3):457–465. DOI:https://doi.org/10.1016/j.cardiores.2006.02.001.
- Zhang X, Cheng X, Yu L, et al. MCOLN1 is a ROS sensor in lysosomes that regulates autophagy. Nat Commun. 2016;7(1):12109. DOI:https://doi.org/10.1038/ncomms12109.
- Kiselyov K, Chen J, Rbaibi Y, et al. TRP-ML1 is a lysosomal monovalent cation channel that undergoes proteolytic cleavage. J Biol Chem. 2005;280(52):43218–43223. DOI:https://doi.org/10.1074/jbc.M508210200.
- Dar AA, Belkhiri A, Ecsedy J, et al. Aurora kinase A inhibition leads to p73-dependent apoptosis in p53-deficient cancer cells. Cancer Res. 2008;68(21):8998–9004.
- Berns K, Hijmans EM, Mullenders J, et al. A large-scale RNAi screen in human cells identifies new components of the p53 pathway. Nature. 2004;428(6981):431–437. DOI:https://doi.org/10.1038/nature02371.
- Marcazzan S, Dadbin A, Brachi G, et al. Development of lung metastases in mouse models of tongue squamous cell carcinoma. Oral Dis. 2021;27(3):494–505. DOI:https://doi.org/10.1111/odi.13592.
- Yue W, Hamai A, Tonelli G, et al. Inhibition of the autophagic flux by salinomycin in breast cancer stem-like/progenitor cells interferes with their maintenance. Autophagy. 2013;9(5):714–729. DOI:https://doi.org/10.4161/auto.23997.
- Wang W, Zhang X, Gao Q, et al. A voltage-dependent K+ channel in the lysosome is required for refilling lysosomal Ca2+ stores. J Cell Biol. 2017;216(6):1715–1730. DOI:https://doi.org/10.1083/jcb.201612123.