
ABSTRACT
Selective macroautophagy/autophagy maintains cellular homeostasis through the lysosomal degradation of specific cellular proteins or organelles. The pro-survival effect of selective autophagy has been well-characterized, but the mechanism by which it drives cell death is still poorly understood. Here, we use a quantitative proteomic approach to identify HPCAL1 (hippocalcin like 1) as a novel autophagy receptor for the selective degradation of CDH2 (cadherin 2) during ferroptosis. HPCAL1-dependent CDH2 depletion increases susceptibility to ferroptotic death by reducing membrane tension and favoring lipid peroxidation. Site-directed mutagenesis aided by bioinformatic analyses revealed that the autophagic degradation of CDH2 requires PRKCQ (protein kinase C theta)-mediated HPCAL1 phosphorylation on Thr149, as well as a non-classical LC3-interacting region motif located between amino acids 46–51. An unbiased drug screening campaign involving 4208 small molecule compounds led to the identification of a ferroptosis inhibitor that suppressed HPCAL1 expression. The genetic or pharmacological inhibition of HPCAL1 prevented ferroptosis-induced tumor suppression and pancreatitis in suitable mouse models. These findings provide a framework for understanding how selective autophagy promotes ferroptotic cell death.Abbreviations: ANXA7: annexin A7; ARNTL: aryl hydrocarbon receptor nuclear translocator like; CCK8: cell counting kit-8; CDH2: cadherin 2; CETSAs: cellular thermal shift assays; CPT2: carnitine palmitoyltransferase 2; DAMP, danger/damage-associated molecular pattern; DPPH: 2,2-diphenyl-1-picrylhydrazyl; DFO: deferoxamine; EBNA1BP2: EBNA1 binding protein 2; EIF4G1: eukaryotic translation initiation factor 4 gamma 1; FBL: fibrillarin; FKBP1A: FKBP prolyl isomerase 1A; FTH1: ferritin heavy chain 1; GPX4: glutathione peroxidase 4; GSDMs: gasdermins; HBSS: Hanks’ buffered salt solution; HMGB1: high mobility group box 1; HNRNPUL1: heterogeneous nuclear ribonucleoprotein U like 1; HPCAL1: hippocalcin like 1; H1-3/HIST1H1D: H1.3 linker histone, cluster member; IKE: imidazole ketone erastin; KD: knockdown; LDH: lactate dehydrogenase; LIR: LC3-interacting region; MAGOH: mago homolog, exon junction complex subunit; MAP1LC3B: microtubule associated protein 1 light chain 3 beta; MDA: malondialdehyde; MLKL: mixed lineage kinase domain like pseudokinase; MPO: myeloperoxidase; MTOR: mechanistic target of rapamycin kinase; OE: overexpressing; OSTM1: osteoclastogenesis associated transmembrane protein 1; PRKC/PKC: protein kinase C; PRKAR1A: protein kinase cAMP-dependent type I regulatory subunit alpha; PRDX3: peroxiredoxin 3; PTGS2: prostaglandin-endoperoxide synthase 2; ROS: reactive oxygen species; SLC7A11: solute carrier family 7 member 11; SLC40A1: solute carrier family 40 member 1; SPTAN1: spectrin alpha, non-erythrocytic 1; STS: staurosporine; UBE2M: ubiquitin conjugating enzyme E2 M; ZYX: zyxin
Introduction
Autophagy is a conserved cellular degradation process that can eliminate various components (such as abnormal protein aggregates, damaged organelles, and invading pathogens) through the formation of dynamic membrane structures (phagophores, autophagosomes, and autolysosomes) [Citation1,Citation2]. An increase in autophagic flux usually increases cellular fitness vis-à-vis environmental stress by eliminating damaged cellular structures, as well as by recycling macromolecules and nutrients [Citation3,Citation4]. However, in specific circumstances the activation of autophagy may lead to cell death [Citation5,Citation6]. This process is defined as “autophagy-dependent cell death” by the Nomenclature Committee of Cell Death [Citation7]. In particular, excessive autophagy activation has been recently recognized as a mechanism for mediating ferroptosis [Citation8], a type of regulated cell death that can be induced by the pharmacological inhibition of antioxidant SLC7A11/system xc−/xCT (solute carrier family 7 member 11; e.g., by using erastin) or GPX4 (glutathione peroxidase 4; e.g., by using RSL3) [Citation9,Citation10]. The mechanisms that govern specific forms of autophagy-dependent ferroptosis have not been characterized.
In this study, we utilized quantitative proteomics to determine an unexpected role of HPCAL1 (hippocalcin like 1) as a membrane-enriched protein involved in ferroptosis induction. HPCAL1 mediates ferroptosis through its noncanonical function in autophagy, rather than its classic calcium-binding activity [Citation11]. The unbiased identification of HPCAL1-associated proteins further revealed that CDH2/N-cadherin (cadherin 2) is a direct degradation substrate of HPCAL1-dependent autophagy, which leads to ferroptosis though impaired membrane tension. We also clarified the structural basis of HPCAL1-mediated autophagic CDH2 degradation, and identified a small molecule compound targeting HPCAL1, called iHPCAL1, that suppresses ferroptosis in vitro and in vivo. These findings provide insights into the mechanisms of autophagy-dependent cell death and emphasize the possibility to target HPCAL1 for the prevention of pathogenic ferroptosis.
Results
HPCAL1 is essential for ferroptosis
Although ferroptosis is characterized by lipid peroxidation of organellar and plasma membranes [Citation12,Citation13], the key membrane regulatory protein for ferroptosis remains unclear. To identify new players in ferroptosis, we performed quantitative mass spectrometry analysis of membrane fractions from HT-1080 (human fibrosarcoma) and Calu-1 (human non-small cell lung cancer) cells, which are widely used to study the mechanism of ferroptosis following treatment with the GPX4 inhibitor RSL3 ()). Quantitative mass spectrometry identified approximately 752 different membrane proteins in RSL3-treated HT-1080 and Calu-1 cells. A subsequent pathway enrichment analysis of these membrane proteins using the STRING database (https://string-db.org) revealed that tricarboxylic acid cycle cycle metabolism was among the most affected pathways in ferroptosis ()). These pathway analyses support previous reports on the involvement of the mitochondrial tricarboxylic acid cycle and lipid metabolism in ferroptosis [Citation14–17].
Figure 1. Identification of HPCAL1 as a positive regulator of ferroptosis. (a) Schematic overview of quantitative mass spectrometry analysis of membrane fractionation of HT-1080 and Calu-1 cells following treatment with RSL3 (0.5 μM) for 4 h. C: cytoplasmic; M: membrane; N: nuclear. (b) Analysis of functional pathway enrichment for protein-protein interaction networks using STRING. (c) The pie chart shows the upregulated proteins in the membrane fractionation of RSL3-treated HT-1080 or Calu-1 cells. A subsequent two rounds of transient transfection of siRNA and screening for genes encoding 16 co-upregulated proteins confirmed that only HPCAL1 siRNA reduced the anticancer activity of RSL3 (0.5 μM, 24 h) in HT-1080 and Calu-1 cells (n = 3 biologically independent samples; *P < 0.05 versus control siRNA group; two-way ANOVA with Tukey’s multiple comparisons test; data are presented as means ± SD). (d) Western blot analysis of the indicated proteins in control and HPCAL1-knockdown (HPCAL1 KD) HT-1080 and Calu-1 cells. (e) Analysis of cell viability in control and HPCAL1-knockdown (HPCAL1 KD) HT-1080 and Calu-1 cells following treatment with RSL3 or erastin at the indicated dose for 24 h (n = 3 biologically independent samples; data are presented as means ± SD). (f) Propidium iodide (PI) staining analysis of cell death in control and HPCAL1-knockdown (HPCAL1 KD) HT-1080 and Calu-1 cells following treatment with RSL3 (0.5 μM) or erastin (5 μM) for 24 h (n = 3 biologically independent samples; *P < 0.05 versus control shRNA group; two-way ANOVA with Tukey’s multiple comparisons test; data are presented as mean ± SD). (g) ELISA analysis of HMGB1 release in control and HPCAL1-knockdown (HPCAL1 KD) HT-1080 and Calu-1 cells following treatment with RSL3 (0.5 μM) or erastin (5 μM) for 24 h (n = 3 biologically independent samples; *P < 0.05 versus control shRNA group; two-way ANOVA with Tukey’s multiple comparisons test; data are presented as means ± SD). (h) Control and HPCAL1 knockdown (HPCAL1 KD) HT-1080 and Calu-1 cells were treated with RSL3 (0.5 μM, 4 h) or erastin (5 μM, 6 h). The accumulation of lipid hydroperoxides in cells was assessed by a fluorescence probe with C11-BODIPY 581/591 (n = 3 biologically independent samples; *P < 0.05 versus control shRNA group; two-way ANOVA with Tukey’s multiple comparisons test; data are presented as mean ± SD). (i) Analysis of cell viability in control and HPCAL1-knockdown (HPCAL1 KD1) HT-1080 and Calu-1 cells following treatment with ML162 (0.5 μM), ML210 (5 μM), FIN56 (2.5 μM), FINO2 (10 μM), or sulfasalazine (0.4 mM) for 24 h (n = 3 biologically independent samples; *P < 0.05 versus control shRNA group; two-way ANOVA with Tukey’s multiple comparisons test; data are presented as mean ± SD). (j) Analysis of cell viability in control and HPCAL1-knockdown (HPCAL1 KD) HT-1080 and Calu-1 cells following treatment with staurosporine (an apoptosis inducer) at the indicated dose for 24 h (n = 3 biologically independent samples; data are presented as means ± SD). (k) qPCR analysis of HPCAL1 mRNA in control, HPCAL1-knockdown (HPCAL1 KD1), or HPCAL1 rescue (HPCAL1 KD1 + HPCAL1) HT-1080 cells (n = 3 biologically independent samples; data are presented as means ± SD). (l) Analysis of cell viability in control, HPCAL1-knockdown (HPCAL1 KD1), or HPCAL1 rescue (HPCAL1 KD1 + HPCAL1) HT-1080 cells following treatment with RSL3 or erastin in the absence or presence of liproxstatin-1 (Lip1, 1 μM) or Z-VAD-FMK (ZVAD, 20 μM) for 24 h (n = 3 biologically independent samples; data are presented as means ± SD).
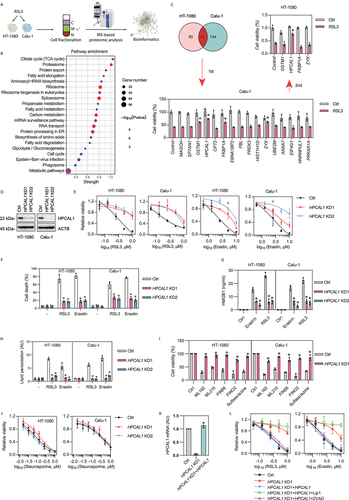
Next, we sought to determine whether individual membrane-enriched proteins might be involved in ferroptosis. A total of 16 significant upregulated proteins, including MAGOH (mago homolog, exon junction complex subunit), SPTAN1 (spectrin alpha, non-erythrocytic 1), OSTM1 (osteoclastogenesis associated transmembrane protein 1), HPCAL1, CPT2 (carnitine palmitoyltransferase 2), FKBP1A (FKBP prolyl isomerase 1A), EBNA1BP2 (EBNA1 binding protein 2), FBL (fibrillarin), PRDX3 (peroxiredoxin 3), H1-3/HIST1H1D (H1.3 linker histone, cluster member), ZYX (zyxin), UBE2M (ubiquitin conjugating enzyme E2 M), ANXA7 (annexin A7), EIF4G1 (eukaryotic translation initiation factor 4 gamma 1), HNRNPUL1 (heterogeneous nuclear ribonucleoprotein U like 1), and PRKAR1A (protein kinase cAMP-dependent type I regulatory subunit alpha) were found in the membrane fractions of both RSL3-treated HT-1080 and Calu-1 cells ()). Subsequently, two rounds of transient transfection with siRNAs targeting each of these 16 proteins led to the conclusion that only HPCAL1 siRNA reduced cell death induction by RSL3 in both HT-1080 and Calu-1 cells ()).
To further confirm the role of HPCAL1 in promoting ferroptosis, we used two specific shRNAs to generate stable HPCAL1-knockdown (HPCAL1 KD) HT-1080 and Calu-1 cells. Western blot analysis confirmed that the protein expression of HPCAL1 was downregulated in HPCAL1 KD cells by over 95% ()). In line with the HPCAL1 siRNA experiment ()), HPCAL1 shRNA inhibited RSL3- or erastin-induced growth inhibition in HPCAL1 KD HT-1080 and Calu-1 cells ()). Propidium iodide staining ()) combined with a quantitative analysis of HMGB1 (high mobility group box 1; a danger/damage-associated molecular pattern [DAMP] molecule in ferroptotic cell death [Citation18]) release ()) revealed that the loss of HPCAL1 sustained membrane integrity. A subsequent lipid peroxidation assay using a C11 BODIPY 581/591 probe supported the hypothesis that HPCAL1 is a positive regulator of lipid peroxidation during RSL3- or erastin-induced ferroptosis ()). The pro-ferroptotic role of HPCAL1 was corroborated in HT-1080 and Calu-1 cells exposed to other ferroptosis inducers (including ML162, ML210, FIN56, FINO2, and sulfasalazine) ()). In sharp contrast, cell killing by the apoptosis inducer staurosporine (STS) was not affected by HPCAL1 knockdown ()), suggesting a selective role of HPCAL1 in promoting ferroptosis, rather than apoptosis.
We further determined whether HPCAL1 overexpression (HPCAL1 OE) would yield a pro-ferroptotic phenotype. Indeed, HPCAL1 overexpression mediated by gene transfection increased the sensitivity of HT-1080 and Calu-1 cells to RSL3 or erastin (Fig. S1). The transfection-enforced expression of HPCAL1 reestablished the sensitivity of HPCAL1 KD HT-1080 cells to RSL3 or erastin, and this effect was inhibited by a ferroptosis inhibitor (liproxstatin-1, a radical-trapping antioxidant that scavenges lipid radicals in membranes), but not an apoptosis inhibitor (Z-VAD-FMK, a pan-caspase inhibitor) ()).
Although HPCAL1 was originally found in the retina and brain [Citation19,Citation20], the Human Protein Atlas (https://www.proteinatlas.org) indicates that HPCAL1 is widely expressed in various tissues and cells (Fig. S2A and S2B). The knockdown of HPCAL1 by shRNAs in other human cancer cell lines, including PANC1 (pancreatic carcinoma), 5637 (bladder carcinoma), SKOV3 (ovarian cancer), and PC-3 (prostate cancer) cells, also inhibited RSL3- or erastin-induced cell death (Fig. S2C and S2D). Altogether, these findings support a role of HPCAL1 in mediating ferroptotic death, irrespective of the specific cell type.
HPCAL1-mediated CDH2 inhibition promotes ferroptosis
Calcium plays a context-dependent role as a ubiquitous second messenger in promoting or inhibiting cell death [Citation21]. Previous studies showed that calcium influx initiates membrane repair during ferroptosis [Citation22]. Because HPCAL1 is a calcium-binding protein [Citation11], we wondered whether HPCAL1-mediated calcium signals would modulate ferroptosis. The presence or absence of calcium did not significantly affect the sensitivity of cells to RSL3 or erastin (Fig. S3A). BAPTA, a calcium chelator, failed to affect RSL3-induced growth inhibition in HPCAL1-knockdown (HPCAL1 KD) or HPCAL1-overexpressing (HPCAL1 OE) Calu-1 cells (Fig. S3B). These data suggest that calcium may be not involved in HPCAL1-mediated ferroptosis.
The recruitment and activation of pore-forming proteins is a recurrent mechanism of plasma membrane permeabilization in different cell death subroutines [Citation23]. For example, GSDMs (gasdermins) and MLKL (mixed lineage kinase domain like pseudokinase) act as effectors in pyroptosis or necroptosis, respectively, through their pore-forming ability [Citation24–28]. However, a liposome leakage assay, based on the fluorescence de-quenching of entrapped dyes upon their release in a bulk solution [Citation29], revealed that HPCAL1 protein failed to permeabilize lipid bilayers, be it in the absence or presence of Fe2+ or Fe3+ (Fig. S4). Thus, unlike POR (cytochrome P450 oxidoreductase) [Citation30], HPCAL1 may not directly catalyze the permeabilization/oxidation of lipids during ferroptosis.
To further determine whether HPCAL1 binds to ferroptosis-relevant proteins, we immunoprecipitated HPCAL1 with suitable antibodies in whole cell extracts, and then performed quantitative mass spectrometry. This analysis identified approximately 600 different HPCAL1-binding proteins in RSL3-treated versus untreated HT-1080 and Calu-1 cells ()). A subsequent GO enrichment analysis of HPCAL1-binding membrane proteins suggested that focal adhesion (a type of adhesive contact between the cell and extracellular matrix) and the cell-substrate junction (which not only affects signal transduction, but also participates in the degradation of proteins or organelles) are the two most affected pathways ()). These analyses support the prior finding that both low cell density and the autophagy machinery are important factors favoring ferroptosis [Citation31,Citation32].
Figure 2. HPCAL1 promotes ferroptosis through interaction with CDH2. (a) Mass spectrometry analysis of HPCAL1-binding proteins in HT-1080 and Calu-1 cells following treatment with RSL3 (0.5 μM) for 4 h. Data are displayed as a scatter plot according to the fold change level. (b) Gene ontology (GO) analysis of HPCAL1-binding membrane proteins. (c) Immunoprecipitation (IP) analysis of CDH2-binding proteins in HT-1080 and Calu-1 cells following treatment with RSL3 (0.5 μM) or staurosporine (0.5 μM) for 4 h. IB, immunoblot. (d) Western blot analysis of the indicated protein expression in HPCAL1-knockdown (HPCAL1 KD2) HT-1080 and Calu-1 cells after transfection with control or CDH2 siRNAs. (e, f) Cell viability of indicated HPCAL1 KD2 HT-1080 and Calu-1 cells following treatment with (e) RSL3 (0.5 μM) or (f) erastin (5 μM) in the absence or presence of ferrostatin-1 (Fer-1; 1 μM), DFO (40 μM), or Z-VAD-FMK (ZVAD; 20 μM) for 24 h (n = 3 biologically independent samples; *P < 0.05 versus RSL3 or erastin treatment group; two-way ANOVA with Tukey’s multiple comparisons test; data are presented as mean ± SD). (g) Western blot analysis of the indicated protein expression in HPCAL1-overexpressing (HPCAL1 OE) HT-1080 and Calu-1 cells after transfection with control or CDH2 cDNA. (h) Cell viability of the indicated HPCAL1 OE HT-1080 and Calu-1 cells following treatment with RSL3 or erastin at the indicated dose for 24 h (n = 3 biologically independent samples; data are presented as mean ± SD). (i) Membrane tension analysis of control, HPCAL1 KD2 or CDH2 si#1 HT-1080 cells following treatment with RSL3 (0.5 μM) or staurosporine (0.5 μM) for 4 h (scale bar: 100 µm; n = 3 biologically independent samples; *P < 0.05; two-way ANOVA with Tukey’s multiple comparisons test; data are presented as mean ± SD). (j, k) Cell viability (j, 24 h) and lipid peroxidation (k, 4 h) of indicated HPCAL1 KD2 Calu-1 cells following treatment with RSL3 (0.5 μM) in the absence or presence of chloroquine (CQ; 20 μM) or α-tocopherol (α-To; 40 μM) (n = 3 biologically independent samples; *P < 0.05 versus RSL3 treatment group; two-way ANOVA with Tukey’s multiple comparisons test; data are presented as mean ± SD).
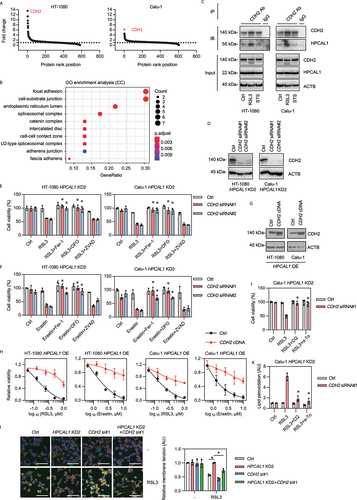
We then focused on CDH2 because it is the most abundant candidate for interaction with HPCAL1 in HT-1080 and Calu-1 cells as indicated by quantitative mass spectrometry analysis ()). Immunoprecipitation confirmed increased binding between CDH2 and HPCAL1 in RSL3-induced ferroptosis, but not in STS-induced apoptosis ()), highlighting a unique role of the HPCAL1-CDH2 complex in ferroptosis.
To investigate the relationship between HPCAL1 and CDH2 in ferroptosis, we used two distinct siRNAs to suppress more than 90% of CDH2 expression in ferroptosis-resistant HPCAL1 KD HT-1080 and Calu-1 cells ()). Knockdown of CDH2 restored the sensitivity of HPCAL1 KD cells to RSL3 ()) and erastin ()). This enhanced cytotoxic response caused by CDH2 silencing was reversed by ferroptosis inhibitors (ferrostatin-1 and deferoxamine [DFO]), but not by the apoptosis inhibitor Z-VAD-FMK ()). The overexpression of CDH2 limited the cytocidal activity of RSL3 or erastin on HPCAL1 OE HT-1080 and Calu-1 cells ()). Altogether, these functional analyses suggest that HPCAL1 promotes ferroptosis by hijacking the anti-ferroptotic CDH2 protein.
The sensitivity to cellular ferroptosis is negatively regulated by cell density, which favors cell-cell interactions [Citation31,Citation32]. CDH2 is well known to participate in the formation of cell-cell interactions and acts as a mechanotransducer for sensing changes in membrane tension [Citation33]. We investigated the relationship between HPCAL1 and CDH2 in regulating mechanotransduction during ferroptosis using a fluorescent membrane tension probe, Flipper-TR [Citation34]. This probe specifically targets the plasma membrane of the cell and reports changes in membrane tension through its fluorescence lifetime output [Citation34]. The knockdown of HPCAL1 prevented RSL3-induced downregulation of mechanotransduction in Calu-1 cells, but simultaneous knockdown of both HPCAL1 and CDH2 was less effective in counteracting the RSL3 effect ()). Moreover, the autophagy inhibitor chloroquine and the lipid antioxidant α-tocopherol inhibited RSL3-induced cell death and lipid peroxidation ()).
HPCAL1 mediates CDH2 degradation
Next, we asked how the formation of the HPCAL1-CDH2 complex inhibits the pro-ferroptotic action of CDH2 function. We first examined CDH2 expression in erastin- or RSL3-treated HT-1080 and Calu-1 cells. The protein expression of CDH2 (rather than that of HPCAL1) was downregulated by more than 40%-60% in response to RSL3 or erastin ()), whereas the apoptosis inducer STS failed to affect CDH2 protein expression ()). We performed subsequent drug intervention experiments to test whether CDH2 protein is turned over by autophagy (using spautin-1 and chloroquine) or the ubiquitin-proteasome degradation pathway (using bortezomib). Spautin-1 or chloroquine, but not bortezomib, inhibited the degradation of CDH2 induced by RSL3 or erastin ()), suggesting that autophagy mediates CDH2 protein degradation in HT-1080 and Calu-1 cells during ferroptosis. Western blot analysis showed that chloroquine increased erastin-induced MAP1LC3B (microtubule associated protein 1 light chain 3 beta)-II production ()), indicating that autophagic flux is increased during ferroptosis. The time course assay indicated that the production of reactive oxygen species (ROS) (Fig. S5A), Fe2+ (Fig. S5B), and MAP1LC3B-II (Fig. S5C) preceded RSL3-induced degradation of CDH2 protein. The lipid ROS scavenger ferrostatin-1 inhibited RSL3-induced ROS and MAP1LC3B-II production and CDH2 degradation (Fig. S5A-S5C). In contrast, ferrostatin-1 failed to inhibit RSL3-induced Fe2+ accumulation (Fig. S5A-S5C). As expected, chloroquine increased the accumulation of CDH2 in autophagosomes during RSL3-induced ferroptosis (Fig. S5D).
Figure 3. HPCAL1 promotes CDH degradation during ferroptosis. (a, b) Western blot analysis of the indicated protein expression in HT-1080 cells following treatment with erastin (5 μM, 12 h) or RSL3 (0.5 μM, 6 h) in the absence or presence of spautin-1 (5 μM), chloroquine (CQ; 20 μM) or bortezomib (BTZ; 0.1 μM). (c, d) Western blot analysis of the indicated protein expression in control and HPCAL1-knockdown (HPCAL1 KD) HT-1080 and Calu-1 cells following treatment with (c) 0.5 μM RSL3 (6 h) or (d) 5 μM erastin (12 h). (e) Western blot analysis of whole cell lysates (WCL) or cell fractionation (C: cytoplasmic; M: membrane; N: nuclear/cytoskeletal) of HT-1080 and Calu-1 cells following treatment with RSL3 (0.5 μM) for 4 h. (f, g) The protein-lipid overlay assay of the interaction between HPCAL1 protein and lipid. Recombinant HPCAL1 was incubated with a membrane spotted with the indicated lipids and analyzed by chemiluminescent detection. PI: phosphatidylinositol. (h) Immunoprecipitation (IP) analysis of HPCAL1-binding proteins in membrane fractionation of Calu-1 cells following treatment with RSL3 (0.5 μM) for 4 h. IB, immunoblot. WCL: whole cell lysate. M: membrane fractionation. (i) Predicted LC3-interacting region (LIR) domain in human HPCAL1 protein. (j) HEK293 cells were co-transfected with indicated FLAG-tagged HPCAL1and GFP-LC3 plasmid. Cell lysates were subjected to immunoprecipitation with anti-FLAG antibodies. Western blots of the immunoprecipitates and of the cell extracts were revealed using anti-GFP polyclonal antibodies to detect GFP-LC3 or anti-FLAG monoclonal antibodies to detect FLAG-tagged HPCAL1. (k) Effects of LIR deletion (Δ46-51) in HPCAL1 on CDH2 degradation in HT-1080 or Calu-1 cells following treatment with RSL3 (0.5 μM, 6 h) or erastin (5 μM, 12 h). (l) Analysis of cell viability in control, HPCAL1-knockdown (HPCAL1 KD1), or indicated HPCAL1 rescue HT-1080 cells following treatment with RSL3 or erastin for 24 h (n = 3 biologically independent samples; data are presented as means ± SD).
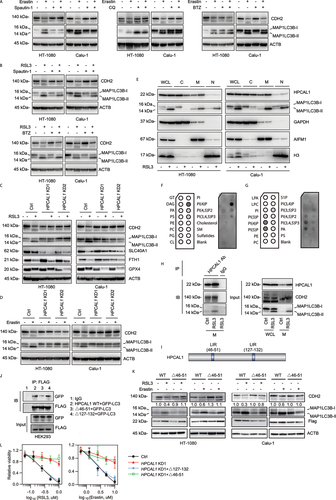
In the next step, we obtained evidence that HPCAL1 selectively mediates the autophagic degradation of CDH2 protein during ferroptosis. The knockdown of HPCAL1 in HT-1080 and Calu-1 cells not only blocked RSL3- or erastin-induced CDH2 degradation, but also limited the production of MAP1LC3B-II ()) which is a marker of autophagosomes [Citation35]. It is worth noting that the knockdown of HPCAL1 had no significant effect on the degradation of other known protein substrates (such as SLC40A1 [solute carrier family 40 member 1] [Citation36], FTH1 [ferritin heavy chain 1] [Citation37] and GPX4 [Citation38]) related to ferroptosis resistance ()). Moreover, HPCAL1 was not necessary for the generation of MAP1LC3B-II during classical autophagy caused by starvation (via Hanks’ buffered salt solution [HBSS]) or inhibition of MTOR (mechanistic target of rapamycin kinase) with rapamycin, where CDH2 did not undergo protein degradation (Fig. S5E and S5F). These findings indicate that HPCAL1 is selectively responsible for CDH2 degradation during ferroptosis.
Because autophagy receptors usually connect MAP1LC3B-II on phagophores and autophagosomes to the cargo that is destined for degradation, we studied the membrane lipid localization of HPCAL1 and MAP1LC3B-II. Western blot analysis revealed an increased expression of HPCAL1 and MAP1LC3B-II in the membrane fractions of HT-1080 and Calu-1 cells following treatment with RSL3 ()). HPCAL1 was found to bind to specific membrane lipids, such as phosphatidylinositol (PtdIns)4P, PtdIns5P, PtdIns(3,4,5)P3, and to a lesser extent, PtdIns(4,5)P2 ()), indicating the ability of HPCAL1 to bind inositol phospholipids. This is consistent with the previous finding that inositol phospholipids are key orchestrators of autophagosome formation and maturation [Citation39]. As expected, co-immunoprecipitation confirmed increased binding between HPCAL1, CDH2, and MAP1LC3B-II in the membrane fractions of HT-1080 and Calu-1 cells following treatment with RSL3 ()).
Autophagy receptors usually recognize and recruit specific cargoes to the autophagosome-lysosome pathway through the LC3-interacting region (LIR) motif, a cargo-interacting domain [Citation40]. To further support the idea that HPCAL1 might be an autophagy receptor for CDH2 degradation, we inspected the protein sequence of HPCAL1. Using the iLIR database (https://ilir.warwick.ac.uk/search.php), we identified two putative LIR motifs in HPCAL1, namely DEFFKKI (aa 46–51) and AIYKMV (aa 127–132) ()). To determine the effect of these LIR motifs on the interaction between HPCAL1 and MAP1LC3B, HEK293 cells were co-transfected with FLAG-tagged HPCAL1 mutants and GFP-LC3. Compared with wild type, the binding of HPCAL1 and GFP-LC3 was not affected by Δ127-132 ()). However, the binding of Δ46-51 to GFP-LC3 was significantly reduced ()). Consequently, the deletion of DEFFKKI (Δ46-51) inhibited RSL3- or erastin-induced CDH2 protein degradation ()). The transfection-enforced expression of Δ127-132, rather than Δ46-51, restored the sensitivity of HPCAL1 KD HT-1080 cells to RSL3 or erastin ()).
PRKCQ-mediated HPCAL1 phosphorylation promotes CDH2 degradation
Phosphorylation is a posttranslational modification that often controls the function of autophagy receptors [Citation41]. We decided to examine whether and how HPCAL1 phosphorylation regulates CDH2 degradation in ferroptosis. We first investigated the kinase families involved in the regulation of ferroptosis using the commercial KinomeView profiling kit (including a set of 16 phospho-motif-specific antibodies) ()). The relatively low molecular mass of HPCAL1 (22 kDa) is compatible with the direct detection of phosphorylation by gel-shift assays. Indeed, a time-dependent increase in the phosphorylation of a PRKC/PKC (protein kinase C) substrate (antibody #11) of approximately 22 kDa was found in HT-1080 ()), Calu1 ()), and PANC1 ()) cells following treatment with RSL3. However, there was no obvious accumulation of this 22-kDa PRKC substrate in HT-1080 and Calu-1 cells treated with classical autophagy stimulation, HBSS or rapamycin (Fig. S5G and S5H). These findings indicate that PRKC substrate proteins may be selectively involved in ferroptosis-related autophagy, but not in classical autophagy.
Figure 4. Phosphorylation of HPCAL1 is required for ferroptosis. (a) Western blot analysis of protein expression using a commercial KinomeView Profiling Kit in HT-1080 cells following treatment with RSL3 (0.5 μM) for increasing time periods (3, 6, and 9 h). Ab#1: phospho-AKT substrate (110B7E); Ab#2: phospho-AKT substrate (23C8D2); Ab#3: phospho-(Ser/Thr) AMPK substrate (P-S/T2-102); Ab#4: phospho-(Ser) ATM/ATR substrate (D23 H2/D69H5); Ab#5: phospho-(Ser/Thr) ATM/ATR substrate (S*/T*QG) (P-S/T2-100); Ab#6: phospho-(Ser) CDK substrate (P-S2-100); Ab#7: phospho-(Ser/Thr) CSNK2/CK2 substrate (P-S/T3-100); Ab#8: phospho-MAPK/CDK substrate (34B2); Ab#9: phospho-(Ser/Thr) PDK1 docking motif (18A2); Ab#10: phospho-PRKA/PKA substrate (100G7E); Ab#11: phospho-(Ser) PRKC/PKC substrate (P-S3-101); Ab#12: phospho-(Thr) PLK binding motif (D73 F6); Ab#13: phospho-Thr-Pro motif; Ab#14: phospho-Thr-Pro-Glu (C32 G12); Ab#15: phospho-Thr-X-Arg motif; Ab#16: phospho-tyrosine (P-Tyr-1000). (b) Western blot analysis of protein expression using Ab#11 antibodies in Calu-1 and PANC1 cells following treatment with RSL3 (0.5 μM) for increasing time periods (3, 6, and 9 h). (c) Western blot analysis of protein expression using Ab#11 antibodies in control and HPCAL1-knockdown (HPCAL1 KD1) HT-1080 and Calu-1 cells following treatment with 0.5 μM RSL3 for 6 h. (d) Immunoprecipitation (IP) analysis of PRKC/PKC motif-containing proteins in HT-1080 cells following treatment with RSL3 (0.5 μM) for 4 h. IB, immunoblot. (e) Prediction of PRKC/PKC motif in human HPCAL1 protein. (f) Western blot analysis of the indicated protein expression in control or wild-type HPCAL1 (HPCAL1 OE)- or T149A mutated (HPCAL1T149A OE)-overexpressing HT-1080 and Calu-1 cells following treatment with RSL3 (0.5 μM, 6 h) or erastin (5 μM, 12 h). (g) Cell viability of the indicated HT-1080 or Calu-1 cells following treatment with RSL3 (0.1 μM) or erastin (1 μM) for 24 h (n = 3 biologically independent samples; two-way ANOVA with Tukey’s multiple comparisons test; data are presented as mean ± SD). (h) Western blot analysis of the indicated protein expression in HT-1080 or Calu-1 cells following treatment with RSL3 (0.5 μM) for increasing time periods (2, 4, and 6 h). (i) Immunoprecipitation (IP) analysis of PRKCQ-binding proteins in HT-1080 and Calu-1 cells following treatment with RSL3 (0.5 μM) or staurosporine (0.5 μM) for 4 h. IB, immunoblot. (j) Analysis of cell death in control and PRKCQ-knockdown (PRKCQ KD) HT-1080 and Calu-1 cells following treatment with RSL3 (0.5 μM) or erastin (5 μM) for 24 h (n = 3 biologically independent samples; *P < 0.05 versus control shRNA group; two-way ANOVA with Tukey’s multiple comparisons test; data are presented as mean ± SD). (k) Control and PRKCQ-knockdown (PRKCQ KD) HT-1080 and Calu-1 cells were treated with RSL3 (0.5 μM, 4 h) or erastin (5 μM, 6 h). The level of lipid peroxidation in cells was assessed with C11-BODIPY 581/591 (n = 3 biologically independent samples; *P < 0.05 versus control shRNA group; two-way ANOVA with Tukey’s multiple comparisons test; data are presented as mean ± SD). (l) Western blot analysis of the indicated protein expression in control and PRKCQ-knockdown (PRKCQ KD) HT-1080 and Calu-1 cells following treatment with RSL3 (0.5 μM, 6 h) or erastin (5 μM, 12 h). (m) Cell viability of indicated Calu-1 cells following treatment with RSL3 (0.5 μM) for 24 h (n = 3 biologically independent samples; data are presented as mean ± SD).
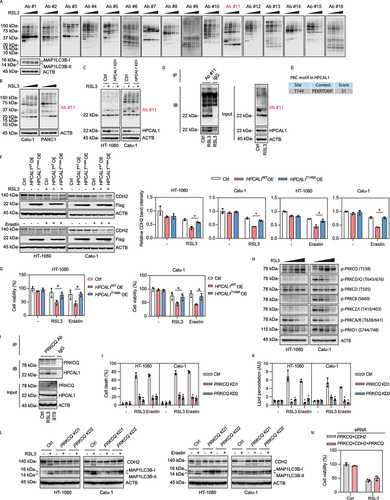
Our subsequent multiple analyses confirmed that HPCAL1 is a potential substrate of PRKC during ferroptosis. First, the knockdown of HPCAL1 inhibited RSL3- or erastin-induced phosphorylation of this 22-kDa PRKC substrate in HT-1080 and Calu-1 cells ()). Second, after immunoprecipitating the PRKC substrate using antibody #11, this 22-kDa PRKC substrate was detected by HPCAL1 antibodies ()). Third, as predicted by bioinformatics websites (http://www.cbs.dtu.dk/services/NetPhos/), Thr149 of HPCAL1 may be phosphorylated by PRKC ()). Functional assays showed that the overexpression of wild-type HPCAL1 (Thr149) enhanced CDH2 degradation, but the phosphorylation mutant (T149A) had a much-reduced effect ()), and a similar result was seen with the subsequent ferroptosis ()) induced by RSL3 and erastin. Fourth, two PRKC inhibitors, Go 6983 and bisindolylmaleimide I, inhibited RSL3- or erastin-induced ferroptosis, which was associated with decreased phosphorylation of the 22-kDa protein and limited CDH2 degradation (Fig. S6). Overall, these results support the hypothesis that PRKC-dependent phosphorylation of HPCAL1 mediates CDH2 degradation for ferroptosis.
The PRKC phospho-motif antibody cannot distinguish among members of the PRKC family, which are classified into two major groups: calcium dependent (e.g., PRKCA [protein kinase C alpha]) and calcium independent (e.g., PRKCQ [protein kinase C theta]) [Citation42]. To identify which kinase of the PRKC family is required for HPCAL1-mediated ferroptosis, we determined the phosphorylation of different PRKC family members. Western blot assays showed that RSL3 increased the phosphorylation of PRKCQ at Thr538 (a phosphorylation site that is essential for the activation of PRKCQ [Citation43]), but not the phosphorylation of the other 6 members of the PRKC famility ()). Unlike RSL3, HBSS or rapamycin failed to induce the phosphorylation of PRKCQ at Thr538 (Fig. S5G and S5H), supporting the implication of different kinase cascades in ferroptosis-associated versus classical autophagy.
We next examined the role of PRKCQ in ferroptosis. An immunoprecipitation analysis revealed an increased binding between PRKCQ and HPCAL1 in HT-1080 cells following treatment with RSL3, but not with the apoptosis inducer STS ()). The knockdown of PRKCQ limited the RSL3- or erastin-induced (but not STS-induced) inhibition of growth in HT-1080 and Calu-1 cells (Fig. S7A-7C). Notably, the knockdown of PRKCQ protected against cell death ()), lipid peroxidation ()), and the autophagic degradation of CDH2 ()) induced by RSL3 or erastin in HT-1080 and Calu-1 cells. As a control, the knockdown of calcium-dependent PRKCA failed to limit the anticancer activity of RSL3 or erastin in Calu-1 cells (Fig. S7D and S7E). Altogether, these findings not only support a critical role for calcium-independent PRKCQ in promoting the phosphorylation of HPCAL1, but also explain why only HPCAL1 selectively regulates ferroptosis rather than apoptosis, based on its phosphorylation modification. Furthermore, knockdown of PRKCQ failed to affect ferroptosis sensitivity induced in cells lacking HPCAL1 and CDK2 ()), supporting that PRKCQ is an upstream signal of ferroptosis.
Identification of iHPCAL1 as a ferroptosis inhibitor
To identify new HPCAL1 inhibitors, we screened 4208 small molecules with unknown targets. We treated HT-1080 cells with RSL3 in the absence or presence of each compound (all tested at 2 μM) and found that 157 compounds that effectively inhibited RSL3-induced cell death ()). We next evaluated whether any of these 157 compounds would decrease the protein expression of HPCAL1. Compounds #5 and #155 (both used at 10 μM) significantly inhibited HPCAL1 protein expression ()). Subsequent dose-response studies showed that compounds #5 and #155 suppressed the protein expression of HPCAL1 in HT-1080 and Calu-1 cells at 1.25–5 μM ()).
Figure 5. Identification of HPCAL1 inhibitor. (a) Cell viability of HT-1080 cells following treatment with RSL3 (0.5 μM) in the absence or presence of an inhibitor (2 μM) for 24 h. The relative inhibitory effects (RSL3&inhibitor/Ctrl ratio>80%) of 4208 compounds on anticancer activity of RSL3 are shown. (b) Western blot analysis of the indicated protein expression in HT-1080 cells following treatment with an inhibitor (10 μM) for 24 h. The relative effects of 157 potential ferroptosis inhibitors on the expression of HPCAL1 protein are shown. F: ferrostatin-1 (10 μM); C: control. (c) Western blot analysis of the indicated proteins in HT-1080 cells following treatment with compound #155 or #5 at 0, 0.625, 1.25, 2.5, and 5 μM for 24 h. The drug structure of #5 is shown in the right panel. (d) The antioxidant activity of the indicated compounds (10 μM) was analyzed by a 2,2-diphenyl-1-picrylhydrazyl (DPPH) assay that measured the reduction of DPPH in vitro. Ferrostatin-1 (Fer-1) was used as a positive control (n = 3 biologically independent samples; one-way ANOVA with Tukey’s multiple comparisons test; data are presented as mean ± SD; *P < 0.05 versus control group; ns, no significance). (e) The iron chelator activity of the indicated compounds (40 μM) was analyzed by using a ferrozine Fe2+ binding assay in vitro. Deferoxamine (DFO) was used as a positive control (n = 3 biologically independent samples; one-way ANOVA with Tukey’s multiple comparisons test; data are presented as mean ± SD; *P < 0.05 versus control group; ns, no significance). (f) Cell viability of HT-1080 cells following treatment with RSL3 at the indicated dose in the absence or presence of compound #5 (iHPCAL1, 2 μM) for 24 h (n = 3 biologically independent samples; data are presented as means ± SD). (g) Prediction of the interaction between compound #5 (iHPCAL1) and HPCAL1 protein. (h) The cellular thermal shift assay (CETSA) of HPCAL1 proteins for HT-1080 cells treated with DMSO (control), iHPCAL1 (10 μM), or ferrostatin-1 (Fer-1; 10 μM) (n = 3 biologically independent samples; two-way ANOVA with Tukey’s multiple comparisons test; data are presented as mean ± SD; *P < 0.05 versus control group). (i, j) Western blot analysis of the indicated protein expression in HT-1080 cells following treatment with (i) RSL3 (0.5 μM, 6 h) or (j) erastin (5 μM, 12 h) in the absence or presence of compound #5 (iHPCAL1; 2 μM). (k) Western blot analysis of the indicated protein expression in HT-1080 cells following treatment with iHPCAL1 (2 μM) in the absence or presence of bortezomib (BTZ; 0.1 μM) or chloroquine (CQ; 20 μM) for 24 h.
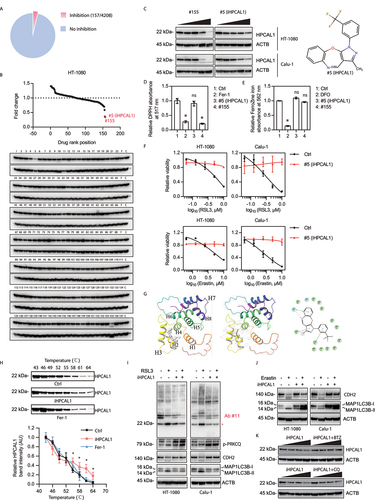
Many compounds, such as ferrostatin-1 and liproxstatin-1, suppress ferroptosis due to their capacity to quench ROS. To rule out this possibility, we used a 2,2-diphenyl-1-picrylhydrazyl (DPPH) assay to compare the antioxidant activity between compound #5, compound #155, and ferrostatin-1 (positive control). Unlike compound #155 and ferrostatin-1, compound #5 failed to act as an antioxidant ()). Additionally, compared with DFO (positive control), compound #5 and compound #155 had no iron chelator activity ()). Thus, we focused on compound #5 (renamed as iHPCAL1), the mechanism of which appears to be different from ferrostatin-1 and DFO although, like ferrostatin-1 and DFO, iHPCAL1 robustly inhibited RSL3- or erastin-induced ferroptosis ()).
Next, we investigated how iHPCAL1 affects HPCAL1 expression. Molecular docking assays revealed that iHPCAL1 may bind to HPCAL1 ()). In the binding site, iHPCAL1 forms a hydrogen bond with His67, π-π stacking interactions with Tyr52, Phe64 and His67, and hydrophobic interactions with Trp30, Phe48, Ile51, Phe55, Phe56, Ala65, Val68, Phe82, Phe85, Ala88, and Leu89 ()). Cellular thermal shift assays (CETSAs) [Citation44] confirmed that iHPCAL1 delayed thermal-induced HPCAL1 protein degradation ()), indicating that iHPCAL1 directly interacts with HPCAL1. Functional assays demonstrated that iHPCAL1 failed to affect the phosphorylation of PRKCQ, but inhibited the phosphorylation of HPCAL1 as well as the autophagic degradation of CDH2 induced by RSL3 ()) or erastin ()). These results indicate that the suppression of HPCAL1 phosphorylation and function induced by iHPCAL1 occurs downstream of PRKCQ phosphorylation. Subsequent studies demonstrated that bortezomib, but not chloroquine, prevented iHPCAL1-induced HPCAL1 protein degradation ()). These latter results suggest that iHPCAL1 stimulates the degradation of HPCAL1 through the proteasome pathway, thereby limiting ferroptosis.
HPCAL1 mediates ferroptosis response in vivo
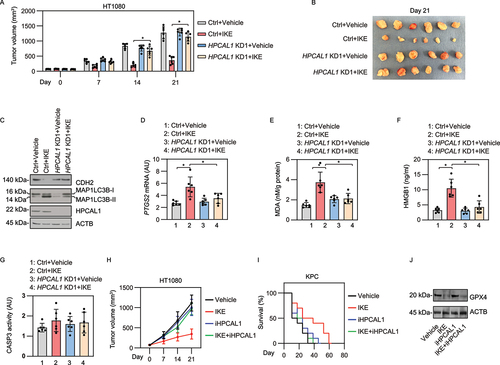
Imidazole ketone erastin (IKE) is an erastin analog with improved potency and metabolic stability that is suitable for animal studies to evaluate the impact of ferroptosis in tumor suppression [Citation45]. We first investigated whether HPCAL1 modulates the anticancer activity of IKE in a xenograft mouse model after implanting human HPCAL1-knockdown or control shRNA HT-1080 cells in athymic nude mice. Compared with the control group, the tumor suppression effect induced by i.p. injection of IKE was limited in the HPCAL1-knockdown group ()). Western blot analysis showed that the protein level of CDH2 was increased, whereas MAP1LC3B-II was reduced in the HPCAL1-knockdown group compared with the control group ()). The quantification of biomarkers of ferroptosis (such as PTGS2 [prostaglandin-endoperoxide synthase 2] and malondialdehyde [MDA; one of the final products of polyunsaturated fatty acid peroxidation]) in tumors [Citation46] as well as the concentration of HMGB1 in serum further supported the hypothesis that HPCAL1 promoted IKE-induced ferroptosis in vivo ()). As a control, the CASP3 (caspase 3) activity in tumor tissue was not changed by IKE in the absence or presence of HPCAL1 ()). Similarly, iHPCAL1 inhibited the anticancer activity of IKE in a xenograft tumor model after inoculating HT-1080 cells into athymic nude mice ()) or in an orthotopic pancreatic tumor model in which KPC cells (a mouse PDAC cell line driven from Pdx1-Cre;K-RasG [Citation12]D/+;Trp53R172H/+ mice [Citation47]) were implanted in immunocompetent C57BL/6 J mice ()). iHPCAL1 had no significant effect on IKE-induced GPX4 degradation in the xenograft tumor model ()). These animal studies are consistent with in vitro studies suggesting that HPCAL1 is a positive regulator of ferroptosis in cancer cells.
Figure 6. HPCAL1 mediates anticancer activity of IKE in vivo. (a) Athymic nude mice were injected subcutaneously with the indicated HPCAL1-knockdown (HPCAL1 KD1) or control HT-1080 cells for 7 days and then treated with IKE (40 mg/kg, i.p., once every other day) at day 7 for 2 weeks. Tumor volumes were calculated weekly (n = 6 mice/group; *P < 0.05; two-way ANOVA with Tukey’s multiple comparisons test; data are presented as mean ± SD). (b) Photographs of isolated tumors at day 14 after treatment. (c-g) The levels of the indicated protein (c), PTGS2 mRNA (d), MDA (e), serum HMGB1 (f), and CASP3 activity (g) in isolated tumors at day 14 after treatment were assayed (n = 6 mice/group; *P < 0.05; two-way ANOVA with Tukey’s multiple comparisons test; data are presented as mean ± SD). (h) Athymic nude mice were injected subcutaneously with HT-1080 cells for 7 days and then given treatment with IKE (40 mg/kg, i.p., once every other day) in the absence or presence of iHPCAL1 (10 mg/kg, once every other day) at day 7 for 2 weeks. Tumor volumes were calculated weekly (n = 6 mice/group; *P < 0.05; two-way ANOVA with Tukey’s multiple comparisons test; data are presented as mean ± SD). (i) C57BL/6 J mice were surgically implanted with 5 × 10⁵ KPC cells into the tail of the pancreas. Three days after implantation, mice were randomly allocated into groups and then treated with IKE (40 mg/kg, i.p., once every other day) in the absence or presence of iHPCAL1 (10 mg/kg, once every other day) for 4 weeks. Animal survival was monitored every week. (j) Western blot analysis of GPX4 expression in isolated tumors from the HT-1080 xenograft model.
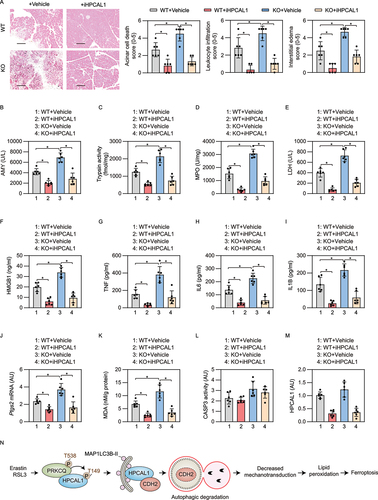
Excessive ferroptosis contributes to the pathogenesis of inflammatory diseases, including infection and sterile inflammation [Citation48]. We recently demonstrated that the conditional knockout of Gpx4 within the pancreas of mice (termed KO mice) accelerates cerulein-induced acute pancreatitis by ferroptotic damage [Citation49,Citation50]. We used this model to evaluate whether iHPCAL1 protects against ferroptosis-induced acute pancreatitis. A histological evaluation of pancreatic injury showed that, compared with wild-type mice, acinar cell death, leukocyte infiltration, and interstitial edema were exacerbated in KO mice ()). These histological changes were accompanied by a significant increase in the level of pancreatitis parameters, including serum AMY/amylase ()), pancreatic trypsin activity ()), pancreatic MPO (myeloperoxidase) activity ()), pancreatic necrosis (as reflected by serum lactate dehydrogenase [LDH] [)] and the plasma levels of HMGB1 [)]), TNF (tumor necrosis factor), IL6 (interleukin 6), and IL1B (interleukin 1 beta) ()). The pancreatic expression of biomarkers of ferroptosis (e.g., Ptgs2 [)] and MDA [)]), but not CASP3 activity ()), were also increased in cerulein-treated KO mice. The administration of iHPCAL1 protected against all features of cerulein-induced acute pancreatitis in mice (especially gpx4 KO mice) ()). As expected, the protein level of pancreatic HPCAL1 was downregulated by the administration of iHPCAL1 ()). Taken together, these data indicate that HPCAL1 is involved in ferroptosis-induced acute pancreatitis.
Figure 7. iHPCAL1 protects against ferroptosis-associated acute pancreatitis in mice. (a) Representative images of pancreatic histology in cerulein-induced pancreatitis in Gpx4 wild-type (WT) and KO mice with or without iHPCAL1 treatment (10 mg/kg; bar = 200 µm). Histological scores for acinar cell death, leukocyte infiltration, and edema at 12 h after the last cerulein treatment were evaluated. Data are presented as mean ± SD; n = 6 mice/group; one-way ANOVA test on all pairwise combinations. (b-m) In parallel, serum AMY (b), pancreatic trypsin activity (c), pancreatic MPO activity (d), serum LDH (e), serum HMGB1 (f), serum TNF (g), serum IL6 (h), serum IL1B (I), pancreatic Ptgs2 mRNA (j), pancreatic MDA (k), pancreatic CASP3 activity (l), and pancreatic HPCAL1 protein (m) were assayed at 12 h after the last cerulein treatment. Data are presented as mean ± SD; n = 6 mice/group; one-way ANOVA test on all pairwise combinations. (n) Schematic depicting the role of HPCAL1 in the promotion of ferroptosis by mediating the autophagic degradation of CDH2. Ferroptosis activators (e.g., erastin and RSL3), but not apoptosis inducers (e.g., STS) or classic autophagy inducers (e.g., HBSS and rapamycin) induce PRKCQ phosphorylation on T538, which leads to HPCAL1 phosphorylation on T149. Phosphorylated HPCAL1 acts as a selective autophagy receptor for CDH2 and mediates the degradation of CDH2 in lysosomes. The loss of CDH2 decreases mechanotransduction and ultimately reduces cell connections, thereby accelerating the lipid peroxidation of ferroptosis.
Discussion
Although cell death is often accompanied by signs of autophagy, the contribution of autophagic machinery to cell death execution is highly context dependent [Citation51]. Recently, ferroptosis is recognized as a type of autophagy-dependent cell death [Citation52]. This process requires selective autophagic degradation of proteins (e.g., the iron storage protein ferritin [Citation37], circadian clock regulator ARNTL [aryl hydrocarbon receptor nuclear translocator like] [Citation53], GPX4 [Citation38], and iron exporter protein SLC40A1 [Citation36]) or organelles (e.g., lipid droplets [Citation54]) to favor iron accumulation, lipid peroxidation, and finally plasma membrane damage, which are the main driving events of ferroptosis. However, these forms of selective autophagy (e.g., ferritinophagy and lipophagy) also participate in the modulation of nonferroptotic stress responses [Citation55,Citation56]. In this study, we reported a unique mechanism in which ferroptosis is favored through the HPCAL1-mediated autophagic degradation of CDH2, a process critical for the regulation of cellular mechanotransduction and adhesion ()).
HPCAL1 was originally identified as a member of the neuron-specific Ca 2+-binding protein family found in the retina and brain [Citation57]. In addition to mediating neuronal signal transduction in the central nervous system, HPCAL1 plays a significant role in tumor formation and development. For example, HPCAL1 exhibits tumor-promoting activity in glioblastoma by the activation of the WNT-CTNNB1/β‐catenin (catenin beta 1) pathway [Citation58], but it suppresses hepatocellular carcinoma progression by activating the mitogen-activated protein kinase pathway [Citation59]. Our data revealed the function of HPCAL1 as a potential selective autophagy receptor for CDH2 degradation, a process that is ignited by PRKCQ-mediated HPCAL1 phosphorylation on Thr149. In contrast, Ca 2+-dependent PRKCA activation is not required for HPCAL1 phosphorylation and final ferroptotic cancer cell death, although PRKCA can participate in dopaminergic cell death [Citation60]. Moreover, we identified the LIR motif of HPCAL1 that binds to MAP1LC3B proteins for the subsequent autophagic degradation of CDH2. These findings provide resources for further analysis of phagophore and autophagosomal cargo-receptor connectivity [Citation40] as well as of tumor heterogeneity in autophagy-dependent ferroptosis [Citation37]. Considering the kinetics of autophagy and the importance of this process in shaping cellular stress responses, time course experiments will be critical in evaluating HPCAL1-mediated autophagy.
Ferroptosis is caused by a redox imbalance of oxidants over antioxidants, which is modulated by a variety of molecules or cellular pathways, including cell-cell contacts [Citation61]. Cadherins (CDHs) are transmembrane molecules found in several types of cell-cell contacts, including adherens junctions and desmosomes [Citation62]. The close interaction of CDH with the cytoskeleton may coordinate dynamic cell movements with appropriate mechanical properties of the adjacent membranes [Citation62]. CDH1/E-cadherin–mediated cell–cell contacts reportedly protect against ferroptotic cell death [Citation31,Citation63,Citation64]. In epithelial cells, cell-cell contacts mediated by CDH1 suppress ferroptosis by activating intracellular NF2 (neurofibromin 2)-YAP1 (Yes1 associated transcriptional regulator) signaling, which promotes ACSL4 (acyl-CoA synthetase long chain family member 4) expression and lipid production [Citation31]. Our current findings suggest that CDH2-mediated membrane tension suppresses ferroptosis. Although the precise mechanism by which mechanotransduction inhibits membrane lipid peroxidation is elusive, one possibility is that increased tension may affect cell membrane fluidity and the uptake of iron and other extracellular metabolites [Citation65–68]. Some CDHs promote autophagy [Citation69], which may form feedback to accelerate ferroptosis.
The identification of iHPCAL1 as a ferroptosis inhibitor may provide new opportunities for targeting ferroptosis-related inflammatory diseases [Citation70]. Unlike ferrostatin-1 and liprostatin-1, which are free-radical trapping antioxidants, iHPCAL1 apparently interacts with HPCAL1 to mediate its degradation in a proteasome-dependent manner. As a possibility, iHPCAL1 may act as a “molecular glue” degrader [Citation71], binding to HPCAL1 and its E3 ubiquitin ligase. In experimental pancreatitis models, iHPCAL1 turned out to be an efficient tool compound that prevents ferroptotic damage and subsequent sterile inflammation.
In summary, our identification of HPCAL1 as a specific autophagy receptor provides the first mechanistic understanding of how CDH2 is selectively delivered to phagophores, leading to CDH2 degradation for the induction of ferroptosis. Although further functional studies are needed to clarify the synergistic or antagonistic effects of different types of selective autophagy on ferroptosis, our work reveals the potential of targeting HPCAL1-mediated CDH2 degradation to enhance tumor suppression or to limit pancreatitis.
Materials and methods
Cell culture and treatment
HT-1080, Calu-1, PANC1, 5637, SKOV3, and PC-3 cell lines were obtained from the American Type Culture Collection. The KPC cell line was a gift from Dr. David Tuveson (Cold Spring Harbor Laboratory). These cell lines were grown in Dulbecco’s modified Eagle’s medium (DMEM) or RPMI-1640 medium with 10% heat-inactivated fetal bovine serum, 2 mM L-glutamine, and penicillin and streptomycin (100 U/ml) at 37°C, 95% humidity, and 5% CO2. All cells were mycoplasma-free and authenticated using short tandem repeat DNA profiling analysis. Dimethyl sulfoxide (DMSO) was used to prepare the stock solution of drugs. The final concentration of DMSO in the drug working solution in the cells was <0.01%. DMSO of 0.01% was used as a vehicle control in all cell culture assays.
Cell fractionation assay
Cell fractionation was performed using the Cell Fractionation Kit (Cell Signaling Technology, 9038) according to the manufacturer’s instructions. The whole cell lysates (W), cytoplasmic fractions (C), membrane fractions (M) as well as the nuclear fractions (N) were harvested for western blot analysis.
Cell viability assay
Cells were seeded at 1 × 10⁴ cells per well into 96-well plates and incubated with the indicated drugs. Subsequently, 100 μl of fresh medium was added to cells containing 10 μl of Cell Counting Kit-8 (CCK8) solutions and incubated for 1 h in an incubator of 5% CO2 at 37°C. Absorbance at 450 nm was measured using a microplate reader.
Lipid peroxidation assay
Cells were seeded at 1 × 10⁵ cells per well into 12-well plates and incubated with the indicated treatments in an incubator of 5% CO2 at 37°C. During the last 30 min of incubation, 1 μg/ml of Hoechst 33342 and 10 μM BODIPY 581/591 C11 dyes were added. Then the cells were washed with phosphate-buffered saline (PBS), and the medium was replaced with PBS. Cells were imaged using an EVOS imaging system (Thermo Fisher). Image analysis was conducted with ImageJ software based on 8–10 random fields. The relative lipid ROS was quantified by using the ratio of green fluorescence intensity (BODIPY 581/591 C11-oxidized) to red fluorescence intensity (BODIPY 581/591 C11-reduced). Cellular ROS was determined using a commercial assay kit (Abcam, ab186027) according to the manufacturer’s instructions.
Cell death assay
Cells were seeded at a density of 2 × 10⁵ cells/well in DMEM medium in 6-well plates. The next day, cells were incubated with the indicated treatments. After that, the cells were stained with propidium iodide for 30 min in an incubator of 5% CO2 at 37°C. Morphological changes were examined with a fluorescence microscope at ×20 magnification. A Countess II FL Automated Cell Counter (Thermo Fisher Scientific) was used to assay the percentages of dead cells after propidium iodide staining based on 8–10 random fields.
Membrane tension measurement
Changes in membrane tension were revealed by the fluorescent membrane tension probe Flipper-TR. The content of a vial of Flipper-TR was dissolved in 50 μL of anhydrous DMSO to make a 1 mM stock solution. This solution was stored at −20°C or below. Flipper-TR was diluted to 1 μM in cell culture medium shortly before applying it to the cells. Cells were grown on coverslips in an incubator of 5% CO2 at 37°C. After the cells were treated with the desired drugs, the culture medium was replaced by the staining solution with all the cells covered by the solution. The cells were then placed in an incubator of 5% CO2 at 37°C for 15 min before imaging using fluorescence-lifetime imaging microscopy.
RNA interference and gene transfection
The transfection of shRNA, siRNA, or cDNA was performed with Lipofectamine 3000 according to the manufacturer’s protocol. For the transfection of shRNA, 293 FT cells were used to produce high-titer lentiviral particles, and the virus-containing medium was harvested 48 h after transfection. RNAi was performed using lentiviral transduction as previously described [Citation72]. Puromycin (5 μg/ml) was used for the selection of transduced cells. The HPCAL1 mutants with T149A or domain deletion were generated using the Q5 Site-Directed Mutagenesis Kit. Other commercial shRNA, siRNA, and cDNA sources are listed in .
Western blot analysis
Cells or lysosomes were lysed three times with 1× cell lysis buffer containing protease inhibitor on ice for 10 min. Protein was quantified using a bicinchoninic acid (BCA) assay, and 20 to 40 μg of each sample was resolved on 4% to 12% Criterion XT Bis-Tris gels in XT MES running buffer and transferred to polyvinylidene difluoride membranes using the Trans-Blot Turbo Transfer Pack and System. Membranes were blocked with tris-buffered saline with Tween 20 (TBST) containing 5% skim milk for 1 h and incubated overnight at 4°C with various primary antibodies. Following three washes in TBST, membranes were incubated with goat anti-rabbit or anti-mouse immunoglobulin G (IgG) horseradish-peroxidase conjugated secondary antibody at room temperature for 1 h and washed. Chemiluminescence substrate was applied using the SuperSignal West Pico Chemiluminescent Substrate or the SuperSignal West Femto Maximum Sensitivity Substrate, and blots were analyzed using the ChemiDoc Touch Imaging System (Bio-Rad) and Image Lab software (Bio-Rad).
Immunoprecipitation analysis
Cells were lysed at 4°C in ice-cold radioimmunoprecipitation assay/RIPA buffer, and cell lysates were cleared by brief centrifugation (13,000 g, 15 min). Concentrations of proteins in the supernatant were determined using the BCA assay. Before immunoprecipitation, samples containing equal amounts of proteins were precleared with protein A agarose beads (4°C, 3 h) and subsequently incubated with various irrelevant IgG or specific antibodies (5 μg/ml) in the presence of protein A agarose beads for 2 h or overnight at 4°C with gentle shaking. Following incubation, agarose beads were washed extensively with PBS, and proteins were eluted by boiling in 2× sodium dodecyl sulfate sample buffer before SDS-polyacrylamide gel electrophoresis.
Immunofluorescence assay
The cells were fixed with 2% paraformaldehyde and incubated with primary antibodies in PBS with 1% bovine serum albumin overnight at 4°C, followed by washing and the application of secondary antibodies. After final washing, sections were protected with coverslips with an anti-fading mounting medium sealed with nail polish and stored at 4°C for preservation. Immunofluorescence images were acquired using a confocal laser scanning microscope (ZEISS LSM 800).
qPCR analysis
Total RNA was extracted and purified from cultured cells using the RNeasy Plus Mini Kit. First-strand cDNA was synthesized from 1 µg of RNA using the iScript cDNA Synthesis Kit. Briefly, 20-µl reactions were prepared by combining 4 µl of iScript Select reaction mix, 2 µl of gene-specific enhancer solution, 1 µl of reverse transcriptase, 1 µl of gene-specific assay pool (20×, 2 µM), and 12 µl of RNA diluted in ribonuclease-free water. The cDNA from various cell samples was then amplified by real-time qPCR with specific primers using the CFX96 Touch Real-Time PCR Detection System (Bio-Rad) with CFX Manager software (Bio-Rad). The gene expression was calculated via the 2−ΔΔCt method and normalized to RNA18S. The relative concentrations of mRNA were expressed in arbitrary units based on the untreated group, which was assigned a value of 1. The primers, which were synthesized and desalted from Sigma-Aldrich, are shown in .
PIP strip lipid-binding assay
PIP strips (Echelon) were blocked in blocking buffer (PBS with 0.1% Tween 20; PBS-T) plus 3% bovine serum albumin (BSA) and gently agitated for 1 h at room temperature. Then the blocking buffer was discarded, and 1 μg/ml of His-tagged HPCAL1 recombinant protein in 5 mL PBS-T plus 3% BSA was added to cover the membranes. The membranes were incubated for 1 h at room temperature with gentle agitation. Following three washes with >5 mL PBS-T, the membranes were incubated with 5 μL anti-His HRP antibodies in 5 mL PBS-T plus 3% BSA blocking solution and incubated for 1 h at room temperature with gentle agitation. The membrane was again washed with >5 mL PBS-T three times and incubated with horseradish-peroxidase conjugated anti-mouse antibodies. Bound antibodies were detected by chemiluminescence with SuperSignal West Pico Chemiluminescent Substrate, and blots were analyzed using a ChemiDoc Touch Imaging System (Bio-Rad) and Image Lab software (Bio-Rad).
Tandem mass spectrometry
Proteolytic peptides from in-gel trypsin digestion were analyzed using nanoflow reverse-phased liquid chromatography tandem mass spectrometry (LC-MS/MS). Tryptic peptides were loaded onto a C18 column (PicoChip column packed with 10.5-cm ReproSil C18 [3 μm and 120 Å] chromatography media with a column with an internal diameter of 75 μm and a tip of 15 μm; New Objective Inc., Woburn, MA, USA] using a Dionex HPLC system (Dionex UltiMate 3000; Thermo Fisher Scientific, San Jose, CA, USA) operated with a double-split system to provide an in-column nanoflow rate (~300 nl/min). Mobile phases used were 0.1% formic acid for A and 0.1% formic acid in ACN for B. Peptides were eluted off the column using a 52-min gradient (2% to 40% B in 42 min, 40% to 95% B in 1 min, 95% B for 1 min, and 2% B for 8 min) and injected into a linear ion trap MS (LTQ XL; Thermo Fisher Scientific) through electrospray. The LTQ XL was operated in a data-dependent MS/MS mode in which each full MS spectrum (acquired at 30,000 automatic gain control [AGC] targets, 50-ms maximum ion accumulation time, and a precursor ion selection range with a mass/charge ratio of 375 to 1800) was followed by MS/MS scans of the eight most abundant molecular ions determined from full MS scan (acquired on the basis of a setting of 1000 signal thresholds, 10,000 AGC targets, 100-ms maximum accumulation time, 2.0-Da isolation width, 30-ms activation time, and 35% normalized collision energy). Dynamic exclusion was enabled to minimize redundant selection of peptides previously selected for collision-induced dissociation.
Peptide identification by database search
MS/MS spectra were searched using a Mascot search engine (version 2.4.0, Matrix Science Ltd.) against the UniProt human proteome database. The modifications used were the following: static modification of cysteine (carboxyamidomethylation, +57.05 Da), variable modification of methionine (oxidation, +15.99 Da), and protein N-terminal acetylation. The mass tolerance was set to 1.4 Da for the precursor ions and 0.8 Da for the fragment ions. Peptide identifications were filtered using PeptideProphet and ProteinProphet algorithms with a protein threshold cutoff of 99% and a peptide threshold cutoff of 90% implemented in Scaffold (Proteome Software, Portland, OR, USA).
DPPH assay
We dissolved DPPH in methanol to a final concentration of 100 μM. The tested compounds were added to 1 ml of DPPH solution with a final concentration of 10 μM. Samples were mixed well and incubated at room temperature for 1 h. The absorbance at 517 nm (indicating the concentration of nonreduced DPPH) was measured using a microplate reader (Cytation 5 Cell Imaging Multi-Mode Reader). Results were normalized to DMSO (which has no antioxidant activity; set as 100%).
Ferrozine iron chelation assay
Iron (II) chloride was dissolved in water to a final concentration of 10 μM. The tested compounds were added to 1 ml of iron (II) chloride solution with a final concentration of 40 μM and incubated at room temperature for 10 min. Next, 3-(2-pyridyl)-5,6-diphenyl-1,2,4-triazine-p,p′-disulfonic acid monosodium salt hydrate (FerroZine Iron Reagent) was added and mixed with a final concentration of 20 μM. Samples were mixed well and incubated at room temperature for 1 h. The absorbance at 562 nm was measured using a microplate reader. Results were normalized to DMSO (which has no iron-chelating activity; set as 100%).
Iron assay
The relative Fe2+ concentration in cells was assessed using an Iron Assay Kit. Briefly, cells or tissues were homogenized in 4–10 volumes of iron assay buffer, and the samples were centrifuged at 16,000 × g for 10 min to remove insoluble materials, followed by collection of the supernatants. To measure ferrous iron, we added 50 µL samples to sample wells in a 96-well plate and brought the volume to 100 µL per well with 5 µL of assay buffer. After incubation of the reaction at 37°C for 30 min, the absorbance at 593 nm was measured using a microplate reader. The relative level of Fe2+ in all groups was calculated and normalized to protein concentration.
Fit docking assay
The protein HPCAL1 was downloaded from the PDB Protein Data Bank (PDB id: 5T7C), then prepared, optimized, and minimized with an OPLS3 force field by using a protein preparation wizard implemented in Maestro 10.3. The ligand’s structure was built in Maestro, and its ionization/tautomeric state was generated at a pH of 7 using Epik (an empirical pKa prediction program) calculation2. Finally, the ligand was optimized by minimizing the potential energy to relax with default parameters. The site maps created by the binding site detection of Maestro were taken as the probable binding sites of the protein. Each grid box’s center was set at the center of a binding site, and the Glide extra precision (XP) docking function was selected. Then the ligand was respectively docked to the five binding sites of the protein. The induced fit docking accurately predicts ligand-binding modes and concomitant structural changes in the receptor.
Liposome leakage assay
Liposomes were prepared by a filming-rehydration method. The phospholipids used in this work were all obtained from Avanti and were dissolved in chloroform and then subjected to a rotary evaporator to remove the solvent in flask, thus leading to lipid film formation. The neutral-pH hydration buffer was composed of 100 mM KCl, 10 mM Tris, 100 mM MES, pH 7.0. The fluorescent dye calcein was dissolved in the hydration buffer to make a saturated solution. The liposomes encapsulating calcein were prepared by adding the saturated solution of calcein to the flask with lipid film, followed by treatment in an ultrasonic water bath. The thus-formed liposomes were extruded through 0.1-μm nucleopore polycarbonate membranes by using an Avanti Mini-Extruder (Avanti Polar Lipids, Inc). The free calcein was removed by gel filtration on a Sephadex G-50 column (GE Healthcare, 17004201), and the liposomes were collected and adjusted to a lipid concentration of 0.8 mg/mL before use. The liposomes were incubated with His-tagged HPCAL1 recombinant protein and BSA (control) to investigate the interaction between HPCAL1 and the lipid bilayer. The liposome leakage was measured by monitoring the fluorescence intensity at preset time points with an excitation wavelength of 490 nm and emission wavelength of 520 nm using a microplate reader. At the experimental endpoint, 0.1% Triton X-100 was added to disrupt the liposomes.
CETSA
For intact-cell CETSA experiments, cells were treated with 10 μM iHPCAL1 or DMSO for 1 h at 37°C. Cells were collected, washed with PBS (pH 7.4), and centrifuged at 500 g for 5 min. Cells were resuspended in PBS (pH 7.4) and aliquoted into PCR tubes (50 μl volume, ~1 million cells per condition) for heating at different temperatures (43°-64°C in 3°C increments) in a thermocycler for 3 min. Samples were allowed to cool to room temperature for an additional 3 min. Cells were lysed by three freeze–thaw cycles in liquid nitrogen and subsequent incubation on ice with occasional vortexing for 20 min. After lysis, lysates were centrifuged at 20,000 g (4°C) for 10 min to remove insoluble material. The soluble fraction was diluted with 6× SDS loading buffer for western blotting analysis.
ELISA analysis
The concentrations or activity of AMY, MPO, trypsin, HMGB1, LDH, cleaved CASP3, MDA, TNF, IL6, and IL1B in the indicated samples were measured using enzyme-linked immunosorbent assay (ELISA) kits according to the manufacturer’s guidelines. Data were normalized to protein or DNA concentration.
Animal model
We conducted all animal care and experiments in accordance with the Association for Assessment and Accreditation of Laboratory Animal Care guidelines (http://www.aaalac.org) and with approval from our institutional animal care and use committee. Pancreatic-specific gpx4 knockout mice were produced and identified in our laboratory by crossing floxed Gpx4 (a gift from Dr. Qitao Ran, UT Health San Antonio) and Pdx1-Cre (the Jackson Laboratory, 014647) transgenic mice (C57BL/6 J background) as previously described [Citation49]. Mouse were kept under standard pathogen-free conditions with an artificial 12-h light/dark cycle (lights on: 08:00) and constant 50%-60% humidity. Mice were allowed access to tap water and free (ad libitum) access to standard laboratory chow during the experimental period.
For cerulein-induced acute pancreatitis, female mice (8–10 weeks) received seven hourly i.p. injections of 50 μg/kg cerulein in sterile saline [Citation73]. We repeatedly administered iHPCAL1 by i.p. at a dose of 10 mg/kg to mice at 3 and 12 h after the first cerulein injection, while controls were treated by administration with vehicle. The parameters of acute pancreatitis were assessed 12 h after the last cerulein treatment.
Animals were sacrificed at the indicated time by CO2 asphyxia, and a blood sample and tissue were collected. Serum was further collected immediately after centrifugation at 10,000 g for 5 min at 4°C. Tissue samples were collected, snap-frozen in liquid nitrogen, and stored at −80°C. Formalin-fixed pancreas samples were processed, and 5-μm-thick paraffin sections were stained with hematoxylin and eosin for histological analysis. Pancreatitis was scored according to a revised scoring standard [Citation74], with an independent pathologist evaluating histological scores for acinar cell death, leukocyte infiltration, or edema in a blind manner. Histological images were acquired using an EVOS FL Auto Cell Imaging System (Thermo Fisher Scientific).
To generate murine subcutaneous tumors, 5 × 10⁶ HT-1080 cells were injected into the flanks of recipient athymic nude mice and then treated with IKE (40 mg/kg, i.p., once every other day) in the absence or presence of iHPCAL1 (10 mg/kg, once every other day) at day 7 for 2 weeks. Tumors were measured weekly, and volumes were calculated using the formula length × width [Citation2] × π/6.
To generate orthotopic tumors, female C57BL/6 J mice were surgically implanted with 5 × 10⁵ KPC cells into the tail of the pancreas. Three days after implantation, mice were randomly allocated into groups and then treated with IKE (40 mg/kg, i.p., once every other day) in the absence or presence of iHPCAL1 (10 mg/kg, once every other day) for 4 weeks. Animal survival was monitored every week.
Statistical analysis
Data are presented as mean ± SD except where otherwise indicated. GraphPad Prism 8.4.3 was used to collect and analyze data. A one-way or two-way analysis of variance (ANOVA) with Tukey’s multiple comparisons test was used for comparison among the different groups. A P value of <0.05 was considered statistically significant.
Supplemental Material
Download MS Word (1.9 MB)Acknowledgments
We thank Dave Primm (Department of Surgery, University of Texas Southwestern Medical Center) for his critical reading of the manuscript.
Disclosure statement
No potential conflict of interest was reported by the author(s).
Supplementary material
Supplemental data for this article can be accessed here
Additional information
Funding
References
- Dikic I, Elazar Z. Mechanism and medical implications of mammalian autophagy. Nat Rev Mol Cell Biol. 2018;19(6):349–364.
- Klionsky DJ, Emr SD. Autophagy as a regulated pathway of cellular degradation. Science. 2000;290(5497):1717–1721.
- Kroemer G, Marino G, Levine B. Autophagy and the integrated stress response. Mol Cell. 2010;40(2):280–293.
- Mizushima N, Komatsu M. Autophagy: renovation of cells and tissues. Cell. 2011;147:728–741.
- Denton D, Kumar S. Autophagy-dependent cell death. Cell Death Differ. 2019;26:605–616.
- McPhee CK, Logan MA, Freeman MR, et al. Activation of autophagy during cell death requires the engulfment receptor Draper. Nature. 2010;465:1093–1096.
- Galluzzi L, Vitale I, Aaronson SA, et al. Molecular mechanisms of cell death: recommendations of the nomenclature committee on cell death 2018. Cell Death Differ. 2018;25:486–541.
- Liu J, Kuang F, Kroemer G, et al. Autophagy-dependent ferroptosis: machinery and regulation. Cell Chem Biol. 2020; 27: 420–435 .
- Dixon SJ, Lemberg KM, Lamprecht MR, et al. Ferroptosis: an iron-dependent form of nonapoptotic cell death. Cell. 2012;149:1060–1072.
- Yang WS, SriRamaratnam R, Welsch ME, et al. Regulation of ferroptotic cancer cell death by GPX4. Cell. 2014;156(1–2):317–331.
- Rebaud S, Wang CK, Sarkis J, et al. Specific interaction to PIP2 increases the kinetic rate of membrane binding of VILIPs, a subfamily of Neuronal Calcium Sensors (NCS) proteins. Biochim Biophys Acta. 2014;1838(10):2698–2707.
- Lin Z, Liu J, Kang R, et al. Lipid Metabolism in Ferroptosis. Advanced Biology. 2021;5(8):e2100396.
- Chen X, Kang R, Kroemer G, et al. Organelle-specific regulation of ferroptosis. Cell Death Differ. 2021;28(10):2843–2856.
- Gao M, Yi J, Zhu J, et al. Role of Mitochondria in Ferroptosis. Mol Cell. 2019;73(2):354–63 e3.
- Zou Y, Henry WS, Ricq EL, et al. Plasticity of ether lipids promotes ferroptosis susceptibility and evasion. Nature. 2020;585(7826):603–608.
- Song X, Liu J, Kuang F, et al. PDK4 dictates metabolic resistance to ferroptosis by suppressing pyruvate oxidation and fatty acid synthesis. Cell Rep. 2021;34(8):108767.
- Chen X, Li J, Kang R, et al. Ferroptosis: machinery and Regulation. Autophagy. 2020; 17: 2054–2081 .
- Wen Q, Liu J, Kang R, et al. The release and activity of HMGB1 in ferroptosis. Biochem Biophys Res Commun. 2019;510(2):278–283.
- Braunewell KH, Klein-Szanto AJ. Visinin-like proteins (VSNLs): interaction partners and emerging functions in signal transduction of a subfamily of neuronal Ca2+ -sensor proteins. Cell Tissue Res. 2009;335(2):301–316.
- Bernstein HG, Baumann B, Danos P, et al. Regional and cellular distribution of neural visinin-like protein immunoreactivities (VILIP-1 and VILIP-3) in human brain. J Neurocytol. 1999;28(8):655–662.
- Orrenius S, Zhivotovsky B, Nicotera P. Regulation of cell death: the calcium-apoptosis link. Nat Rev Mol Cell Biol. 2003;4(7):552–565.
- Dai E, Meng L, Kang R, et al. ESCRT-III-dependent membrane repair blocks ferroptosis. Biochem Biophys Res Commun. 2020;522(2):415–421.
- Mesa-Galloso H, Pedrera L, Ros U. Pore-forming proteins: from defense factors to endogenous executors of cell death. Chem Phys Lipids. 2021;234:105026.
- Shi J, Zhao Y, Wang K, et al. Cleavage of GSDMD by inflammatory caspases determines pyroptotic cell death. Nature. 2015;526(7575):660–665.
- Wang H, Sun L, Su L, et al. Mixed lineage kinase domain-like protein MLKL causes necrotic membrane disruption upon phosphorylation by RIP3. Mol Cell. 2014;54(1):133–146.
- Sun L, Wang H, Wang Z, et al. Mixed lineage kinase domain-like protein mediates necrosis signaling downstream of RIP3 kinase. Cell. 2012;148(1–2):213–227.
- Ding J, Wang K, Liu W, et al. Pore-forming activity and structural autoinhibition of the gasdermin family. Nature. 2016;535(7610):111–116.
- Liu X, Zhang Z, Ruan J, et al. Inflammasome-activated gasdermin D causes pyroptosis by forming membrane pores. Nature. 2016;535(7610):153–158.
- Dutta S, Watson BG, Mattoo S, et al. Calcein release assay to measure membrane permeabilization by recombinant Alpha-Synuclein. Biol Protoc. 2020;10.
- Yan B, Ai Y, Sun Q, et al. Membrane damage during ferroptosis is caused by oxidation of phospholipids catalyzed by the oxidoreductases POR and CYB5R1. Mol Cell. 2020;81(2):355–369.e10.
- Wu J, Minikes AM, Gao M, et al. Intercellular interaction dictates cancer cell ferroptosis via NF2-YAP signalling. Nature. 2019;572(7769):402–406.
- Brown CW, Amante JJ, Mercurio AM. Cell clustering mediated by the adhesion protein PVRL4 is necessary for alpha6beta4 integrin-promoted ferroptosis resistance in matrix-detached cells. J Biol Chem. 2018;293(33):12741–12748.
- Chopra A, Tabdanov E, Patel H, et al. Cardiac myocyte remodeling mediated by N-cadherin-dependent mechanosensing. Am J Physiol Heart Circ Physiol. 2011;300(4):H1252–66.
- Licari G, Strakova K, Matile S, et al. Twisting and tilting of a mechanosensitive molecular probe detects order in membranes. Chem Sci. 2020;11(22):5637–5649.
- Klionsky DJ, Abdel-Aziz AK, Abdelfatah S, et al. Guidelines for the use and interpretation of assays for monitoring autophagy (4th edition)(1). Autophagy. 2021;17:1–382.
- Li J, Liu J, Xu Y, et al. Tumor heterogeneity in autophagy-dependent ferroptosis. Autophagy. 2021; 17: ;3361–3374.
- Hou W, Xie Y, Song X, et al. Autophagy promotes ferroptosis by degradation of ferritin. Autophagy. 2016;12:1425–1428.
- Wu Z, Geng Y, Lu X, et al. Chaperone-mediated autophagy is involved in the execution of ferroptosis. Proc Natl Acad Sci U S A. 2019;116:2996–3005.
- Palamiuc L, Ravi A, Emerling BM. Phosphoinositides in autophagy: current roles and future insights. FEBS J. 2020;287:222–238.
- Gatica D, Lahiri V, Klionsky DJ. Cargo recognition and degradation by selective autophagy. Nat Cell Biol. 2018;20:233–242.
- Gubas A, Dikic I. A guide to the regulation of selective autophagy receptors. FEBS J. 2022; 289: 75–89.
- Koivunen J, Aaltonen V, Peltonen J. Protein kinase C (PKC) family in cancer progression. Cancer Lett. 2006;235:1–10.
- Liu Y, Graham C, Li A, et al. Phosphorylation of the protein kinase C-theta activation loop and hydrophobic motif regulates its kinase activity, but only activation loop phosphorylation is critical to in vivo nuclear-factor-kappaB induction. Biochem J. 2002;361:255–265.
- Martinez Molina D, Jafari R, Ignatushchenko M, et al. Monitoring drug target engagement in cells and tissues using the cellular thermal shift assay. Science. 2013;341:84–87.
- Zhang Y, Tan H, Daniels JD, et al. Imidazole ketone erastin induces ferroptosis and slows tumor growth in a mouse lymphoma model. Cell Chem Biol. 2019;26:623–33 e9.
- Chen X, Comish PB, Tang D, et al. Characteristics and biomarkers of ferroptosis. Front Cell Dev Biol. 2021;9:637162.
- Hingorani SR, Wang L, Multani AS, et al. Trp53R172H and KrasG12D cooperate to promote chromosomal instability and widely metastatic pancreatic ductal adenocarcinoma in mice. Cancer Cell. 2005;7:469–483.
- Chen X, Kang R, Kroemer G, et al. Ferroptosis in infection, inflammation, and immunity. J Exp Med. 2021 ;218:e20210518.
- Dai E, Han L, Liu J, et al. Ferroptotic damage promotes pancreatic tumorigenesis through a TMEM173/STING-dependent DNA sensor pathway. Nat Commun. 2020;11:6339.
- Liu K, Liu J, Zou B, et al. Trypsin-mediated sensitization to ferroptosis increases the severity of pancreatitis in mice. Cell Mol Gastroenterol Hepatol. 2021; 13: 483–500
- Napoletano F, Baron O, Vandenabeele P, et al. Intersections between regulated cell death and autophagy. Trends Cell Biol. 2019;29:323–338.
- Zhou B, Liu J, Kang R, et al. Ferroptosis is a type of autophagy-dependent cell death. Semin Cancer Biol. 2020;66:89–100.
- Yang M, Chen P, Liu J, et al. Clockophagy is a novel selective autophagy process favoring ferroptosis. Sci Adv. 2019;5:eaaw2238.
- Bai Y, Meng L, Han L, et al. Lipid storage and lipophagy regulates ferroptosis. Biochem Biophys Res Commun. 2019;508:997–1003.
- Jiang C, Zhang S, Li D, et al. Impaired ferritinophagy flux induced by high fat diet mediates hepatic insulin resistance via endoplasmic reticulum stress. Food Chem Toxicol. 2020;140:111329.
- Mukhopadhyay S, Schlaepfer IR, Bergman BC, et al. ATG14 facilitated lipophagy in cancer cells induce ER stress mediated mitoptosis through a ROS dependent pathway. Free Radic Biol Med. 2017;104:199–213.
- Spilker C, Braunewell KH. Calcium-myristoyl switch, subcellular localization, and calcium-dependent translocation of the neuronal calcium sensor protein VILIP-3, and comparison with VILIP-1 in hippocampal neurons. Mol Cell Neurosci. 2003;24:766–778.
- Zhang D, Liu X, Xu X, et al. HPCAL1 promotes glioblastoma proliferation via activation of Wnt/beta-catenin signalling pathway. J Cell Mol Med. 2019;23:3108–3117.
- Zhang Y, Liu Y, Duan J, et al. Hippocalcin-like 1 suppresses hepatocellular carcinoma progression by promoting p21(Waf/Cip1) stabilization by activating the ERK1/2-MAPK pathway. Hepatology. 2016;63:880–897.
- Do Van B, Gouel F, Jonneaux A, et al. Ferroptosis, a newly characterized form of cell death in Parkinson’s disease that is regulated by PKC. Neurobiol Dis. 2016;94:169–178.
- Chen X, Kang R, Kroemer G, et al. Broadening horizons: the role of ferroptosis in cancer. Nat Rev Clin Oncol. 2021;18:280–296.
- Mege RM, Ishiyama N. Integration of cadherin adhesion and cytoskeleton at adherens junctions. Cold Spring Harb Perspect Biol. 2017;9:a028738.
- Yang WH, Ding CC, Sun T, et al. The hippo pathway Effector TAZ regulates ferroptosis in renal cell carcinoma. Cell Rep. 2019;28:2501–2508.
- Wenz C, Faust D, Linz B, et al. Cell-cell contacts protect against t-BuOOH-induced cellular damage and ferroptosis in vitro. Arch Toxicol. 2019;93:1265–1279.
- Alenghat FJ, Ingber DE. Mechanotransduction: all signals point to cytoskeleton, matrix, and integrins. Sci STKE. 2002;2002:6.
- Yamamoto K, Ando J. Endothelial cell and model membranes respond to shear stress by rapidly decreasing the order of their lipid phases. J Cell Sci. 2013;126:1227–1234.
- Jaalouk DE, Lammerding J. Mechanotransduction gone awry. Nat Rev Mol Cell Biol. 2009;10:63–73.
- Feng H, Stockwell BR. Unsolved mysteries: how does lipid peroxidation cause ferroptosis? PLoS Biol. 2018;16:e2006203.
- Tian X, Han Z, Zhu Q, et al. Silencing of cadherin-17 enhances apoptosis and inhibits autophagy in colorectal cancer cells. Biomed Pharmacother. 2018;108:331–337.
- Tang D, Chen X, Kang R, et al. Ferroptosis: molecular mechanisms and health implications. Cell Res. 2021;31:107–125.
- Kozicka Z, Thoma NH. Haven’t got a glue: protein surface variation for the design of molecular glue degraders. Cell Chem Biol. 2021;28:1032–1047.
- Elegheert J, Behiels E, Bishop B, et al. Lentiviral transduction of mammalian cells for fast, scalable and high-level production of soluble and membrane proteins. Nat Protoc. 2018;13:2991–3017.
- Mareninova OA, Hermann K, French SW, et al. Impaired autophagic flux mediates acinar cell vacuole formation and trypsinogen activation in rodent models of acute pancreatitis. J Clin Invest. 2009;119:3340–3355.
- Schmidt J, Rattner DW, Lewandrowski K, et al. A better model of acute pancreatitis for evaluating therapy. Ann Surg. 1992;215:44–56.