
ABSTRACT
Aminoglycosides exhibit ototoxicity by damaging mitochondria, which in turn generate reactive oxygen species that induce hair cell death and subsequent hearing loss. It is well known that damaged mitochondria are degraded by mitophagy, an important mitochondrial quality control system that maintains mitochondrial homeostasis and ensures cell survival. However, it is unclear whether dysregulation of mitophagy contributes to aminoglycoside-induced hair cell injury. In the current study, we found that PINK1-PRKN-mediated mitophagy was impaired in neomycin-treated hair cells. Our data suggested that mitochondrial recruitment of PRKN and phagophore recognition of damaged mitochondria during mitophagy were blocked following neomycin treatment. In addition, the degradation of damaged mitochondria by lysosomes was significantly decreased as indicated by the mitophagic flux reporter mt-mKeima. Moreover, we demonstrated that neomycin disrupted mitophagy through transcriptional inhibition of Pink1 expression, the key initiator of mitophagy. Moreover, we found that neomycin impaired mitophagy by inducing ATF3 expression. Importantly, treatment with a mitophagy activator could rescue neomycin-treated hair cells by increasing mitophagy, indicating that genetic modulation or drug intervention in mitophagy may have therapeutic potential for aminoglycoside-induced hearing loss.
Abbreviations: AAV: adeno-associated virus; ABR: auditory brainstem response; ATF3: activating transcription factor 3; ATOH1/MATH1: atonal bHLH transcription factor 1; BafA1: bafilomycin A1; CCCP: carbonyl cyanide m-chlorophenyl hydrazone; COX4I1/COXIV: cytochrome c oxidase subunit 4I1; CTBP2/RIBEYE: C-terminal binding protein 2; DFP: deferiprone; EGFP: enhanced green fluorescent protein; FOXO3: forkhead box O3; GRIA2/GLUR2: glutamate receptor, ionotropic, AMPA2 (alpha 2); HC: hair cell; HSPD1/HSP60: heat shock protein 1 (chaperonin); IHC: inner hair cell; MAP1LC3B/LC3B: microtubule-associated protein 1 light chain 3 beta; MYO7A: myosin VIIA; OPTN: optineurin; OMM: outer mitochondrial membrane; PRKN: parkin RBR E3 ubiquitin protein ligase; PINK1: PTEN induced putative kinase 1; RT-qPCR: real-time quantitative polymerase chain reaction; TOMM20/TOM20: translocase of outer mitochondrial membrane 20; TUNEL: Terminal deoxynucleotidyl transferase (TdT) dUTP nick-end labeling; USP30: ubiquitin specific peptidase 30; XBP1: X-box binding protein 1.
Introduction
Sensorineural hearing loss is one of the most common sensory disorders, and it is estimated that over 360 million people globally have disabling hearing loss [Citation1]. Hair cell (HC) injury is one of the main causes of aging-related, drug-related, and noise-related sensorineural hearing loss. Aminoglycoside antibiotics such as neomycin and kanamycin show similar molecular structures and are widely used all over the world [Citation2], but it has been demonstrated that aminoglycoside antibiotics can be toxic to sensory HCs [Citation3]. Aminoglycoside co-treatment with a loop diuretic such as furosemide is an effective method for modeling acute HC damage. The addition of furosemide disrupts the blood labyrinth barrier, greatly elevating the accumulation of aminoglycoside but not directly damaging HCs in the cochlea [Citation4]. Although the molecular mechanisms that result in ototoxicity are still poorly understood, inner ear HCs have been shown to be the targets of aminoglycosides [Citation5], and aminoglycoside-induced HC damage is commonly linked to mitochondrial damage [Citation6]. The accumulation of harmful reactive oxygen species and cell apoptosis can be induced by impaired mitochondria, and therefore the clearance of damaged mitochondria is very important for maintaining cell survival [Citation7]. Previous studies have shown that damaged mitochondria are eliminated by mitophagy, which is the mitochondria-specific form of autophagy that selectively degrades damaged mitochondria through the actions of lysosomes [Citation8], and defective mitophagy has been shown to lead to several human diseases, including neurodegenerative diseases, cancers, and metabolic diseases [Citation9,Citation10].
The mitochondrial protein kinase PINK1 (PTEN induced putative kinase 1) and the cytoplasmic PRKN (parkin RBR E3 ubiquitin protein ligase) are involved in the process of mitophagy [Citation11]. PINK1 is a Ser-Thr kinase that accumulates specifically on impaired mitochondria [Citation12] where it acts as a primary factor involved in mitochondria degradation. In healthy mitochondria, it can translocate into the mitochondria where it is processed into a 52-kDa form and subsequently degraded, thus resulting in low levels of PINK1 [Citation13,Citation14]. PRKN is an E3 ubiquitin ligase [Citation15], and both PRKN and ubiquitin are phosphorylated by PINK1 [Citation16,Citation17], which triggers the recruitment of PRKN to the outer mitochondrial membrane (OMM) and activates the E3 ligase activity of PRKN [Citation18]. PRKN subsequently ubiquitinates numerous OMM proteins and leads to the recruitment of different MAP1LC3/LC3 (microtubule-associated protein 1 light chain 3)-interacting region (LIR)-containing autophagy receptors, including OPTN (optineurin) and CALCOCO2/NDP52 (calcium binding and coiled-coil domain 2) [Citation19,Citation20]. These receptors then bind the autophagosome protein LC3 to promote autophagosome assembly [Citation20].
Recent studies have shown that the overproduction of reactive oxygen species and lack of mitochondrial integrity in cochlear HCs are critical mechanisms behind aminoglycoside-induced hearing loss [Citation6,Citation21,Citation22]. However, whether mitophagy is involved in the clearance of mitochondria in cochlear HCs or if dysfunctional mitophagy contributes to neomycin-induced HC injury remains poorly understood. Thus, we sought to measure PINK1-PRKN-mediated mitophagy in HEI-OC1 cells with or without neomycin treatment. We found that in HEI-OC1 cells mitophagic flux and the gene transcription of Pink1 were reduced after neomycin treatment and that the damaged cochlear HCs could be partially rescued when mitophagy was restored by the mitophagy inducer deferiprone (DFP) and the PINK1 activator kinetin or siRNA against the mitochondria-localized deubiquitinating enzyme Usp30 (ubiquitin specific peptidase 30). In conclusion, our results indicate that mitophagy can be considered as a new therapeutic target for the prevention of HC death.
Results
Damaged mitochondria were removed through PINK1-PRKN-mediated mitophagy in HEI-OC1 cells
To study PINK1-PRKN-mediated mitophagy in HCs, we used HEI-OC1 cells, which are commonly used to study HC injury and protection. First, mitochondria damage was induced in mCherry-PRKN-expressing HEI-OC1 cells using the protonophore carbonyl cyanide m-chlorophenyl hydrazone (CCCP), which is a mitochondrial proton gradient uncoupler. After CCCP treatment, the translocation of PRKN on mitochondria was increased in more than 50% of the HEI-OC1 cells (Figure S1A, B). The immunocytochemistry results showed that almost all of the mitochondria were “eaten” in the PRKN-positive HEI-OC1 cells after long-term CCCP treatment (Figure S1A, D). Also, the levels of the mitochondrial proteins TOMM20/TOM20 (translocase of outer mitochondrial membrane 20), COX4I1/COXIV (cytochrome c oxidase subunit 4I1), and HSPD1/HSP60 (heat shock protein 1 (chaperonin)) were strongly reduced (Figure S1C, E). These results indicated that the mitochondria damaged by CCCP treatment had been efficiently removed.
Next, to test if the damaged mitochondria were removed via autophagy (mitophagy), bafilomycin A1 (BafA1) was used to block the autophagic flux. The mitochondrial mass was assessed using the mitochondrial proteins described above. The immunofluorescence results showed that the mitochondrial proteins were still present when BafA1 was added along with CCCP (Figure S1F), and the mitochondrial proteins were rescued by BafA1 in the western blot results (Figure S1G-J). These results were consistent with our hypothesis that PINK1-PRKN-mediated mitophagy is triggered by CCCP treatment in HEI-OC1 cells and that this process removes the damaged mitochondria.
Neomycin prevented PRKN recruitment and the subsequent removal of damaged mitochondria
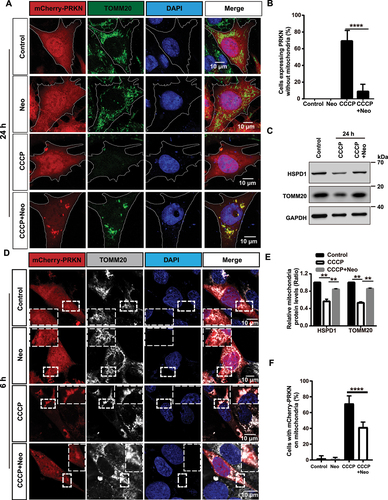
To further study the mechanism behind the effects of neomycin on PINK1-PRKN-mediated mitophagy, the changes in mitochondrial mass were followed over time. Most cells were again cleared of damaged mitochondria after 24 h of CCCP treatment (). Significantly enhanced mitochondrial protein levels () and reduced mCherry-PRKN on the mitochondria () were seen in cells co-treated with CCCP and neomycin compared to CCCP alone, suggesting that neomycin disrupted PRKN accumulation, thus impairing the elimination of mitochondrial proteins. The biochemical fraction assay also showed that the accumulation of PINK1 and PRKN on mitochondria was reduced after neomycin exposure (Figure S2A, B, and D). To further confirm the effect of neomycin on PINK1-PRKN-mediated mitophagy, we used antimycin/oligomycin treatment and obtained similar results (Figure S3).
Figure 1. PINK1-PRKN-mediated mitophagy is inhibited after neomycin treatment. (A) Immunofluorescence staining with TOMM20 antibody showed that neomycin treatment repressed mitochondria (green) clearance induced by CCCP in mCherry-PRKN-expressing HEI-OC1 cells. Cells were treated with neomycin (0.5 mM) and CCCP (20 μM) for 24 h. (B) Quantification of the cells without mitochondria in A, n = 3. (C) Western blot showing changes in mitochondrial proteins (HSPD1 and TOMM20) in HEI-OC1 cells. Cells were treated with neomycin (0.5 mM) and CCCP (20 µM) for 24 h, and GAPDH was used as the control protein. (D) Immunofluorescence staining with TOMM20 showed that neomycin treatment inhibited PRKN (red) accumulation on mitochondria (gray) induced by CCCP in mCherry-PRKN-expressing HEI-OC1 cells. Cells were treated with neomycin (0.5 mM) and CCCP (20 μM) for 6 h. (E) Quantification of the western blot results in C, n = 3. (F) Quantification of the cells with mCherry-PRKN accumulation on mitochondria in D, scored for ≥100 cells per condition, n = 5. For all experiments, ** p < 0.01 and **** p < 0.0001. Data are shown as means ± S.D.
To gain greater insight into the effects of neomycin on PRKN-mediated mitophagy, we carefully examined PRKN recruitment after we treated cells with different concentrations of neomycin at various times. The results showed that PRKN recruitment on mitochondria was inhibited by neomycin in a time and dose-dependent manner (Figure S4A-C). The reduction of TOMM20, COX4I1, and HSPD1 was prevented after neomycin exposure (Figure S4D-G). Because the effect of neomycin on mitochondria restoration did not increase at concentrations greater than 0.5 mM, 0.5 mM neomycin was used in the follow-up experiments in HEI-OC1 cells.
In addition, the protein level of PRKN was not affected after neomycin treatment for 6 h (Figure S2F), while the PRKN protein level was increased after neomycin exposure for 24 h compared to CCCP treatment alone (Figure S2G). These results suggest that the clearance of PRKN (along with the damaged mitochondria) was repressed by neomycin.
The mitophagic flux was disrupted after neomycin treatment
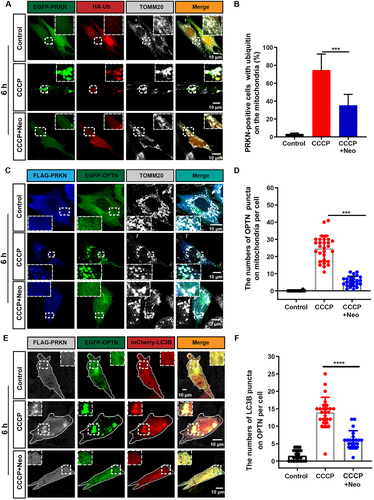
The ubiquitin-labeled OMM has been shown to recruit the autophagosome protein LC3 via OPTN when mitochondria are damaged [Citation20]. To determine whether the connection between the autophagosome and damaged mitochondria was affected in neomycin-treated cells, we examined the colocalization of HA-ubiquitin and TOMM20. We found that the ubiquitination of the OMM induced by CCCP exposure was significantly inhibited in the CCCP+neomycin group (). Moreover, the colocalization of OPTN with TOMM20 and MAP1LC3B/LC3B (microtubule-associated protein 1 light chain 3 beta) was decreased in the CCCP+neomycin treatment group compared to CCCP alone (). In addition, the colocalization of endogenous LC3B or OPTN with HSPD1 was reduced after neomycin damage and showed consistent results with (Figure S2C, E). These results indicated that the recruitment of ubiquitin on mitochondria was impaired by neomycin, further leading to the failure of OPTN receptor and phagophore recruitment.
Figure 2. The recognition of damaged mitochondria by the autophagosome is impaired after neomycin exposure. (A) Immunofluorescence with TOMM20 and HA antibody showing changes in the colocalization of ubiquitin (red) and TOMM20 (gray) after co-treatment with 20 µM CCCP and 0.5 mM neomycin for 6 h. HEI-OC1 cells were transfected with EGFP-PRKN and HA-ubiquitin. (B) Quantification of the percentage of EGFP-PRKN-positive HEI-OC1 cells with ubiquitin on the mitochondria in A, n = 4. (C) The colocalization of EGFP-OPTN and TOMM20 (gray) after the FLAG-PRKN-expressing HEI-OC1 cells were co-treated with 20 μM CCCP and 0.5 mM neomycin for 6 h. (D) Quantification of the number of EGFP-OPTN puncta on the mitochondria in FLAG-PRKN-expressing HEI-OC1 cells. At least 20 cells were counted in each experiment. (E) Immunofluorescence using FLAG-PRKN-expressing HEI-OC1 cells showing changes in the colocalization of EGFP-OPTN and mCherry-LC3B after the cells were co-treated with 20 μM CCCP and 0.5 mM neomycin for 6 h. (F) Quantification of the number of mCherry-LC3B puncta co-localized with OPTN in E, n = 3. For all experiments, ***p < 0.001 and ****p < 0.0001. Data are shown as means ± S.D.
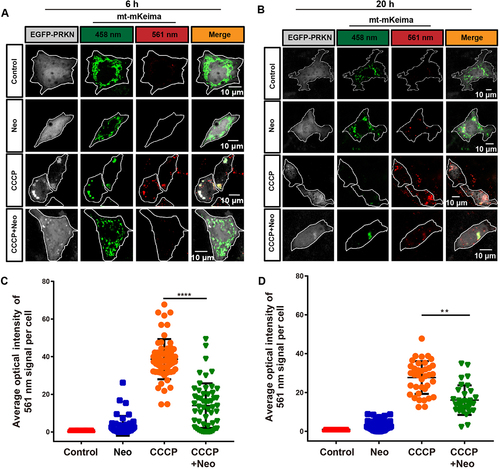
mKeima is a pH-sensitive dual-excitation fluorescent protein that specifically targets mitochondria [Citation23]. At physiological pH, a shorter wavelength (440 nm) is the predominant excitation wavelength, but when it is exposed to an acidic environment, such as within the lysosome, the wavelength of mKeima shifts to a longer wavelength (586 nm) [Citation24,Citation25]. Therefore, when connected with a mitochondrial-targeting sequence, this probe can provide information on the number of mitochondria in the cytosol or in lysosomes, which reflects the level of mitophagic flux [Citation26]. HEI-OC1 cells were transfected with the mt-mKeima plasmids and then subjected to live-cell imaging to study the effect of neomycin injury on mitophagic flux. Our results showed that mt-mKeima displayed the shorter-wavelength excitation range (green) after 6 h neomycin treatment, while exposure to CCCP for 6 h resulted in a significant increase of the longer-wavelength signal (red), which reflected the uptake of mitochondria into lysosomes (mitophagy). The mitophagy induced by CCCP was inhibited after the cells were co-treated with neomycin for 6 h (). When the cells were exposed to CCCP for 20 h, all of the autophagosomes with mitochondria inside were taken up into lysosomes. However, the fusion of the mitochondria with lysosomes (red signal) induced by CCCP was partially rescued by co-exposure to neomycin (). Collectively, these results suggested that neomycin delayed the uptake of mitochondria into lysosomes.
Figure 3. Mitophagic flux is impaired after neomycin treatment. (A) Representative confocal image of mt-mKeima showing that the number of mitochondria-containing lysosomes was reduced in EGFP-PRKN-expressing HEI-OC1 cells after neomycin treatment for 6 h. (B) Similar experiments as in A were performed, but the HEI-OC1 cells were treated with neomycin for 20 h. (C-D) Quantification of the intensity of the red mt-mKeima fluorescence, which reflected mitophagic flux. At least 36 cells per experiment were counted. n = 3. For all experiments, ** p < 0.01 and **** p < 0.0001. Data are shown as means ± S.D.
Neomycin repressed the transcription of Pink1
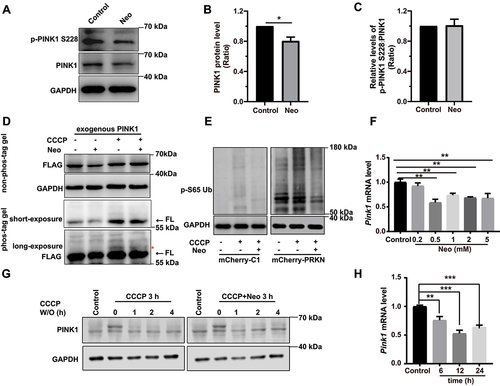
To further explore the mechanism underlying neomycin-mediated impairment of mitophagy, we evaluated the effect of neomycin on PINK1 protein level and phosphorylation. Western blot showed that the PINK1 protein level was reduced in both HEI-OC1 cells and the cochlea after neomycin treatment (, Figure S2H, I, and Figure S5A-C). We also found that the phosphorylation of PINK1 was not affected after neomycin treatment (). Phosphorylation of PINK1 was validated by CCCP treatment (Figure S5A). In addition, the immunoblotting of exogenous PINK1 using phos-tag gels showed that the phosphorylation of PINK1 was not affected after neomycin treatment (). The level of phosphorylated ubiquitin (Ser65) was also reduced after neomycin treatment (). The turnover of PINK1 protein was not affected by neomycin treatment (). These results suggested that neomycin did not directly affect the activity or degradation of PINK1 protein but may repress PINK1 expression through other mechanisms. Notably, we found that the Pink1 mRNA level was significantly decreased after neomycin treatment in both HEI-OC1 cells and the cochlea (, and Figure S5D, E), suggesting that neomycin impaired mitophagy by repressing the transcription of the Pink1 gene.
Figure 4. Neomycin treatment reduces PINK1 expression in HEI-OC1 cells. (A) Western blot showing changes of PINK1 protein level and phosphorylated PINK1 in HEI-OC1 cells after treatment with 0.5 mM neomycin for 6 h. The cells were also treated with 20 µM CCCP for 6 h. Immunoblot with anti-PINK1 and anti-p-PINK1 Ser228. (B) Quantification of PINK1 protein level in A, n = 3. (C) Quantification of phosphorylated PINK1 (Ser228) relative to total PINK1 levels in A, n = 3. (D) HEI-OC1 cells expressing exogenous PINK1-FLAG were treated with neomycin (0.5 mM) and/or CCCP for 6 h, then Tris-glycine SDS-PAGE with or without 25 μM phos-tag was performed to detect phosphorylated PINK1. Immunoblot with anti-FLAG antibody. Red asterisks indicate the phosphorylated band of PINK1, FL: full length. (E) Western blot showing the level of phospho-ubiquitin (Ser65) in HEI-OC1 cells treated with 20 μM CCCP and 0.5 mM neomycin for 6 h. Cells were transfected with mCherry-C1 (as the negative control) and mCherry-PRKN. (F) RT-qPCR analysis of Pink1 transcription in HEI-OC1 cells treated with neomycin (0.2 mM, 0.5 mM, 1 mM, 2 mM, and 5 mM) for 6 h, n = 4. (G) Western blot showing the degradation of PINK1 in HEK 293 cells, which were treated with 20 μM CCCP and 0.5 mM neomycin for 3 h followed by CCCP washout (W/O) at the indicated times. PINK1 protein was detected at the indicated times after CCCP washout. (H) RT-qPCR analysis of Pink1 transcription in HEI-OC1 cells treated with 0.5 mM neomycin (6 h, 12 h, and 24 h), n = 4. For all experiments, *p < 0.05, ** p < 0.01, and ***p < 0.001. Data are shown as means ± S.D.
To explore the mechanism by which neomycin inhibits mitophagy, we further tested several known regulators of Pink1 transcription. According to previous studies, Pink1 transcription is regulated by ATF3 (activating transcription factor 3), XBP1 (X- box binding protein 1), FOXO3 (forkhead box O3), and other transcription factors [Citation27–29].
Western blot results showed that the protein level of ATF3, but not XBP1 and FOXO3, was increased after neomycin damage (). In addition, neomycin treatment significantly increased the mRNA level of Atf3 (). The protein level of PINK1 was elevated after Atf3 depletion (, and Figure S6A-C). Moreover, the Pink1 dual-luciferase reporter system was used to detect the interaction of endogenous ATF3 with the 200 bp Pink1 promoter on HEI-OC1 cells as indicated in , and the reduction of Pink1 promoter activity induced by neomycin was rescued by Atf3 silencing (). These results showed that neomycin repressed Pink1 transcription by activating ATF3.
Figure 5. Neomycin activates ATF3 protein expression to repress Pink1 transcription. (A) Western blot results showing the protein levels of three transcription factors (ATF3, XBP1, and FOXO3) in HEI-OC1 cells after CCCP (20 μM) treatment for 6 h, with or without neomycin (0.5 mM). (B) Analysis of the protein levels of ATF3, XBP1, and FOXO3 in A, n = 3. (C) Atf3 mRNA level in HEI-OC1 cells treated with neomycin for 6 h and 24 h. Atf3 mRNA gradually increased over time. (D) HEI-OC1 cells were transfected with Atf3 siRNA for 24 h and then treated with CCCP (20 μM) for 6 h, and western blot results showing protein levels of ATF3 and PINK1. After knockdown of Atf3, PINK1 levels were increased. (E) Quantification of the western blot results in D, n = 3. (F) Pink1 promoter activity after HEI-OC1 cells treated with neomycin (0.5 mM) for 24 h. Cells were transfected with a Pink1 luciferase promoter reporter plasmid and Renilla reniformis luciferase plasmid. n = 3. (G) Schematic diagram of the Pink1 promoter luciferase reporter plasmid. The arrow indicates the direction of Pink1 transcription. (H) The Pink1 promoter activity assay after knockdown of Atf3 in which HEI-OC1 cells were transfected with plasmids as described in F, n = 3. (I) Analysis of promoter activity after HEI-OC1 cells were exposed to neomycin (0.5 mM) in the absence or presence of Atf3 siRNA, the control siRNA and undamaged groups were normalized as 100%, n = 4. For all experiments, *p < 0.05, **p < 0.01, and ***p < 0.001. Data are shown as means ± S.D.
Restored mitophagy promoted cochlear HC survival after aminoglycoside damage
Anc80L65 is an ancestor of several adeno-associated virus (AAV) serotypes and has demonstrated excellent infection efficiency in various cochlear cell types, including inner hair cells (IHCs) and outer hair cells [Citation30,Citation31]. We also measured the mitophagy in explant cultures of ATOH1/MATH1 (atonal bHLH transcription factor 1)-EGFP (enhanced green fluorescent protein) mouse HCs, which were infected with Anc80L65-mt-mKeima (AAV), and the results showed that the mitophagy level was decreased after neomycin treatment (). DFP, an iron chelator that can induce mitophagy without harming mitochondria [Citation32], was used to see if it could rescue cochlear HCs damaged by neomycin. The immunofluorescence results showed that HC loss was decreased in the middle and basal turns of the cochlea when pretreated with DFP (), whereas no differences were shown in the apical turn (Figure S7A). Terminal deoxynucleotidyl transferase (TdT) dUTP nick-end labeling (TUNEL) staining was performed to identify the apoptotic HCs. The results showed that MYO7A (myosin VIIA) and TUNEL double-positive cells were significantly reduced in the middle and basal turns of the cochlea when pretreated with DFP (). We further found that damaged mitochondria were removed after DFP treatment by measuring the protein levels of TOMM20, COX4I1, and HSPD1 (Figure S7C, D).
Figure 6. Promoting mitophagy prevents HC death after neomycin treatment in vitro. (A) Confocal image of ATOH1-EGFP mouse cochleae expressing Anc80L65-CAG-mt-mkeima-mNeonGreen-P2A (AAV). The signal of mitophagic flux indicated by mt-mKeima (red) was excited by a 561 nm laser. Note that the EGFP signal that was used to mark HCs (green) was excited by a 488 nm laser. Cochlear explants (middle turn) were treated with 0.5 mM neomycin and 20 μM CCCP for 24 h and observed immediately. White arrows indicate damaged mitochondria in a lysosomal acidic environment. (B) Schematic of the explant culture with neomycin and DFP treatment experiments. (C) Immunofluorescence with MYO7A showing the HC loss after neomycin exposure. The explants were pre-treated with 0.25 mM DFP for 48 h. MYO7A (red) antibody was used to mark HCs. (D-E) Immunofluorescence showing TUNEL (green) and MYO7A (red) double-positive cells in the middle and basal turns of the cochlea. Explants were pretreated with 0.25 mM DFP for 48 h, followed by 0.5 mM neomycin treatment for 20 h. Scale bar: 20 μm. (F-G) Quantification of HCs (MYO7A-positive cells) in the middle and basal turns of the cochlea in C, n = 3. (H-I) Quantification of TUNEL and MYO7A double-positive cells in the middle and basal turns of the cochlear explants in D and E, n = 3. (J-K) Immunofluorescence staining showing TUNEL (green) and MYO7A (red) double-positive cells in the middle and basal turns of the cochlea after different treatments as indicated for 20 h. Scale bar: 20 μm. (L-M) Quantification of MYO7A-positive HCs in the middle and basal turns after treatment with Usp30 siRNAs and neomycin, n = 3. (N-O) Quantification of TUNEL and MYO7A double-positive HCs in the middle and basal turns of the cochlea in J and K, n = 3. For all experiments, * p < 0.05, **p < 0.01, ***p < 0.001, and ****p < 0.0001. Data are shown as means ± S.D.
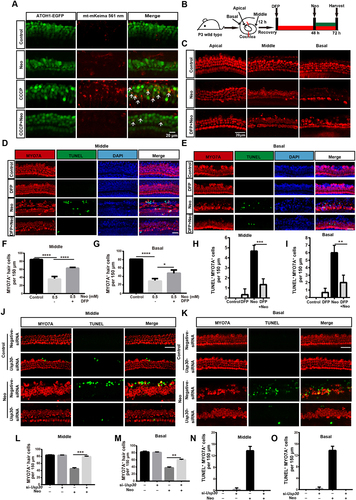
USP30 is a deubiquitinating enzyme that localizes on the mitochondria and removes the ubiquitin modification on damaged mitochondria [Citation33]. Overexpression of USP30 can delay mitophagy [Citation34], whereas depletion of USP30 enhances damaged mitochondrial clearance in neurons [Citation35]. We tested whether Usp30 siRNAs could rescue the neomycin-induced HC damage, and we found that the number of HCs was increased significantly (Figure S6D-J) and the number of TUNEL-positive HCs was reduced in the middle and basal turns () in the Usp30 silenced groups, while there were no differences in the apical turn (Figure S7B). These results demonstrated that knockdown of Usp30 successfully prevented HC apoptosis induced by neomycin exposure.
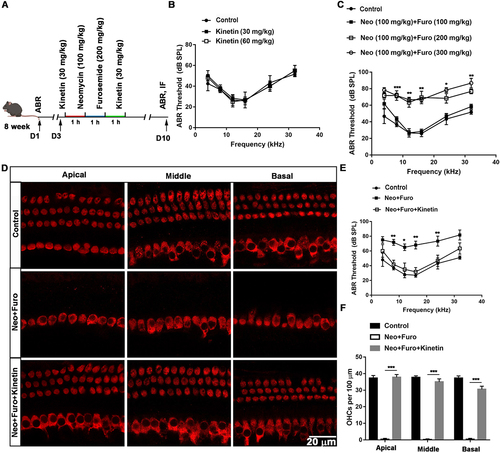
As a PINK1 activator, kinetin treatment leads to accelerated PRKN recruitment to depolarized mitochondria [Citation36–38]. Accordingly, to determine whether restoring mitophagy with kinetin could protect against hearing loss and HC death induced by neomycin sulfate and furosemide (), we measured the auditory thresholds and the number of HCs (), and the results showed that auditory function was improved and the number of surviving HCs increased after kinetin treatment, indicating that kinetin administration protected the cochlear HCs against neomycin-induced hearing loss.
Figure 7. Kinetin prevents neomycin-induced hearing loss in vivo. (A) Schematic of the animals treated with neomycin and kinetin. (B) ABR threshold analysis after mice were exposed to 30 mg/kg or 60 mg/kg kinetin for 7 days, n = 3. (C) ABR thresholds after 100 mg/kg neomycin exposure with different concentrations of furosemide (100 mg/kg, 200 mg/kg, and 300 mg/kg), n = 3. (D) Representative immunofluorescence of MYO7A images showing hair cells from the apical, middle, and basal turns of the cochlea. Eight-week-old mice were administrated with the following as indicated, control: saline, neo: 100 mg/kg neomycin, Furo: 200 mg/kg furosemide, and Kinetin: 30 mg/kg kinetin. (E) ABR thresholds after exposure to neomycin and furosemide with or without kinetin treatment. neo: 100 mg/kg neomycin, Furo: 200 mg/kg furosemide, and Kinetin: 30 mg /kg kinetin. n = 6. (F) Residual outer hair cell (OHC) numbers per 100 μm from mice with different treatments in D, n = 6. For all experiments, * p < 0.05, **p < 0.01, and ***p < 0.001. Data are shown as means ± S.D.
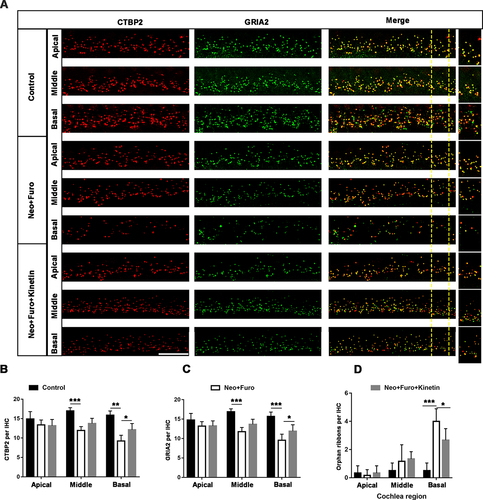
In the mouse inner ear, the ribbon synapse is a critical linker between IHCs and spiral ganglion neurons and plays an important role in sound encoding and neurotransmitter release. The ribbon synapse is the primary target in the aminoglycoside-damaged model [Citation39]. To investigate whether loss of ribbon synapses can also be prevented after neomycin exposure in vivo, we used antibodies against CTBP2/RIBEYE (C-terminal binding protein 2) and GRIA2/GLUR2 (glutamate receptor, ionotropic, AMPA2 (alpha 2)), which together make up the post-synaptic density (). The juxtaposed spots stained by double immunofluorescence were identified as ribbon synapses [Citation40]. The number of ribbon synapses was significantly decreased after neomycin damage in the middle and basal turns of the cochlea, and pre-treatment with kinetin partially protected against loss of ribbon synapses as indicated by both the pre-synaptic dots and post-synaptic puncta (). The spiral ganglion neuron will not trigger an action potential when the pre-synaptic signal is disconnected from post-synaptic puncta, and thus the number of orphan ribbons was also quantified. In the neomycin treatment group, the number of orphan ribbons increased significantly compared with the kinetin group ().
Figure 8. Kinetin prevents neomycin-induced ribbon synapse damage in vivo. (A) Representative images of CTBP2-labeled pre-synapses and GRIA2-labeled post-synapses in cochlear apical, middle, and basal turns in C57BL/6 mice after exposure to neomycin for 7 days. Significant differences are evident between the control (saline), neomycin, and kinetin exposure groups. neo: 100 mg/kg neomycin, Furo: 200 mg/kg furosemide, Kinetin: 30 mg/kg kinetin. Scale bar: 10 µm. (B) Quantification of the CTBP2 puncta in A, n = 3. (C) Quantification of the GRIA2 puncta in A, n = 3. (D) The quantification of orphan ribbons after neomycin and kinetin treatment. All groups contained 4 mice. For all experiments, *p < 0.05, ** p < 0.01, and ***p < 0.001. Data are shown as means ± S.D.
In addition, transmission electron microscopy of cochlear HCs showed that autophagosomes containing mitochondria appeared after kinetin treatment, indicating that mitophagy was activated by kinetin treatment (Figure S7E). A similar protective role for DFP in the kanamycin-damaged model was also observed (Figure S8).
PRKNF146A is a hyperactive PRKN mutant that has been shown to increase PRKN auto-ubiquitination activity [Citation41,Citation42]. We found that expression of EGFP-PRKNF146A could rescue neomycin-damaged cells by increasing mitophagy (Figure S9A-C). These results demonstrated that activation of mitophagy could prevent aminoglycoside-induced HC death and subsequent hearing loss.
Discussion
Macroautophagy/autophagy is a common cellular response to stress or starvation that degrades dysfunctional or unnecessary cellular components and misfolded proteins through the lysosome pathway [Citation43], and it is involved in both cell survival and cell death processes [Citation44]. Autophagy has also been shown to protect HCs after aminoglycoside injury [Citation45]. We and others have previously shown that the mitochondria are the main target of ototoxic agents. However, the role of mitochondrial quality control in HC-damaging processes is poorly understood despite the fact that mitophagy is linked to the maintenance of HC morphology [Citation46,Citation47].
This study fully explored the role of PINK1-PRKN-mediated mitophagy in neomycin-induced HC death. PINK1-PRKN-mediated mitophagy is one of the classic mitophagy pathways, and it plays an important role in mitochondrial quality control [Citation48,Citation49]. Because the basal levels of mitophagy were too weak to remove damaged mitochondria after neomycin treatment ( and Figure S9D-H), CCCP was used to induce PINK1-PRKN-mediated mitophagy. We observed a reduction in PRKN translocation on the mitochondria in CCCP-induced and antimycin/oligomycin-induced mitophagy after neomycin exposure (, and Figure S3A, B, E), indicating that the key player in mitophagy was reduced after aminoglycoside-induced HC damage. The main steps of mitophagic flux are 1) the initiation of mitophagy by PINK1 accumulation on the OMM, 2) the translocation of PRKN onto the mitochondria and ubiquitination of the mitochondria, 3) recognition of the autophagosome, and 4) the fusion of the lysosome and the autophagosome with the damaged mitochondria inside. We sought to clarify which step was the primary target of neomycin, and we found that the fusion of the autophagosome and lysosome was decreased upon neomycin exposure, as indicated by mt-mKeima fluorescence (). In addition, the recognition of mitochondria by PRKN, the ubiquitination of the mitochondria, the binding of the OPTN receptor, and the formation of the autophagosome were all inhibited by neomycin treatment ( and Figure S2C, E), thus suggesting that the neomycin-mediated impairment of mitophagy may occur at the initiation step.
PINK1 accumulation on damaged mitochondria is the initial step of the mitophagy pathway [Citation12,Citation50], and PINK1 phosphorylates and recruits both ubiquitin and PRKN to the OMM [Citation17]. As shown in , and Figure S5D, E, the transcription of Pink1 mRNA was repressed in both cochlear explant culture and HEI-OC1 cells upon neomycin treatment, which in turn led to the reduction of PINK1 protein (, and Figure S5B, C). In addition, the phosphorylation of PINK1 was not affected after neomycin exposure (). Therefore, the reduced level of phospho-ubiquitin (Ser65) was due to decreased PINK1 protein level and not to changes in PINK1 phosphorylation (). These results indicated that the production of PINK1 was repressed after neomycin treatment, which resulted in the inhibition of PRKN translocation to the OMM and subsequent ubiquitination of the OMM. Therefore, we concluded that neomycin stalls mitochondrial clearance by inhibiting the initiation step of mitophagy, which in turn affects the entire mitophagic flux.
How neomycin leads to reduced Pink1 transcription also needs to be addressed. Several elegant studies have shown that XBP1 and FOXO3 modulate PINK1 mRNA at the transcriptional level in the central neuron system [Citation29,Citation51], and the transcription of PINK1 is inhibited by the overexpression of ATF3 (a member of the ATF/CREB family of transcription factors) in lung epithelial cells [Citation27]. A recent study also investigated the transcription of Atf3 in the cochlea [Citation52]. Our study verified the role of ATF3 in repressing Pink1 transcription in HEI-OC1 cells (), indicating that ATF3 might play an important role in auditory function.
We found that restoring mitophagy by hyperactive PRKN (Figure S9A-C) or by treating the HCs with DFP or Usp30 siRNAs () protected against neomycin-induced HC apoptosis. In the acute aminoglycoside model, HC death and hearing loss were partially rescued when the mice were pre-injected with kinetin or DFP ( and Figure S8). DFP can be used as a mitophagy inducer for research and clinical application [Citation32,Citation53], and it triggers mitophagy by stimulating downstream receptor recruitment without affecting PINK1 and PRKN or mitochondrial function [Citation54,Citation55]. As a PINK1 enhancer, kinetin also can be used to activate mitophagy through PINK1 activity stimulation [Citation56]. Therefore, mitophagy activators can be considered as potential drugs to protect HCs against aminoglycoside-induced damage. Transmission electron microscopy was used in the acute aminoglycoside model after kinetin and neomycin administration for 24 h and showed that damaged mitochondria induced by neomycin were cleared by mitophagy after kinetin administration (Figure S7E). These results indicated that mitophagic flux was activated after kinetin treatment, but this needs to be further investigated.
Due to obstruction by the blood labyrinth barrier, a single systemic administration of aminoglycosides does not cause damage to cochlear HCs. Thus, furosemide was used to disrupt the blood labyrinth barrier to allow aminoglycoside accumulation in cochlear HCs. In our studies, neomycin showed higher ototoxicity than kanamycin after a single systemic injection.
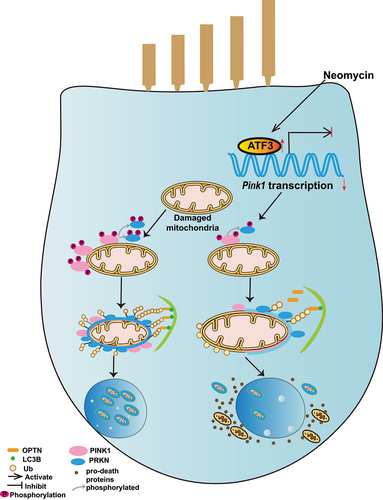
In summary, the present study shows that PINK1-PRKN-mediated mitophagy is involved in aminoglycoside-induced HC death. Furthermore, neomycin injury inhibited PINK1-PRKN-mediated mitophagy by repressing Pink1 transcription by activating ATF3 in HEI-OC1 cells and cochlear HCs (), and our results provide new insights into potential therapies for irreversible sensorineural hearing loss.
Figure 9. Schematic representation of how neomycin attenuates PINK1-PRKN-mediated mitophagy by promoting ATF3 expression.
Materials and methods
Mice and animal ethical statement
FVB/NJ postnatal day 3 (P3) mice (purchased from the Model Animal Research Center of Nanjing University) and ATOH1-EGFP mice (The Jackson Laboratory, Stock #013593) were used for explant cultures in this study. C57BL/6 mice at the age of 8 weeks were used for the in vivo experiment (purchased from the Model Animal Research Center of Nanjing University). The protocols were approved by the Animal Care and Use Committee of Southeast University. Accordingly, all animal experiments were consistent with the National Institutes of Health Guide for the Care and Use of Laboratory Animals, and all efforts were made to minimize the number of animals used and to prevent their suffering.
Plasmids and AAV virus constructs
The 3× FLAG-PRKN, mCherry-PRKN, EGFP-PRKN, HA-Ubiquitin, EGFP-OPTN, mCherry-LC3B, PINK1-FLAG, and EGFP-PRKNF146A plasmids were described previously [Citation42,Citation57–60]. In brief, the mCherry-PRKN plasmid, EGFP-PRKN plasmid, and 3× FLAG-PRKN plasmid were used to examine the translocation of PRKN onto the mitochondria. The mt-mKeima plasmid was described previously [Citation55]. The EGFP-OPTN plasmid was used to express the mitophagy receptor, which binds to ubiquitin and LC3B, and the mCherry-LC3B plasmid was used to observe the recruitment of the autophagosomes to the mitochondria. All of the constructs used in this study were verified by sequencing. For AAV virus constructs, the mt-mKeima cDNA and P2A-mNeonGreen were cloned into the AAV plasmid, including the cytomegalovirus enhancer/chicken ACTB/β-actin (CAG) promoter and the woodchuck hepatitis virus post-transcriptional regulatory element (WPRE) cassette flanked by AAV2 inverted terminal repeats [Citation61]. The Anc80L65-CAG-mt-mKeima-mNeoGreen-P2A virus was produced in HEK 293T cells as previously reported in our lab [Citation61]. Briefly, triple-plasmid co-transfection methods were used to produce the AAV vector. Purification of the AAV vector was performed using the discontinuous iodixanol density gradient centrifugation procedure, and the virus titer (GC/ml: genome-containing [particles]/ml) was calculated by the real-time quantitative polymerase chain reaction (RT-qPCR) using primers targeting the WPRE region. The RT-qPCR primers were as follows: forward, 5’-GTC AGG CAA CGT GGC GTG GTG TG-3’; reverse, 5’-GGC GAT GAG TTC CGC CGT GGC-3’. To estimate the quality of the virus, the transfection efficiency of AAV was tested in cochlear explants (data not shown).
Cell culture, transfection, and drug treatment
HEI-OC1 cells were cultured in Dulbecco’s modified Eagle’s medium (DMEM; Gibco, 11,995,500) containing 10% (vol:vol) fetal bovine serum (FBS; Pansera, P30-2602) and 50 μg/ml ampicillin (Sigma-Aldrich, A0166) at 33°C with 10% CO2 [Citation62]. Cells were digested using 0.05% trypsin-EDTA (Thermo Fisher Scientific, 25,200,054) and seeded at 1 × 10⁴ cells/ml into 24-well plates (Greiner bio-one, 662,160). Cells were transfected with plasmids using Lipofectamine 2000 transfection reagent (Invitrogen, 11,668,027) and Opti-MEM (Gibco, 31,985,062) according to the manufacturer’s instructions. CCCP (Sigma-Aldrich, C2759) at a final concentration of 20 μM, 5 μg/ml antimycin (Sigma, A8674), and 5 μg/ml oligomycin (Sigma, 75,351) was added for 6 h or 24 h to induce mitophagy in HEI-OC1 cells, 100 nM BafA1 (Selleck, S1413) was added for 12 h, and neomycin (Sigma, N6386) was added at different concentrations and times to damage the cells.
Explant culture, AAV infection, and DFP treatment
Cochlear explants from P3 mice were extracted and cultured as previously reported [Citation63]. In brief, cochleae were quickly removed from the wild-type FVB or ATOH1-EGFP C57BL/6 mouse cochlear temporal bone. Cell-Tak (Corning, 354,240)-coated slides were used to attach the cochlea, and then the culture medium (97% DMEM, 2% B-27 [Gibco, 17,504,044], 1% N-2 [Gibco, A1370701], and 0.1% ampicillin) was added. After 12 h recovery, 1 × 10¹⁰ GC AAV (Anc80L65-CAG-mt-mKeima-mNeonGreen-P2A) was added to the culture medium for 24 h for mitophagic flux analyses. Before neomycin treatment, the medium was changed to the culture medium and then neomycin was added for 6 h to damage the HCs. For DFP rescue, neomycin was added after pretreatment with 0.25 mM DFP (MedChemExpress, HY-B0568) for 48 h.
Small interfering RNA knockdown
Atf3 siRNA was synthesized by Shanghai Gene Pharma, and the siRNA sequences were as follows: Atf3-Mus-356, forward: 5’-CAC CCU UUG UCA AGG AAG ATT-3’, reverse: 5’-UCU UCC UUG ACA AAG GGU GTT-3’; Atf3-Mus-546, forward: 5’- CAA GUG UCG AAA CAA GAA ATT-3’, reverse: 5’-UUU CUU GUU UCG ACA CUU GTT-3’; Atf3-Mus-736, forward: 5’-GAC GAG AGG AAC CUC UUU ATT-3’, reverse: 5’- UAA AGA GGU UCC UCU CGU CTT-3’. Opti-MEM and Lipofectamine 2000 transfection reagent were used to transfect the siRNAs into HEI-OC1 cells. After transfection for 48 h, RT-qPCR and western blot were performed to confirm the knockdown efficiency. For explant culture, siRNAs targeting mouse Usp30 were synthesized by Shanghai Gene Pharma (we used the siRNA mixtures, and the efficiency of siRNA knockdown was shown in Figure S6D-F), and these were transfected with Opti-MEM and Lipofectamine 2000 transfection reagent following the manufacturer’s instructions. The Opti-MEM was replaced with the culture medium 6 h later. After transfection for 48 h, neomycin was added for another 24 h. The siRNA sequences are listed as follows: Usp30-Mus-652, forward: 5’- CCA CUU GUU UGA UGU GCA UTT-3’, reverse: 5’-AUG CAC AUC AAA CAA GUG GTT-3’; Usp30-Mus-1389, forward: 5’-GCU CCU CCA CAU ACC UCU UTT-3’, reverse: 5’-AAG AGG UAU GUG GAG GAG CTT-3’; Usp30-Mus-1487, forward: 5’-GCC AAG AAC CCU CUC UCA ATT-3’, reverse: 5’-UUG AGA GAG GGU UCU UGG CTT. Negative control, forward: 5’-UUC UCC GAA CGU GUC ACG UTT-3’, reverse: 5’-ACG UGA CAC GUU CGG AGA ATT-3’.
Animal model of HC damage and chemical treatment
The in vivo experiment was performed with 8-week-old male C57BL/6 mice, and 30 mice were randomly divided into 5 groups after the auditory brainstem response (ABR) test. The DFP protection group was intraperitoneally injected with 100 mg/kg DFP (as previously reported [Citation53,Citation64]) dissolved in saline an hour before kanamycin treatment and 1 h after furosemide (Aladdin, F129560) injection, and after 1 h 600 mg/kg kanamycin (Aladdin, K103025) was injected subcutaneously. A total of 200 mg/kg furosemide was injected intraperitoneally after kanamycin administration for 1 h. The control group was injected with an equal dose of saline. ABR was measured on the seventh day after treatment. For the acute neomycin damage model, all chemicals were injected intraperitoneally. 30 mg/kg kinetin (MedChemExpress, HY-N0160) was injected 1 h before neomycin treatment and 1 h after furosemide injection. Then 100 mg/kg neomycin and 200 mg/kg furosemide were injected within 1 h after kinetin treatment. The control group was injected with an equal dose of saline. ABR was measured on the seventh day after treatment, and mice were sacrificed after ABR measurement.
Immunofluorescence and reagents
Cells or cochleae were fixed with 4% paraformaldehyde (Solarbio, P1110) at room temperature for 1 h and permeabilized with PBST (1× PBS [Gibco, 10,010,023] and 1% Triton X-100 [Sigma-Aldrich, T8787]), for 15 min. The samples were blocked with 10% donkey serum (Solarbio, SL050) for 1 h and then incubated with the primary antibodies overnight at 4°C. The anti-TOMM20 (Proteintech, 11,802-1-AP) and anti-HSPD1 (Proteintech, 66,041-1-Ig) antibodies were used to mark mitochondria. The HA probe (Santa Cruz Biotechnology, sc-7392) and monoclonal anti-FLAG M2 antibody (Sigma, F3165) were used to mark ubiquitin and PRKN. Anti-MYO7A antibody (Proteus Bioscience, 25–6790) was used to mark HCs. Purified mouse anti-CTBP2 (BD Biosciences, 612,004) and anti-GRIA2 (Millipore; MAB397) were used as ribbon synapse markers. DAPI (Solarbio, C0060) was used to stain the nuclei. Anti-LC3B antibody (Abcam, ab192890) was used to detect endogenous LC3B. The samples were washed with PBST for 5 min three times before being incubated with secondary antibodies at room temperature for 1 h. The secondary antibodies included the Alexa Fluor 647-conjugated donkey anti-rabbit or mouse IgG (Invitrogen, A-31573, A-31571), Alexa Fluor 488-conjugated donkey anti-rabbit or mouse IgG (Invitrogen, A-21206, R37114), Alexa Fluor 555-conjugated donkey anti-rabbit or mouse IgG (Invitrogen, A-31572, A-31570), Alexa Fluor 405-conjugated goat anti-mouse IgG (Invitrogen, A-31553), goat anti-mouse IgG1 secondary antibody, Alexa Fluor 568 (Invitrogen, A21124), and goat anti-mouse IgG2a secondary antibody, Alexa Fluor 488 (Invitrogen, A21131). After the samples were incubated with the secondary antibodies and washed again with PBST, they were mounted with an antifade mounting medium. The cells and whole-mount staining were imaged by confocal microscopy (Zeiss, Heidenheim, Germany, LSM 700 and LSM 710). The ribbon synapse intensity (ribbon per IHC) was quantified in multiple cochlear regions using ImageJ (NIH Bethesda, MD). In each region, ribbons made up of at least 20 IHCs were counted and averaged to determine the pre-synapse and post-synapse intensity. For the mt-mKeima imaging experiment, the Zeiss LSM710 confocal microscope was equipped with an argon-ion multiline 458/488/514 nm laser. For imaging EGFP-PRKN, the signal was excited with 488 nm lasers and detected at 480–550 nm. For imaging mt-mKeima (green), the signal was excited with a 458 nm laser and detected at 580–680 nm, and thus the overlapping emission spectra were separated.
RNA extraction and RT-qPCR
For RT-qPCR, HEI-OC1 cells and cochlear explants were collected from the culture dish. Total RNA was extracted with Trizol Reagent (Life, 15,596–018) and then reverse-transcribed using a cDNA synthesis kit (Thermo Fisher Scientific, K1622). The primers used in this study were as follows: Usp30: forward, 5’-CCT CCA CTT TGC GAG CCT C-3’, reverse, 5’-CAA TCC CAC CGA TCA CTC CC-3’; Pink1: forward, 5’- TCT CAA GTC CGA CAA CAT CCT-3’, reverse, 5’-ATT GCC ACC ACG CTC TAC A-3’; Atf3, forward: 5’-GAG GAT TTT GCT AAC CTG ACA CC-3’, reverse: 5’-TTG ACG GTA ACT GAC TCC AGC-3’; Gapdh: forward, 5’-AGG TCG GTG TGA ACG GAT TTG-3’, reverse, 5’-TGT AGA CCA TGT AGT TGA GGT CA-3’. The RT-qPCR was performed using an Applied Biosystems CFX96 real-time PCR system (Bio-Rad, Hercules, USA) with the following sequence: initial denaturing at 95°C for 15s followed by 40 cycles of denaturation at 95°C for 15s, annealing at 60°C for 15s, and extension at 72°C for 20s. The mRNA level was normalized to Gapdh, and the results were calculated with the comparative cycle threshold (ΔΔCt).
Western blot and reagents
HEI-OC1 cells and cochlear explants were lysed using RIPA lysis buffer (Beyotime, P0013B) plus protease inhibitor cocktails (Roche, 04693132001), and the protein concentration was measured with the Pierce BCA Protein Assay Kit (Thermo Fisher Scientific, 23,227) according to the manufacturer’s instructions. GAPDH (Abcam, ab8245) and TUBA1B/α-tubulin (tubulin, alpha 1B) antibody (Cell Signaling Technology, 2144S) were used as the reference protein. The anti-TOMM20 antibody, anti-COX4I1 antibody (Proteintech, 11,242-1-AP), and anti-HSPD1 antibody were used to analyze the degradation of the mitochondria. PINK1 antibody (Novus, BC100-494) and phospho-ubiquitin (Ser65) antibody (Cell Signaling Technology, 70973S) were used to detect PINK1 and phosphorylation of ubiquitin at Ser65 (p-S65 Ub). Phospho-PINK1 (Ser228) antibody (Affinity, AF7081) was used to detect phosphorylation of PINK1 at Ser228 [Citation60]. ATF3 antibody (Santa Cruz Biotechnology, sc-81,189) and anti-USP30 antibody (Sigma, SAB4503385). The secondary antibody was peroxidase-conjugated goat anti-mouse (or anti-rabbit) IgG (Abcam, ab672, or ab67891). The proteins on polyvinylidene fluoride membranes were detected using a SuperSignal West Dura Extended Duration Substrate (Thermo Fisher Scientific, 34,075). The semi-quantification of the western blot band was performed using ImageJ software, and when making calculations the background was subtracted and the band intensity was normalized to GAPDH.
Cell counting Kit-8 (CCK-8) assay
HEI-OC1 cells were treated with CCCP and neomycin for 24 h in 96-well plates, and then the Cell Counting Kit reagent (100 μl/well; Protein Biotechnology, CC201-01) was added to measure the cell viability and the plates were further incubated for 0.5 h at 37°C. Optical densities were determined on a microtiter plate reader (BIO-RAD, Hercules, USA) at 450 nm.
ABR measurement
ABR is an objective measurement of auditory pathway function. To measure the auditory thresholds in aminoglycoside-induced hearing loss, a Tucker-Davis Technology System III (Tucker-Davis Technologies [TDT], Gainesville, FL, USA) was used to measure the hearing threshold as previously described [Citation65,Citation66]. Briefly, mice were put on the 37°C thermostatic heating pad after being anesthetized using 10 mg/kg xylazine and 80 mg/kg ketamine. Electrodes were inserted into the vertex and subdermally behind the ears to record the ABRs, and a broadband speaker (MF1) placed in front of the mouse ear was used to produce the sound stimulus. Six frequencies (4 kHz, 8 kHz, 12 kHz, 16 kHz, 24 kHz, and 32 kHz) were used for the ABR test, and the SigGen32 software (Tucker-Davis Technologies, USA) was used to amplify and average the ABR signals. At each frequency, the test was measured beginning with 90 dB SPL and decreasing by 5 dB steps until wave III disappeared, and this SPL was defined as the ABR threshold in this experiment.
Transmission electron microscopy
After mice were exposed to kinetin and neomycin with furosemide for 24 h, 2.5% glutaraldehyde (Sigma-Aldrich, G5882) was used to fix the cochleae for 24 h, and then the cochleae were placed in 1% osmic acid (Sigma-Aldrich, O5500) for 2 h, dehydrated with acetone (Nanjing Reagent, C0720110291), and embedded in epoxy resin (Agar Scientific, AGR1030). The ultrathin sections were stained with alcoholic uranyl acetate (Polysciences, 6159–44-0) and alkaline lead citrate (Sigma-Aldrich, 15,326), washed gently with distilled water, and observed with a JEM 1230 transmission electron microscope (JEOL Ltd, Tokyo, Japan).
Phos-tag assay
HEI-OC1 cells were transfected with PINK1-FLAG plasmid and exposed to neomycin and CCCP for 6 h. The cells were then subjected to SDS-PAGE, and 6% polyacrylamide gels containing 25 μM Phosbind Acrylamide (APExBIO, F4002) and 50 μM MnCl2 were used to analyze the PINK1 phosphorylation [Citation60,Citation67]. Transfer buffer with 10 mM EDTA (Biosharp, BL518A) was used to wash the phos-tag acrylamide gels for 20 min with gentle shaking after electrophoresis and then replaced with EDTA-free transfer buffer for 10 min. The proteins were then transferred to polyvinylidene difluoride membranes and immunoblotted with an anti-FLAG antibody.
Cellular mitochondria fractionation
For mitochondria isolation experiments, HEI-OC1 cells expressing mCherry-PRKN were treated with 20 μM CCCP and 0.5 mM neomycin for 6 h. According to the manufacturer’s protocol, cells were lysed using the Cell Mitochondria Isolation Kit (Beyotime, C3601). The cell suspension was homogenized 10–30 times, and the supernatant was carefully transferred to another centrifuge tube and centrifuged at 11,000 × g at 4°C for 10 min. The resulting supernatant was the cytosol-rich fraction, and the precipitate consisted of separated cell mitochondria.
Mouse Pink1 promoter double luciferase reporter assay
The mouse Pink1 promoter/luciferase reporter plasmid was custom made using the pGL2 vector. The promoter length in the construct was 200 bp upstream of the transcription starting site (TSS), as indicated in . To obtain Pink1 promoter, Phanta Max Super-Fidelity DNA Polymerase (Vazyme, P505-d1) was used to obtain the DNA fragment. The fragment was inserted into the pGL2 plasmid by homologous recombination. The primers used were as follows: Pink1 promoter-forward: 5’-ACA TAA CCC GGG AGG TAC CAT ATT AGT TTC CTG GCT CA-3’, Pink1 promoter-reverse: 5’-AGT ACC GGA ATG CCA AGC TTA ACA AAC TTC GGG GG-3’. For Pink1 promoter activity detection, HEI-OC1 cells were first seeded in a 96-well dish (WHB, WHB-96-01) and then transfected with each of the Pink1 luciferase reporter plasmids and co-transfected with Atf3 siRNA for 48 h. The Duo-Lite Luciferase Assay System Kit (Vazyme, DD1205-01) was used to detect the fluorescence intensity of the luciferin substrate following the manufacturer’s instructions. First, the Duo-Lite Luciferase Assay Reagent was used to detect Firefly luciferase, and then the Duo-Lite Stop and Lite reagent was used to detect Renilla luciferase. Both reactions were incubated for 10 min and then measured by a microtiter plate reader (BioTek, Cytation). Renilla luciferase was used as the internal reference for correcting transfection efficiency.
Statistical analysis
The statistical significance was determined using two-tailed, unpaired Student’s t-tests or one-sample t-test when comparing two groups, and one-way ANOVA was performed with Tukey’s posttest with 95% confidence intervals when comparing more than two groups. All analyses were performed in GraphPad Prism7 and Microsoft Excel using at least three independently repeated experiments, and p < 0.05 was considered to be statistically significant. Data are shown as means ± S.D.
Supplemental Material
Download MS Word (102.9 MB)Acknowledgments
We thank Dr. Edward Fon (McGill University) for providing us with the PRKNF146A plasmid and Dr. Noriyuki Matsuda (Tokyo Metropolitan Institute of Medical Science) for providing us with the PINK1-FLAG plasmid. we also thank Nana Wang and Qilian Ma (Soochow University) for their helpful suggestions and technical support.
Disclosure statement
No potential conflict of interest was reported by the author(s).
Supplementary material
Supplemental data for this article can be accessed here
Additional information
Funding
References
- Wong AC, Ryan AF. Mechanisms of sensorineural cell damage, death and survival in the cochlea. Front Aging Neurosci. 2015;7:58.
- Guthrie OW. Aminoglycoside induced ototoxicity. Toxicology. 2008;249:91–96.
- Tablan OC, Reyes MP, Rintelmann WF, et al Renal and auditory toxicity of high-dose, prolonged therapy with gentamicin and tobramycin in pseudomonas endocarditis. J Infect Dis. 1984;149:257–263.
- Kros CJ, Steyger PS. Aminoglycoside- and cisplatin-induced ototoxicity: mechanisms and otoprotective strategies. Cold Spring Harb Perspect Med. 2019;9:a033548.
- Scheibinger M, Ellwanger DC, Corrales CE, et al Aminoglycoside damage and hair cell regeneration in the chicken utricle. Jaro-J Assoc Res Oto. 2018;19:17–29.
- He Z, Sun S, Waqas M, et al Reduced TRMU expression increases the sensitivity of hair-cell-like HEI-OC-1 cells to neomycin damage in vitro. Sci Rep. 2016;6:29621.
- Dunn JD, Alvarez LAJ, Zhang XZ, et al Reactive oxygen species and mitochondria: a nexus of cellular homeostasis. Redox Biol. 2015;6:472–485.
- Lemasters JJ. Selective mitochondrial autophagy, or mitophagy, as a targeted defense against oxidative stress, mitochondrial dysfunction, and aging. Rejuvenation Res. 2005;8(1):3–5.
- Goiran T, Duplan E, Rouland L, et al Nuclear p53-mediated repression of autophagy involves PINK1 transcriptional down-regulation. Cell Death Differ. 2018;25:873–884.
- Narendra D, Tanaka A, Suen DF, et al. Parkin-induced mitophagy in the pathogenesis of Parkinson disease. Autophagy. 2009;5:706–708.
- Vigie P, Camougrand N. Role of mitophagy in the mitochondrial quality control. Med Sci. 2017;33:231–237.
- Lazarou M, Jin SM, Kane LA, et al. Role of PINK1 binding to the TOM complex and alternate intracellular membranes in recruitment and activation of the E3 ligase Parkin. Dev Cell. 2012;22:320–333.
- Jin SM, Lazarou M, Wang C, et al. Mitochondrial membrane potential regulates PINK1 import and proteolytic destabilization by PARL. J Cell Biol. 2010;191:933–942.
- Kim I, Rodriguez-Enriquez S, Lemasters JJ. Selective degradation of mitochondria by mitophagy. Arch Biochem Biophys. 2007;462:245–253.
- Chen Y, Dorn GW. PINK1-phosphorylated mitofusin 2 is a parkin receptor for culling damaged mitochondria. Science. 2013;340:471–475.
- Narendra D, Tanaka A, Suen DF, et al. Parkin is recruited selectively to impaired mitochondria and promotes their autophagy. J Cell Biol. 2008;183:795–803.
- Kane LA, Lazarou M, Fogel AI, et al PINK1 phosphorylates ubiquitin to activate Parkin E3 ubiquitin ligase activity. J Cell Biol. 2014;205:143–153.
- Narendra DP, Jin SM, Tanaka A, et al PINK1 is selectively stabilized on impaired mitochondria to activate Parkin. Plos Biol. 2010;8(1):e1000298.
- Richter B, Sliter DA, Herhaus L, et al Phosphorylation of OPTN by TBK1 enhances its binding to Ub chains and promotes selective autophagy of damaged mitochondria. 2016;113(15):4039–4044.
- Wong YC, Holzbaur EL. Temporal dynamics of PARK2/parkin and OPTN/optineurin recruitment during the mitophagy of damaged mitochondria. Autophagy. 2015;11:422–424.
- Wong ACY, Ryan AF. Mechanisms of sensorineural cell damage, death and survival in the cochlea. Front Aging Neurosci. 2015;7:58.
- Yu X, Liu W, Fan Z, et al c-Myb knockdown increases the neomycin-induced damage to hair-cell-like HEI-OC1 cells in vitro. Sci Rep. 2017;7:41094.
- Nadal-Ferret M, Gelabert R, Moreno M, et al. How does the environment affect the absorption spectrum of the fluorescent protein mKeima? J Chem Theory Comput. 2013;9:1731–1742.
- Henderson JN, Osborn MF, Koon N, et al. Excited state proton transfer in the red fluorescent protein mKeima. J Am Chem Soc. 2009;131:13212–13213.
- Sun N, Yun J, Liu J, et al Measuring in vivo mitophagy. Mol Cell. 2015;60:685–696.
- Kogure T, Kawano H, Abe Y, et al. Fluorescence imaging using a fluorescent protein with a large stokes shift. Methods. 2008;45:223–226.
- Bueno M, Brands J, Voltz L, et al ATF3 represses PINK1 gene transcription in lung epithelial cells to control mitochondrial homeostasis. Aging Cell. 2018;17(2).
- Checler F, Goiran T, Alves da Costa C. Presenilins at the crossroad of a functional interplay between PARK2/PARKIN and PINK1 to control mitophagy: implication for neurodegenerative diseases. Autophagy. 2017;13:2004–2005.
- El Manaa W, Duplan E, Goiran T, et al Transcription- and phosphorylation-dependent control of a functional interplay between XBP1s and PINK1 governs mitophagy and potentially impacts Parkinson disease pathophysiology. Autophagy. 2021;17(12):1–23.
- Landegger LD, Pan B, Askew C, et al A synthetic AAV vector enables safe and efficient gene transfer to the mammalian inner ear. Nat Biotechnol. 2017;35:280–284.
- Gu X, Chai R, Guo L, et al Transduction of adeno-associated virus vectors targeting hair cells and supporting cells in the neonatal mouse cochlea. Front Cell Neurosci. 2019;13:8.
- Allen GF, Toth R, James J, et al. Loss of iron triggers PINK1/Parkin-independent mitophagy. EMBO Rep. 2013;14:1127–1135.
- Bingol B, Sheng M. Mechanisms of mitophagy: PINK1, Parkin, USP30 and beyond. Free Radical Bio Med. 2016;100:210–222.
- Wang Y, Serricchio M, Jauregui M, et al Deubiquitinating enzymes regulate PARK2-mediated mitophagy. Autophagy. 2015;11:595–606.
- Marcassa E, Kallinos A, Jardine J, et al. Dual role of USP30 in controlling basal pexophagy and mitophagy. EMBO Rep. 2018;19. DOI:10.15252/embr.201745595.
- Kadlecova A, Makova B, Artal-Sanz M, et al. The plant hormone kinetin in disease therapy and healthy aging. Ageing Res Rev. 2019;55:100958.
- Choi BH, Kim W, Wang QC, et al. Kinetin riboside preferentially induces apoptosis by modulating Bcl-2 family proteins and caspase-3 in cancer cells. Cancer Lett. 2008;261:37–45.
- Hertz NT, Berthet A, Sos ML, et al. A neo-substrate that amplifies catalytic activity of Parkinson’s-disease-related kinase PINK1. Cell. 2013;154:737–747.
- Lee SY, Han JJ, Lee SY, et al. Outcomes of peptide vaccine GV1001 treatment in a murine model of acute noise-induced hearing loss. Antioxidants (Basel). 2020;9(2):112.
- Fettiplace R. Hair cell transduction, tuning, and synaptic transmission in the mammalian cochlea. Compr Physiol. 2017;7:1197–1227.
- Yi W, MacDougall EJ, Tang MY, et al. The landscape of Parkin variants reveals pathogenic mechanisms and therapeutic targets in Parkinson’s disease. Hum Mol Genet. 2019;28:2811–2825.
- Tang MY, Vranas M, Krahn AI, et al. Structure-guided mutagenesis reveals a hierarchical mechanism of Parkin activation. Nat Commun. 2017;8:14697.
- Kliosnky D. Guidelines for the use and interpretation of assays for monitoring autophagy (3rd edition) (vol 12, pg 1, 2015). Autophagy. 2016;12:443.
- Cecconi F, Levine B. The role of autophagy in mammalian development: cell makeover rather than cell death. Dev Cell. 2008;15(3):344–357.
- He Z, Guo L, Shu Y, et al. Autophagy protects auditory hair cells against neomycin-induced damage. Autophagy. 2017;13(11):1–21.
- Yang Q, Zhou Y, Yin H, et al PINK1 protects against gentamicin-induced sensory hair cell damage: possible relation to induction of autophagy and inhibition of p53 signal pathway. Front Mol Neurosci. 2018;11:403.
- Guan M, Fang Q, He Z, et al. Inhibition of ARC decreases the survival of HEI-OC-1 cells after neomycin damage in vitro. Oncotarget. 2016;7(41):66647–66659.
- Youle RJ, Narendra DP. Mechanisms of mitophagy. Nat Rev Mol Cell Biol. 2011;12:9–14.
- Pickrell AM, Youle RJ. The roles of PINK1, parkin, and mitochondrial fidelity in Parkinson’s disease. Neuron. 2015;85:257–273.
- Shiba-Fukushima K, Imai Y, Yoshida S, et al PINK1-mediated phosphorylation of the Parkin ubiquitin-like domain primes mitochondrial translocation of Parkin and regulates mitophagy. Sci Rep. 2012;2:1002.
- Goiran T, Duplan E, Chami M, et al Beta-amyloid precursor protein intracellular domain controls mitochondrial function by modulating phosphatase and tensin homolog-induced kinase 1 transcription in cells and in Alzheimer mice models. Biol Psychiatry. 2018;83:416–427.
- Milon B, Shulman ED, So KS, et al A cell-type-specific atlas of the inner ear transcriptional response to acoustic trauma. Cell Rep. 2021;36:109758.
- Kontoghiorghes GJ, Neocleous K, Kolnagou A. Benefits and risks of deferiprone in iron overload in Thalassaemia and other conditions: comparison of epidemiological and therapeutic aspects with deferoxamine. Drug Saf. 2003;26:553–584.
- Georgakopoulos ND, Wells G, Campanella M. The pharmacological regulation of cellular mitophagy. Nat Chem Biol. 2017;13:136–146.
- Zhang ZL, Wang NN, Ma QL, et al Somatic and germline mutations in the tumor suppressor gene PARK2 impair PINK1/Parkin-mediated mitophagy in lung cancer cells. Acta Pharmacol Sin. 2020;41:93–100.
- Procaccio V, Bris C, Chao de la Barca JM, et al Perspectives of drug-based neuroprotection targeting mitochondria. Rev Neurol (Paris). 2014;170:390–400.
- Ying Z, Wang HF, Fan HD, et al Gp78, an ER associated E3, promotes SOD1 and ataxin-3 degradation. Hum Mol Genet. 2009;18:4268–4281.
- Tao ZT, Wang HF, Xia Q, et al Nucleolar stress and impaired stress granule formation contribute to C9orf72 RAN translation-induced cytotoxicity. Hum Mol Genet. 2015;24:2426–2441.
- Xia Q, Wang GH, Wang HF, et al. Folliculin, a tumor suppressor associated with Birt-Hogg-Dube (BHD) syndrome, is a novel modifier of TDP-43 cytoplasmic translocation and aggregation. Hum Mol Genet. 2016;25:83–96.
- Okatsu K, Oka T, Iguchi M, et al PINK1 autophosphorylation upon membrane potential dissipation is essential for Parkin recruitment to damaged mitochondria. Nat Commun. 2012;3:1016.
- Tan F, Chu C, Qi J, et al AAV-ie enables safe and efficient gene transfer to inner ear cells. Nat Commun. 2019;10:3733.
- Kalinec GM, Webster P, Lim DJ, et al. A cochlear cell line as an in vitro system for drug ototoxicity screening. Audiol Neuro-Otol. 2003;8:177–189.
- Chen Y, Yu H, Zhang Y, et al Cotransfection of Pax2 and Math1 promote in situ cochlear hair cell regeneration after neomycin insult. Sci Rep. 2013;3:2996.
- Makhdoumi P, Abnous K, Mehri S, et al. Oral deferiprone administration ameliorates cisplatin-induced nephrotoxicity in rats. J Pharm Pharmacol. 2018;70:1357–1368.
- Fang Q, Zhang Y, Da P, et al Deletion of Limk1 and Limk2 in mice does not alter cochlear development or auditory function. Sci Rep. 2019;9:3357.
- Wang J, Menchenton T, Yin S, et al Over-expression of X-linked inhibitor of apoptosis protein slows presbycusis in C57BL/6J mice. Neurobiol Aging. 2010;31:1238–1249.
- Iguchi M, Kujuro Y, Okatsu K, et al Parkin-catalyzed ubiquitin-ester transfer is triggered by PINK1-dependent phosphorylation. J Biol Chem. 2013;288:22019–22032.