
ABSTRACT
Mouse has been extensively used as a model organism in many studies to characterize biological pathways and drug effects and to mimic human diseases. Similar DNA sequences between both species facilitate these types of experiments. However, much less is known about the mouse epigenome, particularly for DNA methylation. Progress in delivering mouse DNA methylomes has been slow due to the currently available time-consuming and expensive methodologies. Following the great acceptance of the human DNA methylation microarrays, we have herein validated a newly developed DNA methylation microarray (Infinium Mouse Methylation BeadChip) that interrogates 280,754 unique CpG sites within the mouse genome. The CpGs included in the platform cover CpG Islands, shores, shelves and open sea sequences, and loci surrounding transcription start sites and gene bodies. From a functional standpoint, mouse ENCODE representative DNase hypersensitivity sites (rDHSs) and candidate cis-Regulatory Elements (cCREs) are also included. Herein, we show that the profiled mouse DNA methylation microarray provides reliable values among technical replicates; matched results from fresh frozen versus formalin-fixed samples; detects hemimethylated X-chromosome and imprinted CpG sites; and is able to determine CpG methylation changes in mouse cell lines treated with a DNA demethylating agent or upon genetic disruption of a DNA methyltransferase. Most important, using unsupervised hierarchical clustering and t-SNE approaches, the platform is able to classify all types of normal mouse tissues and organs. These data underscore the great features of the assessed microarray to obtain comprehensive DNA methylation profiles of the mouse genome.
Background
Mice (Mus musculus) have been widely used as animal models in the biomedical field to interrogate different physiological pathways and to recapitulate human pathologies [Citation1–3]. Many motives can be claimed for their utilization in the aforementioned studies, among them the overall low cost, efficient reproduction in a short time, easy manipulation, actionability to genetic engineering interventions, and the biological and structural commonalities to the Homo sapiens. In this regard, the less problematic generation of embryonic stem cells from mice, the controlled experimental environment, and the close similarity between the human and the rodent genome have further fostered the extensive application of mice models in many fields of life sciences, particularly in the translation to potential clinical applications [Citation1–3]. Related to this last issue, most human clinical trials for new drugs have been preceded by comprehensive preclinical mouse studies to enlighten us about efficacy and toxicity of the new pharmacological compound [Citation1–3]. Thus, despite the need to support and promote the use of non-animal approaches to validate mechanisms of actions in humans, mouse models continue to play a central role in many stages of biomedical research, including the understanding and development of new drugs for such devastating conditions, such as cancer or neurodegenerative diseases.
Importantly, even though the mouse genome has been studied in large detail, we know little about the DNA methylation landscape of the mouse in comparison to humans. One apparent reason for the scarcity of mouse cancer epigenetic data is the unavailability of a reliable, versatile, and exchangeable tool between researchers around the world that allows the study of hundreds of samples in an objective precise manner and is comparable to the human DNA methylation microarrays genomic platform, The Cancer Genome Atlas (TCGA) Program, which has molecularly dissected most human tumour types (https://portal.gdc.cancer.gov/) [Citation4,Citation5]. Herein, we introduce a comprehensive mouse DNA methylation microarray, the Infinium Mouse Methylation BeadChip (Illumina Inc., CA, USA), that we have experimentally validated at both technical and biological levels and used to interrogate the epigenetic profile of normal murine tissues. Our work provides the first necessary demonstration of the great value of this platform to obtain an extensive view of the mouse DNA methylome that will open its general use to study mouse models of a diverse range of human diseases.
Results and Discussion
Genomic and functional classification of the over 285,000 probes in the mouse DNA methylation microarray
Bisulphite genomic sequencing provides a digital read of the CpG methylation status of a DNA sequence. This approach, associated with deep-sequencing chemistry, has made possible the obtention of a set of whole-genome bisulphite sequences for the human and mouse genomes [Citation6–10]. However, delivering a full organism DNA methylome needs to take into account the import budgetary cost, time-consumption, and the need for complex bioinformatic analyses [Citation11]. User-friendly DNA methylation microarrays have been developed following the example of the carefully annotated DNA microarrays with great genomic coverage used to detect SNPs in genome-wide association studies (GWAS). Those more commonly used were the Illumina Infinium HumanMethylation450 BeadChip 450,000 CpG site platform (450 K; Illumina Inc., CA, USA) [Citation4] and its current updated version, the Methylation EPIC BeadChip (Infinium) microarray, which covers over 850,000 CpG methylation sites (850 K) [Citation5]. These DNA methylation microarrays are the platforms selected for The Cancer Genome Atlas (TCGA) studies (https://portal.gdc.cancer.gov/) and the International Cancer Genome Consortium (ICGC) (https://dcc.icgc.org/) but also for hundreds of other studies wondering about the DNA methylation profiles of human cells in distinct physiological and pathological conditions. The versatility of the described platforms has also been demonstrated by its use to obtain 5-methylcytosine DNA profiles from formalin-fixed paraffin-embedded samples [Citation12]. These useful tools to study human DNA methylation, which in addition allow the easy exchange of data from scientists around the world and post-publication further data mining, did not exist until now for the mouse DNA methylome. Herein, we have validated from a biological and technical standpoint a comprehensive mouse DNA methylation microarray, termed Infinium Mouse Methylation BeadChip (Illumina Inc., CA, USA), as a new robust genomic platform that is available for the epigenetics community to characterize the mouse DNA methylome.
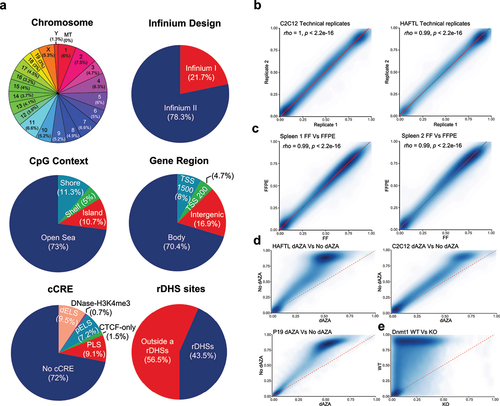
The recently developed Infinium Mouse Methylation BeadChip microarray interrogates the DNA methylation status of 280,754 unique CpG sites covering all chromosomes of the mouse genome (). In addition, it contains 642 control probes for quality control, 1352 genotyping probes for mouse strain, and 938 CpH probes (‘H’ meaning any nucleotide, except guanine). Most of the probes (78.3%) are Infinium II Probe Design that use only one probe per locus (one bead type for both alleles), whereas 21.7% of the probes were Infinium I Probe Design that utilizes two probes per SNP to assess the relative intensity ratio of the two possible target alleles for that locus (two bead types, one for each allele) (). According to the CpG content of the DNA region, 10.7% CpG sites were located in CpG Islands, 11.3% in CpG shores, 5% in CpG shelves, and 73% were placed in mouse genome sequences with very low CpG density (open sea) (). From a functional standpoint, 70.4% of the CpG sites were located on gene bodies and 16.9% in intergenic regions, whereas those located in more classical 5-end regulatory regions such as Transcription Start Site 200 bp and Transcription Start Site 1,500 bp were 4.7% and 8%, respectively (). According to the mouse the Encyclopaedia of DNA Elements (ENCODE) project (http://www.mouseencode.org/), 56.5% of CpGs were located outside of representative DNase hypersensitivity sites (rDHSs), whereas 43.5% were in rDHSs regions (). Importantly, among the above-described CpG probes, there are annotated sites according to the ENCODE Registry of candidate cis-Regulatory Elements (cCREs) corresponding to distal enhancer-like signature (dELS, 9.5%), promoter-like signature (PLS, 9.1%), proximal enhancer-like signature (pELS, 7.2%), CTCF-only elements (1.5%), and DNase-H3K4me3 elements (0.7%) that are those with promoter-like biochemical signature that are not within 200 bp of an annotated TSS (). Seventy-two per cent of the CpG sites were placed outside cCREs (). The genomic location along with structural and functional context for each CpG dinucleotide among the 280,754 CpG sites can be found at the manifest of the Infinium Mouse Methylation BeadChip (https://support.illumina.com/downloads/infinium-mouse-methylation-manifest-file.html).
Figure 1. Description and technical and biological validation of the 285,000 CpG sites mouse DNA methylation microarray. (a) Genomic and functional context of the 280,754 CpG sites contained in the Infinium Mouse Methylation BeadChip microarray: Chromosome location; Infinium design chemistry (Infinium I or II) of the probes; CpG content and neighbourhood context classified in CpG Island, shore, shelf, and other (open sea); functional genomic distribution of the CpG sites classified in gene body, TSS200, TSS1500, and intergenic; distribution among ENCODE candidate cis-Regulatory Elements (cCREs) with promoter-like signature (PLS), with enhancer-like signature (ELS), with distal enhancer location (dELS), with high H3K4me3 and low H3K27ac signal (DNase-H3K4me3), and with CTCF-only elements; and association with an ENCODE representative DNase hypersensitive site (rDHS). (b) Correlation plot of the CpG methylation values to show assay reproducibility of the measurements when using technical replicates on the mouse cell lines C2C12 and HAFTL. (c) Spearman’s correlation plot of the CpG methylation values obtained from two spleen fresh frozen (FF) samples when compared with their consecutive sections that were preserved as formalin-fixed paraffin-embedded (FFPE). (d) Correlation plot of the CpG methylation values to show DNA hypomethylation events in the mouse cell lines C2C12, HAFTL, and P19 upon the use of the demethylating agent 5-aza-2’-deoxycytidine (dAZA). (e) Correlation plot of the CpG methylation values to show DNA hypomethylation events in the mouse embryonic stem cells upon genetic knock-out of the maintenance DNA methyltransferase Dnmt1.
Technical and biological validation of the mouse methylation BeadChip
Although the reproducibility of the Infinium Mouse Methylation BeadChip is mentioned on the manufacturer site (https://www.illumina.com/products/by-type/microarray-kits/infinium-mouse-methylation.html), we have herein confirmed its robustness and reliability using a comprehensive set of different technical, experimental, and biological models.
To demonstrate the capability of the Mouse Methylation BeadChip for the analysis of DNA methylation, we have developed several distinct methodological approaches. First, we obtained a technical validation of the mouse DNA methylation microarray data by performing replication experiments, where we hybridized the same samples twice, the mouse cell lines C2C12 (immortalized myoblasts) and HAFTL (pre-B cells), to the Mouse Methylation BeadChip. We observed that the methylation levels detected at CpG sites derived from each experiment were highly correlated and interchangeable (). Second, given the optimal performance of the human Infinium HumanMethylation450 BeadChip and MethylationEPIC BeadChip microarrays for formalin-fixed paraffin-embedded (FFPE) samples [Citation12], we wondered about the robustness of the mouse microarray to determine the DNA methylation in this type of archival material. To address this point, we hybridized to the platform the same DNA samples from two normal mouse spleen samples obtained from consecutive fresh or FFPE sections from the same specimen. We found that the methylation levels assessed at each CpG site from each sample source were highly correlated ().
We then analysed the reliability of the Mouse Methylation BeadChip to detect CpG methylation changes using both drug and genetic approaches. For the pharmacological strategy, we treated the mouse cell lines C2C12 and HAFTL (both described above) and P19 (derived from an embryonal carcinoma induced in a C3H/He strain mouse) with the well-known inhibitor of DNA methylation 5-aza-2′-deoxycytidine. We observed that the use of the demethylating agent provoked widespread hypomethylation events in the described mouse cell lines (). Finally, we took advantage of the existence of mouse cells with deletion of the maintenance DNA methyltransferase Dnmt1 [Citation13] to further assess the capacity of the new mouse microarray to detect CpG methylation changes. We observed a profound hypomethylation landscape in the Dnmt1 deficient cells in comparison to the wild-type (), as it has been previously reported [Citation13]. All the above-described data demonstrate the idoneity of the studied DNA methylation microarray as a reliable epigenomic tool for biological and pathological studies that use mouse models.
A DNA methylation draft of mouse normal tissues
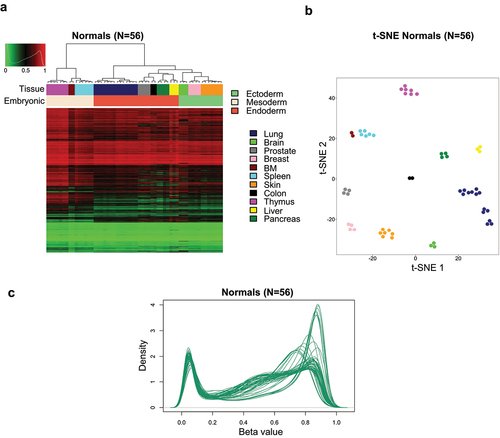
First, we interrogated the DNA methylation profiles for 56 samples corresponding to 11 normal mouse tissues or organs: lung, brain, prostate, breast, bone marrow, spleen, skin, colon, thymus, liver, and pancreas. Significantly distinct DNA methylation profiles were discovered between the different normal samples for all 226,000 CpG dinucleotides (after removal of erratic probe signals, X-chromosome sites, and genotyping probes) using multiscale bootstrap resampling (approximately unbiased p-value and bootstrap probability of 100% for all tissue type-specific clusters), which enabled their distinction on the basis of tissue type by the use of an unsupervised hierarchical clustering approach (). The above-described tissue type-specific DNA methylation classification also matched the developmental layers from which the tissues are derived (ectoderm, mesoderm, or endoderm) (), related to the presence of germ-layer-specific DNA methylation [Citation14]. Dimensionality reduction analysis by t-SNE again yielded identical results clustering each mouse normal tissue and organ according to its DNA methylation profile (). Overall, the representation of the methylation content according to Beta value of the 226,000 CpG sites mostly shows a bimodal distribution with dinucleotides heavily methylated or largely hypomethylated ().
Figure 2. DNA methylation atlas for mouse normal tissues. (a) Unsupervised hierarchical clustering and heatmap for 56 normal primary samples from 11 distinct source types. Tissue type and development layers are shown in the distinct colours as described in the figure legends. Methylation values are displayed from 0 (green) to 1 (red). (b) DNA methylation variances between mouse normal tissues and organs are displayed as t-distributed stochastic neighbour embedding (t-SNE) of Beta values. (c) Density plot of methylation Beta values showing their distribution from 56 normal tissue samples for all 226,000 CpG dinucleotides that remain after removal of erratic probe signals, XY chromosomes probes, and genotyping probes.
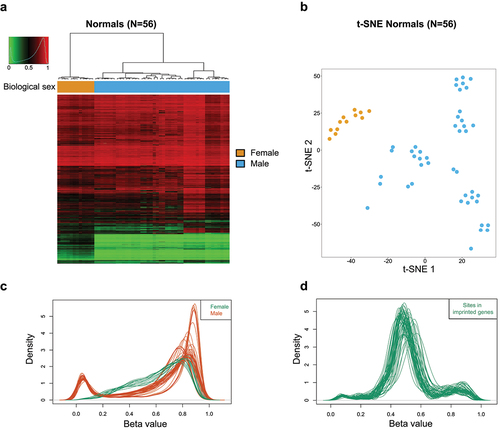
Significantly distinct DNA methylation profiles were discovered between male and female samples for all the CpG dinucleotides located at the X-chromosome (after removal of erratic probe signals) using multiscale bootstrap resampling (approximately unbiased p-value and bootstrap probability of 100% for all biological sex-specific clusters), which enabled their distinction on the basis of biological sex by the use of an unsupervised hierarchical clustering approach (). Dimensionality reduction analysis by t-SNE again produced similar results clustering each mouse's gender according to its DNA methylation profile (). As expected, the CpG sites of the microarray located in the X-chromosome exhibited around a 50% methylation content in the females () due to well-known DNA methylation-dependent X-chromosome inactivation in that biological sex [Citation15]. Importantly, the other CpG sites that displayed a 50% methylation content in normal tissues were those located in the differentially methylated regions (DMRs) of mouse imprinted genes (), related to parentally determined monoallelic expression [Citation16,Citation17].
Figure 3. Mouse DNA methylation mapping according to biological sex, X-chromosome, and imprinted CpG sites. (a) Unsupervised hierarchical clustering and heatmap for 56 normal primary samples from 11 distinct source types according to CpG sites located in the X-chromosome. Methylation values are displayed from 0 (green) to 1 (red). (b) Biological sex type is shown in distinct colours as described in the figure legends. DNA methylation variances between female and male mouse samples are displayed as t-distributed stochastic neighbour embedding (t-SNE) of Beta values. (c) Density plot of methylation Beta values showing their distribution from 56 normal tissue samples for the CpG dinucleotides located at the X-chromosome. (d) Density plot of methylation Beta values showing their distribution from 56 normal tissue samples for the CpG dinucleotides located at imprinted genes.
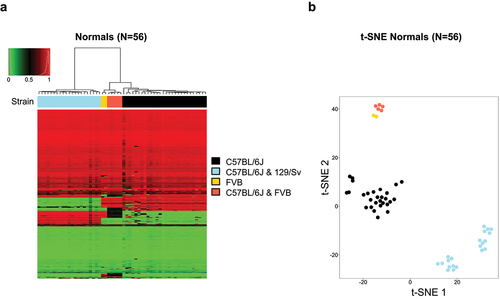
We also validated that the mouse genotyping probes (n = 1352) included in the microarray for different Mus musculus strains were indeed specific and informative. In this regard, significant distinct SNP profiles were discovered between the C57BL/6J, C57BL/6 × 129/Sv, FVB, and C57BL/6 × FVB strains using multiscale bootstrap resampling (approximately unbiased p-value and bootstrap probability of 100% for all strain-specific clusters), which allowed their classification on the basis of mouse strain by the use of an unsupervised hierarchical clustering approach (). Dimensionality reduction analysis by t-SNE revealed identical results clustering each mouse strain according to its SNP profile ().
Figure 4. Mouse strains according to the genotyping probes of the DNA methylation microarray. (a) Unsupervised hierarchical clustering and heatmap for 56 normal primary samples from four different mouse strains according to the SNP sites included in the microarray. Mouse strain is shown in different colours as described in the figure legends. (b) SNP genotyping among the mouse strains is displayed as t-distributed stochastic neighbour embedding (t-SNE) of Beta values.
Finally, and most importantly, we have deposited all the obtained mouse DNA methylation data in the open Gene Expression Omnibus (GEO) repository (accession GSE196902) to help fellow scientists in their ongoing and future studies to characterize the mouse DNA methylome in health and disease.
Conclusions
Herein, we have technically and biologically validated a comprehensive mouse DNA methylation microarray that we have used to interrogate the methylation status of 280,754 CpG sites in murine samples from primary samples and cell lines corresponding to eleven tissues and organs. This study represents one of the most extensive investigations into DNA methylation profiles within the mouse setting. The analysed platform has demonstrated its robustness and reliability in assessing DNA methylation patterns among replicates and in paraffin-embedded (FFPE), also being able to detect hypomethylation events caused by pharmacological and genetic interventions such as the use of the DNA demethylating agent 5-aza-2′-deoxycytidine and the analysis of Dnmt1 deficient cells, respectively. Finally, the obtained DNA methylation patterns in the normal samples enable their clustering according to tissue type, organ, and germ layer.
Individual laboratory initiatives and the colossal effort of the ENCODE project have produced detailed mouse DNA methylomes for selected samples, particularly in the context of embryonic stem cells, foetal development, and adult normal tissues [Citation9,Citation10,Citation18–22]. These landmark discoveries have provided reference mouse DNA methylomes by using Whole-Genome Bisulphite Sequencing (WGBS) that yields single-nucleotide resolution. WGBS is a very informative approach, but it is expensive, time-consuming, and requires a sophisticated bioinformatic pipeline. Thus, it is difficult to apply to the study of many samples in a user-friendly manner. In the human scenario, this has been solved by the introduction of DNA methylation microarrays where in its last inception, more than 850,000 functionally well defined and annotated CpG sites are included [Citation5]. This methodology has been immensely popular due to its affordability and the easiness of the associated bioinformatic tools, making possible the study of the DNA methylation fingerprints of all types of tissues among different stages of differentiation, pathological samples from the cancer arena to the neurodegenerative field, ultimately opening the door to Epigenome Wide Association Studies (EWAS) that can include hundreds or thousands of samples for many human disorders, including COVID-19 [Citation23]. This versatile tool to address all the above-described biological and disease-oriented projects was missing for the mouse species. The herein characterized DNA methylation microarray fills this void and most probably would be a ‘trampoline’ for many studies in biology and medical sciences focused on the mouse epigenome and its translation to the human context.
Methods
DNA isolation and DNA methylation profiling from mouse samples using universal bead arrays
DNA was isolated with the DNAeasy blood and tissue kit (Qiagen GmbH, Hilden, Germany) and ReliaPrep™ FFPE gDNA Miniprep System (Promega, Wisconsin, USA) for fresh frozen and formalin-fixed paraffin-embedded samples, respectively. C2C12, HAFTL, and P19 cell lines were cultured in 10 mL RPMI-1640 GlutaMAX, 10% FBS, and 1X Penicillin/Streptomycin and treated with 5-aza-2′-deoxycytidine (1 µM). Cells were plated in 25 cm2 flasks, incubated at 5% CO2 at 37°C, and harvested after 72 hours of culture. DNA from frozen pellets was purified using DNeasy Blood and Tissue Kit (Qiagen GmbH, Hilden, Germany). Purified genomic DNA was quantified with Qubit (Invitrogen, Carlsbad, CA, USA) according to manufacturer’s instructions. Infinium Mouse Methylation BeadChip (Illumina, Inc., San Diego, CA, USA) arrays were used to analyse DNA methylation. This platform allows over 285,000 methylation sites per sample to be interrogated at single-nucleotide resolution. The samples were bisulphite converted using EZ DNA Methylation-Gold™ Kit (Zymo Research, CA, USA) and were hybridized in the array following the manufacturer’s instructions.
DNA methylation data and computational analyses
The DNA methylation status of the studied samples was obtained using the Infinium Mouse Methylation BeadChip Array (~285,000 methylation sites). Raw signal intensities were assessed and analysed with GenomeStudio Software 2011.1 (Illumina). DNA methylation beta values were obtained from raw IDAT files with GenomeStudio default normalization using control probes and background subtraction. A number of quality control steps were applied to minimize errors and remove erratic probe signals. This involved removal of failed probes (probes with detection P value > 0.01) and manufacturing flagged (MFG) probes. XY chromosomes probes and genotyping probes were also removed for the DNA methylation analyses where the beta values of these probes were not required. The genomic analysis presented in the study was performed using the mm10 mouse genome reference build, as described in the Illumina manifest file associated with the Infinium Mouse Methylation BeadChip.
Unsupervised hierarchical clustering with 100 bootstrap replications was performed with R function package pvclust (v2.2-0). The Canberra distance scores and Ward’s minimum variance method were applied to attain hierarchical clustering represented as a heatmap using the gplots (v3.1.1) package in R. t-Distributed stochastic neighbour embedding (t-SNE) was performed using R package M3C (v1.12.0). Density plots were performed with minfi (v1.36.0) package in R. Correlation plots and pie charts were performed using ggplot2 (v3.3.3) R package Quality control, and downstream analyses were performed within the R statistical environment (v4.0.3).
Author’s Contributions
CAGP and ME conceived and designed the approach, interpreted the results, and wrote and revised the manuscript. DAE, EM, ABC, BNV, and AV provided experimental support. All authors have read and approved the final manuscript.
Data availability
The complete DNA methylation data are freely available on the GEO repository under accession number GSE196902.
Disclosure statement
ME is a consultant for Ferrer International and Quimatryx. The remanining authors declare that they have no conflict of interest.
Additional information
Funding
References
- Whitelaw CB, Sheets TP, Lillico SG, et al. Engineering large animal models of human disease. J Pathol. 2016;238:247–256.
- Gurumurthy CB, Lloyd KCK. Generating mouse models for biomedical research: technological advances. Dis Model Mech. 2019;12:dmm029462.
- Li H, Auwerx J. Mouse systems genetics as a prelude to precision medicine. Trends Genet. 2020;36:259–272.
- Sandoval J, Heyn H, Moran S, et al. Validation of a DNA methylation microarray for 450,000 CpG sites in the human genome. Epigenetics. 2011;6:692–702.
- Moran S, Arribas C, Esteller M. Validation of a DNA methylation microarray for 850,000 CpG sites of the human genome enriched in enhancer sequences. Epigenomics. 2016;8:389–399.
- Lister R, Pelizzola M, Dowen RH, et al. Human DNA methylomes at base resolution show widespread epigenomic differences. Nature. 2009;462:315–322.
- Heyn H, Li N, Ferreira HJ, et al. Distinct DNA methylomes of newborns and centenarians. Proc Natl Acad Sci U S A. 2012;109:10522–10527.
- Stunnenberg HG; Hirst M, Abrignani, S.; International Human Epigenome Consortium. The International Human Epigenome Consortium: a blueprint for scientific collaboration and discovery. Cell. 2016;167:1145–1149.
- He Y, Hariharan M, Gorkin DU, et al. Spatiotemporal DNA methylome dynamics of the developing mouse fetus. Nature. 2020;583:752–759.
- Moore JE, Purcaro MJ, Pratt, H E, et al.; ENCODE Project Consortium. Expanded encyclopaedias of DNA elements in the human and mouse genomes. Nature. 2020;583:699–710.
- BLUEPRINT consortium. Quantitative comparison of DNA methylation assays for biomarker development and clinical applications. Nat Biotechnol. 2016;34:726–737.
- Moran S, Esteller M. Infinium DNA methylation microarrays on formalin-fixed, paraffin-embedded samples. Methods Mol Biol. 2018;1766:83–107.
- Jackson-Grusby L, Beard C, Possemato R, et al. Loss of genomic methylation causes p53-dependent apoptosis and epigenetic deregulation. Nat Genet. 2001;27:31–39.
- Sakamoto H, Suzuki M, Abe T, Hosoyama T, Himeno E, Tanaka S, Greally JM, Hattori N, Yagi S, Shiota K. Cell type-specific methylation profiles occurring disproportionately in CpG-less regions that delineate developmental similarity. Genes Cells. 2007;12:1123–1132.
- Escamilla-Del-Arenal M, da Rocha ST, Heard E. Evolutionary diversity and developmental regulation of X-chromosome inactivation. Hum Genet. 2011;130:307–327.
- Dindot SV, Person R, Strivens M, et al. Epigenetic profiling at mouse imprinted gene clusters reveals novel epigenetic and genetic features at differentially methylated regions. Genome Res. 2009;19:1374–1383.
- Monk D. Deciphering the cancer imprintome. Brief Funct Genomics. 2010;9:329–339.
- Stadler MB, Murr R, Burger L, et al. DNA-binding factors shape the mouse methylome at distal regulatory regions. Nature. 2011;480:490–495.
- Hon GC, Rajagopal N, Shen Y, et al. Epigenetic memory at embryonic enhancers identified in DNA methylation maps from adult mouse tissues. Nat Genet. 2013;45:1198–1206.
- Yue F, Cheng Y, Breschi A, et al. A comparative encyclopedia of DNA elements in the mouse genome. Nature. 2014;515:355–364.
- Bogdanović O, Smits AH, de la Calle Mustienes E, et al. Active DNA demethylation at enhancers during the vertebrate phylotypic period. Nat Genet. 2016;48:417–426.
- Ginno PA, Gaidatzis D, Feldmann A, et al. A genome-scale map of DNA methylation turnover identifies site-specific dependencies of DNMT and TET activity. Nat Commun. 2020;11:2680.
- Castro de Moura M, Davalos V, Planas-Serra L, et al. Epigenome-wide association study of COVID-19 severity with respiratory failure. EBioMedicine. 2021;66:10.