
ABSTRACT
Aberrantly methylated genes contribute to the landscape of epigenetic alterations in colorectal adenocarcinoma. The global CpG Island methylator phenotype (CIMP) and individually methylated genes are potential prognostic/predictive biomarkers. Research suggests an association between methylated DCR1 (mDCR1) and lack of benefit with irinotecan (IFL) treatment. We assessed the association between DCR1 methylation status and survival in patients receiving adjuvant fluorouracil/ leucovorin (5-FU/LV) or IFL. We analysed data from patients with stage III colon adenocarcinoma randomly assigned to adjuvant 5-FU/LV or IFL in CALGB 89803 (Alliance). The primary endpoint was overall survival (OS), and the secondary endpoint was disease-free survival (DFS). Using tumour sample DNA, we evaluated the association between survival, DCR1 methylation status, and molecular subgroups (BRAF, KRAS, mismatch repair status, CIMP status) using Kaplan–Meier estimator and Cox proportional hazard model. mDCR1 was observed in 221/400 (55%) colon cancers. Histopathologic features were similar between mDCR1 and unmethylated DCR1 (unDCR1) colon cancers. There was no difference in OS (p = 0.83) or DFS (p = 0.85) based on DCR1 methylation status. There was no association between methylation status and response to IFL . In patients with unDCR1 and KRAS-wildtype tumours, those who received IFL had a nearly two-fold worse DFS compared to patients who received 5-FU/LV (HR = 1.85, 95% CI (0.97–3.53, p = 0.06). This relationship was not notable among other subgroups. In stage III colon cancer patients, mDCR1 status did not associate with response to irinotecan. Larger studies may suggest an association between the iridocene response and molecular subgroups.
Introduction
The extensive intertumoral molecular heterogeneity of colorectal cancers (CRC) impacts prognosis and response to certain therapies, secondary to the effects of specific genetic or epigenetic alterations on the biology of CRC[Citation1]. For example, the presence of microsatellite stability or mismatch repair deficiency (MMR-D) serves as a predictive marker for response to anti-PD-1 immunotherapy, while activating mutations in KRAS, NRAS, and BRAF serve as both biomarkers of poor prognosis and predictors of lack of response to anti-epidermal growth factor receptor (EGFR) treatment [Citation1–6]. In addition to gene mutations, epigenetic changes such as DNA methylation and histone modifications have been shown to play a role in CRC pathogenesis and therefore have also generated interest as biomarkers [Citation7]. Many epigenetic alterations in CRC are plausible predictive biomarkers given their likely role in the CRCs’ response to conventional or targeted therapies; however, most have not been assessed. There is a continued need to better understand the epigenetic alterations within CRCs that may in turn inform more effective and personalized treatment strategies.
An epigenetic marker that has already gained attention is the global CpG Island methylator phenotype (CIMP). CIMP is characterized by a high frequency of genome-wide aberrant DNA methylation of CpG Islands throughout the genome [Citation8] and is thought to promote carcinogenesis by silencing tumour suppressor genes. CIMP-positive tumours are typically proximal, higher grade, and have MMR-D, wild-type TP53, and mutant BRAF [Citation5,Citation9–13]. CIMP positivity has, therefore, been assessed as a predictive biomarker of treatment response. Shiovitz, et al. found that patients with stage III, CIMP-positive, MMR-intact colon tumours benefitted most from the addition of irinotecan to fluorouracil and leucovorin (5-FU/LV) adjuvant therapy (p = 0.01) [Citation14].
It remains unknown whether the impact of CIMP is due to global alterations in DNA methylation or from the aberrant hypermethylation of key individual genes. One such putative epigenetic biomarker is Decoy Receptor-1 (DCR1; 8p21.3, also known as TRAIL-R3 and TNFRSF10C) [Citation15]. DCR1 belongs to the TNF-receptor superfamily and is involved in the regulation of apoptosis in cancer cells (but not normal cells) via its interaction with TNF‐related apoptosis‐inducing ligand (TRAIL)[Citation16]. Prior studies have suggested that aberrant methylation of DCR1 (mDCR1) is common in solid tumours [Citation16] and a published retrospective study using two different CRC cohorts reported that DCR1 promoter hypermethylation status in patients with metastasized CRCs could be a potential predictive biomarker for response to treatment with irinotecan, when combined with capecitabine, but not when irinotecan was combined with 5FU [Citation17].
Combination 5-FU/LV and oxaliplatin (FOLFOX) chemotherapy remains the standard of care after resection for stage III colon cancer [Citation18]. Despite the heterogeneity in treatment response to FOLFOX in CRC patients, there is no current practice of individualization of treatment recommendations based on CRC biomarkers. This may include offering chemotherapy options, such as irinotecan, which are currently reserved for the metastatic setting [Citation19]. Here, we performed an exploratory analysis to assess the association between tumour DCR1 methylation status and survival in patients receiving adjuvant 5-FU/LV vs. IFL within the pivotal Cancer and Leukaemia Group B (CALGB) 89803 trial. CALGB is now part of the Alliance for Clinical Trials in Oncology.
Materials and methods
Characteristics of study population
After a curative surgical resection of histologically confirmed stage III colon adenocarcinoma, patients were enrolled between April 1999 and April 2001 and then randomized (fixed block) to receive either 5-FU/LV or IFL within CALGB 89803 [Citation19]. The primary endpoint was overall survival (OS), measured from clinical trial entry until death from any cause. Disease-free survival (DFS), defined as the time from study entry until the earlier of documented progression of disease or death from any cause, was a secondary endpoint. Additional secondary endpoints addressed the relationship between tumour-associated risk factors and treatment outcome. This protocol was approved by the institutional review board of each centre and the analysis in this biomarker study received institutional review board approval from the Fred Hutchinson Cancer Research Centre (IR 1989). All patients provided written informed consent to participation in this study and for molecular analysis. The follow-up was completed on 9 November 2009. Protocols for the molecular testing of TP53, BRAF, KRAS, MMR, and CIMP have been described previously [Citation5,Citation14,Citation20–22].
Treatment
As previously published [Citation19], 5-FU/LV treatment consisted of a weekly LV 500 mg/m2 intravenously over 2 hours, with bolus 5-FU 500 mg/m2 IV 1 h after initiation of LV for a total of 4 cycles or 32 weeks of therapy. The IFL group received an irinotecan of 125 mg/m2 IV over 90 minutes, LV 20 mg/m2 IV bolus, then 5-FU 500 mg/m2 IV bolus for 5 cycles or 30 weeks.
DNA extraction and sodium bisulphite conversion
Tumour molecular analyses were carried out blinded to patient and outcome data. DNA was extracted from formalin-fixed paraffin embedded tissue using Bio-Rad’s InstaGene Matrix. To enrich the tumour epithelium and confirm the histological diagnosis, haematoxylin, and eosin-stained slides from all cases were reviewed and marked. The corresponding area in adjacent sections was identified and microdissected using sterile razor blades to achieve >70% tumour and then subjected to DNA extraction. The assays were performed in a non-Clinical Laboratory Improvement Amendment-approved research laboratory at the Fred Hutchinson Cancer Research Centre (William M. Grady, Principal Investigator). Sodium bisulphite conversion of approximately 1.0 µg genomic DNA was performed using Zymo Research EZ DNA Methylation Kit, with a final eluted volume of 20 µL. The converted DNA was diluted to 1:10 for methylation assays.
mDCR1 methylation analysis
All methylation assays were performed blind to information on treatment or survival outcome. The assays were performed in the lab of William M. Grady as above. Genomic DNA was analysed by a quantitative methylation-specific PCR (qMSP) for DCR1 as described before [Citation17] with the following modifications. qMSP reactions were carried out using a Bio-Rad CFX96 Real-Time System (Bio-Rad, Hercules, CA) in duplicate in 25 µl reaction volumes, where each reaction contained about 20 ng of bisulphite-treated DNA, 10 pmol of each primer, and 12.5 μl SYBR Green PCR Master Mix (Bio-Rad). Each plate included no template control, a positive control DNA (100% methylation DNA), and a negative control (100% unmethylated DNA). The PCR conditions were 95°C for 15 minutes, 40 cycles at 95°C for 15 seconds, 60°C for 60 seconds, followed by a melt curve analysis to check the specificity of the amplification reaction. The qMSP assay for mDCR1 has been previously described [Citation17]. The AluC4 assay (Alu-element-based normalization assay for qMSP) is methylation insensitive and was included for normalization and quality control [Citation23]. Cycle threshold (Ct) values were measured at a fixed fluorescence threshold, which was always in the exponential phase of the amplification curves. The Ct ratio per sample was calculated according to the formula 2e−[mean CtmDCR1 – mean CtAluC4]. A sample was considered methylated when the Ct ratio was higher than observed in a panel of 20 normal colon mucosa from non-cancer patients as measured in duplicate (median plus two times the standard deviation = 7.19 × 10⁻⁶).
DNA methylation status was also assessed using TCGA data. DCR1 DNA methylation status in the TCGA COAD samples from cancer patients with available Illumina HM450 bead array data was obtained via cBioPortal for Cancer Genomics (http://www.cbioportal.org). DCR1 DNA methylation status in the normal colon from healthy subjects were obtained from GSE132804. The average beta values of the two probes (‘cg08309809’ and ‘cg27090216’) falling within the genomic region of the mDCR1 MSP assay were used to estimate the DCR1 methylation value for each sample. A tumour sample was called methylated when the beta value of the sample was higher than a beta value threshold of 0.355 observed in normal colon mucosa from healthy subjects (the threshold was measured as median beta value of normal samples plus two times the standard deviation).
Statistical methods
The clinical database used for this analysis was frozen on 9 November 2009. Patient baseline clinical characteristics were compared between patients with methylated and unmethylated DCR1 (mDCR1 and unDCR1, respectively). Continuous variables were presented as medians with interquartile percentiles, whereas categorical variables were expressed as percentages. Univariate comparisons were performed using the Wilcoxon rank-sum test [Citation24] tests for continuous variables and Pearson Chi-square [Citation25] tests for categorical variables. For time-to-event endpoints, given the follow-up was limited to 8 years, patients who did not experience events by 8 years were right-censored at 8 years. The distribution of time-to-event endpoints is estimated by Kaplan–Meier curves [Citation26]. OS and DFS between different biomarker categories were tested using log-rank test [Citation26]. Multivariable Cox model [Citation27] was used to assess the prognostic associations of DCR1 status with OS and DFS, adjusting for other key clinical-pathological factors (age, gender, performance status, tumour site, T-stage, number of positive nodes, and histologic grade) and treatment arms. CIMP4 status was entered in the model as an additional adjusted variable. No imputation was done for covariates with missing values. The prognostic effect of DCR1 status was further examined within each key biomarker status (MMR, BRAF, TP53, KRAS, and CIMP4) by incorporating an interaction term between the DCR1 methylation status and key biomarker in the Cox model. The predictive effect of DCR1 methylation was examined by including methylation status, treatment arm, and the interaction between the two in the Cox model while adjusting for key clinical-pathological factors mentioned above. To further examine the predictive effect of DCR1 status within specific key biomarker status, Cox models with DCR1 status, treatment arm, key biomarker, and the 2-way/3-way interactions between the three were used while adjusting for key clinical-pathological factors mentioned above. The treatment effect (IFL vs. 5FU/LV) in each methylation and biomarker status was estimated using the point estimates from the Cox model. The p-value of the interaction term was calculated based on the likelihood ratio test. Analyses were done with SAS (version 9.4; SAS Institute, Cary, NC, USA). Two-sided p values of less than 0.05 were considered to be significant and were not adjusted for multiple comparisons. Data collection and statistical analyses were conducted by the Alliance Statistics and Data Centre. Data quality was ensured by review of data by the Alliance Statistics and Data Centre and by the study chairperson following Alliance policies.
Results
Of the 1,264 patients in CALGB 89803, 400 had tumour DNA available for DCR1 methylation analysis. The remaining patients were excluded because they did not have tumour DNA available for analysis (N = 807) or the assay failed (N = 57). Among the 400 analysed patients’ CRCs, 221 carried mDCR1 (55%) and 179 (45%) had unDCR1. Analysis of the TCGA data revealed 59% of TCGA COAD cases are DCR1 methylated and 41% are unmethylated, similar to our results. There were 213 patients treated with 5-FU/LV (126 mDCR1, 87 unDCR1) and 187 were treated with IFL (95 mDCR1, 92 unDCR1). The median (Q1, Q3) DFS follow-up was 7.66 (7.2, 8.0) years. Demographic features of the study population are described in . There were slightly more women in the mDCR1 CRC group versus unDCR1 CRC group (p = 0.04). There was no significant difference between the two groups regarding randomized treatment arm, age, performance status (PS), tumour site (distal vs proximal), histologic grade, or number of positive lymph nodes. Colon cancers with mDCR1 cancers had similar histopathologic features to colon cancers with unDCR1, including extramural vascular invasion, perineural invasion, and lymphovascular invasion. The two groups had similar frequencies of mutations in BRAF, KRAS, TP53, and similar MMR status.
Table 1. Demographics of the study population by DCR1 status.
Relationship between DCR1 methylation and patient outcomes
DCR1 methylation status was not associated with OS or DFS. At 5 years, OS was 70% (95% CI 64–77%) in patients with mDCR1 colon cancers versus 73% (95% CI 67–80%) for patients with unDCR1 colon cancers, p = 0.83 (). DCR1 methylation status was not associated with OS even when adjusted for key clinical variables, including age, gender, performance status, tumour site, stage, node status, histologic grade, and CIMP4 status (p = 0.76) (). The 5-year DFS was 61% (95% CI 54–67%) for patients with colon cancers with mDCR1 versus 61% (95% CI 54–69%) for patients with colon cancers with unDCR1, p = 0.85 (). Similarly, adjusting for treatment and clinical variables did not reveal any association between DCR1 methylation status and DFS (p = 0.99) ().
Figure 1. Overall survival based on DCR1 methylation status.
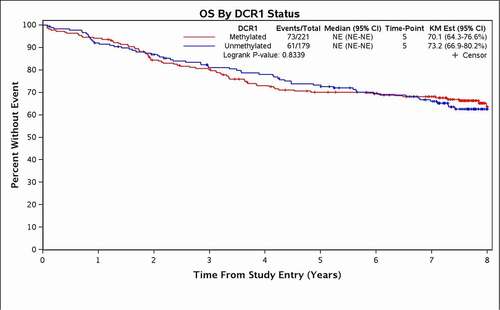
Figure 2. Disease-Free survival based on DCR1 methylation status.
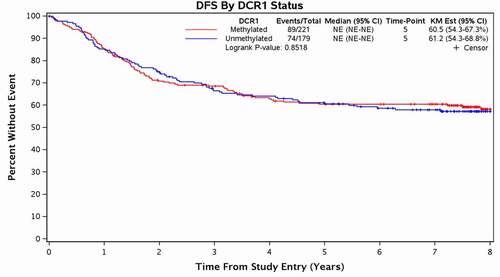
Table 2. Prognostic and predictive overall survival based on DCR1 methylation status.
Table 3. Prognostic and predictive disease-free survival based on DCR1 methylation status.
Relationship between DCR1 methylation, biomarkers, and patient outcomes
Additional OS and DFS analyses were performed using specific genetic alterations (e.g., KRAS, BRAF), which had been previously determined in the CALGB 89803 sample set [Citation5,Citation20–22,Citation28]. There was also no significant association between DCR1 methylation and DFS in when accounting for molecular subgroups based on MMR status (interaction, p = 0.45), BRAF mutation status (interaction, p = 0.83), TP53 mutation status (interaction, p = 0.48), KRAS mutation status (interaction, p= 0.70), and CIMP status (interaction, p = 0.36) (Supplemental Figure 1A). OS results were similar; none of the variables reached statistical significance (Supplemental Figure 1B).
Relationship between DCR1 methylation and response to treatment
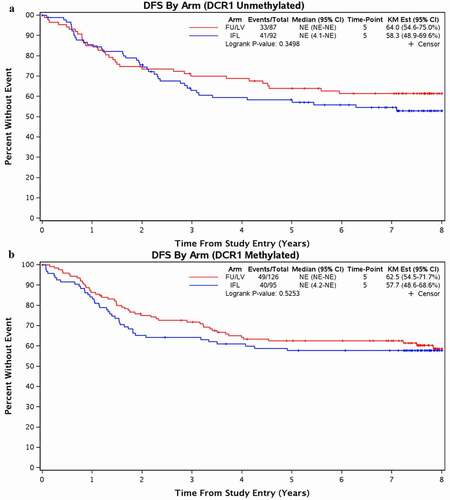
There was no observed difference in DFS and OS across treatment arms based on cancer DCR1 methylation status (, Supplemental Figure 2). Given our hypothesis that methylated DCR1 is associated with worse outcomes after irinotecan treatment, we focused our analysis on DFS when analysing DCR1 methylation status as a potential predictive biomarker. For patients with colon cancers with mDCR1, 5-year DFS was 63% (95% CI 55–72%) with 5-FU/LV versus 58% (CI 49–69%) with IFL (p = 0.53) (). Similarly, in patients with unDCR1 colon cancer treated with 5-FU/LV, the 5-year DFS was 64% (95% CI 55–75%) versus 58% (CI 49–70%) for patients treated with IFL (p = 0.35). There was no significant differential treatment effect in DFS using a two-way interaction model between the treatment arm and DCR1 methylation status, including when adjusted for key clinical variables (interaction, p = 0.55) and CIMP status (interaction, p = 0.54) (). OS results were similar ().
Figure 3. Disease-Free Survival for Patients Treated with 5-FU/LV vs IFL based on DCR1 Methylation Status.
Relationship between DCR1 methylation status, biomarkers, and treatment
We additionally investigated a possible three-way interaction between DCR1 methylation status, treatment arm, and individual molecular alterations including MMR status, mutant BRAF, mutant KRAS, mutant TP53, and CIMP status (Supplemental Figure 3 and 4). There was no significant interaction for OS or DFS when adjusted for clinical and pathologic variables for any of these molecular alterations. However, among those patients with colon cancers with unDCR1 and KRAS-wildtype, the treatment effect (5-FU/LV versus IFL) for DFS had the strongest relationship, albeit not statistically significant (HR = 1.85 (0.97–3.53), p = 0.06) (). The relationship was not notable among other subgroups.
Figure 4. DCR1 as a predictive biomarker for DFS by KRAS subgroup.
Discussion
In this exploratory analysis of stage III colon cancer patients from a prospective, randomized trial of 5-FU/LV vs IFL, DCR1 methylation status was not observed to be a prognostic biomarker or a predictive biomarker for irinotecan response. Specifically, DCR1 methylation status was not associated with worse DFS when adjusted for treatment group or for clinical variables. There was also no predictive difference in DFS-based DCR1 methylation status in the 5-FU/LV treatment group when compared to the IFL treatment group.
We conducted this analysis based on a previously published study that suggested DCR1 methylation status may predict worse outcomes following irinotecan treatment. In a prior study of metastatic CRC patients treated with either first-line capecitabine and irinotecan (CAPIRI) vs capecitabine monotherapy, Criekinge et al. and Bosch et al. reported that patients with cancers with mDCR1 who received CAPIRI had a shorter progression-free survival (PFS) compared to patients with cancers with unDCR1 (HR = 0.4, 95% CI = 0.3–0.7, p = 0.0009) [Citation29,Citation30]. Additionally, they found that there was no PFS benefit from the addition of irinotecan to capecitabine for patients with colon cancers with mDCR1 (validation set: HR = 1.1, 95% CI 0.7–1.7, p = 0.6). However, patients with cancers with unDCR1 did have improved PFS with CAPIRI when compared to patients treated with only capecitabine (validation set: HR = 1.7, 95% CI 1.1–2.0, p = 0.004). These data suggested that DCR1 methylation status may be a predictor for which patients will benefit from the addition of irinotecan therapy to capecitabine-based therapies. However, similar to our study, these results could not be replicated in an external data set in which irinotecan was combined with 5-FU/LV (mDCR1: HR = 0.7, 95% CI 0.5–0.9, p = 0.01, unDCR1: HR = 0.8, 95% CI 0.6–1.2, p = 0.4). These results and our results raise many questions, including whether there may be an unappreciated factor(s) that result in the differences observed between 5-FU and capecitabine treatment or the impact of irinotecan dosing in these two regimens, recognizing that these studies were performed in two different stages of CRC [Citation17].
No statistically significant relationship was observed between mDCR1 or unDCR1 status when other molecular alterations (MMR status, BRAF mutation status, TP53 mutation status, KRAS mutation status, and CIMP status) were also assessed. Additionally, no significant interaction was observed in a 3-way model between DCR1 methylation status, treatment arm, and the specific molecular alterations noted above. However, among those patients with unDCR1 and KRAS wildtype cancers, patient who received IFL had a nearly two-fold worse DFS compared to patients who received 5-FU/LV (HR = 1.85, 95% CI (0.97–3.53). Intriguingly, this is in contrast to the study by Bosch et al., where they reported that patients with unDCR1 tumours showed benefit with addition of irinotecan. Notably, this other study evaluated metastatic CRC patients stratified by KRAS status, while our study focused on unselected stage III colon cancer patients receiving chemotherapy within a large clinical trial.
Additional investigation with studies using larger numbers of subjects will be needed to further evaluate the potential relationship between KRAS and DCR1 to determine if this subgroup of colon cancers does respond to irinotecan uniquely. Of note, in non-small cell lung cancer, there have been reports that the KRAS mutation alters sensitivity to TRAIL (a ligand for DCR1)-mediated apoptosis and that this was also synergistic to 5-FU [Citation31,Citation32,Citation33]. When DCR1 is methylated, the cancer cells are relatively resistant to TRAIL-mediated apoptosis, supporting the hypothesis that the molecular impact of DCR1 on chemotherapy resistance may depend on KRAS status.
Although we did not validate DCR1 methylation status as a prognostic or predictive biomarker of irinotecan resistance among patients with stage III colon cancer, our findings suggest that further classification by KRAS mutation status may identify cancer subgroups (e.g., unDCR1 and KRAS wildtype) that are predicted to have the worst survival following irinotecan therapy. We also acknowledge that although this study has the strength of using cancers from patients who were treated within a large randomized clinical trial with good clinical annotation, the study was an exploratory analysis with a relatively small sample size, which limits the ability to draw firm conclusions about DCR1 methylation status as a biomarker for response to irinotecan-based adjuvant therapy in stage 3 colon cancer. Overall, these data highlight the need for further investigations to identify predictive and prognostic biomarkers that can be used to optimize treatment strategies for colon cancer patients.
Support
Research reported in this publication was supported by the National Cancer Institute of the National Institutes of Health under Award Numbers U10CA180821 and U10CA180882 (to the Alliance for Clinical Trials in Oncology), U24CA196171 (to the Alliance for NCTN Biorepository and Biospecimen Resource Grant), UG1CA233180, UG1CA233328, UG1CA233339, and UG1CA233373; Health P30-CA015704-44 (S.A.C.), NCI R50CA233042 (M.Y.), T32 CA009515 (LS), P01CA077852, P30CA042014, P30CA15704, R01189184, R01CA194663, R01CA207371, R01CA220004, U01CA206110, and U54CA143862 (W.M.G.); and Listwin Family Foundation; Cottrell Family Fund; R.A.C.E. Charities; Seattle Translational Tumor Research; Rodger C. Haggitt Endowed Chair; W.H. Geiger Family Foundation to WMG; Dutch Cancer Society (KWF Fellowship 2013-5885). https://acknowledgments.alliancefound.org.
The content is solely the responsibility of the authors and does not necessarily represent the official views of the National Institutes of Health.
Clinicaltrials.gov Identifier: NCT00003835
Acknowledgments
The authors thank Dan Rohrer in the CALGB Pathology Coordinating Office for
processing the samples and providing the tissue sections for the cases.
Disclosure statement
No potential conflict of interest was reported by the author(s).
Data availability statement
The data that support the findings of this study are available from the Alliance for Clinical Trials in Oncology, upon reasonable request. https://www.allianceforclinicaltrialsinoncology.org/main/public/standard.xhtml?path=%2FPublic%2FDatasharing
Additional information
Funding
References
- Walther A, Johnstone E, Swanton C, et al. Genetic prognostic and predictive markers in colorectal cancer. Nat Rev Cancer. 2009;9:489–499.
- Boussios S, Ozturk MA, Moschetta M, et al. The developing story of predictive biomarkers in colorectal cancer. J Pers Med. 2019;9:12.
- Zarkavelis G, Boussios S, Papadaki A, et al. Current and future biomarkers in colorectal cancer. Ann Gastroenterol. 2017;30:613–621.
- Popat S, Hubner R, Houlston RS. Systematic review of microsatellite instability and colorectal cancer prognosis. J Clin Oncol. 2005;23:609–618.
- Ogino S, Shima K, Meyerhardt JA, et al. Predictive and prognostic roles of BRAF mutation in stage III colon cancer: results from intergroup trial CALGB 89803. Clin Cancer Res. 2012;18:890–900.
- Arnold D, Lueza B, Douillard JY, et al. Prognostic and predictive value of primary tumour side in patients with RAS wild-type metastatic colorectal cancer treated with chemotherapy and EGFR directed antibodies in six randomized trials. Ann Oncol. 2017;28:1713–1729.
- Hartley A-V, Martin M, Lu T. Epigenetic biomarkers and their therapeutic applications in colorectal cancer, advances in the molecular understanding of colorectal cancer: intechOpen
- Grady WM, Carethers JM. Genomic and epigenetic instability in colorectal cancer pathogenesis. Gastroenterology. 2008;135:1079–1099.
- Toyota M, Ahuja N, Ohe-Toyota M, et al. CpG Island methylator phenotype in colorectal cancer. Proc Nat Acad Sci. 1999;96:8681–8686.
- Hawkins N, Norrie M, Cheong K, et al. CpG Island methylation in sporadic colorectal cancers and its relationship to microsatellite instability. Gastroenterology. 2002;122:1376–1387.
- Weisenberger DJ, Siegmund KD, Campan M, et al. CpG Island methylator phenotype underlies sporadic microsatellite instability and is tightly associated with BRAF mutation in colorectal cancer. Nat Genet. 2006;38:787–793.
- van Rijnsoever M, Grieu F, et al. Characterisation of colorectal cancers showing hypermethylation at multiple CpG Islands. Gut. 2002;51:797–802.
- Min B-H, Bae JM, Lee EJ, et al. The CpG Island methylator phenotype may confer a survival benefit in patients with stage II or III colorectal carcinomas receiving fluoropyrimidine-based adjuvant chemotherapy. BMC Cancer. 2011;11:344.
- Cohen SA, Wu C, Yu M, et al. Evaluation of CpG Island methylator phenotype as a biomarker in colorectal cancer treated with adjuvant oxaliplatin. Clin Colorectal Cancer. 2016;15:164–169.
- TNF receptor superfamily member 10c: National Center for Biotechnology.
- Shivapurkar N, Toyooka S, Toyooka KO, et al. Aberrant methylation of trail decoy receptor genes is frequent in multiple tumor types. Int J Cancer. 2004;109:786–792.
- Bosch LJW, Trooskens G, Snaebjornsson P, et al. Decoy receptor 1 (DCR1) promoter hypermethylation and response to irinotecan in metastatic colorectal cancer. Oncotarget. 2017;8:63140–63154.
- André T, Boni C, Mounedji-Boudiaf L, et al. Oxaliplatin, fluorouracil, and leucovorin as adjuvant treatment for colon cancer. N Engl J Med. 2004;350:2343–2351.
- Saltz LB, Niedzwiecki D, Hollis D, et al. Irinotecan fluorouracil plus leucovorin is not superior to fluorouracil plus leucovorin alone as adjuvant treatment for stage III colon cancer: results of CALGB 89803. J Clin Oncol. 2007;25:3456–3461.
- Bertagnolli MM, Niedzwiecki D, Compton CC, et al. Microsatellite instability predicts improved response to adjuvant therapy with irinotecan, fluorouracil, and leucovorin in stage III colon cancer: cancer and Leukemia Group B protocol 89803. J Clin Oncol. 2009;27:1814–1821.
- Ogino S, Meyerhardt JA, Irahara N, et al. KRAS mutation in stage III colon cancer and clinical outcome following intergroup trial CALGB 89803. Clin Cancer Res. 2009;15:7322–7329.
- Warren RS, Atreya CE, Niedzwiecki D, et al. Association of TP53 mutational status and gender with survival after adjuvant treatment for stage III colon cancer: results of CALGB 89803. Clin Cancer Res off J Am Assoc Cancer Res. 2013;19:5777–5787.
- Weisenberger DJ, Campan M, Long TI, et al. Analysis of repetitive element DNA methylation by MethyLight. Nucleic Acids Res. 2005;33:6823–6836.
- Mann HB, Whitney DR. On a test of whether one of two random variables is stochastically larger than the other. Ann Math Stat. 1947;18:50–60.
- Cochran WG. The chi-square test of goodness of fit. Ann Math Stat. 1952;23:315–345.
- Kaplan EL, Meier P. Nonparametric estimation from incomplete observations. J Am Stat Assoc. 1958;53:457–481.
- Cox DR. Regression models and life-tables. J R Stat Soc Series B Stat Methodol. 1972;34:187–220.
- Bertagnolli MM, Redston M, Compton CC, et al. Microsatellite instability and loss of heterozygosity at chromosomal location 18q: prospective evaluation of biomarkers for stages II and III colon cancer–a study of CALGB 9581 and 89803. J Clin Oncol. 2011;29:3153–3162.
- Criekinge WV, Bosch LJ, Trooskens G, et al. Association of DNA promoter hypermethylation of decoy receptor 1 (DCR1) with poor response to irinotecan in metastatic colorectal cancer. J Clin Oncol. 2013;31: 3552-3552.
- Bosch LJ, Trooskens G, Snaebjornsson P, et al. Abstract 1155: promoter CpG Island hypermethylation of Decoy Receptor 1 (DCR1) is associated with poor response to irinotecan in colorectal cancer. Cancer Res. 2013;73: 1155-1155.
- Wang H, Yang T, Wu X. 5-Fluorouracil preferentially sensitizes mutant KRAS non-small cell lung carcinoma cells to TRAIL-induced apoptosis. Mol Oncol. 2015;9:1815–1824.
- Zhao XD, Deng HB, Lu CL, et al. Association of EGFR and KRAS mutations with expression of p-AKT, DR5 and DcR1 in non-small cell lung cancer. Neoplasma. 2017;64:182–191.
- Kent WJ, Sugnet CW, Furey TS, et al. The human genome browser at UCSC. Genome Res. 2002 Jun;12(6):996–1006.