
ABSTRACT
The SIRT1 epigenetic regulator is involved in hepatic lipid homoeostasis. However, the role of SIRT1 in regulating intramuscular fat deposition as well as the pathways and potential epigenetic targets involved remain unknown. Herein, we investigate SIRT1 function, its genome-wide epigenetic target profile, and transcriptomic changes under SIRT1 overexpression during yak intramuscular preadipocytes differentiation. To this end, we analysed the relationship between SIRT1 and intramuscular fat content as well as lipid metabolism-related genes in longissimus dorsi tissue. We found that SIRT1 expression negatively correlates with intramuscular fat content as well as with the expression of genes related to lipid synthesis, while positively correlating with that of fatty acid oxidation-involved genes. SIRT1 overexpression in intramuscular preadipocytes significantly reduced adipose differentiation marker expression, intracellular triacylglycerol content, and lipid deposition. Chromatin immunoprecipitation coupled with high-throughput sequencing of H3K4ac (a known direct target of SIRT1) and high-throughput mRNA sequencing results revealed that SIRT1 may regulate intramuscular fat deposition via three potential new transcription factors (NRF1, NKX3.1, and EGR1) and four genes (MAPK1, RXRA, AGPAT1, and HADH) implicated in protein processing within the endoplasmic reticulum pathway and the MAPK signalling pathway in yaks. Our study provides novel insights into the role of SIRT1 in regulating yak intramuscular fat deposition and may help clarify the mechanistic determinants of yak meat characteristics.
Introduction
The yak (Bos grunniens) thrives well in hypoxic, cold, harsh environments as well as on the limited grassland resources of the Qinghai-Tibetan Plateau (QTP) and adjacent highland regions. Yak husbandry is a major traditional industry within the QTP, driving socioeconomic development. The Tibetan people primarily raise yaks for meat and milk, with the species being of considerable cultural importance. According to our update, the yak stock in 2021 amounted to approximately 18 million heads, accounting for approximately 18% of the beef cattle stock in China. Previous studies have shown that nutrients, such as proteins and polyunsaturated fatty acids, are present at higher levels in yak meat than in cattle meat[Citation1], [Citation2]. However, yak meat has a lower intramuscular fat (IMF) content [Citation1], which seriously affects its taste, tenderness, colour, and flavour [Citation3,Citation4], thus limiting the sale and market development of yak products. The main factors that determine IMF content include breed, age, and nutrition [Citation5–7]. Nutrient regulation [Citation8,Citation9] as well as common molecular mechanisms that affect gene and protein expression (acetylation [Citation10], methylation, and phosphorylation [Citation11]) are also implicated in IMF metabolism. The heritability of IMF deposition ranges from 0.36 to 0.54 [Citation12,Citation13], which is a low-to-moderate magnitude. Therefore, the regulation of IMF in yaks has become a key problem that required urgent solutions through research. Current research on yak IMF mainly focuses on the differences between yak and cattle through correlation analysis of lipid metabolism-related gene expression profiles and the study of intramuscular fatty acid composition. However, there is no report on the molecular mechanisms regulating IMF metabolism in yaks.
Intramuscular fat refers to the amount of fat located in skeletal muscle fibres. In livestock, IMF content is assessed as the marbling of meat and represents an important meat quality trait, which depends mainly on the size and number of intramuscular adipocytes as well as the muscle growth rate. It is a complex trait influenced by multiple genes or quantitative trait locus (QTLs). To date, 891 QTLs have been associated with IMF content in pigs (https://www.animalgenome.org/cgi-bin/QTLdb/SS/index). However, most QTLs were determined via genome-wide association or other sequencing studies, without functional characterization. Various studies on the mechanism of IMF deposition in livestock have revealed genes involved in the deposition-regulation pathway. For example, through bioinformatics and co-localization analyses, in addition to RNAi-mediated loss-of-function screens, IRLnc has been verified as an IMF decomposition regulator that directly targets the nuclear receptor- subfamily-4-group-A-member-3 (Nr4a3) associated with insulin resistance [Citation14]. Further, peroxisome proliferator-activated receptor γ (PPARγ) [Citation15], sterol regulatory element-binding transcription factor 1 (SREBF1) [Citation16], and liver X receptor-alpha (LXRα) [Citation17] are key transcription factors involved in IMF deposition, which coordinate lipogenic gene networks during lipid metabolism [Citation18].
Histone deacetylases (HDACs) are enzymes that catalyse the deacetylation of histone amino-terminal tails, particularly H3 and H4 tails. As chromatin dynamics have major effects on gene expression and other nuclear processes, HDACs play an important role in various physiological and pathological processes. Mammalian sirtuins are a family of HDACs that deacetylate substrates ranging from histones to transcription regulators, in a nicotinamide adenine dinucleotide (NAD+) dependent manner. Silent mating information regulation 2 homolog 1 (SIRT1) is among the most extensively studied sirtuins, reported to regulate essential biological processes (such as cell differentiation [Citation19], energy metabolism [Citation20], and immune response [Citation21]) implicated in various pathologies (such as diabetes [Citation19,Citation22], cardiovascular diseases [Citation23], and cancer [Citation24]). Mechanistic studies of SIRT1 suggest that it acts as a key regulator of mammalian lipid metabolism. It plays a role downstream of adipose triglyceride lipase during the regulation of hepatic lipid droplet catabolism and fatty acid oxidation in mice [Citation25], limits preadipocyte hyperplasia through C-Myc deacetylation [Citation26], and suppresses lipid accumulation by inhibiting PPARγ[Citation27] as well as SREBF1c signalling[Citation28], while increasing PPARα[Citation28] signalling in adipocytes. There is significant interest in identifying SIRT1-dependent molecular pathways relevant to adipogenesis. Previous studies of the transcriptomic landscape of muscle and adipose tissues have suggested that SIRT1 as a potential key regulator of IMF deposition in yaks [Citation29]. However, the detailed mechanisms and signalling factors that mediate SIRT1-catalysed deacetylation remain poorly understood.
The present study aimed to explore the role of SIRT1 as a critical regulator and to identify signalling pathways controlling IMF deposition in yaks. We found that, even though the N-terminus of yak SIRT1 is encoded by a sequence that is 500 bp shorter than that of cattle, this shorter protein also functions as a negative regulator during yak intramuscular preadipocyte (YIMA) differentiation (). Moreover, chromatin immunoprecipitation sequencing (ChIP-seq) of H3 lysine 4 acetylation (H3K4ac) and mRNA-sequence (mRNA-seq) data revealed that large-scale chromatin state and gene expression changes occur during SIRT1 overexpression, mediating the attenuation of YIMA lipid deposition. Taken together, our study provides evidence for the regulatory role of SIRT1 in yak IMF deposition through the comprehensive analysis of the global epigenetic changes mediated SIRT1. These establish a basis for further clarifying the molecular mechanisms of yak IMF deposition.
Materials and methods
Animals and cells
Seventeen four-year-old male Maiwa yaks of similar weight from the Sichuan Zoige Alpine Wetland Ecosystem National Observation and Research Station of Southwest Minzu University were used for SIRT1 expression analysis. Yaks were sacrificed for longissimus dorsi-, heart-, liver-, kidney-, lung-, adipose-, and rumen -tissue sample collection. Total RNA was extracted from yak tissues using the TRIzol reagent (Invitrogen, Carlsbad, CA, USA) according to the manufacturer’s protocol. The IMF content of longissimus dorsi tissue was determined according to the standard Soxhlet extraction method [Citation16].
YIMAs were isolated from three male Maiwa yaks, as per previously described protocols for purification and authentication [Citation30]. Briefly, one-year-old yaks were humanely sacrificed, whereafter the longissimus dorsi muscle tissue was immediately collected and washed with phosphate-buffered saline. All visible connective tissue was removed, and the residual tissue was minced into pieces of approximately 1 mm3. Thereafter, the tissue was subjected to 2 h of digestion at 37°C in a shaking water bath, with 2.5 mg/mL type-II collagenase as the digestion buffer (Sigma Aldrich, St Louis, MO, USA) followed by a wash in Hank’s balanced salt solutions buffer (Thermo Fisher Scientific, Waltham, MA, USA). The longissimus dorsi tissue digesta was centrifuged at 1,000 × g for 5 min, and the supernatants were passed through a sterile 40-µm filter to isolate digested cells. The cells were then rinsed with DMEM (Thermo Fisher Scientific) and subjected to centrifugation twice at 1,500 × g for 10 min. Thereafter, the cells were rinsed with basal medium and cultured in 5% CO2 at 37°C. The culture medium was changed 1 h after plating, and 3 mL of fresh media was added to each dish to remove myoblasts, insoluble myofibrillar proteins, and other insoluble debris, as preadipocytes attach much earlier than myoblasts. The culture growth medium contained 90% basal DMEM/F12 (1:1) medium, 10% foetal bovine serum, and 100 U/mL penicillin/streptomycin. After contact inhibition, cells were incubated in growth medium supplemented with 50 µM oleic acid to promote differentiation for 2 d, followed by further differentiation maintained in growth medium supplemented with 5 mg/mL insulin for 2 d, then changed every 2 d until cells were harvested.
Generation of recombinant adenoviruses
The SIRT1 gene was amplified using cDNA from the yak longissimus dorsi muscle tissue with the following primers: sense: 5’-CGCATGCGAGTTCTAGTGACTG-3’, antisense: 5’-CTGGTGGAACAATTTCTGTACCTG-3’. After bioinformatics analysis, the yak SIRT1 gene sequence was submitted to GenBank, with accession number MT475828.1. The SIRT1 coding sequence was cloned into a plasmid vector pAdEasy-EF1-MCS-3flag-CMV-EGFP, between the KpnI and XhoI restriction sites. All the adenoviruses were packaged by Hanbio Technology (Shanghai) Co., Ltd, Shanghai, China.
Reverse transcriptase-quantitative polymerase chain reaction (RT-qPCR)
Total RNA extraction from tissues and YIMAs was performed using TRIzol Reagent (Sigma-Aldrich) according to the manufacturer’s instructions. First, 500 ng of total RNA was purified using the genomic DNA eraser enzyme (Takara Bio, Dalian, China), followed by quality and integrity determination, whereafter cDNA was produced with the PrimeScript RT Reagent Kit (RR047A, Takara Bio). Next, all quantitative polymerase chain reaction (qPCR) experiments were conducted using the SYBR Premix Ex Taq kit (Takara Bio) on a LightCycler96 Real-Time PCR system (Roche, Munich, Germany), using the primers listed in . Next, the relative expression values were normalized to the level of Glyceraldehyde-3-phosphate dehydrogenase (GADPH) and ubiquitously expressed transcript (UXT) and calculated using the 2−ΔΔCt method. Finally, after amplification, the products were confirmed via the Sanger sequencing.
Table 1. Characteristics of primers used in RT-qPCR.
Oil Red O staining and cellular triacylglycerol assay
YIMAs were harvested, and subjected to the Oil Red O staining and cellular triacylglycerol (TAG) content determination as previously described for dairy goat mammary epithelial cells [Citation31]. Finally, the intracellular Oil Red O was extracted using isopropanol and quantified by measuring the optical absorbance at 510 nm.
ChIP assays and high-throughput sequencing
Cells were harvested after incubation with Ad-SIRT1 or Ad-green fluorescent protein (Ad-GFP) for 4 d, and ChIP assays were performed using H3K4ac (ab176799, Abcam, Cambridge, England) as previously described [Citation32], with little modifications. Briefly, cells were crosslinked with 1% formaldehyde (Roche) for 5 min, and crosslinking was stopped by adding 1 mL of 2 M glycine and incubating for 5 min at 20°C. Next, chromatin was sheared using Covaris M220 Focused-ultra-sonicator (Covaris, Woburn, MA, USA) to obtain DNA fragments of approximately 500 bp. Thereafter, 5 µg of H3K4ac antibody was used to pull down the tagged protein. The chromatin was then de-cross-linked overnight with proteinase K at 65°C, after which the DNA was purified using the MinElute PCR purification kit (Qiagen, Hilden, Germany). Subsequently, the libraries for high-throughput sequencing were constructed using an Illumina HiSeq 2500 sequencer in Novogene Biotech Co., Ltd. (Beijing, China). Two and three independent biological samples were used for ChIP-seq and mRNA-seq, respectively. Full read data were deposited at the National Center for Biotechnology Information (NCBI) Gene Expression Omnibus repository under accession number PRJNA852401.
ChIP-seq analysis
The ChIP-seq assays raw data were quality checked using fastqc(http://www.bioinformatics.babraham.ac.uk/projects/fastqc/). Reads were trimmed using fastp (version 0.19.11), quality checked again via fastqc (version V0.11.5), and mapped to the yak reference genome (BosGru v2.0) with the Burrows Wheeler Aligner programme (bwa v0.7.12.r1039) (Illumina, San Diego, CA, USA). Next, peaks were called using the model-based analysis of ChIP-seq (v2.1.0) peak caller with default parameters and an FDR cut-off of 0.05. Thereafter, the chromosome distribution, peak width, fold enrichment, significance level, and peak summit number per peak were recorded. Peak-related genes were then identified.
Homer finMotifsGenome.pl (v4.9.1) software was used to identify the sequence motifs on yak genomics binding with the ChIP-seq peaks. The peak summit position around the transcription start site (TSS) of genes can predict the protein and gene interaction sites. Therefore, the nearest TSS of every peak as well as the distance between peaks and TSSs were determined using Chipseeker. Furthermore, the distribution of peak summits on different functional regions, such as the 5’ untranslated region (UTR), protein-coding sequence (CDS), and 3’-UTR, was performed. The peak- related genes confirmed by Chipseeker were then subjected to Gene Ontology (GO) and Kyoto Encyclopaedia of Genes and Genome (KEGG) enrichment analyses via the GOseq R package and KOBAS (v3.0) software (Kobas Technologies Ltd., London, England). In addition, the differential peak analyses were based on the fold enrichment of peaks from different experiments. A peak was determined as differential when the odds ratio between two groups was greater than 2. Using the same method, genes associated with different peaks were identified, and the log2foldchange of genes was calculated using DESeq2 software with the default parameters, whereafter GO and KEGG enrichment analyses were conducted.
ChIP-qPCR assays
The immunoprecipitated DNA was quantified via qPCR with the following the real-time PCR primers: yak ACACA forward: 5’-CTCTCTCTTCTGGAGCGTGG-3’ and reverse: 5’- CGCCACAACTAGAGGGTCTG-3’; yak LPIN1 forward: 5’-CTGCTCAGGGCATTTTGCTC-3’ and reverse: 5’-GAACCGTAAGGACGGTGTCA-3’; yak PRDM16 forward: 5’- AGCGATTCTGGGGACCTCTG-3’ and reverse: 5’-TCTGCTTGAGAGTCGTGTCTG-3’; yak FOXN1 forward: 5’-TGAAGTCCCTCAGAGGCTCG-3’ and reverse: 5’- ACGCCACATTTAGCTTTGCC-3’; yak PPARD forward: 5’- GAGATGAGAGGCAAGGGTGG-3’ and reverse: 5’-TTTTCGAGCCCTAACCGTGG-3’. Fold enrichment was then calculated as: percentage input = 100*2(CTinput sample –CTimmunoprecipitation sample); CT = threshold cycle of PCR reaction, followed by normalization to indicated controls.
SIRT1 overexpression and mRNA-seq
YIMAs were harvested after incubation with Ad-SIRT1 or Ad-GFP for 2 d and subsequently sent to Novogene Biotech Co., Ltd. (Beijing, China) for transcriptome sequencing. The raw data processing as well as DEGs assays was performed refer to the previously study [Citation29]. The sequence raw data can be obtained at NCBI with the accession number PRJNA852863.
Statistical analyses
The data are presented as the mean ± standard error of mean (SEM). Differences between the means of the individual groups were assessed using a two-tailed Student’s t-test using SPSS 22.0 software (SPSS, Chicago, IL, USA) and were considered statistically significant at P < 0.05.
Results
Relationship between SIRT1 expression, IMF content, and key lipid metabolism genes
To the best of our knowledge, no information is available on the regulation of SIRT1 in yak IMF deposition. This prompted us to clone and analyse the CDS of SIRT1. To this end, a 1,738 bp fragment of the cDNA sequence containing 1,674 bp of the CDS, 71 bp of the 5’ franking sequence, and 37 bp of the 3’ franking sequence was amplified (). The detailed sequence information is available in GenBank under the accession number MT475828.1. Remarkably, the N-terminal of the CDS sequence of yak SIRT1 is 531 bp shorter than that in Bos taurus. To determine the distribution of SIRT1 in different yak tissues, total RNA was obtained from seven tissues of four-year-old yaks, whereafter RT-qPCR was performed. The results showed that SIRT1 is highly expressed in adipose and rumen tissues, moderately expressed in the longissimus dorsi muscle, liver, and kidneys, with low expression in the lungs and heart (). To investigate whether SIRT1 is involved in yak IMF deposition, we determined the relationship of SIRT1 expression with IMF content and key lipid metabolism gene. As depicted in , SIRT1 transcript levels were negatively correlated with IMF content (R = −0.627, P = 0.007, ), PPARγ expression (R = −0.530, P = 0.029, ), and fatty acid synthase expression (FASN, R = −0.781, P = 0.001, ). However, SIRT1 expression was positively correlated with genes related to fatty acid oxidation (carnitine palmitoyl transferase 1A, CPT1A, R = 0.799, P = 0.001, ; peroxisome proliferator-activated receptor gamma coactivator 1 alpha, PGC-1α, R = 0.691, P = 0.002, ). Expression analysis of SIRT1 in yak. (a) Cloning of the cDNA sequence of yak SIRT1. M: DNA Marker 3. (b) The mRNA expression level of SIRT1 in different tissues. (c-g)The correlation of SIRT1 expression and IMF content (c), PPARγ(d), FASN(e), CPT1A(f) and PGC-1α(g) expression in longissimus dorsi of yak. (h) SIRT1 expression during intramuscular adipogenesis. Values are presented as mean ± SEM. Different lowercase letters in figures indicate significant differences among different tissues or groups during intramuscular adipogenesis.
Figure 1. Expression analysis of SIRT1 in yak. (a) Cloning of the cDNA sequence of yak SIRT1. M: DNA Marker 3. (b) The mRNA expression level of SIRT1 in different tissues. (c-g)The correlation of SIRT1 expression and IMF content (c), PPARγ(d), FASN(e), CPT1A(f) and PGC-1α(g) expression in longissimus dorsi of yak. (h) SIRT1 expression during intramuscular adipogenesis. Values are presented as mean ± SEM. Different lowercase letters in figures indicate significant differences among different tissues or groups during intramuscular adipogenesis.
To better understand the potential role of SIRT1 during yak adipocyte differentiation, we monitored SIRT1 expression after adipogenic induction of YIMAs. We noted that SIRT1 transcripts decreased by approximately 50% after 48 h of induction, reaching a plateau ().
Overexpression of SIRT1 suppresses adipogenesis during YIMA differentiation
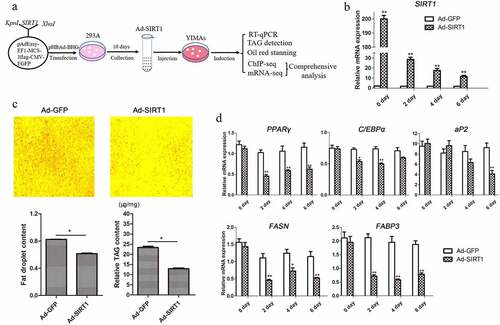
To further validate the function of SIRT1 in adipogenesis during YIMA differentiation, an adenovirus-mediated SIRT1 expression system was constructed (). RT-qPCR results showed a 200-fold increase of SIRT1 mRNA levels at day 0 of differentiation, which was 11-fold higher than that of the control until day 6 (). Overexpression of SIRT1 suppressed YIMA adipogenesis, as verified by the decreased amount of lipid droplet accumulation in Oil Red O staining and TAG content assays performed on day 4 (). Furthermore, we detected the expression of markers and adipogenesis-related genes during differentiation, with the results showing that PPARγ and cytosine-cytosine-adenosine-adenosine-thymidine enhancer-binding protein alpha (C/EBPα) were significantly downregulated during differentiation. A significant decrease in adipocyte lipid-binding protein (aP2) expression was detected only until day 6 (). In addition, the FASN and FABP3 genes, which play a key role in IMF deposition in cattle [Citation33], were significantly downregulated during differentiation (). Taken together, these results showed that overexpression of SIRT1 suppresses YIMA differentiation, suggesting that SIRT1 is a negative adipogenic regulator.
Figure 2. Overexpression of SIRT1 decreased yak intramuscular preadipocyte differentiation. (a) Outline of the experimental protocol. (b) SIRT1 expression level during differentiation after infection with Ad-GFP or Ad-SIRT1. (c) Oil Red O staining (magnification: 100×, upper panel) and quantitative assay (left lower panel), and TAG content determination (right lower panel) at day 4 after adipogenic induction. (d) PPARγ, C/EBPα, aP2, FASN and FABP3 expression profile during intramuscular adipogenesis after infection with Ad-GFP or Ad-SIRT1. Values are shown as mean ±SEM for at least three biological replicates and repeated three times (n = 9). * P < 0.05, ** P < 0.01.
Figure 2. Expression analysis of SIRT1 in yak. (a) Cloning of the cDNA sequence of yak SIRT1. M: DNA Marker 3. (b) The mRNA expression level of SIRT1 in different tissues. (c-g)The correlation of SIRT1 expression and IMF content (c), PPARγ(d), FASN(e), CPT1A(f) and PGC-1α(g) expression in longissimus dorsi of yak. (h) SIRT1 expression during intramuscular adipogenesis. Values are presented as mean ± SEM. Different lowercase letters in figures indicate significant differences among different tissues or groups during intramuscular adipogenesis.
Genome-wide changes underlying H3K4ac deacetylation by SIRT1 in differentiated YIMAs
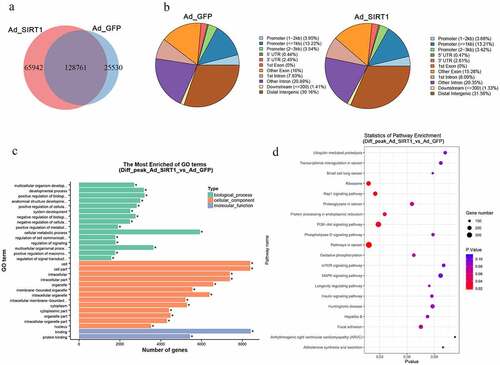
H3K4ac is one of the most intensively studied histone marks involved in transcriptional regulation and is a direct target of SIRT1 [Citation34,Citation35]. However, the understanding of genomic changes underlying H3K4 deacetylation by SIRT1 remains elusive. Therefore, we examined the genome-wide enrichment of H3K4ac in intramuscular preadipocytes after overexpression of SIRT1 and adipogenic differentiation at day 4. ChIP-seq experiments identified 220,233 peaks, with 194,703 identified after overexpression of SIRT1 and 154,291 peaks in the control group (). The genomic binding profile under SIRT1 overexpression and control conditions were very similar, with approximately 61% of binding occurring in gene deserts as well as intergenic regions and the remaining 39% occurring in promoter and gene body regions (). Compared with the control group, peak-related gene analysis revealed 20,163 genes whose expression changed significantly under SIRT1 overexpression (Table S1). Further evaluation of these differentially expressed genes (DEGs) revealed significant enrichment in GO terms associated with cellular metabolic process (GO:0044237), cell (GO:0005623), cell part (GO:0044464), binding (GO:0005488), and protein binding (GO:0005515) () as well as ribosome (bom03010), cancer pathway (bom05200), Rap1 signalling pathway (bom04015), PI3K-Akt signalling pathway (bom04151), and protein processing in endoplasmic reticulum (bom04141) pathway terms ( and Table S2).
Figure 3. Global function of H3K4ac in mediating SIRT1 action. (a) Venn diagrams showing the numbers of H3K4ac binding peaks in YIMAs chromatin infection with Ad-GFP or Ad-SIRT1. (b) Genomic distribution of H3K4ac binding peaks in the Ad-GFP or Ad-SIRT1 treated group. (c-d) GO annotation (c) and KEGG pathway enrichment (d) of the significantly peak-related genes. Only the top 30 enriched GO terms are presented here.
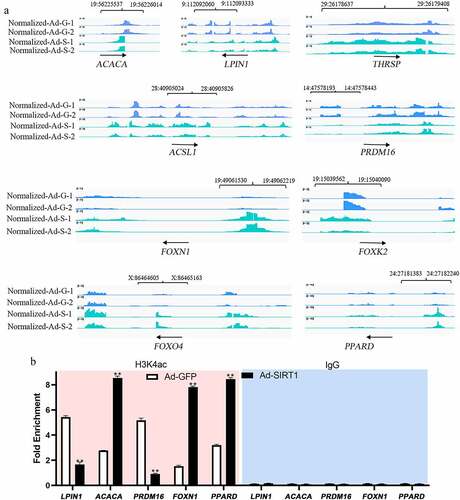
Further analysis of the ChIP-seq list of peak-related genes that were significantly altered between the two groups revealed several genes that are regulated as part of the lipid metabolism pathways. For example, the promoter region within 1 kb upstream of the TSS was significantly enriched in acetyl-CoA carboxylase alpha (ACACA), acyl-CoA synthetase long chain family member 1 (ACSL1), lipin 1 (LPIN1), and thyroid hormone responsive (THRSP1). The region within 1–2 kb upstream of the TSS was significantly enriched in PR domain-containing 16 (PRDM16), forkhead box K2 (FOXK2), and forkhead box N1 (FOXN1), while that, within 2–3 kb upstream was significantly enriched in peroxisome proliferator-activated receptor delta (PPARD) and forkhead box protein O4 (FOXO4) (). As shown in , the qChIP results were consistent with those from ChIP-seq, confirming that the identification of differential peak-related genes in this study was reliable.
Figure 4. ChIP-seq peaks for lipid metabolism related genes (a) and CHIP-qPCR was conducted to validate ChIP-seq results for selected targets (b). Data were presented as the mean and standard error of two biological replicates and repeated three times.
We sought to determine sequence motifs for DNA-binding proteins that were significantly enriched for H3K4ac after overexpression of SIRT1. The results revealed significant enrichment for 131 known motifs (Table S3 and S4), including binding motifs for known transcription factors, such as nuclear factor erythroid 2-related factor 1 (NRF1), E-box, SP1 transcription factor, BCL6 transcription repressor (Bcl6), retinoid X receptor gamma (RXRg). However, the analysis also revealed 31 highly enriched motifs exhibiting a close match to the consensus sequences for early growth response 1 (EGR1), NK3 homeobox 1 (NKX3.1), and peroxisome proliferator-activated receptor gamma, co-activator-related 1 (PPRC1). The biological relevance of those motifs has not been well described in lipid metabolism. We found that there were 5,640 EGR1, 2,217 PRDM1, and 15,704,612 PPRC1 motifs in 4,034, 2,023, and 196,917 regions enriched for H3K4ac, respectively. These regions were further associated with 380, 131, and 1,656,074 putative target genes, respectively ().
Table 2. De novo motif discovery by HOMER in SIRT1-responsive H3K4ac regions.
DEGs in differentiated YIMAs after SIRT1 overexpression
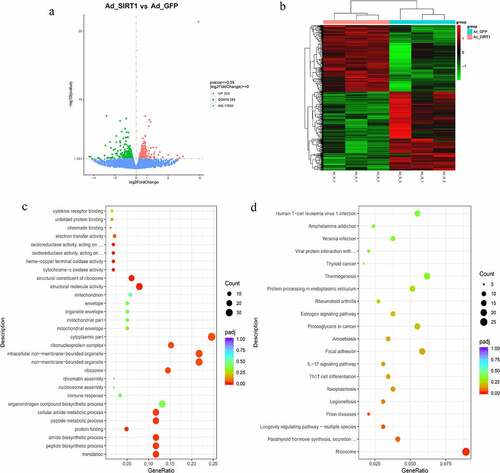
Under a series of strict criteria, 706 significantly DEGs, including 323 up-regulated and 383 down-regulated, were detected in the Ad-SIRT1 injection group relative to the Ad-GFP group (, Table S5–1). These DEGs, including SREBF1, INSIG1, FASN, and SCD, play significant roles in lipid metabolism as direct or indirect targets of SIRT1 (Table S5–1). GO and KEGG pathway enrichment analyses were carried out to identify the biological functions of DEGs using the yak reference genome. We obtained 17 enriched significant GO terms (, Table S5–2), including translation (GO:0006412), protein folding (GO:0006457), ribonucleoprotein complex (GO:1990904), and structural molecule activity (GO:0005198). KEGG pathway analysis revealed that these DEGs were significantly enriched in ribosome (bom03010) pathway (, Table S5-3). However, other pathways, such as Th17 cell differentiation (bom04659), focal adhesion (bom04510), insulin resistance (bom04931), fatty acid biosynthesis (bom00061), and Wnt signalling (bom04310), were not markedly enriched. Thus, SIRT1 may, at least in part, be involved in IMF deposition through the regulation of genes related to above-listed pathways.
Figure 5. The functional annotation of the differentially expressed mRNAs at day 4 after adipogenic induction. (a-b) The volcano map (a) and heatmap (b) of the differentially expressed mRNAs after infection with Ad-GFP or Ad-SIRT1. (c-d) The GO annotation(c) and KEGG pathway enrichment (d) of the differentially expressed mRNAs.
Combined analysis of ChIP-seq and mRNA-seq data
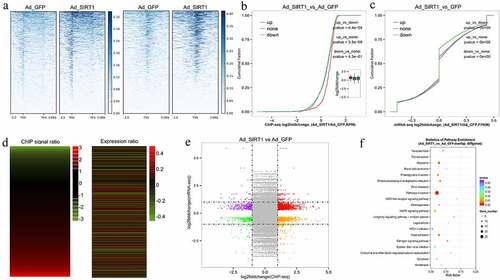
The ChIP-seq heatmap of all genes detected via mRNA-seq revealed that the signal densities on 3,000 bp upstream and downstream of TSS and gene body region were both significantly in the Ad-SIRT1 overexpression group compared with the control group (). The cumulative frequency of ChIP-seq signal density at the gene promoter (, left panel) and of the log2foldchange of peak-related genes (, right panel) reinforce the notion that expression changes were correlated with the H3K4ac modification ratio during differentiation (). In addition, upon SIRT1 overexpression (Table S6), 593 genes exhibited reduced acetylation (244 had reduced mRNA levels, 349 had increased levels), and 2,206 genes exhibited increased acetylation (682 had reduced mRNA levels, 1,524 had increased levels). Further analysis confirmed that there were 519 significant DEGs in common between ChIP-seq and mRNA-seq data (, Table S7–1). GO enrichment analysis revealed that the 519 DEGs were significantly enriched in 40 terms(Table S7–2), such as cytoplasm (GO:0005737), negative regulation of biosynthetic process (GO:0009890), and transcription factor binding (GO:0008134). Furthermore, KEGG pathway analysis revealed that the DEGs were significantly enriched in ribosomes (bom03010), Protein processing in endoplasmic reticulum (bom04141), and mitogen-activated protein kinase (MAPK) signalling pathway (bom04010) (, Table S7-3). Further analysis of the 519 DEGs revealed several genes that have been previously shown to be regulated during lipid metabolism, including mitogen-activated protein kinase1 (MAPK1), RXR-alpha (RXRA), 1-acylglycerol-3-phosphate O-acyltransferase 1 (AGPAT1), and hydroxyacyl-CoA dehydrogenase (HADH).
Figure 6. The comprehensive analysis of ChIP-seq and mRNA-seq data after infection with Ad-GFP or Ad-SIRT1. (a) The ChIP-seq heatmap of all genes. Left panel: the signal density of each 3,000 bp upstream of the transcription start site (TSS) and downstream of transcription ending site (TES). Right panel: the signal density of each 3,000 bp upstream and downstream of TSS. (b) Cumulative frequency of ChIP-seq signal of the DEGs (left panel) and FPKM of differential peak-related genes (right panel). (c) Heatmap of ChIP-seq signal and expression changes. Left panel is the heatmap of the log2foldchange of ChIP-seq RPM in the differential peak region, the right panel is the heatmap of the log2foldchange of the mRNA-seq FPKM of the differentially peak-related genes. (d) The H3K4ac modification level (left panel) is correlated with the gene expression level (right panel). (f) Distribution of genes with a significant change in both ChIP-seq and mRNA-seq. (g) The KEGG pathway enrichment of the DEGs in common in ChIP-seq and mRNA-seq.
Discussion
IMF content is among the most important determinants of meat quality characteristics, being positively correlated with tenderness, flavour, and juiciness. Yak meat is rich in nutrients but has a very low IMF content. The SIRT1 class III histone deacetylase plays a critical role in lipid metabolism by modulating the activity of transcription factors or cofactors through protein deacetylation [Citation36]. However, its local role in lipid metabolism, especially IMF metabolism in yaks, remains unclear. Previous studies revealed that mice with adipose tissue-specific SIRT1 deficiency exhibit increased fat mass, impaired glucose tolerance, and increased exosome secretion [Citation37]. Furthermore, transgenic mice overexpressing SIRT1 fed an atherogenic diet develop worse lipid profiles, in parallel to the deacetylation of transcription factor cAMP response element binding protein (CREB) [Citation38]. SIRT1 promotes the binding of FOXO1 to PPARγ and C/EBP protein by regulating FOXO1 deacetylation and then inhibits the transcriptional activity of PPARγ, leading to decreased hepatic lipid synthesis [Citation27]. Various studies have confirmed that SIRT1 acts as an upstream regulator for liver kinase B1 or AMP-activated protein kinase [Citation39], as well as sterol regulatory element-binding protein 1c signalling[Citation40]. Similarly, our findings showed that SIRT1 was negatively correlated with IMF content in the longissimus dorsi of yak, with its overexpression resulting in a significant down-regulation of adipocyte differentiation markers as well as lipid droplet formation. These results were further supported by the fact that SIRT1 overexpression decreased cellular TAG content during YIMAs differentiation. Interestingly, we found that although the N-terminal of the SIRT1 CDS sequence is 531 bp shorter than that in Bos taurus, it still functions as a negative regulator of lipid synthesis during IMF deposition in yaks. We speculate that the missing region within the N-terminal alters deacetylation activity without significantly changing its function. In addition, this difference in yak SIRT1 may be due to evolution during adaptation to the Qinghai-Tibet Plateau environment.
Epigenetic changes in histones H3 and H4 are well-known regulators of gene expression. While transcription factors serve as direct transcriptional activators, they may also be involved in the induction of epigenetic alterations within specific regions of the genome. Researchers performed ChIP-seq with SIRT1 and H4K16ac antibodies in cocaine-treated mouse coronal brains, revealing chronic cocaine use causes depletion of SIRT1 from most of the studied gene promoters, in concert with H4K16ac enrichment [Citation41]. H3K4ac is among SIRT1 targets in breast cancer [Citation35]. Unfortunately, we did not find a SIRT1 antibody suitable for ChIP in yaks. Therefore, we performed ChIP-seq with an H3K4ac antibody in order to analyse the mechanism through which SIRT1 regulates IMF deposition in the yak. Our analyses revealed that SIRT1 brings about genome-wide epigenetic alterations in YIMAs, which are correlated with differential gene expression. Furthermore, we identified enrichment of sequence motifs in H3K4ac regions showing changes in response to SIRT1 overexpression, among which were known motifs of transcription factors such as RXRg, PPRC1, and PRDM1, involved in lipid metabolism as well as new motifs, including NRF1, EGR1, and NKX3.1, whose role in lipid synthesis has not been clarified. NRF1 is a transcription factor that has been linked to mitochondrial regulation [Citation42]. The mitochondria are the key organelles for fatty acid β oxidation, and PGC-1α, a well-known coactivator of PPARγ, is also serves as a coactivator of NRF1 [Citation43]. Long protein isoforms of NRF1 negatively regulate PPARγ2 and acts as master regulators of adipogenesis, suppressing adipogenesis [Citation44]. Therefore, we speculate that NRF1 is implicated in IMF deposition through its influence on fatty acid β-oxidation via the regulation of lipid metabolism related genes (including PGC-1α and PPARγ) in the yak. EGR1 is a multifaceted transcription factor involved in browning and insulin resistance [Citation45,Citation46]. The browning of Egr1−/− mice was associated with an up-regulation of beige adipocyte-associated genes, such as uncoupling protein 1, CCAAT-enhancer-binding protein beta, cell death-inducing DFFA Like Effector A, and cytochrome c oxidase subunit 8B [Citation45,Citation47]. NK3 homeobox 1 (NKX3.1), an androgen-regulated prostate-specific transcription factor, has been reported to cause cell cycle arrest at G1/S phase via direct binding to the promoter of FOXO1 [Citation48]. FOXO1 is a crucial transcription factor involved in lipid metabolism [Citation49]. Combined with the present ChIP-seq data, we speculate that SIRT1 regulates these transcription factors to influence IMF deposition in the yak, with NRF1, EGR1, and NKX3.1 representing key potential bridges in this process. However, future work is needed to confirm this notion.
Through combined analysis with mRNA-seq data, we identified 519 common DEGs, which were enriched in various pathways, such as protein processing in endoplasmic reticulum and MAPK pathways. The endoplasmic reticulum is the site where at least one-third of cellular proteins and lipids are synthesized, folded, and transported [Citation50]. MAPK phosphorylates various enzymes and transcription factors to regulate diverse cellular processes, including apoptosis, differentiation and proliferation, as well as cellular lipid metabolism [Citation51,Citation52]. Studies have shown that MAPK is a key regulator of gene expression as well as of the phosphorylation of various factors related to lipogenesis, including PPARγ and C/EBPα[Citation53]. MAPK pathway inhibitor-treated bovine preadipocytes exhibited significant downregulation of FABP4, FASN, C/EBPα, and PPARγ, indicating the MAPK pathway plays an important role in mediating the effects of SIRT5 during preadipocyte differentiation [Citation54]. In addition, studies on the early stage of adipocyte differentiation revealed that after blocking MAPK/ERK signalling markedly reduced the number of lipid droplets in adipocytes in parallel to the downregulation of genes involved in lipid synthesis and adipocyte differentiation [Citation55]. As a key regulator of hepatic lipid metabolism, knockdown of MAPK1 was shown to promote liver steatosis in C57/B6J mice [Citation56]. RXRs are orphan receptors which can form homo- and heterodimers with various nuclear transcription factors to then regulate lipid metabolism, cholesterol homoeostasis, and inflammatory responses. RXR-α is a member of RXR family, which forms a heterodimer with PPARγ and can be activated by sterol. Single nucleotide polymorphism (SNP) previously revealed that SNP rs133517803 significantly affects back-fat thickness and total monounsaturated fatty acid content in cattle [Citation57]. HADH and AGPAT1 are enzymes involved in fatty acid β-oxidation and TAG synthesis, respectively [Citation58,Citation59]. The present finding indicated that MAPK1, RXRA, AGPAT1, and HADH are directly or indirectly involved in lipid metabolism, thus being potential targets of SIRT1 implicated in yak IMF deposition.
In conclusion, we demonstrated that SIRT1 negatively regulates IMF content in the longissimus dorsi muscle of yaks. Further, overexpression of SIRT1 in YIMAs negatively affected lipid differentiation marker expression, significantly reducing lipid droplets in adipocytes as well as TAG content. We identified three transcription factors (NRF1, NKX3.1, and EGR1) and four potential genes (MAPK1, RXRA, AGPAT1, and HADH) that may play a crucial role in SIRT1-mediated regulation of IMF deposition in yaks. To our knowledge, this is the first molecular characterization of SIRT1 in the regulation of yak IMF deposition. Nevertheless, several limitations of the present study should be noted. There is no yak SIRT1 antibody available for ChIP. Thus, we only analysed the genes downstream of SIRT1 using an H3K4ac antibody in order to evaluate epigenetic regulation. Further studies are necessary to elucidate the epigenetic regulation mechanism of SIRT1 during IMF deposition in yaks.
Institutional review board statement
All animal experiments were conducted according to the regulations for the Administration of Affairs Concerning Experimental Animals (Ministry of Science and Technology, China, revised in June 2004) and approved by the Institution Animal Care and Use Committee of the Southwest Minzu University (Permit number:S2020-013), Chengdu, China.
Supplemental Material
Download Zip (10.1 MB)Disclosure statement
No potential conflict of interest was reported by the author(s).
Data availability statement
The data related to this article can be obtained in the Supplementary materials, contact the author for other requirements.
Supplementary material
Supplemental data for this article can be accessed online at https://doi.org/10.1080/15592294.2022.2135194
Additional information
Funding
Related Research Data
References
- Liu Y, Lang Y, Bao G, et al. Comparison and analysis of nutrition characteristics for gannan yak meat and Chinese simmental meat. Chinese Sci Technol Food Ind. 2016;37(15):360–16.
- Yan Z. Evaluation on composition of amino acid and fatty acid of fresh yak meat. Chinese Qinghai Journal of Animal & Veterinary Sciences. 2015;45(2):20–22.
- Picard B, Gagaoua M, Aljammas M, et al. Beef tenderness and intramuscular fat proteomic biomarkers: muscle type effect. Peerj. 2018;6(6):e4891.
- Van LR, Stevens SG, Stalder KJ. The influence of ultimate ph and intramuscular fat content on pork tenderness and tenderization. J.Anim Sci. 2001;79(2):392–397.
- Chambaz A. Meat quality of angus, simmental, charolais and limousin steers compared at the same intramuscular fat content. Meat Sci. 2003;63(4):491–500.
- Hopkins DL, Hegarty RS, Walker PJ, et al. Relationship between animal age, intramuscular fat, cooking loss, ph, shear force and eating quality of aged meat from sheep. Aus J Exp Agr. 2006;46(7):879–884.
- Ashihara A, Gou Y, Imaeda N, et al. Investigation of factors affecting intramuscular fat accumulation in pigs-growth performance, carcass traits, lipid fractions in serum and adipose cell size and number. Nihon Chikusan Gakkaiho. 2008;79(79):227–234.
- Zhu Z, Gu C, Hu S, et al. Dietary n-carbamylglutamate supplementation enhances myofiber development and intramuscular fat deposition in growing-finishing pigs. Livest Sci. 2020;242(s1):104310.
- Huang Y, Gao S, Chen J, et al. Maternal butyrate supplementation induces insulin resistance associated with enhanced intramuscular fat deposition in the offspring. Oncotarget. 2016;8(8):13073.
- Zhou X, Liu Y, Zhang L, et al. Serine-to-glycine ratios in low-protein diets regulate intramuscular fat by affecting lipid metabolism and myofiber type transition in the skeletal muscle of growing-finishing pigs. Anim Nutr. 2021;7(2):384–392.
- Underwood KR, Tong J, Zhu MJ, et al. Relationship between kinase phosphorylation, muscle fiber typing, and glycogen accumulation in longissimus muscle of beef cattle with high and low intramuscular fat. J Agr Food Chem. 2007;55(23):9698–9703.
- S W, J J, E P, et al. Identification of genes related to intramuscular fat content of pig using genome-wide association study. Asian Austral J Anim. 2018;31(2):157–162.
- Hassen AT, Wilson DE, Rouse GH. Estimating heritability of percentage of intramuscular fat and ribeye area measures by scan session in angus bulls and heifers. Beef research report, Iowa State University. 2004.
- Wang L, Zhou ZY, Zhang T, et al. Irlnc: a novel functional noncoding RNA contributes to intramuscular fat deposition. BMC Genomics. 2021;22(1):95.
- Cui J, Chen W, Liu J, et al. Study on quantitative expression of PPARγ and ADRP in muscle and its association with intramuscular fat deposition of pig. SpringerPlus. 2016;5(1):1501.
- Guo Y, Guo X, Deng Y, et al. Effects of different rearing systems on intramuscular fat content, fatty acid composition, and lipid metabolism–related genes expression in breast and thigh muscles of nonghua ducks. Poultry Sci. 2020;99(10):4832–4844.
- Xiong Y, Xu Q, Lin S, et al. Knockdown of lxrα inhibits goat intramuscular preadipocyte differentiation. Int J Mol Sci. 2018;19(10):3037.
- Bionaz M, Loor JJ. Gene networks driving bovine milk fat synthesis during the lactation cycle. BMC Genomics. 2008;9(1):366.
- Yang X, Liu Q, Li Y, et al. The diabetes medication canagliflozin promotes mitochondrial remodelling of adipocyte via the AMPK-Sirt1-Pgc-1α signalling pathway. Adipocyte. 2020;9(1):484–494.
- M Q, Martínez-Grobas E, J F, et al. Hypothalamic Actions of SIRT1 and SIRT6 on energy balance. Int J Mol Sci. 2021;22(3):1430.
- Yu Q, Dong L, Li Y, et al. SIRT1 and HIF1α signaling in metabolism and immune responses. Cancer Lett. 2018;418:20–26.
- Bartoli-Leonard F, Wilkinson FL, Schiro A, et al. Loss of SIRT1 in diabetes accelerates DNA damage-induced vascular calcification. Cardiovasc Res. 2021;117(3):836–849.
- D’Onofrio N, Servillo L, Balestrieri ML. SIRT1 and SIRT6 signaling pathways in cardiovascular disease protection. Antioxid Redox Sign. 2018;28(8):711–732.
- Alves-Fernandes DK, Jasiulionis MG. The Role of SIRT1 on DNA Damage response and epigenetic alterations in cancer. Int J Mol Sci. 2019;20(13):3153.
- Sathyanarayan A, Mashek MT, Mashek DG. ATGL Promotes Autophagy/Lipophagy via SIRT1 to control hepatic lipid droplet catabolism. Cell Rep. 2017;19(1):1–9.
- Abdesselem H, Madani A, Hani A, et al. SIRT1 Limits Adipocyte Hyperplasia through c-Myc Inhibition. J Biol Chem. 2016;291(5):2119–2135.
- Picard F, Kurtev M, Chung N, et al. Sirt1 promotes fat mobilization in white adipocytes by repressing PPAR-gamma. Nature. 2004;429(6993):771–776.
- Y M, N H, A.y M, et al. SIRT1 promotes lipid metabolism and mitochondrial biogenesis in adipocytes and coordinates adipogenesis by targeting key enzymatic pathways. Sci Rep. 2021;11(1):8177.
- Wang H, Zhong J, Zhang C, et al. The whole-transcriptome landscape of muscle and adipose tissues reveals the ceRNA regulation network related to intramuscular fat deposition in yak. BMC Genomics. 2020;21(1):347.
- Jeong J, Kwon EG, Im SK, et al. Expression of fat deposition and fat removal genes is associated with intramuscular fat content in longissimus dorsi muscle of Korean cattle steers. J Anim Sci. 2012;90(6):2044–2053.
- Xu Q, Li Y, Lin S, et al. KLF4 inhibits the differentiation of goat intramuscular preadipocytes through targeting c/ebpβ directly. Front Genet. 2021;12:663759.
- He Q, Luo J, Wu J, et al. FoxO1 knockdown promotes fatty acid synthesis via modulating SREBP1 activities in the dairy goat mammary epithelial cells. J Agric Food Chem. 2020;68(43):12067–12078.
- Gaulton KJ, Nammo T, Pasquali L, et al. A map of open chromatin in human pancreatic islets. Nat Genet. 2010;42(3):255–259.
- Guillemette B, Drogaris P, Lin HH, et al. H3 lysine 4 is acetylated at active gene promoters and is regulated by H3 lysine 4 methylation. PLoS Genet. 2011;7(3):e1001354.
- K R, Judes G, Idrissou M, et al. SIRT1-dependent epigenetic regulation of H3 and H4 histone acetylation in human breast cancer. Oncotarget. 2018;9(55):30661–30678.
- Pillarisetti S. A review of Sirt1 and Sirt1 modulators in cardiovascular and metabolic diseases. Recent Pat Cardiovasc Drug Discov. 2008;3(3):156–164.
- F L, H L, X J, et al. Adipose-specific knockdown of Sirt1 results in obesity and insulin resistance by promoting exosomes release. Cell Cycle. 2019;18(17):2067–2082.
- Qiang L, Lin HV, Kim-Muller JY, et al. Proatherogenic abnormalities of lipid metabolism in SirT1 transgenic mice are mediated through Creb deacetylation. Cell Metab. 2011;14(6):758–767.
- Hou X, Xu S, Maitland-Toolan KA, et al. SIRT1 regulates hepatocyte lipid metabolism through activating AMP-activated protein kinase. J Biol Chem. 2008;283(29):20015–20026.
- Ponugoti B, Kim DH, Xiao Z, et al. SIRT1 deacetylates and inhibits SREBP-1C activity in regulation of hepatic lipid metabolism. J Biol Chem. 2010;285(44):33959–33970.
- Ferguson D, Shao N, Heller E, et al. SIRT1-FOXO3a regulate cocaine actions in the nucleus accumbens. J Neurosci. 2015 18;35(7):3100–3111.
- Digaleh H, Kiaei M, Khodagholi F. Nrf2 and Nrf1 signaling and ER stress crosstalk: implication for proteasomal degradation and autophagy. Cell Mol Life Sci. 2013;70(24):4681–4694.
- L L, Y L, J W, et al. Mitophagy receptor FUNDC1 is regulated by PGC-1α/NRF1 to fine tune mitochondrial homeostasis. EMBO Rep. 2021;22(3):e50629.
- Xue P, Hou Y, Zuo Z, et al. Long isoforms of NRF1 negatively regulate adipogenesis via suppression of PPARγ expression. Redox Biol. 2020;30:101414.
- Bléher M, Meshko B, Cacciapuoti I, et al. Egr1 loss-of-function promotes beige adipocyte differentiation and activation specifically in inguinal subcutaneous white adipose tissue. Sci Rep. 2020;10(1):15842.
- Mohtar O, Ozdemir C, Roy D, et al. Egr1 mediates the effect of insulin on leptin transcription in adipocytes. J Biol Chem. 2019;294(15):5784–5789.
- Milet C, Bléher M, Allbright K, et al. Egr1 deficiency induces browning of inguinal subcutaneous white adipose tissue in mice. Sci Rep. 2017;7(1):16153.
- Jiang J, Liu Z, Ge C, et al. NK3 homeobox 1 (NKX3.1) up-regulates forkhead box O1 expression in hepatocellular carcinoma and thereby suppresses tumor proliferation and invasion. J Biol Chem. 2017;292(47):19146–19159.
- Ioannilli L, Ciccarone F, Ciriolo MR. Adipose tissue and FoxO1: bridging physiology and mechanisms. Cells. 2020;9(4):849.
- M W, Kaufman RJ. Protein misfolding in the endoplasmic reticulum as a conduit to human disease. Nature. 2016;529(7586):326–335.
- Sun Y, Liu WZ, Liu T, et al. Signaling pathway of MAPK/ERK in cell proliferation, differentiation, migration, senescence and apoptosis. J Recept Signal Transduct Res. 2015;35(6):600–604.
- N L, M S, Atilla-Gokcumen GE. The Role of p38 MAPK in Triacylglycerol Accumulation during Apoptosis. Proteomics. 2019;19(13):e1900160.
- D P, B.h P, Davis KE, et al. Activation of MEK/ERK signaling promotes adipogenesis by enhancing peroxisome proliferator-activated receptor gamma (PPARgamma) and C/EBPalpha gene expression during the differentiation of 3T3-L1 preadipocytes. J Biol Chem. 2002;277(48):46226–46232.
- Hong J, Mei C, Raza S, et al. SIRT5 inhibits bovine preadipocyte differentiation and lipid deposition by activating AMPK and repressing MAPK signal pathways. Genomics. 2020;112(2):1065–1076.
- Bost F, Aouadi M, Caron L, et al. The extracellular signal-regulated kinase isoform ERK1 is specifically required for in vitro and in vivo adipogenesis. Diabetes. 2005;54(2):402–411.
- Xiao Y, Liu H, Yu J, et al. MAPK1/3 regulate hepatic lipid metabolism via ATG7-dependent autophagy. Autophagy. 2016;12(3):592–593.
- Goszczynski DE, Mazzucco JP, Ripoli MV, et al. Genetic characterisation of PPARG, CEBPA and RXRA, and their influence on meat quality traits in cattle. J Anim Sci Technol. 2016;58:14.
- Furuhashi M, Ura N, Murakami H, et al. Fenofibrate improves insulin sensitivity in connection with intramuscular lipid content, muscle fatty acid-binding protein, and beta-oxidation in skeletal muscle. J Endocrinol. 2002;174(2):321–329.
- R.a C, Lee DP. Enzymes of triacylglycerol synthesis and their regulation. Prog Lipid Res. 2004;43(2):134–176.