
 ?Mathematical formulae have been encoded as MathML and are displayed in this HTML version using MathJax in order to improve their display. Uncheck the box to turn MathJax off. This feature requires Javascript. Click on a formula to zoom.
ABSTRACT
DNA methylation (DNAm) plays a crucial role in a number of complex diseases. However, the reliability of DNAm levels measured using Illumina arrays varies across different probes. Previous research primarily assessed probe reliability by comparing duplicate samples between the 450k-450k or 450k-EPIC platforms, with limited investigations on Illumina EPIC v1.0 arrays. We conducted a comprehensive assessment of the EPIC v1.0 array probe reliability using 69 blood DNA samples, each measured twice, generated by the Alzheimer’s Disease Neuroimaging Initiative study. We observed higher reliability in probes with average methylation beta values of 0.2 to 0.8, and lower reliability in type I probes or those within the promoter and CpG island regions. Importantly, we found that probe reliability has significant implications in the analyses of Epigenome-wide Association Studies (EWAS). Higher reliability is associated with more consistent effect sizes in different studies, the identification of differentially methylated regions (DMRs) and methylation quantitative trait locus (mQTLs), and significant correlations with downstream gene expression. Moreover, blood DNAm measurements obtained from probes with higher reliability are more likely to show concordance with brain DNAm measurements. Our findings, which provide crucial reliability information for probes on the EPIC v1.0 array, will serve as a valuable resource for future DNAm studies.
Introduction
DNA methylation (DNAm) is a widely studied epigenetic mechanism characterized by the addition or removal of a methyl group at the 5th position of cytosine [Citation1]. Alterations in DNAm levels have been implicated in many diseases, such as Alzheimer’s disease [Citation2–6]. Methylated DNA is relatively stable and can be easily detected; thus, it is a viable source of biomarkers [Citation7]. Although whole-genome bisulphite sequencing and long-read platforms are still too costly for large-scale epidemiological studies, array-based technologies offer a cost-effective and comprehensive approach to measure DNAm profiles on a genome-wide scale. The Illumina Infinium Human Methylation 450 BeadChip and its updated version, the Infinium MethylationEPIC version 1.0 BeadChip, provide probes that target over 485,000 and 850,000 CpG sites per sample, respectively [Citation8,Citation9]. Most recently, the newly developed Infinium MethylationEPIC version 2.0 contains more than 900,000 CpG probes covering the human genome.
Several studies examined the reliability (i.e., reproducibility) of DNAm levels from the same DNA samples measured twice using Illumina arrays, and found that probe reliability varies across different probes [Citation10–15]. However, most previous studies have compared duplicate samples between the 450k-450k or 450k-EPIC platforms, and there is a lack of larger studies on EPIC-EPIC comparisons (Supplementary Table S1).
To address this critical gap and assess the reliability of blood DNAm levels measured using EPIC arrays, we conducted an analysis of 69 blood DNA samples, each measured twice, generated by the Alzheimer’s Disease Neuroimaging Initiative (ADNI) study [Citation16]. We compared the magnitudes and patterns of reliability observed in the EPIC-EPIC comparison with findings from previous studies. Our study aimed to provide valuable insights into the reliability of blood DNAm levels measured by EPIC v1.0 arrays. In addition, we evaluated the impact of probe reliability on epigenome-wide association studies (EWAS). Higher reliability of methylation levels increases the likelihood of reproducible findings, which are essential for the development of biomarkers or identifying actionable targets. Our study provides a valuable resource for future DNA methylation studies.
Materials and methods
Study dataset
We analysed a subset of whole-blood DNAm samples generated by the Alzheimer’s Disease Neuroimaging Initiative (ADNI) study [Citation16], in which the same blood samples were measured twice (technical replications). To create a dataset of samples from independent subjects, we selected the initial visit data for each subject from the longitudinal ADNI study. Our study included 138 samples measured on 69 independent subjects aged 65–94 years during their initial visits. To avoid confounding batch effects (see also Discussion), only duplicates measured on different methylation plates were analysed. The ADNI study datasets can be accessed at adni.loni.usc.edu.
Preprocessing of DNA methylation data
DNA methylation was measured using the Illumina HumanMethylation EPIC v1.0 BeadChip, which includes more than 850,000 CpGs. We preprocessed the DNAm data using the SeSAMe 2 pipeline described by Welsh et al. (2023) [Citation17]. Supplementary Table S2 shows the number of CpGs at each pre-processing step. Throughout these preprocessing steps, we retained all the samples.
First, we removed CpGs that overlapped with single nucleotide polymorphisms (SNPs), non-CpG probes, cross-reactive probes [Citation18], and probes located on X or Y chromosomes. Samples and probes were further filtered using the iterative Greedy-cut algorithm (with a p-value threshold of 0.01) in the RnBeads R package, which iteratively removes the probe with the highest fraction of unreliable measurements one at a time [Citation19]. Next, using the SeSAMe R package, we removed additional probes that had missing values in more than 5% of samples or were masked by the pOOBAH (p-value with out-of-band array hybridization) algorithm in more than 20% of samples; and performed a noob (normal-exponential using out-of-band probes) background correction and nonlinear dye-bias correction [Citation20].
Estimation of probe reliability and surrogate variables
To estimate the reliability of CpG probes, we computed intraclass correlations (ICCs) for each probe based on methylation beta values, which were measured in duplicates of blood samples collected from the same subject and at the same visit. The ICC is defined as , where
is the between-subject variance and
is the within-subject variance. As recommended by Koo and Li (2016) [Citation21], ICC values were computed using a two-way random effect, absolute agreement, and single-rating model, as implemented in the icc() function of the irr R package.
To evaluate the reliability of the estimated cell-type proportions, we computed major immune cell-type proportions in the blood, including B lymphocytes, natural killer cells, CD4+ T lymphocytes, CD8+ T lymphocytes, monocytes, neutrophils, and eosinophils using the EpiDISH R package [Citation22]. The coefficients for DNA methylation-based surrogate variables for BMI, smoking, alcohol use, total cholesterol, HDL cholesterol, LDL cholesterol, and total-to-HDL ratio were obtained from Additional file 1 in McCartney et al. (2018) [Citation23].
Comparison of reliability of probes with different characteristics
To compare the reliability of probes with different characteristics (e.g., type I probes vs. type II probes), we performed mixed-effects model analyses using the lmerTest R package [Citation24]. For each comparison, we fitted a mixed-effects model with probe reliability as the outcome variable and probe characteristics (e.g., type I vs. type II probes) as the fixed effect variable. To account for correlations in the probes on the EPIC v1.0 array, we additionally included random effects for chromosomes, genes, and co-methylated clusters. The co-methylated clusters of probes were identified using the coMethDMR R package [Citation25] with methylation beta values as input. As both fixed and random effects are included, these models fall into the general class of linear mixed-effects models. By including random effects, the mixed-effects model acknowledges that the observations (i.e., probes) within the same random effect (i.e., chromosomes, genes, or co-methylated clusters) are more similar to each other than to observations from different groups or clusters. This allows for a more accurate estimation of the fixed effects, while properly accounting for the correlation structure of the data. We also assessed the relationship between reliability and the mean and standard deviation of the methylation beta values. The means of beta values were computed using all samples, and the standard deviations of beta values were computed after randomly selecting one sample from two duplicate samples. A total of 22 statistical tests were performed in this study, therefore, we considered P-values less than 2.27 × 10⁻³ (i.e., 0.05/22) as statistically significant.
Evaluating the impact of probe reliability on mQTL analysis, DNAm-to-gene expression correlations, and surrogate variables
We searched mQTLs for CpG probes using the GoDMC database [Citation26], which was downloaded from http://mqtldb.godmc.org.uk/downloads. To select significant blood mQTLs in GoDMC, we used the same criteria as in the original study [Citation27], that is, considering a cis p-value smaller than 10−8 and a trans p-value smaller than 10−14 as significant. For DNAm-to-mRNA association analysis, we analysed matched gene expression (Affymetrix Human Genome U 219 array) and DNA methylation (EPIC v1.0 array) data from 263 independent subjects in the ADNI study. In this analysis, we examined probes located in promoter regions (within ±2k bp of the transcription start site; TSS) and distal regions (> ±2k bp of the TSS) separately. Specifically, for CpGs located in the promoter region, we computed Spearman correlations between CpG methylation and expression levels of the target genes. On the other hand, for CpGs in distal regions, we computed the Spearman correlations between CpG methylation and expression levels of 10 genes upstream and downstream, following the approach used in previous integrative DNAm-to-gene expression analyses for probes in distal regions [Citation28,Citation29]. Subsequently, we selected the most significant P-value for each probe and considered P-values less than 1 10−5 to be statistically significant, as in several previous analyses of DNA methylation in blood samples [Citation5,Citation16,Citation30].
Results
Probe reliability of EPIC v1.0 arrays
The estimated ICCs for individual probes are available in Sugden et al. (2020) [Citation15], Logue et al. (2017) [Citation12], and Bose et al. (2014) [Citation10] (Supplementary Table S1). Therefore, we first compared the distributions of the ICCs in our EPIC-EPIC comparison with results from these studies. Overall, we found a substantial correlation between the ICC values estimated in our EPIC-EPIC comparison and those estimated in previous studies. The Spearman correlations between the ICC values estimated in our study and those from Sugden et al. (2020) [Citation15], Logue et al. (2017) [Citation12], and Bose et al. (2014) [Citation10] were 0.703, 0.724, and 0.729, respectively. Consistent with previous studies [Citation14,Citation15], we observed similar ICC estimates when using either methylation M-values or methylation beta values (data not shown).
shows the distribution of ICCs for probes in our EPIC-EPIC comparison, which ranged from −0.362 to 0.999. Consistent with findings in a previous reliability study [Citation10], our analysis revealed two distinct clusters of probes. These clusters are centred around 0.025 and 0.825, corresponding to probes with low and high reliability, respectively. The ICC values are generally interpreted as follows: < 0.4 (Poor), 0.4–0.6 (Fair), 0.6–0.75 (Good), and > 0.75 (Excellent) [Citation31]. The mean and median of the EPIC-EPIC comparison were 0.381 and 0.325, respectively. In comparison, Sugden et al. (2020) found the estimated ICCs for the 450k-EPIC comparison ranged from −0.28 to 1.00, with a mean of 0.21 and a median of 0.09 [Citation15]. A comparison of the 333,588 common probes in both studies showed that a larger number of probes achieved good reliability (n = 38,528) and excellent reliability (n = 64,141) in our EPIC-EPIC comparison study compared to the 450k-EPIC comparison in Sugden et al. (2020) study (good reliability: n = 21,936, excellent reliability: n = 18,865) (Supplementary Table S3). Overall, 214,951 probes (64.44%) had the same classification in both the studies.
Figure 1. Distribution of estimated intraclass correlation coefficient (ICC) of DNA methylation levels in EPIC-EPIC comparison, using 69 blood DNA samples, each measured twice, generated by the Alzheimer’s disease neuroimaging initiative study. Dashed lines indicate mode of the distribution.
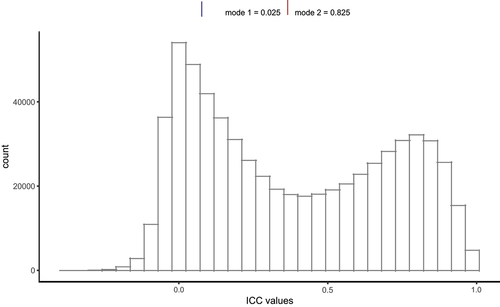
In the 450k–450k comparison estimated by Bose et al. (2014), ICCs ranged from 0 to 0.998, with a mean of 0.366 and a median of 0.296 [Citation10]. When comparing the 333,600 common probes in both studies, we found a larger total number of probes with good or excellent reliability (good probes: n = 38,528, excellent probes: n = 64,144) in our EPIC-EPIC comparison compared to the 450k-450k comparison in the Bose et al. (2014) study (good probes: n = 49,008, excellent probes: n = 40,001). Overall, 226,289 (67.83%) probes had the same classification in both the studies (Supplementary Table S4). Taken together, these results showed that, for the majority of probes, the reliability observed in our EPIC-EPIC comparison was congruent with those in prior studies.
The distribution of ICC in the EPIC-EPIC comparison shows similar patterns as those obtained in prior studies
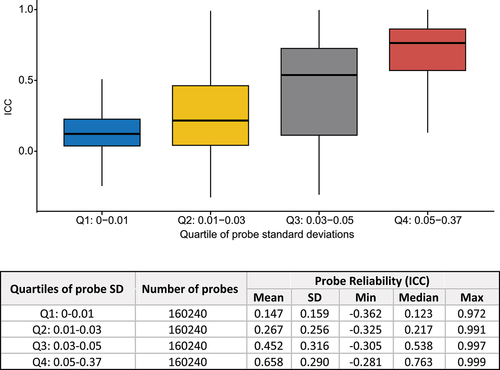
We found that the distribution of ICC values in our EPIC-EPIC comparison showed patterns similar to those of previous comparisons [Citation10–15]. Specifically, we observed that ICC values increased as the between-subject variance of DNA methylation levels increased (). The highest ICCs values were observed for probes with average methylation values ranging between 0.2 and 0.8 (Supplementary Figure S1). Overall, the ICC values were lower for probes located in the CpG island and TSS200 regions (Supplementary Figures S2-3). Type II probes on the EPIC v1.0 array, which use a single sequence per CpG site to measure DNAm levels, showed significantly higher ICC values than type I probes, which use two separate sequences per CpG site (p-value < 2.2 × 10⁻¹⁶, Supplementary Figure S4). Given that a substantial proportion of type I probes are located in CpG-rich regions, such as CpG islands and promoter regions [Citation9,Citation32], this result is consistent with the observed lower ICC values at CpG islands and promoter regions.
Figure 2. Probe reliability (ICC) increased as standard deviation (SD) of DNA methylation levels increased.
In the following sections, we will assess the impact of probe reliability, as measured by ICC, in relation to different types of analyses in epigenome-wide association studies (EWAS).
Higher probe reliability is associated with the presence of mQTLs and significant correlations with downstream gene expression
We hypothesized that probe reliability might affect the effectiveness of integrative analyses that correlate DNAm with other types of omics variants, such as mQTLs or downstream gene expression. Methylation Quantitative Trait Locus (mQTLs) refers to genetic variations that influence the patterns of DNAm. Min et al. (2021) performed a large mQTL study involving 32,851 subjects and found that approximately 45% of DNAm sites on the Illumina array were influenced by genetic variants [Citation26]. Supplementary Figure S5 shows that consistent with previous observations [Citation15], CpG probes with mQTLs have significantly higher reliability (p-value < 2.2 × 10⁻¹⁶). Specifically, CpG probes influenced by mQTLs had a median ICC of 0.625 compared to the other CpGs with a median ICC of 0.257.
Similarly, as DNAm is a key epigenetic modification that influences gene activity by regulating gene expression, we next investigated the impact of probe reliability on DNAm-to-mRNA correlations in blood samples. In this analysis, we examined probes located in promoter regions (within ±2k bp of the transcription start site; TSS) and distal regions (> ±2k bp of the TSS) separately. For both groups of probes, we found that the ICCs were higher for those probes significantly associated with downstream gene expression levels compared to other probes (p-value = 2.51 × 10⁻⁵ for promoter region probes and p-value = 1.55 × 10⁻¹⁰ for distal probes; Supplementary Figure S6). These findings highlight the importance of considering probe reliability in EWAS and its potential implications for understanding the relationship between DNAm, genetic variation, and gene expression.
Higher probe reliability is associated with larger blood-brain DNAm correlations
For neurological disorders, such as AD, it is preferable to use disease-relevant tissues for epigenetic studies. However, obtaining methylation levels in brain tissue from living human subjects is currently not feasible. As a practical alternative, measuring methylation levels in accessible tissues, such as the blood, is often employed. Previous research by Hannon et al. (2015) examined matched DNAm profiles of pre-mortem blood samples and post-mortem brain tissues in the London dataset and found that only a small proportion of CpGs showed significant brain-blood correlations in DNAm levels [Citation33].
To assess the impact of probe reliability on cross-tissue associations, we examined ICCs for the probes in relation to the correlation of DNAm measured in the brain prefrontal cortex and blood in the London dataset [Citation33]. Supplementary Figure S7 demonstrates that probes with higher brain-blood correlations in DNAm levels also had higher reliability. Specifically, for probes with high (> 0.75), medium (0.4–0.75), and low (< 0.4) brain-blood correlations, the median ICCs were 0.948, 0.869, and 0.253, respectively. These results are consistent with another recent study, which found an increase in reliability estimates in the 450k-EPIC comparison [Citation15] for probes with moderate to high brain-blood correlations. These findings suggest that reliable probes, by providing more accurate representations of DNAm levels, could facilitate the identification of potential biomarkers in brain disorders, such as dementia.
Higher probe reliability is associated with more consistent association signals
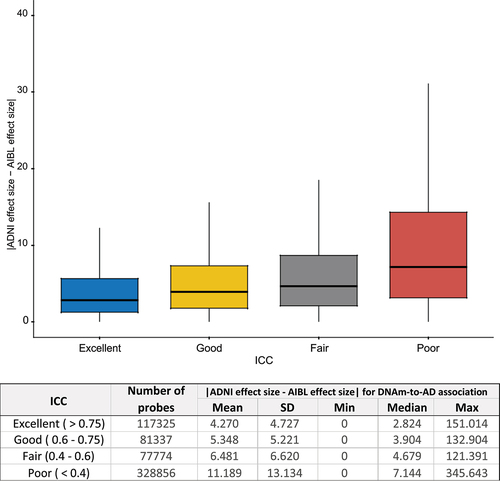
A previous study by Sugden et al. (2020) analysed the effect of tobacco smoking on DNAm across 22 studies and observed that the number of replications of individual probes across studies positively correlated with reliability [Citation15]. We previously conducted a study on DNAm associated with Alzheimer’s disease diagnosis using two large clinical datasets generated by the ADNI and Australian Imaging, Biomarkers, and Lifestyle (AIBL) consortia. We hypothesized that poor probe reliability would impact the consistency of the DNAm-to-AD associations estimated in the ADNI and AIBL datasets. Indeed, we found that the differences in estimated effect sizes for DNAm-to-AD associations between the two studies were smallest for probes with excellent reliability (ICC > 0.75) and largest for probes with poor reliability (ICC <0.4) (). Furthermore, we also analysed the results of our sex-specific study in AD [Citation34] and found that the pattern of association between probe reliability and consistency in estimated effect sizes was similar for both males and females (Supplementary Figure S8).
Figure 3. Higher probe reliability (ICC) is associated with smaller absolute difference in the estimated effect sizes of DNAm-to-AD diagnosis associations in ADNI and AIBL studies (p < 2.2 × 10⁻¹⁶). The effect sizes for DNAm-to-AD associations were obtained from Silva et al. (2022) (PMID: 35982059). Reliability of the probes were determined based on ICC: excellent (>0.75), good (0.6–0.75), fair (0.4–0.6), or poor (<0.4). AD: Alzheimer’s disease.
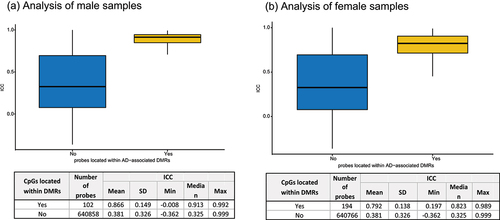
Biologically, DNAm levels are often correlated across the genome and occur as a regional phenomenon [Citation35]. Differentially methylated regions (DMRs) refer to specific regions in the genome where the levels of DNAm consistently and significantly differ between different conditions. We also considered the impact of probe reliability on DMR identification. Interestingly, as shown in , we found that probes located within DMRs associated with AD [Citation34] exhibited higher ICCs than other probes (p-value < 2.2 × 10⁻¹⁶ for both male and female samples analyses). These findings highlight the importance of probe reliability in studying DNAm associations, as reliable probes help to minimize discrepancies between different datasets and lead to more consistent results. Therefore, probe reliability is crucial for detecting genuine DNAm associations in EWAS.
Figure 4. CpGs probes located within DMRs had higher probe reliability (ICC) compared to other probes in the analysis of (a) Male samples and (b) Female samples (p < 2.2 × 10⁻¹⁶ for both comparisons). The AD-associated DMRs were obtained from table 2 of Silva et al. (2022) (PMID: 36109771).
DNA methylation surrogate variables for cell-type proportions, smoking, alcohol use, and total cholesterol are reliable
In EWAS, one common approach for accounting for cell-type heterogeneity across different samples is to estimate the proportions of various cell types within each sample. These estimated cell-type proportions were then included as covariates in the regression models. We assessed the reliability of these estimated cell-type proportions and found that they showed good agreement between duplicate samples (Supplementary Table S5). Specifically, the ICC ranged from 0.752 to 0.956 across the different cell types. Notably, the proportions of NK (Natural Killer) cells and B cells were observed to have the lowest and highest reliabilities, respectively. These results are consistent with a previous study that examined DNAm levels in newborn and 14-year-old samples, which reported a high correlation in estimated cell-type proportions between duplicate samples [Citation13].
In addition, we also assessed the reliability of various additional DNA methylation-based surrogate variables (SVs). Supplementary Figure S9 shows the SVs for smoking, alcohol use, and total cholesterol had good reliability (95% CI for ICC > 0.6), while SVs for BMI, HDL cholesterol, LDL cholesterol, total-to-HDL ratio had lower reliability (95% CI for ICC < 0.6). Previously, McCartney et al. (2018) also demonstrated that DNAm-based SV for smoking accurately predicts smoking status (AUC = 0.98) [Citation23]. Taken together, these findings provide strong support for using cell-type proportions to adjust for cell-type heterogeneity and the adoption of epigenetic surrogate variables, particularly for smoking, in EWAS.
Discussion
In this study, we comprehensively evaluated the reliability of probes on Illumina EPIC v1.0 arrays and created a valuable resource for EWAS studies (Supplementary Table S6). We carefully selected DNAm samples from the ADNI dataset. To avoid batch effects and ensure accurate assessment of probe reliability, we included duplicate samples that were placed on different methylation plates within the ADNI dataset.
Our results are consistent with existing literature that indicated a trend towards higher reliability in EPIC v1.0 arrays compared to the older 450k arrays [Citation15]. However, it is important to note that the reliability estimates in previous studies were drawn from literature results rather than directly comparing reliability experiment results for 450k-450k arrays vs. EPIC-EPIC arrays using the same set of samples. Therefore, differences in sample quality, experimental conditions, and laboratory practices can significantly impact reliability outcomes.
Several additional factors could potentially account for the higher reliability estimates observed in our EPIC-EPIC comparisons. First, compared to the 450k arrays, the EPIC v1.0 arrays included a significantly larger number of type II probes [Citation9], which tend to have higher reliability than type I probes (Supplementary Figure S4). Additionally, during the design of EPIC v1.0 arrays, some probes from the 450k arrays that were found to be unreliable were removed [Citation9,Citation36].
During our preprocessing step, we incorporated the pOOBAH algorithm (p-value with Out-Of-Band Array Hybridization) in the SeSAMe R package. This step specifically identifies and removes probes with hybridization issues [Citation20]. Therefore, low reliability is unlikely to be attributed to failed probe hybridization with the target DNA, as previously demonstrated [Citation15]. However, an important factor that might impact reliability estimates is batch effects [Citation10]. Notably, when we calculated the reliability using duplicated samples placed on the same methylation plate, we observed an increase in the median ICC for the EPIC-EPIC comparison from 0.325 to 0.733. This highlights the impact of the batch effect on reliability estimates and emphasizes the importance of accounting for batch effects in methylation studies.
Consistent with previous studies, we observed that the reliability of the probes was influenced by the mean and variance of methylation levels as measured by beta values [Citation14,Citation37,Citation38]. To understand the dependency of ICC on DNAm variances, note that ICC is defined by where
and
are between-subject and within-subject variances, respectively. Therefore, ICC is influenced by between-subject variances of the probes, and probes with low variation in methylation levels, corresponding to low between-subject variance, would result in low ICC values.
It is well known that the mean and variance of methylation beta values follow an inverse U relationship. If we consider the beta value as the proportion (p) of methylated cells in a large population of cells, the mean-variance relationship of beta values is consistent with the theory that for a binomial proportion p, the variance , where n is the total number of cells, is the highest when p is 0.5. Therefore, between-subject variance peaks around a mean beta value of 0.5, and is lower for probes with the lowest and highest beta values [Citation15].
Consequently, probes with extremely low or high average beta values have lower variances and are more likely to be classified as unreliable than probes with intermediate beta values. Notably, technical variation, which includes errors introduced during the process of methylation measurement (e.g., bisulphite conversion efficiency, PCR biases), tends to be random. This randomness can disproportionately affect the extremes (i.e., hypo-methylated sites close to 0% methylation and hyper-methylated sites close to 100% methylation) where biological variation is low. On the other hand, at sites with intermediate methylation levels, there’s a mix of both methylated and unmethylated cytosines, so the technical noise might be diluted or less impactful in the context of the overall biological signal. Consistent with previous observations by Xu and Taylor (2013) [Citation14], we also found that among probes with very low or high average methylation beta values (below 0.1 or above 0.9), only a small portion (14.12% or 52,471 out of 371,531 probes) were classified as having good or excellent reliability (i.e., ICC > 0.6). In contrast, for probes with intermediate average methylation beta values, a significantly higher proportion (58.5% or 157,617 out of 269,429 probes) was classified as having good or excellent reliability. These results are consistent with our observation of lower ICC values in the TSS and CpG island regions, which are evolutionarily conserved in gene regulation [Citation39].
We next studied the implications of probe reliability in the EWAS, and our findings highlight its significant impact on downstream analyses. Consistent with observations in previous studies [Citation10,Citation15], our analyses also revealed that probe reliability plays a crucial role in the success of integrative analyses involving DNAm and other types of omics data, such as mQTLs and mRNA gene expression. Furthermore, we observed that blood DNAm measurements obtained using probes with higher reliability were more likely to show concordance with brain DNAm. Finally, we demonstrated that higher reliability is associated with more consistent effect sizes and the identification of DMRs in EWAS. This is likely because methylation signals from unreliable probes can be contaminated with noise, thereby increasing the likelihood of generating false positives. Our results are consistent with the results of Dugue et al. (2015) [Citation40], who examined the impact of the ICC on EWAS power. They found that probe reliability significantly affects the statistical power for detecting differential methylation, with probes having lower ICC also had reduced power.
We found that surrogate variables (SVs) for cell-type proportions demonstrated excellent reliability across all major immune cell types in the blood, supporting the use of estimated cell-type proportions in addressing cell-type heterogeneity in EWAS. Similarly, our analysis of various additional DNAm-based SVs revealed that the SVs for smoking, alcohol use, total cholesterol had high reliability (95% CI for ICC > 0.6), whereas those for BMI and cholesterol ratios were less reliable (95% CI for ICC < 0.6). These results demonstrated that surrogate variables that leverage information from many probes increase reliability by diluting noise from individual CpGs [Citation41].
Several limitations and areas for future study are in order. First, our analyses focused on methylation levels measured in whole blood; therefore, the results may be applicable only to EWAS conducted using blood samples. Additional studies that assess the reliability of DNAm measured by EPIC v1.0 array probes in target tissues (e.g., the brain) and other accessible tissues (e.g., saliva) are needed. Second, due to the specific criteria we applied, including selecting independent subjects and ensuring that samples were placed on different methylation plates, we were able to include only a relatively small number of 69 pairs of duplicate samples in this study. Future studies with larger sample sizes are needed to confirm our findings. Finally, it is important to note that reliability estimates can be influenced by the choice of normalization procedure. In this study, we used the SeSAMe 2 pipeline for pre-processing the DNAm data [Citation17]. Additional studies with large sample sizes are needed to thoroughly evaluate and compare different preprocessing procedures for estimating the reliability of DNAm levels in EPIC v1.0 arrays.
To reduce the burden of multiple comparisons in EWAS, some authors have proposed excluding probes with low reliability a priori [Citation10,Citation42], whereas others cautioned against this approach, as it may potentially exclude probes with low variability that are located in important gene regulatory regions [Citation14]. To this end, we recommend a practical strategy for performing EWAS analysis: first, based on the specific sample size, determine the maximum number of probes, denoted as m, that can be tested with sufficient power (e.g., 80%), considering corrections for multiple comparisons [Citation43]. The primary analysis would concentrate on examining m probes with the highest reliability. Subsequently, secondary analyses can be carried out to investigate the remaining probes. This ensures a focused and structured approach to exploring associations in EWAS, prioritizing reliability, and ensuring power in the analysis. An interesting topic for further research is to rigorously design sequential multiple comparison procedures that maximally leverage the reliability information of all probes while controlling the overall Type I error rate in EWAS. The idea is to test all the probes, but with the most reliable probes first, and appropriately adjust the significance level of each probe analysis to account for the increased chance of obtaining a false-positive result when conducting multiple comparisons. An alternative strategy is to employ sequencing-based technology, which potentially offers greater accuracy in regions with low methylation levels (e.g., CpG islands) compared to array-based methods. However, currently sequencing technologies, such as whole-genome bisulphite sequencing (WGBS), are more expensive and require more DNA input, which might not be feasible for large population-based studies.
In summary, we comprehensively evaluated the reliability of probes on EPIC v1.0 arrays. We observed higher reliability in probes with average methylation beta values of 0.2 to 0.8, and lower reliability in type I probes or those within the promoter and CpG island regions. Our findings revealed that probe reliability has significant implications for various downstream analyses of the EWAS. Importantly, we generated a valuable resource for DNAm research by identifying a set of high-quality probes on the EPIC v1.0 array, which will contribute to optimizing the robustness and potential of EWAS.
Consent statement
The study procedures were approved by the institutional review boards of all participating centres (https://adni.loni.usc.edu/wp-content/uploads/how_to_apply/ADNI_Acknowledgement_List.pdf) and written informed consent was obtained from all participants or their authorized representatives. The study was conducted in accordance with the Declaration of Helsinki and all study participants provided written informed consent for data collection. All work complied with ethical regulations for working with human participants. Ethics approval was obtained from the institutional review boards of each institution involved: Oregon Health and Science University; University of Southern California; University of California – San Diego; University of Michigan; Mayo Clinic, Rochester; Baylor College of Medicine; Columbia University Medical Center; Washington University, St. Louis; University of Alabama at Birmingham; Mount Sinai School of Medicine; Rush University Medical Center; Wien Center; Johns Hopkins University; New York University; Duke University Medical Center; University of Pennsylvania; University of Kentucky; University of Pittsburgh; University of Rochester Medical Center; University of California, Irvine; University of Texas Southwestern Medical School; Emory University; University of Kansas, Medical Center; University of California, Los Angeles; Mayo Clinic, Jacksonville; Indiana University; Yale University School of Medicine; McGill University, Montreal-Jewish General Hospital; Sunnybrook Health Sciences, Ontario; U.B.C. Clinic for AD & Related Disorders; Cognitive Neurology – St. Joseph’s, Ontario; Cleveland Clinic Lou Ruvo Center for Brain Health; Northwestern University; Premiere Research Inst (Palm Beach Neurology); Georgetown University Medical Center; Brigham and Women’s Hospital; Stanford University; Banner Sun Health Research Institute; Boston University; Howard University; Case Western Reserve University; University of California, Davis – Sacramento; Neurological Care of CNY; Parkwood Hospital; University of Wisconsin; University of California, Irvine – BIC; Banner Alzheimer’s Institute; Dent Neurologic Institute; Ohio State University; Albany Medical College; Hartford Hospital, Olin Neuropsychiatry Research Center; Dartmouth-Hitchcock Medical Center; Wake Forest University Health Sciences; Rhode Island Hospital; Butler Hospital; UC San Francisco; Medical University South Carolina; St. Joseph’s Health Care Nathan Kline Institute; University of Iowa College of Medicine; Cornell University and University of South Florida: USF Health Byrd Alzheimer’s Institute.
The investigators within the ADNI contributed to the design and implementation of the ADNI and/or provided data, but did not participate in the analysis or writing of this report. A complete list of ADNI investigators can be found online (http://adni.loni.usc.edu/wp-content/uploads/how_to_apply/ADNI_Acknowledgement_List.pdf).
Supplementary Figures_1_27_2024.docx
Download MS Word (102.8 KB)Supplementary Table 6.xlsx
Download MS Excel (68.9 MB)Supplementary Tables_1_31_2024.docx
Download MS Word (50.6 KB)Acknowledgments
Data used in this study were obtained from the Alzheimer’s Disease Neuroimaging Initiative (ADNI) database (adni.loni.usc.edu). As such, the investigators within the ADNI contributed to the design and implementation of ADNI and/or provided data, but did not participate in the analysis or writing of this report. A complete listing of ADNI investigators can be found at http://adni.loni.usc.edu/wp-content/uploads/how_to_apply/ADNI_Acknowledgement_List.pdf
Data collection and sharing for this project were funded by the Alzheimer’s Disease Neuroimaging Initiative (ADNI) (National Institutes of Health Grant U01 AG024904) and DOD ADNI (Department of Defense award number W81XWH-12-2-0012). ADNI is funded by the National Institute on Aging, the National Institute of Biomedical Imaging and Bioengineering, and through generous contributions from the following: AbbVie, Alzheimer’s Association; Alzheimer’s Drug Discovery Foundation; Araclon Biotech; BioClinica, Inc.;Biogen; Bristol-Myers Squibb Company; CereSpir, Inc.; Eisai Inc.; Elan Pharmaceuticals, Inc.; Eli Lilly and Company; EuroImmun; F. Hoffmann-La Roche Ltd and its affiliated company Genentech, Inc.; Fujirebio; GE Healthcare; IXICO Ltd.; Janssen Alzheimer Immunotherapy Research & Development, LLC.; Johnson & Johnson Pharmaceutical Research & Development LLC.; Lumosity; Lundbeck; Merck & Co., Inc.; Meso Scale Diagnostics, LLC.; NeuroRx Research; Neurotrack Technologies; Novartis Pharmaceuticals Corporation; Pfizer Inc.; Piramal Imaging; Servier; Takeda Pharmaceutical Company; and Transition Therapeutics. The Canadian Institute of Health Research provides funds to support ADNI clinical sites in Canada. Private sector contributions were facilitated by the Foundation for the National Institutes of Health (http://www.fnih.org). The grantee organization was the Northern California Institute for Research and Education, and the study was coordinated by the Alzheimer’s Disease Cooperative Study at the University of California, San Diego. The ADNI data were disseminated by the Laboratory for Neuro Imaging at the University of Southern California.
Disclosure statement
No potential conflict of interest was reported by the author(s).
Data availability statement
The ADNI datasets can be accessed from http://adni.loni.usc.edu. The scripts for the analysis performed in this study are available at https://github.com/TransBioInfoLab/DNAm-reliability
Supplementary material
Supplemental data for this article can be accessed online at https://doi.org/10.1080/15592294.2024.2333660
Additional information
Funding
References
- Moore LD, Le T, Fan G. DNA methylation and its basic function. Neuropsychopharmacology. 2013;38(1):23–13. doi: 10.1038/npp.2012.112
- Nabais MF, Laws SM, Lin T, et al. Meta-analysis of genome-wide DNA methylation identifies shared associations across neurodegenerative disorders. Genome Biol. 2021;22(1):90. doi: 10.1186/s13059-021-02275-5
- Lunnon K, Smith R, Hannon E, et al. Methylomic profiling implicates cortical deregulation of ANK1 in Alzheimer’s disease. Nat Neurosci. 2014;17(9):1164–1170. doi: 10.1038/nn.3782
- De Jager PL, Srivastava G, Lunnon K, et al. Alzheimer’s disease: early alterations in brain DNA methylation at ANK1, BIN1, RHBDF2 and other loci. Nat Neurosci. 2014;17(9):1156–1163. doi: 10.1038/nn.3786
- CS T, Young JI, Zhang L, et al. Cross-tissue analysis of blood and brain epigenome-wide association studies in Alzheimer’s disease. Nat Commun. 2022;13(1):4852. doi: 10.1038/s41467-022-32475-x
- Zhang L, Silva TC, Young JI, et al. Epigenome-wide meta-analysis of DNA methylation differences in prefrontal cortex implicates the immune processes in Alzheimer’s disease. Nat Commun. 2020;11:6114. doi: 10.1038/s41467-020-19791-w
- Mikeska T, Craig JM. undefined. Genes (Basel). 2014;5(3):821–864. doi: 10.3390/genes5030821
- Dedeurwaerder S, Defrance M, Bizet M, et al. A comprehensive overview of infinium HumanMethylation450 data processing. Brief Bioinform. 2014;15(6):929–941. doi: 10.1093/bib/bbt054
- Pidsley R, Zotenko E, Peters TJ, et al. Critical evaluation of the Illumina MethylationEPIC BeadChip microarray for whole-genome DNA methylation profiling. Genome Biol. 2016;17(1):208. doi: 10.1186/s13059-016-1066-1
- Bose M, Wu C, Pankow JS, et al. Evaluation of microarray-based DNA methylation measurement using technical replicates: the atherosclerosis risk in communities (ARIC) study. BMC Bioinf. 2014;15(1):312. doi: 10.1186/1471-2105-15-312
- Forest M, O’Donnell KJ, Voisin G, et al. Agreement in DNA methylation levels from the Illumina 450K array across batches, tissues, and time. Epigenetics. 2018;13(1):19–32. doi: 10.1080/15592294.2017.1411443
- Logue MW, Smith AK, Wolf EJ, et al. The correlation of methylation levels measured using Illumina 450K and EPIC BeadChips in blood samples. Epigenomics. 2017;9(11):1363–1371. doi: 10.2217/epi-2017-0078
- Solomon O, MacIsaac J, Quach H, et al. Comparison of DNA methylation measured by Illumina 450K and EPIC BeadChips in blood of newborns and 14-year-old children. Epigenetics. 2018;13(6):655–664. doi: 10.1080/15592294.2018.1497386
- Xu Z, Taylor JA. Reliability of DNA methylation measures using Illumina methylation BeadChip. Epigenetics. 2021;16(5):495–502. doi: 10.1080/15592294.2020.1805692
- Sugden K, Hannon EJ, Arseneault L, et al. undefined. Patterns. 2020;1(2):1. doi: 10.1016/j.patter.2020.100014
- Vasanthakumar A, Davis JW, Idler K, et al. Harnessing peripheral DNA methylation differences in the Alzheimer’s disease neuroimaging initiative (ADNI) to reveal novel biomarkers of disease. Clin Epigenetics. 2020;12(1):84. doi: 10.1186/s13148-020-00864-y
- Welsh H, Batalha C, Li W, et al. A systematic evaluation of normalization methods and probe replicability using infinium EPIC methylation data. Clin Epigenetics. 2023;15(1):41. doi: 10.1186/s13148-023-01459-z
- Chen YA, Lemire M, Choufani S, et al. Discovery of cross-reactive probes and polymorphic CpGs in the Illumina infinium HumanMethylation450 microarray. Epigenetics. 2013;8(2):203–209. doi: 10.4161/epi.23470
- Muller F, Scherer M, Assenov Y, et al. RnBeads 2.0: comprehensive analysis of DNA methylation data. Genome Biol. 2019;20(1):55. doi: 10.1186/s13059-019-1664-9
- Zhou W, Triche TJ Jr., Laird PW, et al. SeSAMe: reducing artifactual detection of DNA methylation by Infinium BeadChips in genomic deletions. Nucleic Acids Res. 2018;46:e123. doi: 10.1093/nar/gky691
- Koo TK, Li MY. A guideline of selecting and reporting intraclass correlation coefficients for reliability research. J Chiropr Med. 2016;15(2):155–163. doi: 10.1016/j.jcm.2016.02.012
- Teschendorff AE, Breeze CE, Zheng SC, et al. A comparison of reference-based algorithms for correcting cell-type heterogeneity in epigenome-wide association studies. BMC Bioinf. 2017;18(1):105. doi: 10.1186/s12859-017-1511-5
- McCartney DL, Hillary RF, Stevenson AJ, et al. Epigenetic prediction of complex traits and death. Genome Biol. 2018;19(1):136. doi: 10.1186/s13059-018-1514-1
- Kuznetsova A, Brockhoff PB, Christensen RHB. lmerTest package: tests in linear mixed effects models. J Stat Softw. 2017;82(13):1–26. doi: 10.18637/jss.v082.i13
- Gomez L, Odom GJ, Young JI, et al. coMethdmr: accurate identification of co-methylated and differentially methylated regions in epigenome-wide association studies with continuous phenotypes. Nucleic Acids Res. 2019;47(17):e98. doi: 10.1093/nar/gkz590
- Min JL, Hemani G, Hannon E, et al. Genomic and phenotypic insights from an atlas of genetic effects on DNA methylation. Nat Genet. 2021;53(9):1311–1321. doi: 10.1038/s41588-021-00923-x
- Min JL, Hemani G, Hannon E et al. Genomic and phenomic insights from an atlas of genetic effects on DNA methylation. medRxiv. 2021. doi: 10.1101/2020.1109.1101.20180406
- Yao L, Shen H, Laird PW, et al. Inferring regulatory element landscapes and transcription factor networks from cancer methylomes. Genome Biol. 2015;16(1):105. doi: 10.1186/s13059-015-0668-3
- Silva TC, Young JI, Martin ER, et al. MethReg: estimating the regulatory potential of DNA methylation in gene transcription. Nucleic Acids Res. 2022;50(9):e51–e51. doi: 10.1093/nar/gkac030
- Starnawska A, Tan Q, McGue M, et al. Epigenome-wide association study of cognitive functioning in middle-aged monozygotic twins. Front Aging Neurosci. 2017;9:413. doi: 10.3389/fnagi.2017.00413
- Cicchetti DV, Sparrow SA. Developing criteria for establishing interrater reliability of specific items: applications to assessment of adaptive behavior. Am J Ment Defic. 1981;86(2):127–137.
- Dedeurwaerder S, Defrance M, Calonne E, et al. Evaluation of the infinium methylation 450K technology. Epigenomics. 2011;3(6):771–784. doi: 10.2217/epi.11.105
- Hannon E, Lunnon K, Schalkwyk L, et al. Interindividual methylomic variation across blood, cortex, and cerebellum: implications for epigenetic studies of neurological and neuropsychiatric phenotypes. Epigenetics. 2015;10(11):1024–1032. doi: 10.1080/15592294.2015.1100786
- CS T, Zhang W, Young JI, et al. Distinct sex-specific DNA methylation differences in Alzheimer’s disease. Alz Res Ther. 2022;14(1):133. doi: 10.1186/s13195-022-01070-z
- Irizarry RA, Ladd-Acosta C, Carvalho B, et al. Comprehensive high-throughput arrays for relative methylation (CHARM). Genome Res. 2008;18(5):780–790. doi: 10.1101/gr.7301508
- Naeem H, Wong NC, Chatterton Z, et al. Reducing the risk of false discovery enabling identification of biologically significant genome-wide methylation status using the HumanMethylation450 array. BMC Genomics. 2014;15(1):51. doi: 10.1186/1471-2164-15-51
- Costa-Santos C, Bernardes J, Ayres-de-Campos D, et al. The limits of agreement and the intraclass correlation coefficient may be inconsistent in the interpretation of agreement. J Clin Epidemiol. 2011;64(3):264–269. doi: 10.1016/j.jclinepi.2009.11.010
- Muller R, Buttner P. A critical discussion of intraclass correlation coefficients. Stat Med. 1994;13(23–24):2465–2476. doi: 10.1002/sim.4780132310
- Xin Y, O’Donnell AH, Ge Y, et al. Role of CpG context and content in evolutionary signatures of brain DNA methylation. Epigenetics. 2011;6(11):1308–1318. doi: 10.4161/epi.6.11.17876
- Dugue PA, English DR, MacInnis RJ, et al. The repeatability of DNA methylation measures may also affect the power of epigenome-wide association studies. Int J Epidemiol. 2015;44(4):1460–1461. doi: 10.1093/ije/dyv189
- Higgins-Chen AT, Thrush KL, Wang Y, et al. A computational solution for bolstering reliability of epigenetic clocks: implications for clinical trials and longitudinal tracking. Nat Aging. 2022;2(7):644–661. doi: 10.1038/s43587-022-00248-2
- Chen J, Just AC, Schwartz J, et al. CpGFilter: model-based CpG probe filtering with replicates for epigenome-wide association studies. Bioinformatics. 2016;32(3):469–471. doi: 10.1093/bioinformatics/btv577
- Graw S, Henn R, Thompson JA, et al. pwrEWAS: a user-friendly tool for comprehensive power estimation for epigenome wide association studies (EWAS). BMC Bioinf. 2019;20(1):218. doi: 10.1186/s12859-019-2804-7