
ABSTRACT
Wintertime water meter frost is a substantial threat to sustainable water supply. However, little is known about the social and environmental conditions associated with its occurrence. This study identifies characteristics of water meter frost in Seoul, South Korea, by examining natural and anthropogenic conditions, such as local weather and urban infrastructures. The deterministic threshold of seasonal water meter frosts is the number of cold days below −10°C. The wall-type water meter was the first to freeze during a cold surge, whereas the manhole-type water meter froze gradually, which increased after a persistent cold surge of more than three days. In addition, deteriorated buildings (older than 30 years), narrow pipes with diameters of 15–20 mm, and housing types such as townhouses and shopping malls were found to be vulnerable to frost. The critical thresholds proposed in this study are necessary for maintaining a stable water supply in megacities in cold regions, world-wide.
1. Introduction
The social problem of frozen water meters during winter has remained unsolved since the construction of waterworks system in Seoul, South Korea (Kim et al. Citation2007; Park, Chang, and Kim Citation2019; Van de Meene, Brown, and Farrelly Citation2011). Water meters burst due to the known 9% expansion of the volume of frozen water when exposed to the cold outside air after a rapid drop in temperature during a winter cold surge (AWWA Citation2012). This disrupts water supply to citizens, thus causing inconvenience (Boyle et al. Citation2013). It also imposes additional administrative costs due to water meter replacement and tap water leakage, despite the fact that the urban, intelligent metering system was recently installed (Christodoulou and Agathokleous Citation2012; Cole and Stewart Citation2013; Fontanazza et al. Citation2012).
Efforts to prevent freezing and bursting damage have been undertaken in recent decades in South Korea. In the 1980s, wrapping the faucet with old clothes was a popular method of heat insulation. In the 1990s, heating wires were wound around water meters to supply heat and prevent freezing. In the 2000s, preventing cold air exposure by filling the boxes of water meters with vinyl, styrofoam, and old clothes was popular. Frost-resistant water meters were invented in 2004 and used widely ever since. Several studies have recently investigated the pipe structure in water meters by numerically modeling the fluid pressure, and some have attempted to use phase change materials (Choi, Lee, and Ko Citation2014; Lee, Lee, and Kwak Citation2018; Yun et al. Citation2012). Despite these efforts, water meters continue to freeze due to exposure to abrupt temperature drops in winter. Although air temperatures have been increasing due to climate change, wintertime strong cold surges steadily occur (Heo et al. Citation2018; Ho et al. Citation2011; Min et al. Citation2015; Park et al. Citation2010, Citation2011; Yang et al. Citation2021). In other words, the damage associated with water meter frost caused by the temporary cold surge in winter may continue in future climates, which are expected to be warmer.
This study aims to explore the characteristics of water meter frost in Seoul from various aspects and provide a scientific basis for preparing fundamental solutions or countermeasures away from the existing passive action. This study investigates frozen water meter damage in Seoul over 11 years – from the winter season of 2008/09 to 2018/19—and derives statistical relevance between weather/social conditions and frost outbreaks. After the 2019/20 winter, people spent more time at home due to social distancing policies implemented after the outbreak of COVID-19 (Park, Kim, and Lee Citation2020; Kim et al. Citation2020; Qian and Jiang Citation2020), so the period after 2019/20 has been excluded from this analysis. In addition, the temporal evolution of freezing outbreaks during the study period due to temperature variations is investigated according to the type of water meter box. The characteristics of water meter freezing and bursting in Seoul are evaluated by analyzing various natural and social factors such as weather conditions, building type, pipe diameter, and regional building deterioration.
The remainder of this paper is organized as follows. Data used in this study are explained in Section 2. Section 3 describes the main results and effects of weather conditions and social infrastructure on the frozen water meter. Section 4 presents a summary and discussion of the results.
2. Data and methods
2.1. Study area
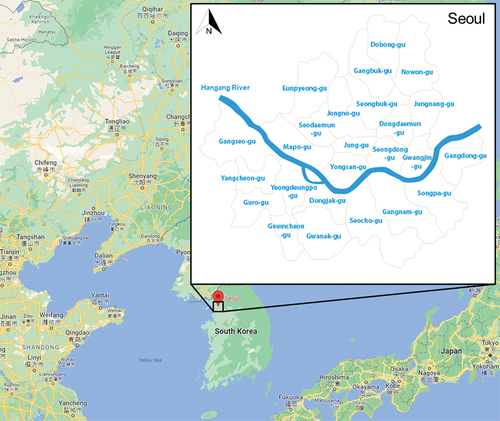
Seoul is the capital city of the Republic of Korea located in East Asia with an area of 605.2 km2 around 37.5°N and 127°E. The average annual temperature in Seoul is 12.9°C, but the average winter season (December through February) is cold to −2.1°C due to the clear seasonal variation (Seoul Metropolitan Government Citation2023). The total length of water supply network is 13,846 km (Seoul Urban Solutions Agency Citation2023). As of December 2020, the population of Seoul is about 10 million, and there are about 2.27 million water meters installed (). Of these, 65% were wall-type meters, whereas 35% were manhole-type meters. A wall-type water meter is installed on the wall of a building or structure, whereas a manhole-type water meter is designed to be installed underground within a specifically constructed chamber. It was found that the number of water meters installed in each district ranges from as few as 34,595 (Jung-gu) to over 162,306 (Gangseo-gu).
Table 1. Population and the number of water meters in each district of Seoul at 2020.
2.2. Data collection
This study analyzed the data on frozen water meters in all 25 districts in the city of Seoul, South Korea, collected by the Seoul Waterworks Authority (). In this dataset, the type of the water meter box was recorded as wall and manhole type, and the date and address of water meter replacement were recorded. Therefore, this data captures the number of daily occurrences of frozen water meters in Seoul.
Figure 1. Geographical location and administrative districts of Seoul, Republic of Korea.
The weather condition in which water can freeze is the natural condition corresponding to water meter frost. The observed daily temperature data of Automated Surface Observing Systems at Seoul station (37.57°N, 126.97°E) from December 2008 to February 2019 were collected from the Weather Data Service in Korea Meteorological Administration (https://data.kma.go.kr). The occurrence and duration of cold surges causing the frozen water meter were determined from the daily minimum temperatures in Seoul.
2.3. Data analysis
To identify the social infrastructure conditions that are vulnerable to water meter frosts, pipe diameters in different water meters and building types were analyzed. The number of meter frost occurrences was investigated for 15 mm, 20 mm, 25 mm, 32 mm, 40 mm, and 50 mm pipe diameters. In addition, frost was analyzed according to apartments, townhouses, detached houses, shopping malls, constructions, and parks. Moreover, the data on the deterioration of buildings by districts in Seoul as of 2020 were analyzed. In this study, a building older than 30 years was defined as an old building, and the number of old buildings according to districts was compared with the number of frozen water meters. All these datasets were obtained from the Open Government Data portal (https://www.data.go.kr).
3. Results
3.1. Influence of weather conditions on water meters
To determine the conditions that lead to frozen water meters in Seoul, the influence of daily minimum temperatures over the last 11 years (December 2008 to February 2019) were investigated. A good correlation between the number of cold days below the daily minimum temperature of −10°C and the variation in frost occurrences was obtained (R2 = 0.77, ) from the sensitivity test of thresholds for −5°C, −10°C, and −15°C. Annual changes in the number of days below the daily minimum temperature of −15°C were also highly correlated with frost occurrences. Because frozen outbreaks occurred even in the year when cold surges below −15°C did not occur, the daily minimum temperature of −15°C would be not a proper threshold for determining freezing in the water meter. Accordingly, a temperature of −10°C has a dominant influence on the frozen water meter.
Figure 2. Time series of the number of water meter frosts and cold days below − 10°C in Seoul.
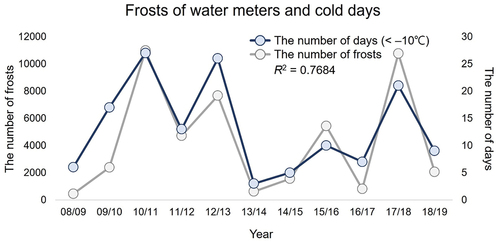
The lowest number of frost occurrences were observed in 2008/09, namely 449 water meter frosts. During the 2008/09 winter, 33 days in Seoul were below −5°C, 6 days were below −10°C, and no days below −15°C were observed, which refers to a relatively warm winter. On the other hand, the winter with the strongest cold surges during the study period was that of 2017/18. During that winter, 55 days below −5°C, 21 days below −10°C, and 5 days below −15°C were recorded. Regarding the duration of cold surges in 2017/18, the longest period of cold days below −5°C was 23 consecutive days, two periods for cold days below −10°C lasted more than 5 days, and the cold days below −15°C lasted for 4 days. During the winter of 2010/11, more than 10,000 frozen water meter instances were recorded. For the 2010/11 winter, 53 days below −5°C, 27 days below −10°C, and 3 days below −15°C were recorded. Therefore, the number and persistence of cold days could be a dominant factor for frozen water meters in Seoul.
3.2. Analysis of the cold surge of 2018/19
The temporal evolution of frozen water meters and their characteristics were examined based on a case study of a cold surge. As a representative case, the cold surge from 24 December 2018 to 4 January 2019 was selected. From 27 December 2018 to 31 December 2018, the freezing-warning stage with a daily minimum temperature below −10°C continued for five days. From 1 January 2019, the cold surge gradually eased, and the temperature recovered to the climatological average.
During this cold surge period, the temporal evolution of the daily minimum temperature and number of frost occurrences were examined using a box-type water meter (). The number of frozen water meter occurrences increased drastically from 28 December, during which daily minimum temperatures of −10°C or below lasted for more than two days. On Sunday 30 December, the freezing-warning stage was still observed, but the number of freezing and bursting instances was relatively small, that is, approximately 40. It is estimated that the outbreak of frost occurred on Sunday, but detection and reporting were postponed to Monday.
Figure 3. The number of frozen water meters (colored histogram) in (a) wall type, and (b) manhole type by daily minimum temperature (solid line) for 12 d (24 December 2018 through 04 January 2019). Each color represents a type of building.
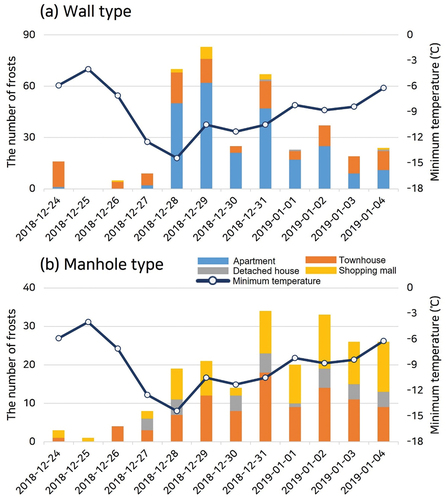
Housing types related to frozen water meters are divided into apartments, townhouses, detached houses, and shopping malls (). Water meter frost mostly occurs in apartments when a strong cold surge below a daily minimum temperature of −10°C () occurred. In townhouses, on the other hand, water meter frosting occurred consistently on days when the daily minimum temperature was below −5°C (). Therefore, a difference in the occurrence of water meter frosting according to the housing type was observed, depending on the occurrence and persistence of the cold surge.
Regarding the type of water meter box, the number of frost occurrences in the wall-type water meter tended to increase rapidly when a cold surge occurred, and it gradually decreased as the cold surge continued (). This can be attributed to the water meters, which are vulnerable to cold surge, getting damaged and having to be replaced, which in turn means that management improved the insulation. The number of frozen water meters increased after 28 December, during which the daily minimum temperature dropped below −10°C for more than two days. Presumably, frost occurred mainly in wall-type water meter boxes installed in old corridor-type apartments. For the manhole type, the number of frost occurrences gradually increased as the cold surge of −10°C occurred and persisted (). From 27 to 31 December, the minimum temperature was below −10°C, which is the freezing-warning stage, and the temperature increased slightly after 1 January to approximately −5°C, which is in the freezing-cautious stage. However, unlike the wall-type meter, the number of frozen manhole-type water meters continued to increase. This would correspond to an extended cold condition. This can be explained by the underground temperature continuously decreasing and the depth of freezing increasing rather than the influence of surface temperature variation. Old townhouses and shopping malls were predominantly liable to manhole-type water meter frost.
Meanwhile, even when cold days under −10°C persisted, the number of frost outbreaks decreased after the third day from the abrupt temperature drop. This means that many water meters vulnerable to cold air were already frozen and replaced before the third day of the cold surge, reducing additional damage. Because social influences, such as recovery, should be considered, temperature changes can only partly explain the occurrence of frozen water meters.
3.3. Influence of urban infrastructure in Seoul on water meter freezing
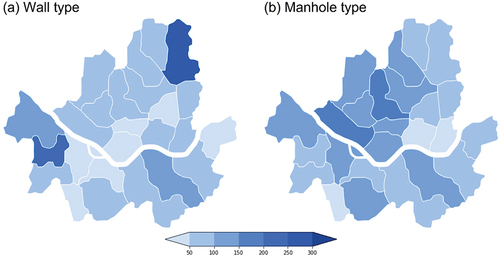
The distribution of the number of frozen water meters by districts in Seoul is classified according to water meter box types. Frost in wall-type water meters mainly occurred in Nowon-gu (>300 per year) and Yangcheon-gu (>250 per year) during the 2008–2019 period (). In addition, many instances of frosting in manhole-type water meters were observed in the northern region of the Hangang River, where more detached houses and townhouses than apartments were built. Overall, the most vulnerable regions were Gangseo-gu, Yangcheon-gu, Mapo-gu, and Nowon-gu, whereas instances of frosting in Geumcheon-gu and Seongdong-gu were few.
Figure 4. The spatial distribution in the annual average number of wintertime (December through February) frozen water meter for 11 years (2008/09–2018/19). (a) wall type, and (b) manhole type.
The number of old apartments and townhouses, which are the majority in Seoul, was investigated because building age may be directly related to the damage in water meter boxes and decrease in insulation performance (). Nowon-gu, Gangseo-gu, Gangnam-gu, Seocho-gu, and Songpa-gu reported a large number of apartments older than 30 years (). Many old townhouses are located in Gangseo-gu and Yangcheon-gu, whereas they are few in Eunpyeong-gu, Gangbuk-gu, and Mapo-gu (). Old apartments in Nowon-gu and old houses in Yangcheon-gu could explain the numerous frozen wall-type water meters (). Considering that many townhouses in Seoul have manhole-type water meters, the number of townhouses over 30 years would be correlated to the number of frozen manhole-type water meters ().
Figure 5. The spatial distribution for the number of old buildings over 30 years in 2020. (a) apartment, and (b) townhouse.
The number of houses in Seoul was 3,015,371 in 2020, of which 1,772,670 were apartments, accounting for 59% of the total houses. The number of townhouses was 906,628, and the number of detached houses was 307,075, accounting for approximately 30% and 10% of the total houses in Seoul, respectively. In other words, 2,679,298 houses, which make up approximately 89% of Seoul houses, are multiunit. Among them, old apartments constructed more than 30 years ago are often corridor-type apartments, which are known to be vulnerable to outdoor cold air, and it is estimated that wall-type water meter boxes are installed in these houses.
The number of frozen water meters according to housing type was analyzed to determine vulnerable residential types, considering differences in the locations of the water meter box according to the housing type. Townhouses were the most vulnerable—37% of the water meter frosting occurred during 2008–2019, followed by 29% in shopping malls, 23% in apartments, and 9% in detached houses (). There are more cases of water meter frost in townhouses than apartments, indicating that townhouses are relatively more vulnerable to water meter frosting.
Figure 6. The percentage of annual average number of wintertime (December through February) frozen water meters according to (a) building types, and (b) pipe diameter.
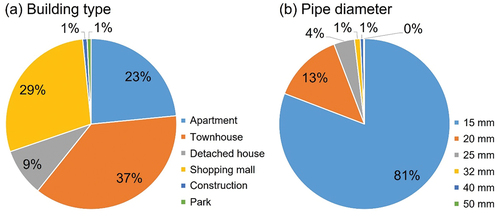
In addition to the housing type, the pipe size (i.e. diameter) is also an important factor determining water freezing in winter. In general, the smaller the water meter pipe diameter, the greater the occurrence of frosting (). The commonly used pipe diameter for individual households was 15 mm and accounted for approximately 81% of the total frosting, whereas 20 mm accounted for 13%, and 25 mm for 4%. Considering pipe diameters of water meters installed in Seoul (i.e. 1.77 million for 15 mm, 0.14 million for 20 mm, and 0.1 million for 25 mm), the ratio of frost occurrences did not significantly vary in pipe diameter.
4. Discussions
In this study, key parameters that cause water meter freezing in Seoul are identified. Considering these results, it is possible to prioritize cost-effective methods to prevent water meter freezing. Many previous efforts have focused on improving the heat preservation of water meters and mechanical development of frost-resistant water meters. If the cold days last for several days, however, even the manhole-type water meters with better heat retention could be also frozen, so improving heat preservation is not a fundamental solution. Although weather is an uncontrollable factor, analysis of the infrastructure to respond to the cold surge gives the most vulnerable factors, small pipe diameter related to the small water consumption. Thus, frost damage can be minimized using a larger water meter in vulnerable conditions, such as poorly insulated old buildings.
Even if the surface temperature is increased in the long-term, cold surges that can produce frost in water meters over the short term still occur in Seoul. Water meters are exposed to outdoor cold air where water can freeze, and these conditions frequently occur due to the deterioration of buildings in Seoul. To fully solve this problem, measures to keep water meters warm should be taken so that they are not exposed to the outdoor cold air for long durations. Although the efficient solution would be reconstructing old buildings via urban regeneration, steady use of water in old buildings could be an immediate and cheap solution.
5. Summary and conclusions
This study diagnoses the occurrence of water meter frost in Seoul by considering not only weather conditions but also urban infrastructures. The number of old apartments and townhouses of more than 30 years in all 25 districts was analyzed from the perspective of the number of frozen water meters. A comprehensive analysis confirmed that wall-type water meters installed in old corridor-type apartments in Nowon-gu and Yangcheon-gu were the most vulnerable to frost, and the manhole-type water meters in townhouses in the northern region of the Hangang River were generally risky. Considering the temporal evolution of frost outbreaks according to the type of water meter box from the perspective of occurrences and duration of cold surges, Nowon-gu, Yangcheon-gu, and Gangseo-gu can prevent exposure to outdoor cold air by prechecking the wall-type water meter box when a cold surge below −10°C is predicted. When the cold surge lasts more than three days, manhole-type water meters in the northern part of the Hangang River, Mapo-gu and Jongno-gu, should be prechecked. In addition, given the general deterioration of townhouses in Seoul, preemptive management is urgently needed to prevent frost damage in water meters soon, including replacing manhole-type water meters or improving insulation.
This study examined the various features of the water meter freezing and suggested a cost-effective method to prevent freezing. It is expected that this study will provide reference information for putting in place social elements to reduce frozen water in worldwide megacities suffering cold surges, including Seoul. The results of this study are expected to contribute to the prioritization of government policy implementation. Moreover, this study can contribute to maintaining a smart water metering system in the future even in the event of natural disasters, such as cold surges in urban water supplies.
Acknowledgements
This study was supported by Korea Environmental Industry & Technology Institute (KEITI) through ‘Project for developing an observation-based GHG emissions geospatial information map’, funded by Korea Ministry of Environment (MOE) (RS-2023-00232066) and Institute of Information & communications Technology Planning & Evaluation (IITP) under the metaverse support program to nurture the best talents (IITP-2023-RS-2023-00254529) grant funded by the Korea government (MSIT).
Disclosure statement
No potential conflict of interest was reported by the author(s).
Data availability statement
The data that support the findings of this study are openly available via the webpage service, https://www.data.go.kr/index.do.
Additional information
Funding
References
- AWWA (American Water Works Association). 2012. Water Meters–Selection, Installation, Testing and Maintenance. 5th ed., pp. 1–121. Denver, CO, USA: AWWA.
- Boyle, T., D. Giurco, P. Mukheibir, A. Liu, C. Moy, S. White, and R. Stewart. 2013. “Intelligent Metering for Urban Water: A Review.” Water 5 (3): 1052–1081. https://doi.org/10.3390/w5031052.
- Choi, S.-H., D.-W. Lee, and Y.-B. Ko. 2014. “Numerical Analysis for Deformation Characteristics Under the Freezing and Bursting of Al Pipe.” Journal of the Korea Academia-Industrial Cooperation Society 15 (8): 4763–4768. https://doi.org/10.5762/KAIS.2014.15.8.4763.
- Christodoulou, S., and A. Agathokleous. 2012. “A Study on the Effects of Intermittent Water Supply on the Vulnerability of Urban Water Distribution Networks.” Water Supply 12 (4): 523–530. https://doi.org/10.2166/ws.2012.025.
- Cole, G., and R. A. Stewart. 2013. “Smart Meter Enabled Disaggregation of Urban Peak Water Demand: Precursor to Effective Urban Water Planning.” Urban Water Journal 10 (3): 174–194. https://doi.org/10.1080/1573062X.2012.716446.
- Fontanazza, C. M., G. Freni, G. L. Loggia, V. Notaro, and V. Puleo. 2012. “A Composite Indicator for Water Meter Replacement in an Urban Distribution Network.” Urban Water Journal 9 (6): 419–428. https://doi.org/10.1080/1573062X.2012.690434.
- Heo, J.-W., C.-H. Ho, T.-W. Park, W. Choi, J.-H. Jeong, and J. Kim. 2018. “Changes in Cold Surge Occurrence Over East Asia in the Future: Role of Thermal Structure.” Atmosphere 9 (6): 222. https://doi.org/10.3390/atmos9060222.
- Ho, C.-H., T.-W. Park, S.-Y. Jun, M.-H. Lee, C.-E. Park, J. Kim, S.-J. Lee, Y.-D. Hong, C.-K. Song, and J.-B. Lee. 2011. “A Projection of Extreme Climate Events in the 21st Century Over East Asia Using the Community Climate System Model 3.” Asia-Pacific Journal of Atmospheric Sciences 47 (4): 329–344. https://doi.org/10.1007/s13143-011-0020-0.
- Kim, S., Y. Ko, Y.-J. Kim, and E. Jung. 2020. “The Impact of Social Distancing and Public Behavior Changes on COVID-19 Transmission Dynamics in the Republic of Korea.” PLoS ONE 15 (9): e0238684. https://doi.org/10.1371/journal.pone.0238684.
- Kim, H. I., T. H. Ryu, T. J. Park, S. Y. Oh, and Y. J. Choi. 2007. “A Study on Frost Protection Methods for Water Meter in Seoul Area.” The Society of Air-Conditioning and Refrigerating Engineers of Korea 11 (1): 612–617.
- Lee, J.-H., D.-S. Lee, and J.-S. Kwak. 2018. “The Novel Design to Prevent a Water Meter Damage from Freezing Using Bellows Tube.” International Journal of Precision Engineering and Manufacturing 19 (7): 1027–1032. https://doi.org/10.1007/s12541-018-0121-0.
- Min, S.-K., S.-W. Son, K.-H. Seo, J.-S. Kug, S.-I. An, Y.-S. Choi, J.-H. Jeong, et al. 2015. “Changes in Weather and Climate Extremes Over Korea and Possible Causes: A Review.” Atmospheric Sciences 51 (2): 103–121. https://doi.org/10.1007/s13143-015-0066-5.
- Park, E., D. Chang, and S. Kim. 2019. “Climate Change Trends in the Han River Area - a Seoul Water Supply System Study.” Journal of Climate Change Research 10 (3): 199–211. https://doi.org/10.15531/KSCCR.2019.10.3.199.
- Park, T.-W., C.-H. Ho, S.-J. Jeong, Y.-S. Choi, S. K. Park, and C.-K. Song. 2011. “Different Characteristics of Cold Day and Cold Surge Frequency Over East Asia in a Global Warming Situation.” Journal of Geophysical Research: Atmosphere 116 (D12): D12118. https://doi.org/10.1029/2010JD015369.
- Park, T.-W., C.-H. Ho, S. Yang, and J.-H. Jeong. 2010. “Influences of Arctic Oscillation and Madden-Julian Oscillation on Cold Surges and Heavy Snowfalls Over Korea: A Case Study for the Winter of 2009–2010.” Journal of Geophysical Research: Atmosphere 115 (D23): D23122. https://doi.org/10.1029/2010JD014794.
- Park, S., B. Kim, and J. Lee. 2020. “Social Distancing and Outdoor Physical Activity During the COVID-19 Outbreak in South Korea: Implications for Physical Distancing Strategies.” Asia Pacific Journal of Public Health 32 (6–7): 360–362. https://doi.org/10.1177/1010539520940929.
- Qian, M., and J. Jiang. 2020. “COVID-19 and Social Distancing.” Journal of Public Health 30 (1): 259–261. https://doi.org/10.1007/s10389-020-01321-z.
- Seoul Metropolitan Government, assessed Sep. 1. 2023, https://english.seoul.go.kr/seoul-views/meaning-of-seoul/3-climate/.
- Seoul Urban Solutions Agency, Accessed September 8, 2023, https://susa.or.kr/en/content/water-management.
- Van de Meene, S. J., R. Brown, and M. A. Farrelly. 2011. “Towards Understanding Governance for Sustainable Urban Water Management.” Global Environmental Change 21 (3): 1117–1127. https://doi.org/10.1016/j.gloenvcha.2011.04.003.
- Yang, X., G. Zeng, G. Zhang, V. Iyakaremye, and Y. Xu. 2021. “Future Projections of Winter Cold Surge Paths Over East Asia from CMIP6 Models.” International Journal of Climatology 41 (2): 1230–1245. https://doi.org/10.1002/joc.6797.
- Yun, J.-H., J.-H. Kim, S.-Y. Jeong, Y.-S. Yang, S.-H. Kim, and D.-Y. Song. 2012. “An Experimental Study on the Freezing Protection Valve Using Phase Change Material (PCM) for the Heat Exchanger.” Journal of the Korean Solar Energy Society 32 (6): 127–133. https://doi.org/10.7836/kses.2012.32.6.127.