
ABSTRACT
Background
Circular RNAs (circRNAs) have shown important regulatory roles in tumorigenesis. However, the role and working mechanism of circ_0000745 in acute lymphoblastic leukemia (ALL) development remain largely unclear.
Methods
The expression of circ_0000745, sperm antigen with calponin homology and coiled-coil domains 1 (SPECC1), microRNA-494-3p (miR-494-3p), and neuroepithelial cell transforming 1 (NET1) messenger RNA (mRNA) and protein was analyzed by reverse transcription-quantitative polymerase chain reaction (RT-qPCR) and Western blot assay. Flow cytometry was performed to assess cell apoptosis and cell cycle progression. Extracellular acidification rate (ECAR) was assessed to analyze cell glycolysis. Cell viability was analyzed by 3-(4,5-Dimethylthiazol-2-yl)-2,5-Diphenyltetrazolium Bromide (MTT) assay. Ferroptosis was assessed through measuring the intracellular levels of iron and lipid reactive oxygen species (ROS). Dual-luciferase reporter assay and RNA immunoprecipitation (RIP) assay were conducted to validate the interaction between miR-494-3p and circ_0000745 or NET1.
Results
Circ_0000745 expression was elevated in ALL patients and cell lines. Circ_0000745 knockdown restrained cell cycle progression and glycolysis and triggered cell apoptosis and ferroptosis. Circ_0000745 acted as a molecular sponge for miR-494-3p in ALL cells. miR-494-3p silencing partly diminished circ_0000745 knockdown-induced anti-tumor effects in ALL cells. NET1 was a target of miR-494-3p, and miR-494-3p overexpression-induced anti-tumor influences were partly counteracted by the accumulation of NET1 in ALL cells. Circ_0000745 can positively regulate NET1 expression by sponging miR-494-3p in ALL cells.
Conclusion
Circ_0000745 contributed to ALL development partly by binding to miR-494-3p to induce NET1 expression.0020.
Introduction
Acute lymphoblastic leukemia (ALL) is a common childhood malignancy, accounting for about 80% of all acute leukemia cases [Citation1]. Although the cure rate of ALL in children has been significantly improved, recurrence is still a major obstacle for ALL treatment, and the overall survival rate of recurrent ALL patients remains as low as 30% [Citation2]. Therefore, identifying novel diagnostic and therapeutic targets is urgently needed for ALL treatment.
Accumulating evidence demonstrated that circular RNAs (circRNAs) are implicated in multiple physiological and pathological processes, including innate immunity [Citation3], inflammatory response [Citation4], carcinogenesis [Citation5], ageing [Citation6], and cardiovascular disorders [Citation7]. CircRNAs are also reported to be pivotal regulators in the pathology of some hematological malignancies. For instance, circ_0004277 is reported to be notably down-regulated in acute myeloid leukemia, and high level of circ_0004277 is related to the successful treatment of acute myeloid leukemia patients [Citation8]. Circ_0000745 expression is reported to be up-regulated in ALL cell lines, and circ_0000745 promotes the proliferation of ALL cells by activating ERK signaling [Citation9]. Here, we further explored the working mechanism of circ_0000745 in ALL progression.
It is well established that circRNAs can act as miRNA sponges to regulate cellular biological behaviors [Citation10, Citation11]. In this study, miR-494-3p was predicted as a possible target of circ_0000745 by bioinformatics software. miR-494 expression is reported to be down-regulated in chronic lymphocytic leukemia cells [Citation15]. We tested the interaction between miR-494-3p and circ_0000745 and further explored their functional correlation in ALL progression.
Increasing studies demonstrated that microRNAs (miRNAs) can regulate gene expression by degrading target messenger RNAs (mRNAs) or suppressing their translation [Citation12, Citation13]. For instance, Huang et al. found that miR-137 blocks the proliferation of ALL cells by down-regulating its target JARID1B [Citation14]. Neuroepithelial cell transforming 1 (NET1), a guanine nucleotide exchange factor (GEF) of ras homolog family member A (RhoA), was isolated for the first time from neuroepithelioma cells in 1996 [Citation16]. NET1 was predicted as a candidate target of miR-494-3p in this study by bioinformatics software. NET1 is reported to be implicated in the pathology of many malignancies, including ALL [Citation17–20]. Sun et al. demonstrated that NET1 contributes to the proliferation and drug resistance of ALL cells [Citation20]. In this study, we assessed the target relationship between NET1 and miR-494-3p and further analyzed their functional correlation in ALL progression.
In this study, we first analyzed the expression pattern and function of circ_0000745 in ALL cells. Bioinformatics databases were then used to predict the downstream molecules of circ_0000745, and the working mechanism of circ_0000745 was confirmed through rescue experiments.
Materials and methods
Clinical sample collection
The peripheral blood samples of ALL patients (n = 30) and age-matched healthy volunteers (n = 30) without clinical features of any hematological malignancy were collected at Xiangyang NO.1 People’s Hospital. All the participants had signed the written informed consent before blood collection. The protocol of clinical study was authorized by the ethics committee of Xiangyang NO.1 People’s Hospital (ethics approval number: 2020KY028).
Reverse transcription-quantitative polymerase chain reaction (RT-qPCR)
RNA samples were isolated using Trizol reagent (Invitrogen, Carlsbad, CA, U.S.A.). RNA was reversely transcribed to complementary DNA (cDNA) using RevertAid First Strand cDNA Synthesis Kit (Invitrogen; for circ_0000745, sperm antigen with calponin homology and coiled-coil domains 1 (SPECC1), and NET1) and Mir-X miR First-Strand Synthesis Kit (Takara, Dalian, China; for miR-494-3p). The fold change levels were analyzed using SYBRTM Green PCR Master Mix (Invitrogen) and the 2−ΔΔCt method with U6 small nuclear RNA (snRNA; for miR-494-3p) or glyceraldehyde-3-phosphate dehydrogenase (GAPDH; for circ_0000745, SPECC1 and NET1) as internal control. The primers were shown in .
Table 1. Primer sequences in RT-qPCR assay.
Cell lines
Two ALL cell lines (Kasumi-1 and KG-1) and human primary T cells were purchased from iCell Bioscience (Shanghai, China). ALL cell lines were cultured with Iscove’s Modified Dulbecco’s Medium (IMDM; Gibco, Carlsbad, CA, U.S.A.) added with 10% fetal bovine serum (FBS; Gibco) and 1% antibiotics (Gibco). Human primary T cells were cultured with iCell primary T lymphocytes cells culture system (iCell Bioscience). All cell lines were cultured under the standard condition (37°C; 5% CO2).
Actinomycin D and RNase R treatment
Transcription inhibitor Actinomycin D (Sigma, St. Louis, MO, U.S.A.) was added to the culture medium at the dose of 2 mg/mL. ALL cells were incubated with Actinomycin D for 6, 12, 24 h, or 36 h. RNA level was examined by RT-qPCR.
Total RNA samples were digested with 3 U/μg RNase R (Epicentre Technologies, Madison, WI, U.S.A.) at room temperature for 30 min. RT-qPCR was applied to measure RNA expression.
Subcellular localization
Nuclear fraction and cytoplasmic fraction were extracted using PARISTM Kit (Invitrogen) in accordance with the protocol of a previous study [Citation21].
Cell transfection
Small interfering RNA against circ_0000745 (si-circ_0000745), si-control (si-con), overexpression plasmid of circ_0000745 (circ_0000745), pLCDH-cir, mimics of miR-494-3p, miR-con, inhibitor targeting miR-494-3p (anti-miR-494-3p), anti-miR-con, NET1 overexpression plasmid (NET1) and pcDNA vector (pcDNA) were purchased from Genepharma (Shanghai, China) and Ribobio (Guangzhou, China). ALL cells were transfected with small RNAs or plasmids with Lipofectamine® 3000 (Invitrogen).
Flow cytometry for cell apoptosis analysis
After transfection for 72 h, ALL cells were re-suspended in 500 μL binding buffer which contained 5 μL Annexin V-fluorescein isothiocyanate (Annexin V-FITC; Bestbio, Shanghai, China) and 10 μL propidium iodide (PI; Bestbio). Apoptotic rate was analyzed by a FACSCalibur flow cytometer (BD Biosciences, San Jose, CA, U.S.A.).
Flow cytometry for cell cycle analysis
ALL cells were collected by trypsinization, washed using ice-cold phosphate buffer saline (PBS; Sangon Biotech, Shanghai, China) and immobilized using 80% ice-cold ethanol. RNase (Sigma) was incubated with ALL cells for 30 min at room temperature at the final concentration of 2 mg/mL to remove the RNA content. ALL cells were then incubated with PI (Sigma) of 20 mg/mL for 20 min. The proportion of ALL cells at G0/G1, S or G2/M phase was assessed by a FACSCalibur flow cytometer (BD Biosciences).
Determination of the extracellular acidification rate (ECAR)
ALL cells were inoculated into Seahorse XF 96 cell culture plates at the density of 3 × 10⁴ cells per well. Glucose, Oligomycin (the oxidative phosphorylation inhibitor) and 2-Deoxyglucose (2-DG; the glycolytic inhibitor) were added at the specific time points. Seahorse XF Glycolysis Stress Test Kit (Seahorse Bioscience, Shanghai, China) was used in this assay, and the ECAR was analyzed by the Seahorse XFe 96 Extracellular Flux Analyzer (Seahorse Bioscience).
Chemicals
Ferrostatin-1 (2 μM) and Erastin (10 μM) were purchased from MedChemExpress (Monmouth Junction, NJ, U.S.A.). ALL cells stimulated with Ferrostatin-1 (2 μM) or Erastin (10 μM) for 48 h were used for further analysis.
3-(4,5-Dimethylthiazol-2-yl)-2,5-Diphenyltetrazolium Bromide (MTT) assay
ALL cells were inoculated into the wells of 96-well plates. After transfection for 24 h, ALL cells were subjected to 2 μM Ferrostatin-1 and 10 μM Erastin for 48 h. Subsequently, cells were mixed with MTT reagent (Sigma), and cells were continued to culture for 4 h. The reaction was terminated through adding 200 μL dimethyl sulfoxide (DMSO; Sigma). The optical density was analyzed at 490 nm.
Determination of iron and lipid reactive oxygen species (ROS) levels
The iron level [Citation22] and lipid ROS level [Citation23, Citation24] were determined using Iron Analysis Kit (Sigma) and BODIPYC11 dye (Invitrogen) according to the former studies.
Dual-luciferase reporter assay
The fragments of circ_0000745 and NET1, containing miR-494-3p complementary sites, were amplified by Sangon Biotech and inserted into psi-CHECK-2 (Promega, Madison, WI, U.S.A.) to generate circ_0000745-WT and NET1-WT. The mutant fragments of circ_0000745 and NET1, including the mutant complementary sites with miR-494-3p, were synthesized by Sangon Biotech and constructed to psi-CHECK-2 (Promega) to generate circ_0000745-MUT and NET1-MUT. Kasumi-1 and KG-1 cells were co-transfected with luciferase reporters and miR-con or miR-494-3p. Luciferase activity was analyzed using the Dual-Luciferase Reporter Assay System (Promega).
RNA immunoprecipitation (RIP) assay
Magna RIPTM RNA-Binding Protein Immunoprecipitation Kit (Millipore, Billerica, MA, U.S.A.) was used in this assay. ALL cells were lysed in RIP lysis buffer, and then cell extracts were incubated with magnetic beads labeled with the antibody of Argonaute2 (Ago2; Millipore) or Immunoglobulin G (IgG; Millipore). RNAs that were pulled down were extracted using Trizol reagent (Invitrogen). RNA expression was determined by RT-qPCR.
Western blot assay
Transfected ALL cells were lysed using Radio-Immunoprecipitation Assay (RIPA) lysis buffer (Beyotime, Haimen, China). Protein concentrations were analyzed using a Bradford protein assay (Beyotime). Equal amount of protein samples was loaded onto sodium dodecyl sulfate-polyacrylamide gel electrophoresis (SDS-PAGE) and transferred onto polyvinylidene difluoride (PVDF) membrane (Millipore). The membrane was blocked using 5% bovine serum albumin (BSA; Sangon Biotech), and then incubated with primary antibodies (Abcam, Cambridge, MA, U.S.A.), including anti-NET1 (ab113202) and anti-GAPDH (ab59164). Afterwards, washed membrane was incubated with secondary antibody (Abcam) that labeled with horse radish peroxidase (HRP) for 1 h. The protein bands were exposed using the enhanced chemiluminescent (ECL) system (Beyotime). Quantification was performed using Quantity One software (Bio-Rad, Hercules, CA, U.S.A.).
Statistical analysis
All experiments were independently conducted for three times. All data were analyzed by Graphpad Prism version 7.0 (GraphPad, La Jolla, CA, U.S.A.) and were represented as mean ± Standard Deviation (SD). Comparison in two groups or multiple groups was assessed by Student’s t-test or one-way analysis of variance (ANOVA) followed by Tukey’s test. Linear correlation analysis was performed using Spearman’s correlation coefficient. P value of less than 0.05 was deemed as statistically significant.
Results
Circ_0000745 and miR-494-3p are dysregulated in childhood ALL patients
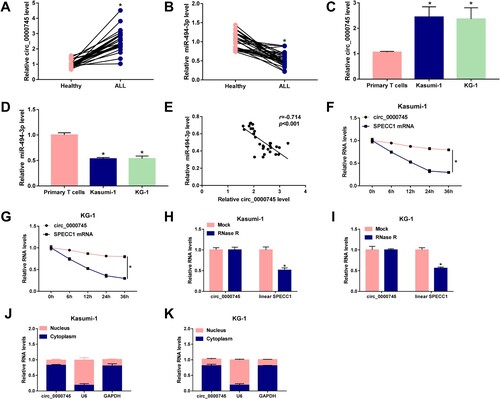
As shown in (A), circ_0000745 was highly expressed in the peripheral blood samples from ALL patients (n = 30) than that from healthy volunteers (n = 30). The level of miR-494-3p was found to be significantly decreased in the peripheral blood samples of ALL patients compared with that in healthy volunteers ((B)). We also tested the expression of circ_0000745 and miR-494-3p in two ALL cell lines (Kasumi-1 and KG-1) along with primary T cells. The results uncovered that circ_0000745 was notably up-regulated in Kasumi-1 and KG-1 compared with that in primary T cells ((C)). The expression of miR-494-3p exhibited an opposite tendency to circ_0000745 ((D)). The expression of miR-494-3p was negatively correlated with the level of circ_0000745 ((E)). Subsequently, the stability of circ_0000745 was analyzed through using transcription inhibitor Actinomycin D, and its linear transcript SPECC1 was used as the control. As shown in (F,G), circ_0000745 expression was stable, while the level of SPECC1 mRNA was significantly reduced after Actinomycin D treatment. RNase R incubation significantly reduced the level of linear SPECC1, while the level of circ_0000745 remained almost unaffected with or without RNase R digestion, suggesting that circ_0000745 was resistant to RNase R ((H,I)). These results demonstrated that circ_0000745 was indeed a circular transcript. Circ_0000745 mainly located in the cytoplasm rather than nucleus in ALL cells ((J,K)).
Figure 1. Circ_0000745 and miR-494-3p are dysregulated in childhood ALL patients. (A) RT-qPCR was applied to determine the expression of circ_0000745 in childhood ALL patients (n = 30) and healthy volunteers (n = 30). (B) The level of miR-494-3p was examined in children ALL patients (n = 30) and healthy controls (n = 30) by RT-qPCR. (C and D) The expression of circ_0000745 and miR-494-3p was determined in Kasumi-1, KG-1 and primary T cells via RT-qPCR. (E) The linear correlation between the expression of miR-494-3p and circ_0000745 was analyzed by Spearman’s correlation coefficient. (F and G) Transcription inhibitor Actinomycin D was used to assess the half-life period of circ_0000745 and its matched linear form SPECC1 mRNA. The expression of circ_0000745 and SPECC1 in cells after Actinomycin D treatment was examined by RT-qPCR. (H and I) RNA samples extracted from cells were equally divided into two parts and then digested with RNase R or not. The resistance of circ_0000745 and SPECC1 to RNase R was assessed by RT-qPCR. (J and K) The distribution proportion of circ_0000745 in nuclear fraction and cytoplasmic fraction in Kasumi-1 and KG-1 cells was evaluated. *P < 0.05.
Circ_0000745 interference restrains cell cycle progression, glycolytic metabolism and induces apoptosis and ferroptosis in ALL cells
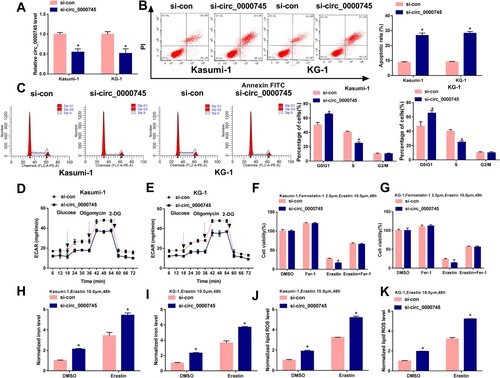
We silenced circ_0000745 using si-circ_0000745 to perform loss-of-function experiments. The transfection with si-circ_0000745 notably reduced the level of circ_0000745 in ALL cells compared with that in si-con group ((A)). The apoptotic rate was markedly elevated with the interference of circ_0000745 than that in si-con group ((B)). The percentage of ALL cells at G0/G1 phase was elevated with the knockdown of circ_0000745, and circ_0000745 silencing decreased the proportion of ALL cells at S phase ((C)), suggesting that circ_0000745 knockdown blocked cell cycle progression from G0/G1 phase to S phase. The metabolism of cancer cells is notably different from their normal counterparts. Cancer cells convert their metabolic phenotype from oxidative phosphorylation to glycolysis, even in the presence of oxygen, which is known as the Warburg effect [Citation25]. The Warburg effect provides growth advantage for tumors in hypoxic tumor microenvironment, and it also reduces the production of reactive oxygen species in mitochondria [Citation26, Citation27]. We then analyzed the effect of circ_0000745 silencing on the glycolytic metabolism of ALL cells. Circ_0000745 knockdown suppressed the ECAR in ALL cells ((D,E)), demonstrating that circ_0000745 silencing restrained glycolysis of ALL cells. In addition, the influence of circ_0000745 interference on the ferroptosis of ALL cells was explored. We treated circ_0000745-silenced ALL cells with 2 μM Ferrostatin-1 and 10 μM Erastin for 48 h, and we found that circ_0000745 interference contributed to Erastin-induced growth inhibition in ALL cells ((F,G)). Circ_0000745 silencing facilitated Erastin-induced elevation of intracellular levels of iron and lipid ROS ((H–K)), suggesting that circ_0000745 knockdown accelerated ferroptosis of ALL cells. These findings together demonstrated that circ_0000745 silencing inhibited cell cycle progression and glycolysis and promoted the apoptosis and ferroptosis of ALL cells.
Figure 2. Circ_0000745 interference restrains cell cycle progression, glycolytic metabolism and induces apoptosis and ferroptosis in ALL cells. (A–K) Kasumi-1 and KG-1 cells were transfected with si-con or si-circ_0000745. (A) The expression of circ_0000745 was determined by RT-qPCR. (B) Cell apoptosis was analyzed by flow cytometry. (C) Flow cytometry was used to assess cell cycle progression. (D and E) Cell glycolysis was analyzed through measuring the ECAR in transfected ALL cells. (F and G) Transfected ALL cells were treated with 2 μM Ferrostatin-1 and 10 μM Erastin for 48 h, and cell viability was assessed by MTT assay. (H and I) The intracellular iron concentration was analyzed after treating transfected ALL cells with 10 μM Erastin for 48 h by Iron Analysis Kit. (J and K) The intracellular level of lipid ROS was assessed by BODIPYC11 dye after stimulating transfected ALL cells with 10 μM Erastin for 48 h. *P < 0.05.
miR-494-3p is a target of circ_0000745
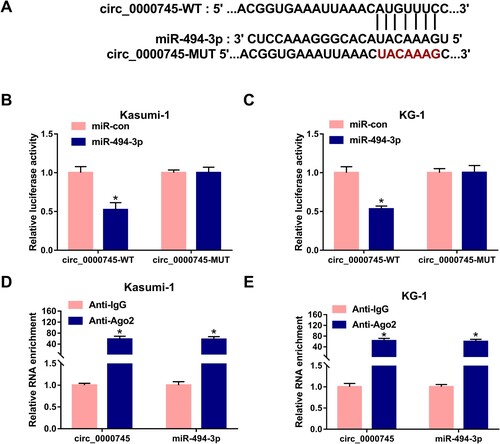
It has been widely accepted that circRNAs can regulate cell biological behaviors by acting as miRNA sponges [Citation10, Citation11]. The target interaction between circ_0000745 and miR-494-3p was predicted by Circular RNA Interactome database ((A)). The transfection with miR-494-3p remarkably decreased the luciferase activity in circ_0000745-WT transfected group in comparison with that in miR-con and circ_0000745-WT group ((B,C)). However, there was no significant difference in luciferase activity in circ_0000745-MUT group with the co-transfection of miR-con or miR-494-3p ((B,C)), suggesting that miR-494-3p interacted with circ_0000745 via the predicted sequence. Ago2 antibody was used to pull down RNA-induced silencing complex (RISC) which contained miR-494-3p, and we tested the level of circ_0000745 to analyze if circ_0000745 interacted with miR-494-3p in RISC. As shown in (D,E), circ_0000745 and miR-494-3p were simultaneously enriched in Anti-Ago2 group, suggesting that miR-494-3p bound to circ_0000745. Collectively, circ_0000745 interacted with miR-494-3p in ALL cells.
Figure 3. miR-494-3p is a target of circ_0000745. (A) miR-494-3p was predicted to interact with circ_0000745 by Circular RNA Interactome database. (B and C) Dual-luciferase reporter assay was used to validate if miR-494-3p bound to circ_0000745 in ALL cells. (D and E) RIP assay was performed to confirm the target interaction between circ_0000745 and miR-494-3p in ALL cells. *P < 0.05.
miR-494-3p silencing largely counteracts circ_0000745 knockdown-induced effects in ALL cells
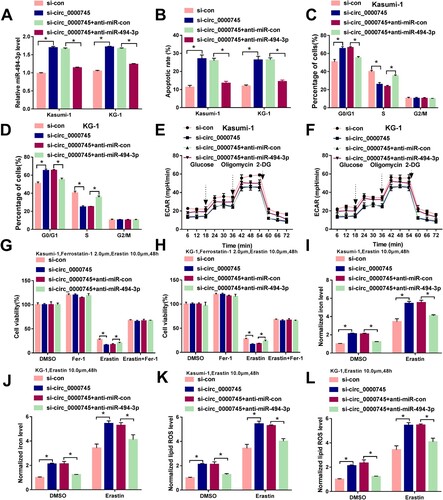
We transfected ALL cells with si-circ_0000745 and anti-miR-494-3p to perform compensation experiments. Circ_0000745 interference up-regulated the expression of miR-494-3p, and the addition of anti-miR-494-3p decreased the level of miR-494-3p in ALL cells ((A)). Circ_0000745 knockdown-induced apoptosis was largely suppressed by the inhibition of miR-494-3p ((B)). The introduction of anti-miR-494-3p largely recovered the proportion of ALL cells at S phase ((C,D)), suggesting that circ_0000745 silencing-mediated suppression in cell cycle progression was largely reversed by the addition of anti-miR-494-3p. miR-494-3p silencing also rescued the glycolytic rate of circ_0000745-silenced ALL cells ((E,F)). Circ_0000745 interference contributed to Erastin-induced suppressive effect on cell viability, and this phenomenon was largely attenuated by the addition of anti-miR-494-3p ((G,H)). miR-494-3p silencing also counteracted circ_0000745 interference-induced up-regulation in the concentrations of iron and lipid ROS in Erastin-treated ALL cells ((I–L)). Taken together, circ_0000745 silencing suppressed ALL progression partly through up-regulating miR-494-3p in vitro.
Figure 4. miR-494-3p silencing largely counteracts circ_0000745 knockdown-induced effects in ALL cells. (A–L) ALL cells were transfected with si-con, si-circ_0000745, si-circ_0000745+anti-miR-con or si-circ_0000745+anti-miR-494-3p. (A) The expression of miR-494-3p was determined via RT-qPCR. (B–D) Cell apoptosis and cell cycle progression were analyzed by flow cytometry. (E and F) ECAR was analyzed to assess cellular glycolytic metabolism. (G and H) Cell viability was analyzed by MTT assay in ALL cells stimulated by 2 μM Ferrostatin-1 and 10 μM Erastin for 48 h. (I–L) Transfected ALL cells were treated with 10 μM Erastin for 48 h. The intracellular levels of iron and lipid ROS were analyzed by Iron Analysis Kit and BODIPYC11 dye. *P < 0.05.
miR-494-3p binds to NET1
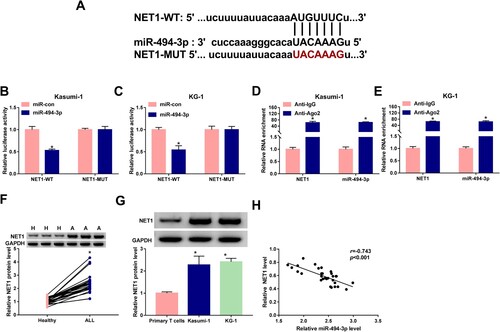
The sites ‘AUGUUUC’ in NET1 3’ untranslated region (3’UTR) were predicted to bound to the sites ‘UACAAAG’ in miR-494-3p by StarBase database ((A)). The luciferase activity was markedly reduced in NET1-WT group with the co-transfection of miR-494-3p rather than miR-con, while luciferase activity remained unchanged in NET1-MUT group with the co-transfection of miR-494-3p or miR-con ((B,C)), demonstrating that miR-494-3p interacted with NET1 3’UTR in ALL cells. The target relationship between miR-494-3p and NET1 was also validated by RIP assay ((D,E)). NET1 protein expression was significantly elevated in ALL patients in comparison with that in healthy controls ((F)). Compared with primary T cells, NET1 protein level was notably up-regulated in two ALL cell lines ((G)). There was negative correlation between the expression of miR-494-3p and NET1 ((H)). Collectively, NET1 was a target of miR-494-3p in ALL cells.
Figure 5. miR-494-3p binds to NET1. (A) The target interaction between NET1 and miR-494-3p was predicted by StarBase database. (B–E) The interaction between NET1 and miR-494-3p was confirmed by dual-luciferase reporter assay and RIP assay. (F) Western blot assay was performed to measure the protein level of NET1 in ALL patients and healthy volunteers. (G) The protein expression of NET1 was determined in Kasumi-1, KG-1 and primary T cells by Western blot assay. (H) Spearman’s correlation coefficient was used to assess the linear correlation between the levels of miR-494-3p and NET1. *P < 0.05.
miR-494-3p overexpression-mediated effects in ALL cells are partly reversed by the addition of NET1 plasmid
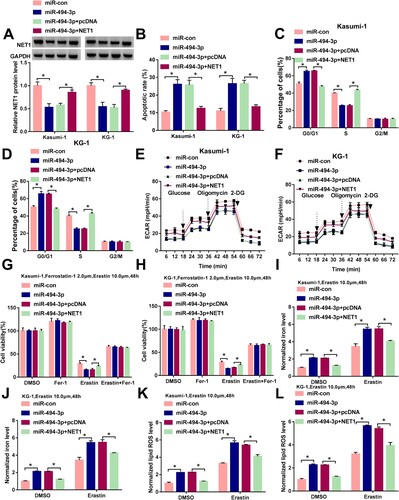
As shown in (A), the addition of NET1 plasmid partly rescued the expression of NET1 in miR-494-3p-overexpressed ALL cells. miR-494-3p overexpression induced cell apoptosis and suppressed cell cycle progression, while the addition of NET1 plasmid partly counteracted miR-494-3p overexpression-induced effects ((B–D)). miR-494-3p overexpression inhibited glycolytic rate, while cellular glycolytic metabolism was partly recovered with the accumulation of NET1 ((E,F)). miR-494-3p accumulation aggravated Erastin-induced growth inhibition in ALL cells, and cell viability was partly recovered with the addition of NET1 plasmid ((G,H)). miR-494-3p overexpression promoted Erastin-induced elevation of iron concentration and lipid ROS level, while these effects were partly counteracted by the addition of NET1 plasmid ((I–L)). These findings suggested that miR-494-3p promoted apoptosis and ferroptosis and suppressed cell cycle progression and glycolysis partly through decreasing the expression of NET1.
Figure 6. miR-494-3p overexpression-mediated effects in ALL cells are partly reversed by the addition of NET1 plasmid. (A–L) Kasumi-1 and KG-1 cells were transfected with miR-con, miR-494-3p, miR-494-3p+pcDNA or miR-494-3p+NET1. (A) Western blot assay was conducted to measure the protein expression of NET1 in transfected ALL cells. (B-D) Cell apoptotic rate and cell cycle progression were analyzed by flow cytometry. (E and F) ECAR was assessed to analyze cell glycolytic rate. (G and H) After treating ALL cells with 2 μM Ferrostatin-1 and 10 μM Erastin for 48 h, MTT assay was used to analyze cell viability. (I–L) Transfected ALL cells were stimulated with 10 μM Erastin for 48 h, and the concentrations of intracellular iron and lipid ROS were analyzed by Iron Analysis Kit and BODIPYC11 dye. *P < 0.05.
NET1 is regulated by circ_0000745/miR-494-3p axis in ALL cells
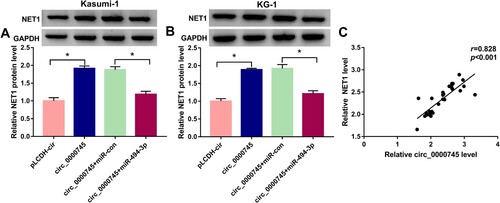
We transfected ALL cells with circ_0000745 alone or together with miR-494-3p. Circ_0000745 overexpression elevated the expression of NET1 protein, and this promoting effect was partly alleviated by the addition of miR-494-3p mimics ((A,B)). NET1 expression was positively correlated with the expression of circ_0000745 ((C)). Collectively, circ_0000745 up-regulated the expression of NET1 protein partly through sponging miR-494-3p in ALL cells.
Figure 7. NET1 is regulated by circ_0000745/miR-494-3p axis in ALL cells. (A and B) Western blot assay was utilized to measure the expression of NET1 in ALL cells transfected with pLCDH-cir, circ_0000745, circ_0000745+miR-con or circ_0000745+miR-494-3p. (C) The linear correlation between the expression of circ_0000745 and NET1 was evaluated by Spearman’s correlation coefficient. *P < 0.05.
Discussion
The majority of the human transcriptome is non-coding RNA and does not have the ability to encode proteins [Citation28]. CircRNAs are a special group of non-coding RNAs derived from the cyclization of exons or introns [Citation29]. Accumulating studies demonstrated that circRNAs are implicated in the initiation and development of many malignancies [Citation30, Citation31]. As for leukemia, Ping et al. reported that circ_0009910 interference restrains the development of acute myeloid leukemia by up-regulating miR-20a-5p [Citation32]. Cao et al. found that circ_0009910 contributes to the imatinib resistance of chronic myeloid leukemia by sponging miR-34a-5p [Citation33]. Nevertheless, the studies on the roles of circRNAs in ALL development are still limited. Liu et al. found that circ_0000745 expression is elevated in ALL cells, and high expression of circ_0000745 promotes the proliferation capacity of ALL cells through activating ERK signaling [Citation9]. Consistent with the previous study, we found that circ_0000745 expression was significantly up-regulated in ALL patients and cell lines. Circ_0000745 was majorly distributed in the cytoplasm of ALL cells, which implied that circ_0000745 might serve as a miRNA sponge. Circ_0000745 interference induced cell apoptosis and suppressed cell cycle progression and glycolysis of ALL cells. Ferroptosis is considered to be an apoptosis-independent cell death form [Citation34]. We subsequently analyzed the role of circ_0000745 on the ferroptosis of ALL cells. Circ_0000745 interference aggravated Erastin-induced ferroptosis in ALL cells.
It is well established that circRNAs play important roles in regulating gene expression by serving as miRNA sponges, and circRNAs/miRNAs/mRNAs axis has been demonstrated to play a pivotal role in tumorigenesis [Citation35, Citation36]. For example, circ-BPTF is reported to contribute to bladder cancer development by elevating RAB27A expression via sponging miR-31-5p [Citation37]. miR-494-3p was identified to be a target of circ_0000745 in this study. Shen et al. claimed that miR-494-3p hampers the proliferation and motility of prostate cancer cells by targeting CXCR4 [Citation38], suggesting the anti-tumor role of miR-494-3p in prostate cancer. However, Lin et al. found that miR-494-3p contributes to the hyper-activation of PI3K/AKT signaling and hepatocellular carcinoma development by targeting PTEN [Citation39]. He et al. demonstrated that miR-494-3p facilitates the growth and motility of nasopharyngeal carcinoma by targeting Sox7 [Citation40]. These studies demonstrated that miR-494-3p might play diverse and even opposite role in different malignancies. miR-494 is reported to be down-regulated in chronic lymphocytic leukemia cells [Citation15]. We observed that miR-494-3p expression was decreased in ALL patients and cell lines, which was in agreement with the previous study [Citation15]. Evidenced by rescue experiments, we found that miR-494-3p silencing partly reversed circ_0000745 silencing-mediated anti-tumor effects in ALL cells, demonstrating that circ_0000745 interference induced the apoptosis and ferroptosis and suppressed cell cycle progression and glycolysis partly by up-regulating miR-494-3p.
NET1 was confirmed as a target of miR-494-3p in this study for the first time. Previous studies identified NET1 as an oncogene in multiple malignancies, including gastric cancer and ALL. Zong et al. reported that NET1 contributes to gastric cancer development through regulating RhoA signaling [Citation41]. In ALL, Sun et al. demonstrated that NET1 promotes the proliferation ability and chemoresistance of ALL cells [Citation20]. We observed that NET1 was highly expressed in ALL patients and cell lines. miR-494-3p overexpression restrained cell cycle progression and glycolysis and induced the apoptosis and ferroptosis of ALL cells, further indicating that miR-494-3p played a tumor suppressor role in ALL. Moreover, the addition of NET1 overexpression plasmid largely overturned miR-494-3p overexpression-mediated anti-tumor effects in ALL cells, suggesting that miR-494-3p hampered ALL progression partly by down-regulating NET1. Finally, we found that circ_0000745 could positively regulate NET1 expression by sponging miR-494-3p in ALL cells.
However, some limitations existed in the current research. We only analyzed the expression of circ_0000745/miR-494-3p/NET1 axis in the peripheral blood samples of ALL patients and healthy volunteers, but did not detect their expression in the bone marrow samples. Furthermore, there were no clinical data about the association between the expression of circ_0000745/miR-494-3p/NET1 axis and the clinico-pathologic features of ALL patients. In vivo experiments were lacking in this study. In future, more experiments are needed to verify the findings in the current study.
In conclusion, our study provided the first evidence that circ_0000745 promoted cell cycle progression and glycolytic metabolism and inhibited the apoptosis and ferroptosis of ALL cells by regulating miR-494-3p/NET1 axis. Circ_0000745/miR-494-3p/NET1 axis may provide novel potential targets for the diagnosis and treatment of ALL.
Acknowledgements
This study was permitted by the Ethics Committee of Xiangyang NO.1 People’s Hospital (ethics approval number: 2020KY028).
Disclosure statement
No potential conflict of interest was reported by the author(s).
Data availability statement
The datasets used and analyzed during the current study are available from the corresponding author on reasonable request.
References
- Duan Y, Dong X, Nie J, et al. Wee1 kinase inhibitor MK-1775 induces apoptosis of acute lymphoblastic leukemia cells and enhances the efficacy of doxorubicin involving downregulation of Notch pathway. Oncol Lett. 2018;16:5473–5481.
- Einsiedel HG, von Stackelberg A, Hartmann R, et al. Long-term outcome in children with relapsed ALL by risk-stratified salvage therapy: results of trial acute lymphoblastic leukemia-relapse study of the Berlin-Frankfurt-Münster Group 87. J Clin Oncol. 2005;23:7942–7950.
- Liu Q, Geng P, Shi L, et al. miR-29 promotes osteosarcoma cell proliferation and migration by targeting PTEN. Oncol Lett. 2019;17:883–890.
- Qin L, Lin J, Xie X. CircRNA-9119 suppresses poly I:C induced inflammation in Leydig and Sertoli cells via TLR3 and RIG-I signal pathways. Mol Med. 2019;25:28.
- Vo JN, Cieslik M, Zhang Y, et al. The landscape of circular RNA in cancer. Cell. 2019;176:869–881.
- Westholm JO, Miura P, Olson S, et al. Genome-wide analysis of drosophila circular RNAs reveals their structural and sequence properties and age-dependent neural accumulation. Cell Rep. 2014;9:1966–1980.
- Aufiero S, Reckman YJ, Pinto YM, et al. Circular RNAs open a new chapter in cardiovascular biology. Nat Rev Cardiol. 2019;16:503–514.
- Li W, Zhong C, Jiao J, et al. Characterization of hsa_circ_0004277 as a new biomarker for acute myeloid leukemia via circular RNA profile and bioinformatics analysis. Int J Mol Sci. 2017;18:597.
- Liu X, Zhou C, Li Y, et al. Upregulation of circ-0000745 in acute lymphoblastic leukemia enhanced cell proliferation by activating ERK pathway. Gene. 2020;751:144726.
- Hansen TB, Jensen TI, Clausen BH, et al. Natural RNA circles function as efficient microRNA sponges. Nature. 2013;495:384–388.
- Panda AC. Circular RNAs act as miRNA sponges. Adv Exp Med Biol. 2018;1087:67–79.
- Ambros V. MicroRNA pathways in flies and worms: growth, death, fat, stress, and timing. Cell. 2003;113:673–676.
- Volinia S, Calin GA, Liu CG, et al. A microRNA expression signature of human solid tumors defines cancer gene targets. Proc Natl Acad Sci U S A. 2006;103:2257–2261.
- Huang Y, Zou Y, Zheng R, et al. MiR-137 inhibits cell proliferation in acute lymphoblastic leukemia by targeting JARID1B. Eur J Haematol. 2019;103:215–224.
- Zhu DX, Zhu W, Fang C, et al. miR-181a/b significantly enhances drug sensitivity in chronic lymphocytic leukemia cells via targeting multiple anti-apoptosis genes. Carcinogenesis. 2012;33:1294–1301.
- Chan AM, Takai S, Yamada K, et al. Isolation of a novel oncogene, NET1, from neuroepithelioma cells by expression cDNA cloning. Oncogene. 1996;12:1259–1266.
- Gilcrease MZ, Kilpatrick SK, Woodward WA, et al. Coexpression of alpha6beta4 integrin and guanine nucleotide exchange factor Net1 identifies node-positive breast cancer patients at high risk for distant metastasis. Cancer Epidemiol Biomark Prev. 2009;18:80–86.
- Shen SQ, Li K, Zhu N, et al. Expression and clinical significance of NET-1 and PCNA in hepatocellular carcinoma. Med Oncol. 2008;25:341–345.
- Fang L, Zhu J, Ma Y, et al. Neuroepithelial transforming gene 1 functions as a potential prognostic marker for patients with non-small cell lung cancer. Mol Med Rep. 2015;12:7439–7446.
- Sun H, Zhang Z, Luo W, et al. NET1 enhances proliferation and chemoresistance in acute lymphoblastic leukemia cells. Oncol Res. 2019;27:935–944.
- Zhang S, Cheng J, Quan C, et al. circCELSR1 (hsa_circ_0063809) contributes to paclitaxel resistance of ovarian cancer cells by regulating FOXR2 expression via miR-1252. Mol Ther Nucleic Acids. 2020;19:718–730.
- Li D, Zhang J, Li J. Role of miRNA sponges in hepatocellular carcinoma. Clin Chim Acta. 2020;500:10–19.
- Yang WS, SriRamaratnam R, Welsch ME, et al. Regulation of ferroptotic cancer cell death by GPX4. Cell. 2014;156:317–331.
- Dixon SJ, Lemberg KM, Lamprecht MR, et al. Ferroptosis: an iron-dependent form of nonapoptotic cell death. Cell. 2012;149:1060–1072.
- Warburg O. On the origin of cancer cells. Science. 1956;123:309–314.
- Deberardinis RJ, Sayed N, Ditsworth D, et al. Brick by brick: metabolism and tumor cell growth. Curr Opin Genet Dev. 2008;18:54–61.
- DeBerardinis RJ, Thompson CB. Cellular metabolism and disease: what do metabolic outliers teach us? Cell. 2012;148:1132–1144.
- Esteller M. Non-coding RNAs in human disease. Nat Rev Genet. 2011;12:861–874.
- Qu S, Yang X, Li X, et al. Circular RNA: a new star of noncoding RNAs. Cancer Lett. 2015;365:141–148.
- Zhang HD, Jiang LH, Sun DW, et al. CircRNA: a novel type of biomarker for cancer. Breast Cancer. 2018;25:1–7.
- Kristensen LS, Hansen TB, Venø MT, et al. Circular RNAs in cancer: opportunities and challenges in the field. Oncogene. 2018;37:555–565.
- Ping L, Jian-Jun C, Chu-Shu L, et al. Silencing of circ_0009910 inhibits acute myeloid leukemia cell growth through increasing miR-20a-5p. Blood Cells Mol Dis. 2019;75:41–47.
- Cao HX, Miao CF, Sang LN, et al. Circ_0009910 promotes imatinib resistance through ULK1-induced autophagy by sponging miR-34a-5p in chronic myeloid leukemia. Life Sci. 2020;243:117255.
- Shaw AT, Winslow MM, Magendantz M, et al. Selective killing of K-ras mutant cancer cells by small molecule inducers of oxidative stress. Proc Natl Acad Sci USA. 2011;108:8773–8778.
- Xiong DD, Dang YW, Lin P, et al. A circRNA-miRNA-mRNA network identification for exploring underlying pathogenesis and therapy strategy of hepatocellular carcinoma. J Transl Med. 2018;16:220.
- Zhong Y, Du Y, Yang X, et al. Circular RNAs function as ceRNAs to regulate and control human cancer progression. Mol Cancer. 2018;17:79.
- Bi J, Liu H, Cai Z, et al. Circ-BPTF promotes bladder cancer progression and recurrence through the miR-31-5p/RAB27A axis. Aging. 2018;10:1964–1976.
- Shen PF, Chen XQ, Liao YC, et al. MicroRNA-494-3p targets CXCR4 to suppress the proliferation, invasion, and migration of prostate cancer. Prostate. 2014;74:756–767.
- Lin H, Huang ZP, Liu J, et al. MiR-494-3p promotes PI3 K/AKT pathway hyperactivation and human hepatocellular carcinoma progression by targeting PTEN. Sci Rep. 2018;8:10461.
- He H, Liao X, Yang Q, et al. MicroRNA-494-3p promotes cell growth, migration, and invasion of nasopharyngeal carcinoma by targeting Sox7. Technol Cancer Res Treat. 2018;17:1–10.
- Zong W, Feng W, Jiang Y, et al. LncRNA CTC-497E21.4 promotes the progression of gastric cancer via modulating miR-22/NET1 axis through RhoA signaling pathway. Gastric Cancer. 2020;23:228–240.