
ABSTRACT
Objectives
The high frequency of chemotherapy resistance is ultimately responsible for clinical relapse in acute lymphoblastic leukemia (ALL). Nevertheless, the molecular mechanism relevant to glucocorticoid (GC) resistance remains ambiguous.
Methods
Quantitative real-time polymerase chain reaction and Western blot were performed to detect the expressions of paraoxonase 2 (PON2), Bcl-2 and Bax. shRNA was used to knockdown PON2 expression in SUP-B15 and REH cell. CCK-8 and flow cytometry assay were conducted to monitor the changes of proliferation and apoptosis in ALL cells. The growth of ALL REH cells in vivo was determined using transplanted tumor model.
Results
This study was designed to identify GC resistance-associated genes by means of the transcriptome chip from the public Gene Expression Omnibus database, and preliminarily investigation of dexamethasone (DEX)-resistance mechanism in ALL. We disclosed that PON2 expression was elevated in ALL patients and especially higher in DEX-resistance ALL patients. Then, cell apoptosis assay suggested that silencing of PON2 dramatically promoted in DEX-resistant ALL cells apoptosis and the activity of Caspase 3 induced by DEX administration. In xenograft tumor model, PON2 knockdown significantly reduced DEX-resistant ALL cells growth in immunodeficient mice.
Conclusions
Collectively, inhibition of PON2 may represent a novel method to restore the sensitivity of treatment-resistant ALL to GC-induced cell death.
Introduction
Acute lymphoblastic leukemia (ALL), including B-cell lymphoblastic leukemia (B-ALL) and T-cell lymphoblastic leukemia (T-ALL), is a heterogeneous disease characterized by malignant clones of primitive and immature lymphocytes [Citation1,Citation2]. Co-administration with chemotherapy agents, glucocorticoids (GCs) help to attain clinical remission, and the sensitivity toward GCs treatment is considered as a meaningful prognostic factor [Citation3]. However, patients unresponsive to GCs often relapse and exhibit inferior prognosis [Citation4,Citation5]. Hence, identification the molecular mechanisms underlying GC resistance is crucial and will help to develop promising strategies for re-sensitizing GCs-resistant cells to GCs therapy.
To seek GCs resistance mechanism, we compared gene expression profiles from ALL patients either in vitro resistant or sensitive to GC. We used public databases Gene Expression Omnibus database (GEO) to find the dysregulated paraoxonase 2 (PON2) in ALL. PON2 has been reported to be associated with cancer cell invasion, metastasis, drug resistance and tumor therapy [Citation6,Citation7]. In various leukemia gene expression profiling studies, PON2 is identified to be upregulated in pediatric ALL [Citation8]. Importantly, PON2 is identified as a member of a very small group of upregulated genes that characterized pediatric patients with ALL with very poor outcome prognosis [Citation9]. In another form of leukemia, chronic myeloid leukemia, PON2 is also identified in an outcome-specific gene expression signature of primary imatinib-resistant patients [Citation10]. Moreover, a marked overexpression of PON2 is observed in lymphocytes infected with T-cell leukemia virus [Citation11]. Recently, Pan et al. demonstrated that in pediatric high-risk B-ALL and adult B-ALL cases, high expression levels of PON2 predicts unfavorable clinical outcomes. In B-ALL mouse models, deletion of PON2 compromises proliferation, colony formation, and leukemia initiation in transplant recipient mice [Citation12]. All of these considerations demonstrate that the abnormal PON2 expression is implicated in the initiation and deterioration of leukemia.
In our present study, we revealed that the expression of PON2 was elevated in DEX-resistant ALL cell lines and peripheral blood lymphocyte cells from ALL patients. Silencing PON2 significantly increased the sensitivity of DEX-resistant ALL cells to DEX. Overall, our experimental results manifest that PON2 inhibition serves as a promising therapeutic strategy for combating ALL by improving DEX therapeutic effects and/or overcoming DEX-resistance.
Materials and methods
Screening of gene expression chips in the GEO database
Gene chip data were obtained from the GEO database (https://www.ncbi.nlm.nih.gov/geo/) by searching the key words ‘GC sensitive’ and ‘resistant ALL’, which gave rise to two sets of expression profile data (GSE94302 and GSE5820) [Citation13,Citation14]. To be specific, the chip data of GSE5820 were based on GPL96: [HG-U133A] Affymetrix human genome U133A array, containing 29 samples and successfully detecting 21,066 genes. The chip data from GSE94302 were based on GPL10558 Illumina HumanHT-12 V4.0 array, which contained 99 samples by involving 31,266 genes.
Patients and peripheral blood lymphocytes samples
Fifty diagnosed ALL patients frossm the Weifang Maternal and Child health Hospital (Shandong, China) were included in this study. Peripheral blood lymphocytes were collected at initial diagnosis, complete remission or at relapse after the induction therapy after Ficoll-Hypaque (Pharmacia, Uppsala, Sweden) separation of peripheral blood, respectively [Citation15]. Sensitive patients were diagnosed if complete remission after standard induction treatment for twenty-eight days without recurrence in a short time. Patients whose complete remission was not attained after induction treatment or repeated recurrence occurred were diagnosed as resistant group [Citation16]. Normal peripheral blood lymphocytes samples (n = 25) were collected from individuals with suspected hematologic malignancy but were actually normal. Informed consents were obtained from participants prior to this study. The clinical features of these cases are listed in .
Table 1. Patients’ characteristics.
Cell culture and reagents
Human leukemia cell lines, REH (DEX-resistant) and SUP-B15 (DEX-sensitive) were purchased from DSMZ (Braunschweig, Germany) [Citation17]. SUP-B15 cells were maintained in Iscove's modified Dulbecco's medium (Thermo Fisher Scientific, Waltham, MA, USA), and REH cells were maintained in 1640 medium supplemented with 10% FBS and 1% penicillin/streptomycin in an incubator at 37°C with 95% humidity and 5% CO2. HEK-293 T cells (Clontech) were grown under the same conditions in DMEM. Dexamethasone (DEX) was bought from Selleck (Shanghai, China). SUP-B15 cells were cultured with DEX, and doses were doubled when the proliferate rate of treated cells was equal to parental cells. The doses were increased at regular intervals until 5 µM concentration was reached [Citation18]. The resistant cell lines (SUP-B15R) was further maintained with medium without DEX for two weeks.
shRNA transfection
MISSION® shRNA containing PON2-shRNA pLKO.1-puro (sh-PON2) and control non-targeting shRNA construct NC-pLKO.1-puro (sh-NC) were provided by Sigma (St. Louis, MO, USA). The PON2 shRNA sequence was 5′-CCGGGCACTCAGAAATCGACTTAAACTCGAGTTTAAGTCGATTTCTGAGTGCTTTTTG-3′. The sh-NC sequence was 5′-GCGCGATAGCGCTAATAATTT-3′. Briefly, HEK-293 T were transfected with 12 µg lentiviral packaging sh-NC vector or sh-PON2 using polyethylenimine (Sigma-Aldrich, St Louis, MO, USA). At 48 h after transfection, lentiviral particles were harvested and transfected into SUP-B15R or REH cells for 48 h. To produce PON2 stable knockdown ALL cell line, transfected REH or SUP-B15R cells were cultured with 2 μg/mL puromycin (Sigma) for two weeks and the positive clones were picked for identification.
Cell viability
After transfection with PON2 shRNA, REH or SUP-B15R cell lines (3000 cells/per well) were seeded into the 96-well plates for overnight. Then, cells were treated with vehicle (0.1% DMSO) or DEX at different concentrations (0.001, 0.01, 0.1, 1, 10 and 100 μM) for 24 h, followed by assessment of the inhibitory effects of DEX on cells using cell counting kit-8 (CCK-8) kit (Biyuntian Biotechnology, Shanghai, China) according to the manufacturer’s instruction.
Soft agar assay
One mL of agar (Lonzsas, Basel, Switzerland) was dissolved in medium and added into 6-well plates to form bottom layer (0.5% agarose). After the bottom agar layer solidified, cells (1 × 10³) were resuspended in 1 mL of top layer agar (0.37% agarose) and then plated into plates. After the top layer agar solidified, culture medium (1 mL) was added into plates. Medium was changed every three days. After four weeks, cells were stained by 0.1% crystal violet for 2 h, and the cell colonies was counted.
Apoptosis assay
The apoptosis of SUP-B15R and RS4-11 cells was measured by means of an Annexin-V-FITC/PI staining kit (Biyuntian Biotechnology). After treating with DEX (1 μM) for 24 h, cells were collected and resuspended in 500 μL of binding buffer. Cells were stained with annexin-V-FITC solution (5 μL) and PI solution (10 μL) in dark for 15 min. The apoptosis rate was measured using FACS Calibur cytometer (BD Biosciences, San Jose, CA, USA).
Caspase-3 activity analysis
Cells were treated with DEX (1 μM) 24 h. The activity of caspase-3 was determined using a Caspase-3 Colorimetric Assay Kit (Nanjing KeyGen Biotech Co., Ltd., Nanjing, China) according to the protocol described.
RNA extraction and qRT-PCR
Total RNA was isolated using the RNeasy Mini kit (Qiagen Ltd., Manchester, UK) according to the manufacturer’s instructions, followed by reverse transcription into cDNA using a cDNA reverse transcription kit (Takara Bio, Dalian, China). Quantitative real-time polymerase chain reaction (qRT-PCR) was carried out using SYBR GREEN Mastermix kit (Life Technologies, Waltham, MA). The primers used in this study was as follows: PON2: Forward primer (F): 5′-AATCCACATGGCATCAGCAC-3′, Reverse primer (R): 5′-CGGTCCAACAGCTGTGATGT-3′; Bcl-2: F: 5′-CATGTGTGTGGAGAGCGTCA-3′, R: 5′-ATCCCAGCCTCCGTTATCCT-3′; NR3C1: F: 5′-ACAGCATCCCTTTCTCAACAG-3′, R: 5′-AGATCCTTGGCACCTATTCCAAT-3′; Bax: F: 5′-CAGCAAACTGGTGCTCAAGG-3′, R: 5′-CAACCACCCTGGTCTTGGAT-3′; EMP3: F: 5′-CCTGAATCTCTGGTACGACTGC-3′, R: 5′-GCCATTCTCGCTGACATTACTG-3′; HOXA5: F: 5′-AACTCATTTTGCGGTCGCTAT-3′, R: 5′-TCCCTGAATTGCTCGCTCAC-3′; GAPDH: F: 5′-GGAGCGAGATCCCTCCAAAAT-3′, R: 5′-GGCTGTTGTCATACTTCTCATGG-3′; GAPDH was used as internal reference. Relative gene expression was calculated by the 2-ΔΔCt method.
Western blotting
Total protein was extracted from cells using lysing buffer. Equal amounts of protein lysates were separated by 10% SDS-PAGE and transferred onto PVDF membranes. Membranes were blocked with 5% nonfat dry milk and incubated with Bcl-2, Bax, or PON2 antibody (Abcam, Cambridge, UK) overnight. After washing with TBST, membranes were incubated with a secondary HRP-labeled antibody (Biyuntian Biotechnology). Finally, bands were measured using a ChemiDoc System (Bio-Rad, Hercules, CA, USA).
Establishment of REH leukemia xenograft model
REH cells stable expressing PON2 shRNA (PON2-KD) (2 × 10⁷/100 μL PBS per mouse) were subcutaneously injected into female NOD/SCID mice (6-week-old, n = 3 mice per group). When the average tumor volume reached 100 mm3, mice received either 15 mg/kg DEX or vehicle (corn oil) by intraperitoneal injection every three days [Citation18–20]. Control mice were treated with vehicle only. The length and width of tumor mass was measured with a caliper. Tumor volume = width2 × length/2. Mice were sacrificed on the 21st day and tumors were subjected for Western blot or immunohistochemical staining.
Xenograft mouse model of leukemia
PON2-KD or wild-type REH cells (2 × 10⁷/100 μL PBS per mouse) were injected into NOD/SCID mice via tail vein (6-week-old, n = 20 mice per group). Experiments conformed to the relevant regulatory standards as approved by the Institutional Animal Care and Use Committee of Shandong Weifang Maternal and Child Health Hospital. Mice received either 15 mg/kg DEX or vehicle (corn oil) by intraperitoneal injection every three days. Control mice were treated with vehicle only. Animals were monitored daily and euthanized upon development of physical signs of significant leukemia burden (>5% weight loss, abnormal posture, decreased activity, labored breathing, and/or hind limb paralysis).
Harvesting of bone marrow cells
All experiments were terminated when the animals displayed symptoms beyond a predetermined humane end point. At the end of experiments, bone marrow was flushed from the femur and tibia of the mice. For estimation of percentage leukemic cells in the bone marrow samples, the cells were stained with antibodies against human CD19 (BD Biosciences, San Jose, CA) and CD10 (BioLegend, San Diego, CA) [Citation21].
Statistical analysis
Data values were expressed as means ± SD. Statistical analysis was performed using GraphPad Prism version 8.1 (GraphPad Software, La Jolla, CA). Student’s t-test was used for statistical analysis. The dose required to inhibit the 50% of the cell viability (half-maximal effective concentration, EC50) was calculated from logarithmic sigmoidal dose–response curves generated using GraphPad Prism 8.1 software. Kaplan–Meier survival curves were drawn to show the overall survival for each group, and the comparison of survival was performed by the log-rank test. P < .05 was considered statistically significant.
Results
High expression of PON2 in DEX-resistant B-ALL
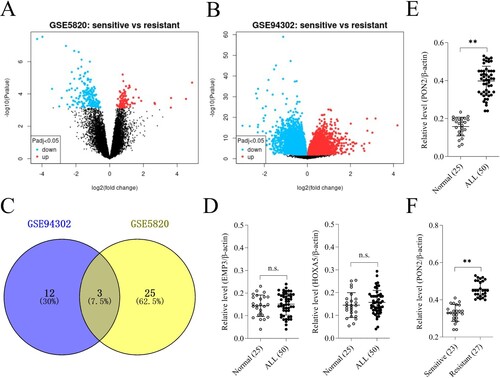
According to the chip data of GSE5820 and GSE94302, there were 7020 DEGs and 1574 DEGs, respectively, with the log FC > 2.0 and P-value < .05 ((a)). After fitting the significantly different genes in the two groups of transcription expression chips, a total of three overlapped genes (PON2, EMP3 and HOXA5) were screened out, including 15 upregulated in GSE94302 and 28 upregulated in GSE5820 ((a, b)). Venn diagram analysis using the Venny diagram plotter (https://bioinfogp.cnb.csic.es/tools/venny/index.html) displayed that three genes (PON2, EMP3 and HOXA5) appeared in two datasets ((c)). To validate the results from the GEO database chip, PON2, EMP3 and HOXA5 genes were assessed in ALL clinical samples. We collected 50 ALL patients’ peripheral blood lymphocytes, which including 23 DEX-sensitive patients and 27 DEX-resistant patients. As shown in (d), the mRNA levels of EMP3 and HOXA5 were not different among the peripheral blood lymphocytes from ALL patients and normal control. The mRNA level of PON2 was upregulated in ALL and especially elevated in DEX-resistant ALL group than that in sensitive patients ((e, f)).
Figure 1. Differentially expressed genes (DEGs) in GSE5820 and GSE94302 data sets. (a-b) Volcano plot of DEGs in GSE5820 and GSE94302. (c) Venn diagram for DEGs visualization. (d) The mRNA levels of EMP3 and HOXA5 in ALL patients and normal control were determined by qRT-PCR. P > .05, no significant (n.s.). (e) The mRNA level of PON2 in ALL patients and normal control was determined by qRT-PCR. **P < .01 compared with normal. (f) qRT-PCR analysis of PON2 in DEX-resistant ALL group and sensitive patients. **P < .01 compared with sensitive group.
PON2 is elevated in DEX-resistant ALL cells
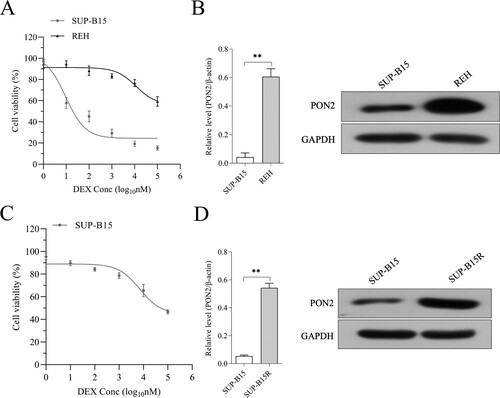
To measure the expression of PON2 in ALL cell lines, we selected DEX-sensitive cell line: SUP-B15 (half-maximal effective concentration (EC50) = 9.3 nM) and the DEX-insensitive cell line REH (EC50 > 100 µM, (a). The expression of PON2 was remarkedly higher in REH than that in SUP-B15 ((b)). After stimulated by increasing concentrations of DEX, we observed that SUP-B15 cultured in the presence of DEX exhibited highly resistant against DEX (EC50 = 94.1 µM, defined as SUP-B15R cell line, (c)). As expected, the level of PON2 was evidently raised in SUP-B15R compared with in parental cell ((d)). Altogether, these data suggest that the dysregulated of PON2 is associated with DEX resistance.
Figure 2. The expression of PON2 in REH and SUP-B15 cell lines. (a) Human ALL cell lines REH and SUP-B15 were treated with DEX (from 0.001 to 100 μM) for 24 hours. Cell viability as determined by CCK-8 assay. (b) The mRNA level and protein expression of PON2 in REH and SUP-B15 was measured by qRT-PCR and Western blot, respectively. (c) SUP-B15 was treated with increasing concentrations (from 1 nM to 5 µM) of DEX for 90 days following 14 days of culture in the absence of DEX. Cell viability as determined by CCK-8 assay. (d) The mRNA level and protein expression of PON2 in SUP-B15 and SUP-B15R was measured by qRT-PCR and Western blot, respectively. **P < .01 compared with SUP-B15.
Silencing PON2 raises the DEX sensitivity of ALL cells
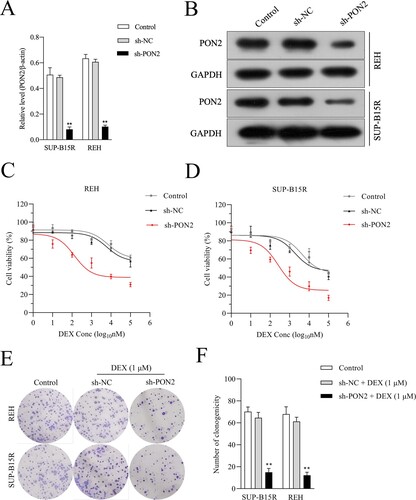
To determine the effects of PON2 on the viability of ALL cells, shRNA target PON2 (sh-PON2) was transfected into REH and SUP-B15R cells. The transfection efficiency was observed by qRT-PCR ((a)) and immunoblotting ((b)). Recently, studies indicated that resistance toward GC in patient with ALL may be caused by lack of GC receptor upregulation upon GC exposure [Citation22,Citation23]. The upregulation of GR mRNA and protein levels has been demonstrated in various cell lines of lymphoid leukemias and has been described as essential for GC-induced apoptosis [Citation24]. We then evaluated the expression of GC receptor, nuclear receptor subfamily 3 group C member 1 (NR3C1) in REH and SUP-B15R cells upon PON2 knockdown. As shown in Supplementary Figure 1, deletion of PON2 failed to raise the mRNA level of NR3C1. Subsequently, we observed that PON2 silencing enhanced REH and SUP-B15R cells sensitivity to DEX as evidenced in CCK-8 assay ((c and d)). Consistently, PON2 silencing enhanced REH and SUP-B15R cells sensitivity to DEX as evidenced in soft agar colony-forming assay ((e, f)).
Figure 3. PON2 knockdown ALL cells are sensitive to DEX. (a-b) Knockdown of PON2 was established using shRNA in REH and SUP-B15R cells and its level was determined by qRT-PCR and Western blot analysis. (c-d) DEX sensitivity was determined using the CCK-8 assay. (e-f) REH and SUP-B15R cells were transfected with either sh-NC or sh-PON2 and then treated with 1 µM DEX. The growth of cells was determined by soft agar colony formation assay. **P < .01 compared with control.
PON2 silencing restores the sensitivity of ALL cell toward DEX-induced apoptosis
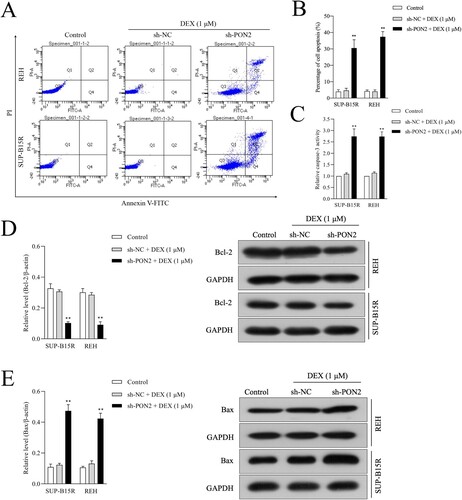
To analyze the influence of PON2 silencing on DEX-induced apoptosis of ALL cells, the apoptosis of cells was determined using flow cytometry. As presented in (a, b), PON2 silencing enhanced SUP-B15R and REH cell sensitivity to DEX. The results displayed that the apoptosis of ALL cells was noticeably increased in PON2 silencing cells while treated with DEX (1 μM) for 24 h compared with the control. Moreover, the activity of caspase-3 was significantly stimulated in PON2 silencing REH and SUP-B15R cells after treated with DEX (1 μM) for 24 h when compared with cells were exposed by DEX ((c)). qRT-PCR and immunoblotting assay were also performed to analyze the expression of apoptosis related proteins, including Bcl-2 and Bax in REH and SUP-B15R cells. The results showed that PON2 knockdown in DEX-exposed REH and SUP-B15R cell distinctly decreased the mRNA level and protein expression of Bcl-2 in ALL cells when compared with DEX treatment ((d)). Nevertheless, PON2 silencing in ALL cell lines raised the mRNA level and expression of Bax in REH and SUP-B15R cells induced by DEX ((e)). Altogether, these observations indicated that, the inhibition of PON2 contributes to restoring the sensitivity in resistant ALL cells to DEX-triggered apoptosis.
Figure 4. Depletion of PON2 promotes sensitive to DEX in ALL cells. (a) REH and SUP-B15R cells were transfected with sh-NC or sh-PON2 and then treated with 1 µM DEX. DEX-treated ALL cells were assayed for cell apoptosis by Annexin-V-FITC and PI staining. Representative flow cytometric analysis was shown. (b) Histograms represent the percentage of apoptosis rate in different treatment groups. (c) The activity of caspase-3 in different treatment groups was measured using a caspase-3 activity assay kit. (d) The mRNA level and protein expression of Bcl-2 was measured using qRT-PCR and Western blotting, respectively. (e) The mRNA level and protein expression of Bax was measured using qRT-PCR and Western blotting, respectively. **P < .01 compared with control.
PON2 knockdown inhibits tumor growth by sensitizing B-ALL cells to DEX in vivo
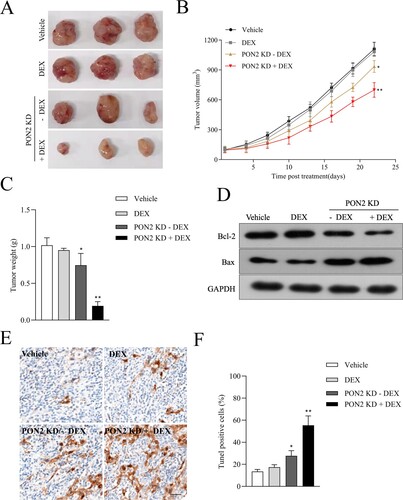
Finally, we probed into the effect of PON2 silencing on REH cells growth in vivo model. Twelve mice were divided into four treatment groups: vehicle, DEX treatment, mice inoculated with PON2 knockdown (PON2-KD) REH cells and combined (mice inoculated with PON2-KD REH cells plus DEX treatment). Tumor growth of REH cells was not inhibited by DEX treatment ((a, b)). In contrast, tumor growth in mice injected with PON2-KD cells was significantly reduced compared with vehicle treatment. The addition of DEX inhibition to PON2-KD group further reduced tumor volume in combined group ((b)). Similarly, the addition of DEX inhibition to PON2-KD group further reduced tumor weight in combined group ((c)). Meanwhile, more dramatic downregulation of Bcl-2 and upregulation of Bax in the combined treatment group corroborated the synergistic effect in combination group ((d)). TUNEL analysis found a higher number of apoptotic cells in combined group ((e, f)). Our in vivo results are consistent with in vitro data suggest that knocking down PON2 inhibits REH tumor progression and sensitizes ALL cells to DEX.
Figure 5. Downregulation of PON2 raises the curative effect of DEX on ALL cell growth in nude mice. (a) Images of tumors from nude mice in four groups. (b) Parental or sh-PON2 stable transfected REH cells were injected subcutaneously into nude mice. After injection, mice were treated with the vehicle or 15 mg/kg DEX. Tumor volume was measured on every three days. (c) Average tumor weight was measured after sacrificing mice on the 21 days after treatment. (d) Bcl-2 and Bax expression in the four groups was detected by Western blotting. (e) TUNEL analysis in the four groups was detected by immunohistochemistry. (f) Histograms represent the percentage of TUNEL positive cells in different treatment groups. *P < .05, **P < .01 compared with vehicle.
PON2 knockdown combination with DEX increases survival in a mouse xenograft ALL model
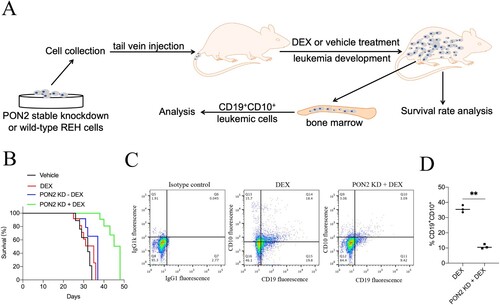
To validate the prolong effect of PON2 knockdown on the DEX administrated ALL cells bearing xenograft tumor model in vivo. Wild-type or sh-PON2 transfected REH cells were injected intravenously into mice via the tail vein and survival was monitored ((a)). As shown in (b), the survival was slightly prolonged in animals transplanted with sh-PON2 REH cells. As expected, PON2 inhibition combination with DEX treatment significantly extended the animal survival (p < .01, compared with DEX group). After terminating the experiment, cells were isolated from the bone marrow of the mice, and the percentage of CD19+CD10+ leukemic cells was monitored by flow cytometry analyzes [Citation21]. As shown in (c and d), PON2 inhibition combination with DEX treatment was found to reduce the load of CD19+CD10+ cells in the bone marrow, compared with bone marrow cells from mice injected with wild-type REH cells. Altogether, these observations indicate that PON2 inhibition combination with DEX treatment delays the progression of leukemia in vivo.
Figure 6. PON2 knockdown combination with DEX increases survival in a mouse xenograft ALL model. (a) The experimental design. (b) Kaplan–Meier survival curves of the overall survival for each group (n = 20) are shown, and comparison of survival between DEX group and PON2-KD + DEX group was performed by log-rank test. (c) End point flow cytometry analysis of CD19+CD10+ leukemic cells in the bone marrow of xenograft ALL mice. Quantitative result represents the percentage of CD19+CD10+ leukemic cells within the total bone marrow cell population of xenograft ALL mice. **P < .01 compared with DEX group.
Discussion
Leukemia, most commonly B-ALL, accounts for about 30% of childhood cancer diagnoses [Citation2]. Although there have been dramatic improvements in ALL outcomes, certain subgroups-particularly those who relapse-fare poorly [Citation2]. Synthetic GCs, such as dexamethasone and prednisolone, are essential drugs in the multi-agent chemotherapy regimens used to treat patients with lymphoid malignancies, including B-cell precursor ALL [Citation25,Citation26]. Cellular resistance to GC has become a major obstacle in reaching successful treatment and prognosis for B-ALL [Citation27]. For example, relapse associated Aurora kinase B (AURKB) blunts the GC sensitivity of ALL cell [Citation3]. After expression profile analysis performed using a cohort of patients suffered from B-ALL, the level of cyclin D1 is elevated in patients undergoing relapse [Citation28]. In addition, the phosphatidylinositol 3-kinase/protein Kinase B/mammalian target of rapamycin (PI3K/AKT/mTOR) signaling pathway is frequently activated in B-ALL and contributes to GC resistance [Citation29]. Although despite intensive research, the biological mechanism behind GC resistance has not yet been fully elucidated. Herein, we disclose that in DEX-resistant ALL, high-level of PON2 is associated with resistance to GC-induced apoptosis.
PON2 has been found to be highly upregulated in gene expression profiling studies addressing pediatric ALL [Citation8]. In our study, bioinformatics analysis was employed to analyze the data set in the GEO database (GSE5820 and GSE94302), the gene expression profiles of drug-resistant and -sensitive B-ALL patients after GC treatment. PON2 gene overexpression in GC-resistant ALL was screened out, which suggested that PON2 played a vital role in the development of ALL. PON2 and is an intracellular enzyme which modulates mitochondrial superoxide anion production and endoplasmic reticulum (ER) stress-caused apoptosis. Upregulation of PON2 has been observed in cancer, and it has been proposed that PON2 is implicated in stress resistance and tumor survival [Citation30]. Downregulation of PON2 leads to a distinct reduction of cell viability and an enhancement of melanoma cell sensitivity to cisplatin [Citation31]. A latest study reported that loss of PON2 function potentiated the effects of DEX in mouse BCR-ABL1-driven B-ALL cells. Similarly, genetic ablation of PON2 in human Ph+ B-ALL cells substantially shifted the dose–response curve for DEX treatment [Citation12].
Analogously, we also demonstrated that PON2 knockdown reverses DEX resistance. Experimental data manifested that PON2 gene silencing significantly decreased the proliferation of ALL cells upon exposed by DEX. Meanwhile, knockdown of PON2 resulted in significantly higher levels of DEX-induced apoptosis in cell lines compared with the control shRNA-treated cells. The in vitro results claim PON2 as a fundamental factor for resistance against DEX therapy in ALL. The activation of intrinsic apoptosis signaling is an important strategy adopted by cells to combat cancer formation. Furthermore, PON2 silencing was correlated with an enhancement of Bax production and reduction of Bcl-2 expression in DEX-treated ALL cells. Importantly, we demonstrated that the combination of PON2 silencing and DEX treatment elicited a stronger antitumor effect in ALL cells compared with DEX treatment only. This study has several limitations. The protein expressions of NR3C1 in REH and SUP-B15R cells were not altered by PON2 knockdown, indicating that the DEX-sensitizing activity of PON2 inhibition is not dependent on NR3C1. Clinical observations suggest the role of increased glucose and energy supply in the etiology of B-ALL and B-ALL relapse [Citation32,Citation33]. Pan et al. demonstrated that PON2 mediates proliferation and survival of B-ALL cells by blocking the interaction between glucose transporter type 1 (GLUT1) and glucose-transport inhibitor stomatin (STOM) to facilitate glucose transport in vitro [Citation12]. Whether glucose transport is implicated, the sensitizing effect of PON2 knockdown in vivo need to be elucidated. Meanwhile, there are not enough clinical cases to demonstrate the prognosis significance of PON2 in DEX-sensitivity and -resistant patients with ALL.
In conclusion, for the first time, PON2 knockdown has been described as a sensitivity enhancer for DEX-induced ALL cell lines apoptosis. Further, PON2 knockdown resulted in elevated levels of DEX-induced apoptosis. We also manifest that knockdown of PON2 enhances the anti-tumor effects of DEX in ALL cells in vivo. In summary, the present study suggesting that PON2 may be a promising therapeutic target for DEX-resistant ALL cells.
Supplemental Material
Download MS Word (90.9 KB)Disclosure statement
No potential conflict of interest was reported by the author(s).
References
- Wyatt KD, Bram RJ. Immunotherapy in pediatric B-cell acute lymphoblastic leukemia. Hum Immunol. 2019;80:400–408.
- Jasinski S, De Los Reyes FA, Yametti GC, et al. Immunotherapy in pediatric B-cell acute lymphoblastic leukemia: advances and ongoing challenges. Paediatr Drugs. 2020;22:485–499.
- Poulard C, Kim HN, Fang M, et al. Relapse-associated AURKB blunts the glucocorticoid sensitivity of B cell acute lymphoblastic leukemia. Proc Natl Acad Sci USA. 2019;116:3052–3061.
- Bhadri VA, Trahair TN, Lock RB. Glucocorticoid resistance in paediatric acute lymphoblastic leukaemia. J Paediatr Child Health. 2012;48:634–640.
- Toscan CE, Jing D, Mayoh C, et al. Reversal of glucocorticoid resistance in paediatric acute lymphoblastic leukaemia is dependent on restoring BIM expression. Br J Cancer. 2020;122:1769–1781.
- Bacchetti T, Salvolini E, Pompei V, et al. Paraoxonase-2: A potential biomarker for skin cancer aggressiveness. Eur J Clin Invest. 2020;51(5):e13452.
- Nagarajan A, Dogra SK, Sun L, et al. Paraoxonase 2 facilitates pancreatic cancer growth and metastasis by stimulating GLUT1-mediated glucose transport. Mol Cell. 2017;67:685–701. e686.
- Ross ME, Zhou X, Song G, et al. Classification of pediatric acute lymphoblastic leukemia by gene expression profiling. Blood. 2003;102:2951–2959.
- Kang H, Chen IM, Wilson CS, et al. Gene expression classifiers for relapse-free survival and minimal residual disease improve risk classification and outcome prediction in pediatric B-precursor acute lymphoblastic leukemia. Blood. 2010;115:1394–1405.
- Frank O, Brors B, Fabarius A, et al. Gene expression signature of primary imatinib-resistant chronic myeloid leukemia patients. Leukemia. 2006;20:1400–1407.
- Pise-Masison CA, Radonovich M, Mahieux R, et al. Transcription profile of cells infected with human T-cell leukemia virus type I compared with activated lymphocytes. Cancer Res. 2002;62:3562–3571.
- Pan L, Hong C, Chan LN, et al. PON2 subverts metabolic gatekeeper functions in B cells to promote leukemogenesis. Proc Natl Acad Sci U S A. 2021;118(7):e2016553118.
- Kruth KA, Fang M, Shelton DN, et al. Suppression of B-cell development genes is key to glucocorticoid efficacy in treatment of acute lymphoblastic leukemia. Blood. 2017;129:3000–3008.
- Wei G, Twomey D, Lamb J, et al. Gene expression-based chemical genomics identifies rapamycin as a modulator of MCL1 and glucocorticoid resistance. Cancer Cell. 2006;10:331–342.
- Accordi B, Galla L, Milani G, et al. AMPK inhibition enhances apoptosis in MLL-rearranged pediatric B-acute lymphoblastic leukemia cells. Leukemia. 2013;27:1019–1027.
- Yang J, Liu P, Ma D, et al. Glucocorticoid resistance induced by ANXA5 overexpression in B-cell acute lymphoblastic leukemia. Pediatr Hematol Oncol. 2021;38(1):36–48.
- Consolaro F, Ghaem-Maghami S, Bortolozzi R, et al. FOXO3a and posttranslational modifications mediate glucocorticoid sensitivity in B-ALL. Mol Cancer Res: MCR. 2015;13:1578–1590.
- Chougule RA, Shah K, Moharram SA, et al. Glucocorticoid-resistant B cell acute lymphoblastic leukemia displays receptor tyrosine kinase activation. NPJ Genom Med. 2019;4:7.
- Li J, Chen R, Yao QY, et al. Time-dependent pharmacokinetics of dexamethasone and its efficacy in human breast cancer xenograft mice: a semi-mechanism-based pharmacokinetic/pharmacodynamic model. Acta Pharmacol Sin. 2018;39:472–481.
- Bhadri VA, Cowley MJ, Kaplan W, et al. Evaluation of the NOD/SCID xenograft model for glucocorticoid-regulated gene expression in childhood B-cell precursor acute lymphoblastic leukemia. BMC Genomics. 2011;12:565.
- Richartz N, Duthil E, Ford A, et al. Targeting cyclooxygenase by indomethacin decelerates progression of acute lymphoblastic leukemia in a xenograft model. Blood Adv. 2019;3:3181–3190.
- Tissing WJ, Meijerink JP, Brinkhof B, et al. Glucocorticoid-induced glucocorticoid-receptor expression and promoter usage is not linked to glucocorticoid resistance in childhood ALL. Blood. 2006;108:1045–1049.
- Riml S, Schmidt S, Ausserlechner MJ, et al. Glucocorticoid receptor heterozygosity combined with lack of receptor auto-induction causes glucocorticoid resistance in jurkat acute lymphoblastic leukemia cells. Cell Death Differ. 2004;11(Suppl 1):S65–S72.
- Ramdas J, Liu W, Harmon JM. Glucocorticoid-induced cell death requires autoinduction of glucocorticoid receptor expression in human leukemic T cells. Cancer Res. 1999;59:1378–1385.
- Marke R, Havinga J, Cloos J, et al. Tumor suppressor IKZF1 mediates glucocorticoid resistance in B-cell precursor acute lymphoblastic leukemia. Leukemia. 2016;30:1599–1603.
- Terwilliger T, Abdul-Hay M. Acute lymphoblastic leukemia: a comprehensive review and 2017 update. Blood Cancer J. 2017;7:e577.
- Poulard C, Baulu E, Lee BH, et al. Increasing G9a automethylation sensitizes B acute lymphoblastic leukemia cells to glucocorticoid-induced death. Cell Death Dis. 2018;9:1038.
- Bortolozzi R, Mattiuzzo E, Trentin L, et al. Ribociclib, a Cdk4/Cdk6 kinase inhibitor, enhances glucocorticoid sensitivity in B-acute lymphoblastic leukemia (B-All). Biochem Pharmacol. 2018;153:230–241.
- Evangelisti C, Cappellini A, Oliveira M, et al. Phosphatidylinositol 3-kinase inhibition potentiates glucocorticoid response in B-cell acute lymphoblastic leukemia. J Cell Physiol. 2018;233:1796–1811.
- Bacchetti T, Ferretti G, Sahebkar A. The role of paraoxonase in cancer. Semin Cancer Biol. 2019;56:72–86.
- Campagna R, Bacchetti T, Salvolini E, et al. Paraoxonase-2 silencing enhances sensitivity of A375 melanoma cells to treatment with cisplatin. Antioxidants. 2020;9(12):1238.
- Chan LN, Chen Z, Braas D, et al. Metabolic gatekeeper function of B-lymphoid transcription factors. Nature. 2017;542:479–483.
- Liu T, Kishton RJ, Macintyre AN, et al. Glucose transporter 1-mediated glucose uptake is limiting for B-cell acute lymphoblastic leukemia anabolic metabolism and resistance to apoptosis. Cell Death Dis. 2014;5:e1470.